Abstract
This review examines the role of various bioelectrical signals in conjunction with artificial intelligence (AI) and analyzes how these signals are utilized in AI applications. The applications of electroencephalography (EEG), electroretinography (ERG), electromyography (EMG), electrooculography (EOG), and electrocardiography (ECG) in diagnostic and therapeutic systems are focused on. Signal processing techniques are discussed, and relevant studies that have utilized these signals in various clinical and research settings are highlighted. Advances in signal processing and classification methodologies powered by AI have significantly improved accuracy and efficiency in medical analysis. The integration of AI algorithms with bioelectrical signal processing for real-time monitoring and diagnosis, particularly in personalized medicine, is emphasized. AI-driven approaches are shown to have the potential to enhance diagnostic precision and improve patient outcomes. However, further research is needed to optimize these models for diverse clinical environments and fully exploit the interaction between bioelectrical signals and AI technologies.
Keywords:
bioelectrical signals; artificial intelligence (AI); signal processing; bioelectrical signal analysis; feature extraction; clinical applications; healthcare technology; electroencephalography (EEG); electroretinography (ERG); electromyography (EMG); electrooculography (EOG); electrocardiography (ECG) 1. Introduction
Biomedical signals, also referred to as biological signals, are the electrical, mechanical, or chemical manifestations produced by the human body. They provide valuable information about the state and functioning of internal organs and systems. Inherently linked to physiological activity, these signals have been the subject of interest in medical and clinical research for decades. They act as windows into the complexity of the human body, revealing specific patterns that reflect normal functioning or indicate possible abnormalities [1].
The human body generates numerous biological signals [2], each with complex and extensive research processes. In recent years, medical procedures that utilize biological signals have made significant advancements. The impact of using these signals to address various problems is steadily increasing. Figure 1 illustrates the bioelectrical signals that will be analyzed throughout the study.
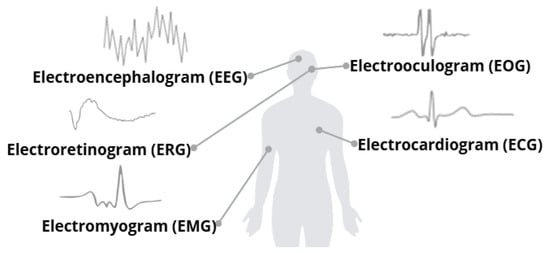
Figure 1.
Some biological signals and their visual representations. Adapted from [2].
Each biological signal has a distinct purpose and reflects specific physiological processes or activities of the human body. Despite their differences in origin and application, these signals share a fundamental characteristic: they are analyzed as functions of time [3].
This temporal analysis arises from their nonstationary nature, meaning that their properties are not constant over time but fluctuate dynamically in response to varying physiological or environmental conditions.
The nonstationary nature of biological signals poses several challenges in their analysis and interpretation, including the following:
- Temporal dependency
- Inter and Intra-individual variability
- Sensitivity to external noises
- Equipment and high technology requirements
- Challenges in Data Processing
These types of challenges complicate the extraction of meaningful features, as techniques designed for stationary signals often cannot capture the transient or evolutionary patterns inherent in these data. Additionally, each signal tends to vary depending on its source of extraction, which adds complexity. To address these limitations, it is necessary to employ advanced signal processing methodologies that can adapt to time-dependent changes, such as time-frequency analysis techniques. These methodologies require in-depth knowledge of signal processing to ensure proper analysis. Finally, biological signals are highly susceptible to inherent noise, which implies that both the acquisition technique and the type of technology used play a crucial role in obtaining high-quality signals and minimizing unwanted artifacts.
The use of AI-based methodologies is presented as a tool to overcome current barriers when working with biological signals. AI is a transformative force that is reshaping the interpretation and application of biological signals. The task of unraveling complex patterns, adapting to signal variability, and processing large amounts of data efficiently is solved by AI. AI is a branch of computer science, science, and technology that makes it possible to perform tasks by simulating human intelligence and developing intelligent machines and software [4]. These are divided into two subfields: Machine Learning (ML) and Deep Learning (DL) [5].
Each subfield has characteristics that make it ideal for specific tasks. Table 1 describes the main differences between these two subfields.

Table 1.
Differences between ML and DL [6,7].
Like all areas of study, AI has branches of interest. These branches depend on the need to be treated, and the applications or methodology to follow is essential to achieving practical results. ML can be categorized into two areas: supervised learning and unsupervised learning. Each branch has a distinct application and use; in supervised learning, known data are utilized, meaning both input characteristics and output labels are included.
On the contrary, the output data are unknown in unsupervised learning, i.e., we work with the data to find similarity patterns.
For selected articles in this review, it is essential to prioritize those directly addressing the interaction between standard bioelectrical signals and AI techniques. However, it is also necessary to include papers that explore less conventional signals to compare the advances achieved in both types of signals. This approach will allow an assessment of how AI has been applied and how its effectiveness varies according to the type of signal used. A key aspect in selecting studies is that while standard signals are well studied, less frequent signals remain a less explored field of opportunity. By including these articles, it will not only be possible to compare advances in the processing and analysis of widely used signals with those of less developed signals, but also to highlight areas with the most significant opportunities for improvement and innovation. This highlights the need to continue developing and refining AI techniques for these less common signal types. This field still lacks as much comparative and in-depth work as more traditional signals.
This review highlights the transformative role of AI in analyzing bioelectrical signals and its applications in clinical practice and medical research. It provides an overview of how AI enhances the interpretation, diagnosis, and treatment of medical conditions based on these signals. The focus is on applying AI techniques to individual bioelectrical signal modalities, emphasizing their unique processing requirements and integration strategies. While exploring hybrid or multimodal architectures for multiple signals is a promising research direction, it falls outside the scope of this study.
2. Bioelectrical Signals
The human body generates bioelectrical signals that provide essential information about the electrical composition and functional activity of the organs. These signals are the result of the electrical activity of our cells, which can generate and transmit electrical currents. Although the generation of bioelectrical signals in the various organs of the body follows a fundamentally similar process based on cellular electrical activity, each physiological system has unique characteristics. Therefore, these signals are given specific names depending on the organ from which they originate, the nature of the cells involved, how electrical impulses are generated and transmitted, as well as the physiological factors that influence their behavior. While some signals reflect rhythmic patterns associated with the conduction of impulses in specific tissues, others capture responses to external or internal stimuli, measuring variations in the electrical potential of specialized cell membranes. Thus, the recording of these signals enables the evaluation of various physiological processes, ranging from the rhythmic activity of organs to responses to movements or sensory stimuli, providing crucial information for the analysis and diagnosis of different body functions [8].
When a bioelectrical signal is extracted, additional processing is necessary to achieve satisfactory results for its intended use. This is due to the presence of noise. In general, noise can be divided into two groups: the first comprises those produced by external sources, which are found in the surroundings or environment. The second is from internal sources or sources specific to the system, such as the electrode, involuntary movements, adjacent muscles, etc. [9]. The most common types of interference between different bioelectrical signals are described below.
- Baseline drift: This type of interference refers to a phenomenon in which the signal baseline, i.e., the reference zero level, shows slow variations or fluctuations over time. It is caused by the movement of the electrodes during signal acquisition, variations in the user’s skin impedance, or environmental factors [10,11].
- Power line interference: This type of interference appears as periodic noise at the power line frequency, typically 50 Hz or 60 Hz. Its main characteristic is its constant presence during signal acquisition, which may affect the quality of the recorded data [10,12].
- Muscle artifacts: These interferences, or unwanted signals, appear during signal recording and originate from the electrical activity of the muscles. They are mostly involuntary due to nearby muscle contractions [10,13].
- Electrode noise: The quality of the electrodes used for signal acquisition is of utmost importance since the interference generated by them can be significant during data recording. Factors such as inadequate skin contact and electrode polarization are common causes of this type of interference [10,14].
- Environmental noise: This type of interference originates from external sources, typically related to everyday phenomena such as mechanical vibrations, acoustic noise, nearby electronic equipment, and changes in environmental conditions, including temperature and humidity [10,15].
In addition to the inherent limitations that cannot be corrected for individual subject factors, it is crucial to understand the characteristics and performance of the signal to develop specific methodologies to optimize its quality. This is essential for mitigating interference and noise in the signal, which in turn facilitates obtaining accurate and consistent results applicable to the particular nature of the investigation.
3. Electroencephalogram (EEG)
An electroencephalogram (EEG) is a signal that measures and records the brain’s electrical activity. This signal detects electrical signals generated by neurons during their communication activities. Variations in these signals can provide crucial information about brain function and the presence of abnormalities [16,17,18]. These signals obtained are essential for diagnosing cognitive diseases, such as ADHD and Autism, among others [19,20]. Additionally, they are also crucial for identifying neurological issues, including epilepsy and sleep disorders [21,22,23]. The EEG, in addition to its medical diagnostic applications, is a fundamental tool in neuroscientific research.
The EEG is generated by placing small electrodes on the patient’s scalp. These electrodes detect electrical fluctuations that occur when neurons communicate with each other. These signals are extremely small, typically in the microvolt range, and require amplification to be appropriately analyzed. The electrodes are placed following a standard “10–20” system, ensuring uniform coverage of all essential brain areas. The collected signals are amplified and recorded in an EEG machine, where they can be displayed as waves [22,24].
As shown in Figure 2, the EEG records the electrical activity of the brain in the form of waves, which are classified according to their frequency: these include the delta, theta, alpha, beta, and gamma signals. Each wave is associated with different brain states, functions, and activities [19,25].
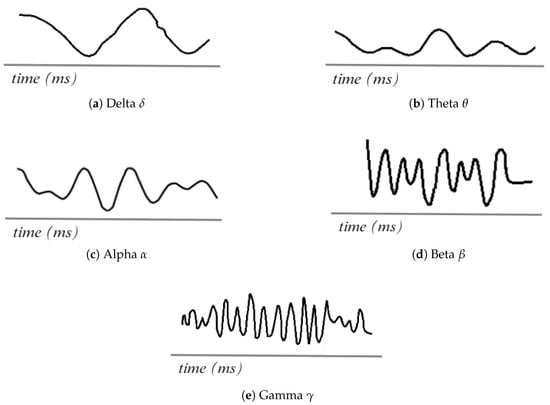
Figure 2.
EEG waveforms. Adapted from [26].
3.1. Signal Processing Techniques
Correct signal processing plays a crucial role in developing research focused on solving specific problems by leveraging AI models to analyze brain activity. The vast array of activities that can be determined through brain activity, depending on the objective, is the methodology proposed in the work, which plays a key role.
As shown by Eldele [27], which was used for classifying sleep stages, a methodology based on deep learning models using attention mechanisms is proposed. A single channel was utilized. To work effectively with it, the data were normalized to ensure standardization, and data augmentation techniques were employed to enhance the model’s robustness. This process allows for more accurate classification.
Using an approach for stroke prediction, Islam [28] included several stages to improve data quality, where a filter was used for the 60Hz signals generated by alternating current. Independent Component Analysis (ICA) was used to separate the signals based on their origin, i.e., whether they were caused by eye movements or muscle activity. Then, a bandpass filter was applied to define the brain frequency window (0.5–44 Hz). Before passing the data to ML models, the Fast Fourier Transform (FFT) and Welch methods were used to calculate features such as potential spectral density (PSD).
Chakravarthi [29] employed techniques that decomposed the signal into different frequency bands to identify the channels used. Once the frequency bands were identified, the signal was normalized using a standard normalization method to focus on the desired signals. A bandpass cut-off filter was used. Afterward, an advanced technique for feature extraction, such as MFCC (Mel Frequency Cepstral Coefficients), was employed to obtain the spectral parameters and sample entropy, which were used to evaluate the complexity of the signals and characterize the stability over time of the signal. The Hurst exponent was also utilized. Finally, a hybrid model is created by combining a Convolutional Neural Network (CNN), a Long Short-Term Memory (LSTM), and a Residual Network 152 (ResNet 152).
Research conducted by De Miras [30] used brain activity to determine a significant disease such as schizophrenia; the process consisted of participants watching a screen with a cross for 3 min without being able to move, talk, or be distracted; the data were processed with custom MATLAB R2024b functions; once the data were processed, the ICA method was applied to extract unwanted activities such as blinking, noise induced by hair, and other frequencies that are not desired in the research.
Table 2 provides a summary of the work previously explained, facilitating a comparison of the tasks undertaken and the key aspects achieved.
Table 2.
Comparison of EEG Signal Processing Methods.
3.2. Applications with AI
AI is increasingly present in the medical sector, thanks to significant advances in analyzing EEG signals, particularly in the diagnosis and classification of neurological disorders.
Analyzing the research of Borde [31], who propose a methodology based on LSTM, which is a type of recurrent neural networks (RNN) for the classification of sleep disorders in different subjects using EEG signals from ten electrodes within their contributions, an optimization was performed using classifier trees in which the channels are selected to reduce the computational cost without compromising accuracy. Following this approach, an accuracy of 99.8% was achieved. Developing their own LSTM network may introduce bias, as it is adapted to their specific data, potentially leading to a generalization problem when testing the model on different databases. Likewise, another important limitation is the fact that even though RNNs offer fast and efficient signal processing, they can cause problems in generalization. Therefore, these are considerations to be taken into account. Therefore, the primary limitation of the work is the need for robust validation of the model using data outside their database.
A study that presents a different approach to working with the signals is the one conducted by Klepl [32], in which they used graphical neural networks (GNN) to classify patients with Alzheimer’s Disease (AD) through functional connectivity (FC) of the graphs generated by the signals and the frequency bands of the five signals () were calculated, thanks to this approach it is possible to highlight the use of graphs based on FC and GNN as an alternative tool to the classification of neurodegenerative diseases given the complexity of the analysis in EEG signals. The primary challenge in the research is that the computational capacity required to replicate it is exceptionally high due to the processing and analysis of complex graphs, as well as the development of its neural network.
Another critical area in medicine is the pediatric sector, in which the research of Gao [33]. They introduce a CNN specifically designed to capture multiscale features that consist of using different types of kernel in addition to dilated convolutions that strengthen the adaptability of the network with the signals capturing temporal and spatial characteristics for the prediction of pediatric seizures, demonstrating the ability of AI to address specific medical problems such as prediction when processing EEG signals. By generating their architectures, researchers leave the interpretation of the results highly subjective, as these are considered “black boxes”, creating a gap between the medical field and AI. Another limitation of the research is the lack of validation and testing of their models using non-proprietary data, which hinders the generalization of the network.
Attallah [34] presents an AI-based system for detecting Attention Deficit Hyperactivity Disorder (ADHD) in children in his work. The study is distinguished by the innovative application of feature selection algorithms that leverage the inherent characteristics of the data in the classification process, thereby reducing dimensionality without compromising the model’s accuracy. As a final model, the author implements a Support Vector Machine (SVM) as a classifier, as it allows for the accurate analysis and detection of patterns associated with ADHD. The work demonstrates that integrating AI-aided multiresolution analysis and feature selection can be effectively applied to solve medical diagnostic problems. The work presents Machine Learning classifiers that may present a limitation, unlike modern Deep Learning models, which can detect more details and can serve as improvements to strengthen the model.
Table 3 presents the main characteristics of the work performed, including the databases used and the results of the evaluation metrics implemented.
Table 3.
Comparison of AI Models in EEG Signal Research.
4. Electroretinogram (ERG)
The electroretinogram (ERG) is a signal that evaluates the electrical activity generated by retinal cells in response to visual stimuli [37,38]. ERG evaluates the functional state of the retina, allowing the analysis of retinal diseases and dysfunctions. It records the retina’s electrical activity in response to light stimuli. The retina, the light-sensitive layer of the eye, contains photoreceptor cells called rods and cones. These cells are essential for analyzing the eye’s behavior in response to visual stimuli, as they are responsible for generating the specific electrical signals that reflect its response [39]. The ERG is extracted using one active and one reference electrode. The active electrode is placed in contact with the cornea or in its proximity and is responsible for recording the electrical activity generated by the retina. On the other hand, the reference electrode is placed in a nearby location, such as on the skin of the face, to complete the electrical circuit and allow a proper recording [40,41].
Figure 3 describes an ERG signal. The main waves, such as the A-wave, represent the initial hyperpolarization of the photoreceptors in response to the light stimulus. This is described as a negative wave. The B-wave is generated due to the transmission of signals from the photoreceptors to the inner layers of the retina. It is also described as a positive signal. In addition to other complementary waves, such as the C-wave, which appears to be a late response in the ERG, oscillatory waves can also be observed in certain protocols related to the activity of other cells and providing additional information on the function of the inner retinal layers [42,43].
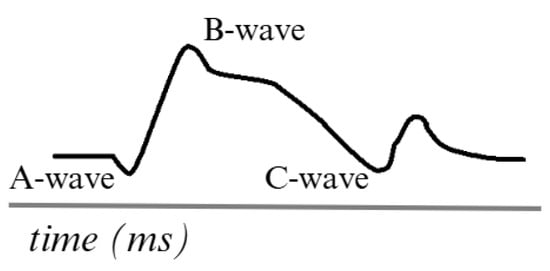
Figure 3.
Simulation of an ERG signal. Adapted from [44].
4.1. Signal Processing Techniques
Today, significant contributions have been made to the processing of ERG signals, as they cannot be used in their raw form for specific tasks due to their inherent nature. ERG signals are complex and can be contaminated by various artifacts, making their direct analysis difficult in many applications.
For example, Barraco [45] obtained significant results in signal processing using principal component analysis (PCA) to evaluate its effectiveness in detecting healthy and affected patients with congenital achromatopsia (ACHM) and congenital X-linked stationary night blindness (CSNB). Their study investigated the potential for extracting distinctive features that characterize three types of traces through multivariate analysis. The methodology consistently clustered the features of CSNB patients. However, it failed to separate the features of patients with ACHM from those of healthy patients. Barraco, in [46], performed a study on the A-wave of the ERG signal using wavelet analysis. For this purpose, they selected a set of ERG signals from healthy subjects. They applied this methodology to identify and analyze the frequency components of the photoreceptor response under different luminance conditions. Through this analysis, they detected three frequency components in the range of 20 to 200 Hz, with the lowest frequency corresponding to the combined activity of the photoreceptors. The other, weaker frequencies showed variations in their presence as a function of luminance.
Albasu [47] feature extraction and classification of these signals. They implemented different combinations of window functions, window sizes, and overlaps to generate spectrograms, which are visual representations of how signal frequencies change with time. These spectrograms were used to train DL models and perform manual feature extraction, which fed ML models.
Yamashita [48] presents a significant advance in ERG signal processing by introducing a new system that utilizes skin electrodes. In the system, the electrical responses of both eyes are recorded simultaneously during stimulation of one eye. The signal from the unstimulated eye is then subtracted from the signal from the stimulated eye. This process enables the cancellation of coherent biological and electrical noise affecting both electrodes, thereby significantly reducing noise in the recordings. They showed that the noise level was significantly reduced by applying this subtraction method.
These techniques not only facilitate the identification of patterns associated with various pathological conditions but also optimize diagnosis and research in the field of retinal function, paving the way for applications based on ERG signal processing.
Different methodologies are applied to each of the processing methods. It is essential to consider the objective for which the signal will be used. Table 4 summarizes the methods described in the preceding section.
Table 4.
Comparison of ERG Signal Processing Methods.
4.2. Applications with AI
As we have seen, the inner layer of the eye comprises multiple components, each with distinct functions. The deterioration or loss of these components affects not only people’s quality of life but also their daily lives and, therefore, their economy. The lack of timely diagnosis and treatment of retinal diseases can have irreversible consequences, including total vision loss. This is why various methodologies have been developed to utilize ERG signals more effectively, adapt them to current technological processes, and ultimately provide tools to create new, more precise, and effective diagnostic and treatment strategies.
Kulyabin [49] conducted a study using deep learning (DL) to analyze ERG signals converted into scalograms via Continuous Wavelet Transform (CWT) for diagnosing retinal diseases, specifically retinal dystrophy. They employed five DL models (VGG-16, ResNet-50, DenseNet-121, ResNext-50, and Vision Transformer) to classify ERG signals. The study also compared different mother wavelets (Complex Gaussian, Gaussian, Ricker, Morlet, and Shannon) for signal conversion. The models were evaluated using five-fold cross-validation, with the highest classification accuracy achieved using the Vision Transformer combined with the Ricker mother wavelet. The results showed mean classification accuracies of 83%, 85%, and 88% for the three light stimuli tested.
The study emphasizes the need for expanding ERG databases with synthetic data to enhance model performance. However, there are several limitations. The exclusive use of the Tomey EP-1000 for ERG recording may limit the generalizability of the results due to potential variations in signal acquisition across different devices. Additionally, the study protocol, which is based on three specific ERG recording types (Maximal 2.0, Scotopic 2.0, and Photopic 2.0), may be sensitive to changes in stimulus parameters, potentially affecting model accuracy. The dataset, which includes both healthy subjects and those with retinal dystrophy, is optimized for detecting this particular condition, limiting its application to other ocular disorders. The relatively small dataset, especially for the Transformer model, may hinder accuracy due to insufficient data diversity. Furthermore, technical factors such as noise and involuntary eye movement can affect signal quality, impacting the model’s performance. These limitations should be considered when interpreting the results for clinical application.
Additionally, models such as EfficientNet with Feature Pyramid Networks (FPN) [50] and DeepLab v3 [51] have demonstrated promising results across various domains. However, they have not yet been applied to bioelectrical signals; however, they are relevant for their potential application, given their focus on efficient feature extraction and segmentation of complex data. EfficientNet-FPN, with its ability to capture subtle variations at multiple scales, and DeepLab v3, specialized in accurate pattern detection in large volumes of data, could optimize the identification of anomalies in signals such as ECG or EEG. Evaluating their performance in this context would allow us to explore improvements in diagnostic accuracy and automation of bioelectrical signal analysis.
A constant problem in projects involving bioelectrical signals is the lack of data, as seen in previous sections, where a large number of data is necessary to achieve the objective. Therefore, Kulyabin [52] used AI to augment ERG data from male patients exposed to two light stimuli (LA3 and 30 Hz LA3 flicker) via a conditional generative adversarial network (CGAN). The study involved 68 participants with no ocular or neurodevelopmental disorders, and they had refractive errors ranging from −6.00 D to +2.00 D. Initially, the dataset was predominantly female, limiting model generalization for men. Classification accuracy improved by generating synthetic data equivalent to 20% of the real dataset and enhancing signal quality through Fourier processing. Using a Random Forest classifier, balanced accuracy increased from 71.4% to 78.5% and precision from 63.6% to 71% for the first stimulus. In contrast, balanced accuracy rose from 72.4% to 82.5% for the second stimulus and precision from 71.9% to 80.9%.
Key limitations include discrepancies between synthetic and natural waveforms, spectral differences from recording instruments, and dataset size constraints. The authors suggest expanding sample sizes and promoting open data sharing to enhance the reliability of synthetic data in clinical applications.
Posada [53] explore the potential of ERG for detecting Autism Spectrum Disorder (ASD) by analyzing ERG signals from both eyes of 217 subjects (71 with ASD and 146 controls) in response to 113 and 446 troland-second (Td-s) light stimuli. They applied variable frequency complex demodulation (VFCDM) to decompose the signals and extract relevant features. The study aimed to identify reliable biomarkers for ASD. It achieved an area under the curve (AUC) of up to 0.92, with sensitivities of 85% and specificities of up to 79%, demonstrating ERG with VFCDM as a promising approach for ASD detection.
However, the study presents several key limitations. First, it focused exclusively on individuals with a single diagnosis of ASD, limiting the understanding of how these findings would apply to individuals with comorbidities, such as Attention Deficit Hyperactivity Disorder (ADHD). Additionally, the study did not deeply analyze the diversity of the sample in terms of demographic background and individual characteristics, which could influence the variability in the ERG responses. Data collection was also subject to external factors, such as emotional state and environmental conditions, which could affect the reliability of the measurements. Validation in larger populations is crucial, as machine learning models require confirmation of their generalizability and effectiveness in clinical practice. Finally, the study suggests that a larger sample size could enhance the robustness of the findings and facilitate more complex analyses, underscoring the importance of continued exploration and refinement of diagnostic techniques for ASD.
These works demonstrate the potential of ERG signals to accelerate processes in the medical field. However, it is evident that these projects are continually evolving, adapting to new technologies based on AI. Table 5 summarizes the work previously described, highlighting the approach and results obtained by each researcher.
Table 5.
Comparison of AI Models in ERG Signal Research.
5. Electromyogram (EMG)
The Electromyogram (EMG) is a signal that describes the electrical activity produced in the muscles responsible for executing body movements such as walking, moving the arms, or even expressing facial emotions [54,55].
Electromyography is a technique used to record electrical signals directly from the muscle involved in the movement being analyzed. This method consists of placing electrodes on the skin or inserting a needle into the target muscle or muscles to capture the electrical activity generated [56]. In practice, the use of multiple channels (represented by electrodes) in analyzing EMG signals is crucial for achieving a more detailed and accurate representation of muscle activity. Each channel records the activity of a specific region of a muscle or muscle group, and the combined use of multiple channels enables the capture of the inherent complexity of these signals [57].
EMG signals are based on motor unit action potentials (MUAPs), which are the electrical responses generated by the activation of a motor unit. A motor unit consists of a motor neuron and all the muscle fibers it innervates. When the motor neuron sends a nerve impulse, the associated muscle fibers contract, generating the electrical potential.
Figure 4 shows the simulation of an EMG signal generated using surface electrodes, which are currently the most commonly used in research testing. The frequency ranges of EMG signals vary between 0.01 Hz and 10 kHz, depending on the type of recording (surface or intramuscular). However, the most useful and relevant frequencies for analysis are typically 50 to 150 Hz [58,59].
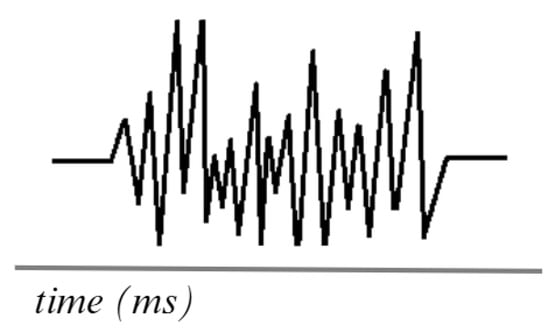
Figure 4.
Simulation of an EMG signal. Adapted from [60].
5.1. Signal Processing Techniques
Like other bioelectrical signals, EMG signals require a processing step to achieve an optimal signal for research purposes. Based on MUAPs, Loudon [61] developed an automated method for processing EMG signals, aiming to extract features more efficiently and accurately. Using an approach that includes data collection, application of filters to remove noise, and classification of, as a result they were able to improve the representation of motor unit activity under muscle contraction conditions.
Zhang [62] researched the use of Wavelet Transform (WT) for EMG signal processing, focusing on denoising and feature extraction. Using a model that incorporates white Gaussian noise, they implement a denoising methodology that effectively separates useful signals from noise, thereby achieving an accurate reconstruction of EMG signals.
Sadikoglu [63] implemented a systematic approach to reduce noise and improve signal-to-noise ratio (SNR). This included the use of filters such as the Savitzky–Golay filter, which allows smoothing the signals without distorting their essential characteristics, and then employing spectral analysis methods, such as the FFT, transforming the signals from the time domain to the frequency domain, which facilitated the identification of relevant patterns and features in the EMG signals. In addition, decomposition techniques such as WT were used, which allows the analysis of signals at different scales and times, providing a richer representation of variations in muscle activity.
Andrade [64] implemented Empirical Mode Decomposition (EMD) for offline analysis of EMG signals. The authors performed a comparative study between the EMD method and a wavelet-based algorithm, demonstrating that both approaches achieved a significant reduction of background noise while preserving the energy of the useful signal. The EMD technique is effective for filtering EMG signals, which is beneficial for applications that require better information selection, such as the identification of individual motor unit action potentials.
Pasinetti [65] presents an algorithm designed to improve EMG signal processing. The algorithm’s approach is based on the use of advanced statistical techniques that enable the establishment of an activation threshold without requiring measurements of maximal voluntary contraction or a relaxed state, eliminating the reliance on procedures that may be cumbersome or inaccurate for certain patients.
Table 6 describes the processing previously described. Adequate processing is crucial for the correct application of EMG signals. The proposed tools have yielded optimal results, serving as a foundational basis for research integrating AI.
Table 6.
Comparison of EMG Signal Processing Methods.
5.2. Applications with AI
Using the EMG signal, it is possible to evaluate and diagnose various neuromuscular disorders and monitor muscle activity during rehabilitation. However, its implementation faces significant challenges, with ongoing research aimed at harnessing the powerful capacity of the signal for various applications. As carried out by the authors Dawei, H. and Badong, Ch. [66] explore the classification of EMG signals converted into spectrograms to recognize hand movements from the Ninapro 2 database, which includes records from 40 subjects performing 49 different gestures. The dataset is divided into three exercises: 17 basic movements, 23 functional movements simulating daily life tasks, and 9 force patterns for measuring force application. Data were collected using 12 surface electrodes at a sampling rate of 2 kHz. The authors employed CNN to extract features from the converted signals and LSTM to capture frequency dependencies over time, improving accuracy from 77.167% to 79.329%. However, variability in individual electromyographic responses may affect the reproducibility of results across different subjects, thereby limiting the generalizability of findings. Furthermore, the model’s performance is influenced by the quality and quantity of training data, particularly for less-represented movements in the dataset.
Liang [67] improved prosthetic control by classifying EMG signals using the publicly available GRABMyo dataset, which comprises 43 healthy participants performing 16 gestures. They employed the Discrete Wavelet Transform (DWT) for signal processing to decompose signals into different frequencies, thereby facilitating feature extraction. Linear Discriminant Analysis (LDA) and PCA were compared to determine the most effective feature extraction method. Several classification algorithms, including KNN, Naive Bayes (NB), and SVM, were evaluated. The combination of LDA for feature extraction and SVM for classification achieved the best accuracy of 90.69% using data from three sessions, compared to 86.98% from a single session. However, despite achieving good results, certain points were not considered. For example, only five specific gestures were analyzed, despite the GRABMyo dataset containing 16 gestures, which limits the variety of movements examined. Additionally, the study relied solely on EMG signals from the forearm without considering the relationship between brain activity and muscle activity, which could provide a more comprehensive understanding of movement control. Finally, the communication system used is half-duplex, which restricts transmission to one direction at a time, highlighting the need to explore bidirectional communication capabilities to enhance user-device interaction and feedback.
Following a similar methodology, Fuad [68] employed KNN and SVM for classifying four movements to control a robotic arm using EMG signals. The methodology involved data acquisition at 200 Hz, signal preprocessing, feature extraction, and muscle activation detection using a single threshold system. The results showed that the KNN classifier achieved 88.58% accuracy, the SVM achieved 92.24%, and a hybrid method combining both classifiers reached 95.398%. The authors emphasize the importance of efficient classifiers for bioelectrical signals in improving the quality of life for patients. However, the study has several limitations. The high cost of advanced prosthetics limits accessibility, creating a gap between those who can afford sophisticated technology and those who cannot. While lower-cost prosthetics are available, they generally lack the precision and functionality of more expensive models, limiting their utility for performing complex gestures.
EMG signals can also be utilized in the rehabilitation field, as demonstrated by Mokri [69] presents a procedure for estimating muscle strength during knee rehabilitation using EMG signals and a support vector regression (SVR) model optimized with a genetic algorithm (SVR-GA). The study was conducted with five healthy participants, during which EMG signals were recorded while performing specific exercises. The metrics obtained include a coefficient of determination of 98.89% for the first subject (S1), demonstrating a high correlation between the strength estimates and real data. Additionally, the root mean square error (RMSE) for S1 was 0.0385, indicating a low discrepancy between the predicted and actual measurements. The authors emphasize that the figures obtained not only overcome the limitations of traditional measurement methods but also offer dynamic and adaptive monitoring of patient progress. This capability enables the customization of rehabilitation programs, ultimately leading to improved clinical outcomes. However, the study presents limitations. Firstly, the small sample size of only five participants may limit the generalizability of the results and restrict the applicability of learning-based methods, such as deep neural networks, in broader clinical settings. Moreover, the EMG data collection was performed offline, limiting the ability to estimate muscle strength in real time. The authors plan to address these limitations by recruiting more volunteers and optimizing the system to enable online EMG data collection in future work.
One of the primary challenges is the scarcity of non-ideal data to evaluate new AI-related alternatives. However, there are also works focused on the creation of databases using new tools, which decrease certain artifacts related to signal acquisition, as in the case of Ramírez [70], who developed a methodology for the acquisition of EMG signals using the Myo Armband bracelet, the authors describe that in addition to mitigating the problems present in the traditional electrode cables, a software called “EMGSC” is implemented for the reduction of line noise using a notch filter at the time of acquiring the data. The software also includes a tutorial on performing user movements correctly. In addition to post-processing, the WT Daubechies 4 (db4) was applied. The authors note that the methodology yields effective results in extracting characteristics related to signals obtained using traditional methods.
Luna Quiñones [71] presents a CNN proposal for classifying EMG signals using the database created in [70]. The author mentions that the database works effectively when using DL-based models, as he not only utilizes the raw data but also applies the WT-based filtering technique to mitigate signal noise. Obtaining a sensitivity of 95.26% and a specificity of 99.37% indicates a high overall performance of the model, also demonstrating the functionality of the database using a different methodology compared to traditional methods for obtaining EMG signals.
One of the main problems obtained when working with the dataset presented in [70,71] is the lack of diversity in the patients involved since, despite a considerable number of participants, aspects such as the subject’s lifestyle and chronic diseases, among other elements, were not considered.
Contributions using EMG signals are constantly evolving, as most studies do not include patient populations with compromised health conditions. This represents an opportunity to develop methodologies based on signals from subjects with amputations, degenerative diseases, and other conditions. A summary of the work mentioned above is presented in Table 7.
Table 7.
Comparison of AI Models in EMG Signal Research.
6. Electrooculogram (EOG)
The electrooculogram (EOG) is a signal that records the electrical activity generated by eye movements, specifically due to the ocular dipole, which is related to the potential differences between the cornea and the retina. The detection of eye movements is based on the changes in these electrical potentials generated by the displacement of the eyeball. Like the EMG signal, the EOG results from the generation of electrical potentials; however, its origin is not in muscle activity but in the movement of the ocular dipole [72].
An example of an EOG signal is shown in Figure 5. The waves in an EOG signal tend to differ due to the various eye movements that occur. However, when the signal is recorded, these waves are analyzed in a unified form. Obtain global eye movement information using a 1 to 50 Hz frequency range [73].
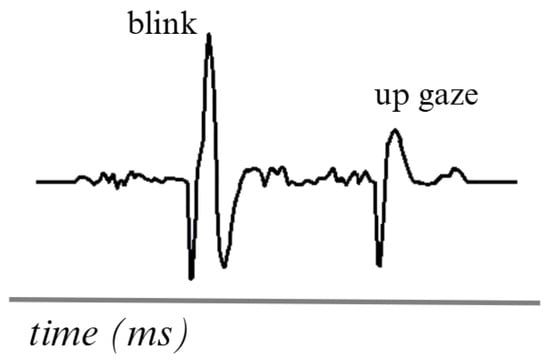
Figure 5.
Simulation of two movements in an EOG signal. Adapted from [74].
6.1. Signal Processing Techniques
The signal obtained from EOG tends to be complicated to work with, primarily due to the differences between movements and the variance between subjects. However, methodologies have been proposed to process the signals using the most important events optimally.
Merino [75] proposed the application of a bandpass filter to eliminate high-frequency components and an average filter to reduce the noise of the EOG signal. They also present the calculation of the signal’s derivative to detect the initial and final edges of the eye movements. The presentation of this work leads to more advanced developments to reduce the limitations present in EOG signals.
Lopez [76] performed EOG signal processing to classify eye movement direction, implementing an approach combining DWT for noise removal. This process began with the collection of EOG data from six healthy participants, where preprocessing techniques were applied to enhance signal quality, resulting in an SNR of approximately 30 dB, which indicates a significant improvement in signal clarity.
He [77] presents a methodology based on feature extraction by combining processing stages. First, the eye response associated with blinking is captured using a segment of the EOG signal consisting of 100 sampling points. The signal segments are then extracted by applying a bandpass filter in the 0.1 to 30 Hz range, eliminating high-frequency noise. The authors mention that the segmentation process before applying processing allows the quality of the signal to be taken advantage of since it works with short periods, emphasizing those details that are not perceptible in a raw EOG signal.
Table 8 summarizes the processing applied in the different approaches using EOG signals. Due to its complexity, the EOG signal requires detailed processing, and each technique described proposes different methodologies. However, all of them can be adapted as an introductory basis for AI applications.
Table 8.
Comparison of EOG Signal Processing Methods.
6.2. Applications with AI
The EOG signal is currently utilized in the technology field to help individuals with limitations enhance their quality of life using assistive devices. However, work has also been proposed to utilize EOG signals to support medical diagnosis, as in the case of Zhu [78], who developed a drowsiness detection model using CNN and EOG signals to improve the identification of fatigue states. To this end, they collected EOG data from 22 participants during an experiment lasting approximately 70 min, recording a total of 22 sessions. Inclusion and exclusion criteria were applied to select subjects, ensuring that only those showing distinct signs of fatigue were considered in the analysis. Signals were preprocessed by denoising and bandpass filtering before being fed into the CNN, which was trained using a convolutional autoencoder in unsupervised learning. The model, comprising two convolutional layers and a max-pooling layer, was optimized to minimize overfitting and enhance the extraction of relevant features associated with drowsiness. To evaluate the model performance, a leave-one-out cross-validation was implemented, ensuring a rigorous evaluation. The results showed an average correlation coefficient of 0.73, exceeding the 0.70 achieved by traditional statistical methods, indicating a higher predictive capacity. Additionally, the CNN model exhibited a lower standard deviation in its predictions, which reinforces its stability and accuracy in detecting drowsiness.
AI is increasingly being used to support individuals with limitations, as described by Pérez-Reynoso [79]. In their research, they developed a human-machine interface (HMI) system that utilizes EOG signals to enable people with severe disabilities to control an omnidirectional robot using their eye movements. To evaluate the system’s performance, the authors designed three game boards, where each black square represented a penalty, and white squares were valid areas for robot movement. Over 30 test repetitions, users reduced their response time by 76.9% on board 2, 75.4% on board 1, and 71.1% on board 3, achieving zero penalties, indicating adequate mastery of robot control. The study presents an individualized dataset of EOG signals obtained from each participant, enabling personalized classification of eye movements, including blinks and gaze directions (right, left, up, and down). This approach is crucial because each user can exhibit unique characteristics in their EOG signals, which can affect the accuracy of the classification model. A cross-validation method was implemented to ensure the system’s effectiveness, ensuring a proportional distribution of data classes in each partition and contributing to the model’s robustness and adaptability to variations in user signals. The results showed that the sensitivity and accuracy of the MLP classifier were approximately 0.755, which correlates with a reduced learning time. The authors emphasize that the HMI system effectively classifies EOG signals and adapts to individual user characteristics, facilitating its use and improving interaction with assistive devices in everyday life.
Lee [80] presents a real-time eye-writing recognition system that utilizes EOG as its core technology. The main objective of this research is to provide a new form of communication and control for people with motor disabilities, such as those with locked-in syndrome, where the ability to communicate is minimal. To this end, EOG signals were recorded as users wrote a series of predefined symbols using voluntary eye movements, allowing for the real-time reconstruction of the written strokes. The experiment results were promising, with an average recognition rate of 87.38% for 29 symbolic patterns, including 26 lowercase characters and three functional patterns representing the Space, Backspace, and Enter keys. In some cases, the system reached a maximum score of 97.81%, demonstrating its effectiveness and robustness. The authors also note that all but one participant achieved accuracy and recall above 75%, indicating that the system can effectively handle variability in eye movements.
Another significant contribution demonstrating how using the EOG signal positively impacts research that considers everyday tasks is described by authors Ileri [81], who developed a method for diagnosing dyslexia using EOG signals and a CNN-based classifier. To conduct the research, they prepared 28 Turkish texts selected from textbooks, using varied typefaces and font sizes to assess their impact on reading. The participants, who were children, read the texts on a monitor while simultaneously recording EOG signals. This approach was implemented to obtain a more objective and accurate assessment of dyslexia, as traditional methods are often subjective and may not accurately reflect reading difficulties. The results achieved a classification accuracy of 98.70% for horizontal EOG cues and 80.94% for vertical EOG cues, indicating that using multiple texts and combining EOG cues in different directions significantly improved the detection of patterns associated with dyslexia.
Research that proposes an alternative method to use information provided by the eyes is the one elaborated by García [82], who developed a model that uses performance data and eye tracking as input values for the classification of the level of attention of people; these values were obtained by performing a specific test called Adult Development Eye Movement Test (ADEM) [83], they developed a model based on ANN for the classification of the information obtained, obtaining an accuracy of 92.6%. The results underscore the importance of integrating AI methodologies to offer alternative solutions to existing methods, yielding promising results.
Table 9 summarizes the work with EOG signals, allowing a direct comparison between the proposed approaches and their specific applications.
Table 9.
Comparison of AI Models in EOG Signal Research.
AI is proposed as a solution to everyday problems; however, it also demonstrates that it is constantly evolving. The use of EOG signals provides valuable information for various applications that could benefit from being combined with other bioelectrical signals, which could help reduce the difficulties the authors have faced so far.
7. Electrocardiogram (ECG)
An electrocardiogram (ECG) is a signal that represents the heart’s electrical activity. It measures variations in the electrical potential generated by the heart during its contraction and relaxation cycle. These variations are represented on an electrocardiogram graph, which provides valuable information about heart rhythm and function [84,85].
The ECG is generated by placing electrodes on the patient’s skin in specific locations on the chest, arms, and legs. These electrodes detect the electrical signals produced by the heart. The electrodes are connected to an ECG device that amplifies and records these signals. The heart’s electrical impulses are generated in the sinoatrial node, propagate through the cardiac conduction system, and are detected by electrodes, which record the activity as waves. The most ordinary waves on an ECG include the P wave, the QRS complex, and the T wave, each representing different phases of the cardiac cycle [86].
Figure 6 is a visual representation of the ECG, comprising five distinct signals. The PQRST signals represent the primary waves and segments that reflect the heart’s electrical activity during each cardiac cycle. This electrical flow enables the coordinated contraction and relaxation of the heart during blood pumping. This analysis detects abnormalities, such as arrhythmias, ischemia, and infarction, among others [87,88].
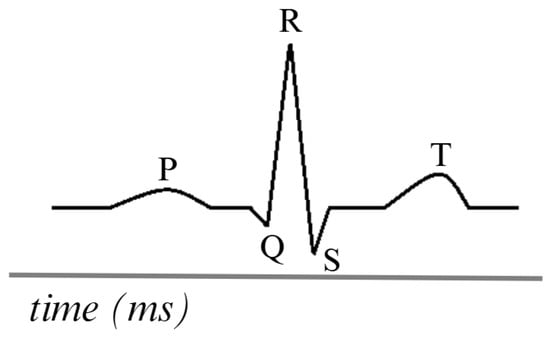
Figure 6.
Simulation of an ECG signal. Adapted from [86].
7.1. Signal Processing Techniques
Preprocessing of ECG signals is crucial to ensure accurate classification and diagnosis. Different researchers have proposed various methodologies for noise removal, segmentation, and feature extraction to ensure that their preprocessing is effective in handling these signals.
The study performed by Sivapalan [89] proposed the use of a bandpass filter between 0.1 and 100 Hz to remove the high and low-frequency components in the data of the database used (MIT-BIH arrhythmia [90]), and to remove the frequency of the alternating current, a standard IIR notch filter at 60 Hz and the signals were resampled from 360 Hz to 250 Hz and processed with a DWT for further noise reduction.
Jin [91] proposes a methodology for signal processing before analysis; a bandpass filter is used to eliminate high and low-frequency noise, preserving the signals that are relevant for the study of the work; once this is complete with the signal obtained, techniques are applied to correct frequencies with the movement and baseline, ensuring that the signal is suitable for training. When the signal is already preprocessed, it is segmented into fixed windows, thus facilitating the ease of data transfer to the neural network.
Unlike the other research reviewed in this work, Mathunjwa [92] includes a different process; the first step, as usual, is the elimination of noise in the signals using the frequencies already identified; the next step to process the signals is to transform them into recurrence plots (RP), which are two-dimensional representations that highlight the dynamic patterns associated with the arrhythmia. The preprocessed information is normalized and segmented into intervals corresponding to each beat, then converted into images for use by a CNN that will classify the signals based on the arrhythmia.
Research with a different methodology is the one carried out by Loh [93], in which he did not perform any signal treatment process since the model was trained with signals that were not processed either; what he did accomplish was a manual selection and calibration of the central time of the sample, i.e., there were samples of 170 s and samples of 180 s, it is not possible to generalize the duration in 180 s because it would cause a significant amount of samples to be excluded, so it was decided to use the duration of 170 s and adapt the signals of 180 s so that their central portion would be the same in terms of location in time. The central portions of the data were divided in half, and then the values of the ranges were adjusted by subtracting or adding 85, resulting in the central window of the sample.
Even though the papers have similar procedures, there are small characteristics that can be observed when analyzing them; Table 10 shows an abstract of these differences.
Table 10.
Comparison of ECG Signal Processing Methods.
7.2. Applications with AI
Nita [94] proposes a CNN with data augmentation techniques to recognize human emotions using ECG signals. The data augmentation method generates data in a realistic and balanced way, as an alternative to a widespread problem when using DL, which are small and unbalanced datasets, the proposed CNN consists of seven layers (composed of 4 convolutional layers, two pooling layers, and a fully connected layer), this work achieved an accuracy rate of 95.16%, demonstrating that AI can capture complex features of physiological signals. By synthetically generating the representation of the signals, the computational capacity required is a limitation to replicate this work, so not everyone could do it; even the use of the Dreamer database [95] does not represent a validation that the model can obtain acceptable metrics with different databases despite using the same type of signals.
Another approach that can be taken with ECG signals is the one addressed by Wang [96], using CWT and CNNs, in which CWT is used to transform the signals into scalograms in the time-frequency domain. The signals used were from MIT-BIH Database [97], which consists of 48 ECG records, allowing CNN to extract relevant features that are not appreciable in the time domain and including intervals in the R waves as additional features provide another tool to improve accuracy at the time of classification. The model achieved an accuracy of 98.74%, demonstrating potential as an auxiliary diagnostic tool. The challenge of using public databases is that they do not guarantee the model will generalize when implemented in environments with data of the exact nature but different acquisition. Furthermore, the processing stage is computationally expensive, limiting the model’s future applications.
A study that does not explicitly address a problem but rather compares the effectiveness of comparing DL models is the work developed by Smigiel et al [98], which specifically used the PTB-XL database [99], consisting of 21, 837 12-lead ECG recordings, each with 10 s of duration, in addition to relevant data such as age, sex, and clinical diagnosis, the database for the three models was the same, 70/15/15, in which there is 70% training, 15% validation and 15% test, the proposed networks were as follows: a simple CNN of 5 convolutional layers and a fully connected layer, a SincNet, which was initially developed for speech recognition but an advantage is that it allows the employment of custom filters that fit the desired frequency domain, so when wanting to capture specific features in ECG signals it is a good CNN to test, Finally, a CNN with entropy features was proposed, which unlike the simple network, this one suggests to calculate several entropy measures for each channel of the ECG signal, such as Shannon entropy, approximate and sample entropy, spectral entropy and Tsallis and Rényi entropy, allowing the enriching of the features extracted by the network. The results of the evaluation of the three networks showed that the CNN with entropy features obtained better results, reaching an accuracy of 89.2% for a binary classification; SincNet was the one with the worst accuracy, perhaps because its design was optimized for voices, and the simple CNN was the one that showed the best accuracy/computational cost ratio, demonstrating that it is helpful for simple classification tasks with ECG signals.
The works explained are presented in Table 11, which shows the differences in the characteristics of their databases, the AI techniques used, and the metrics obtained, providing an overview of the research analyzed.
Table 11.
Comparison of AI Models in ECG Signal Research.
8. Conclusions
Bioelectrical signals exhibit differences that influence the way each signal is captured, processed, and interpreted in both clinical and research settings. Despite sharing the same principle based on cellular electrical activity, each signal has specific characteristics. Table 12 summarizes the main differences between the signals described in this research.
Table 12.
Comparison of bioelectrical signals.
Bioelectrical signals, which directly represent the electrical activity of biological systems, open up a wide range of possibilities in scientific research and advanced technological applications. Despite their significant advantages, these signals face several challenges that necessitate the development of efficient methodologies for their analysis and processing. While classical methods have been successfully employed in specific contexts, the evolution of signal-processing technologies and increased computing power have opened up new possibilities for applying more advanced approaches, such as AI.
Although research in AI is still in its early stages, it holds promise for enhancing the accuracy of bioelectrical signal interpretation, accelerating diagnostic processes, and tailoring medical treatments to individual needs. However, working with bioelectrical signals is not without limitations. The complexity of the data, which varies depending on the signal type, poses significant challenges. Factors such as signal noise, individual anatomical differences, and varying signal strengths complicate data processing. Furthermore, preprocessing techniques must be carefully selected to address these issues, and computational capacity may become a bottleneck when dealing with complex models and large datasets. The scarcity of high-quality, publicly available datasets further complicates the research process. These limitations must be carefully considered when designing experiments and interpreting results.
Integrating bioelectrical signals with emerging technologies holds great potential to develop innovative tools that can assist people with disabilities and enhance the quality of life across various sectors. Moreover, continued research into new analytical techniques and the development of improved sensors will help overcome current limitations, making bioelectrical signals an increasingly powerful and versatile tool in addressing everyday challenges and driving technological advancements.
As the use of bioelectrical signals expands, ethical considerations must also be addressed. Data privacy, informed consent, and the potential for misuse of sensitive physiological information necessitate careful regulation. Ensuring that AI-driven applications remain transparent, unbiased, and accessible is crucial to prevent inequalities in healthcare and other fields where bioelectrical signals are applied. Additionally, the potential for AI models to misinterpret signals highlights the need for human oversight in decision-making processes. Addressing these ethical concerns will be crucial to fully realizing the benefits of bioelectrical signal technology while safeguarding individual rights and promoting societal well-being.
Author Contributions
Conceptualization, J.-C.F.A.; methodology, J.-C.F.A. and T.-R.J.S.; software, T.-R.J.S.; validation, J.-C.F.A. and T.-R.J.S.; formal analysis, J.-C.F.A. and T.-R.J.S.; investigation, J.-C.F.A. and T.-R.J.S.; resources, A.-F.M.A. and T.-A.S.; data curation, J.-C.F.A. and T.-R.J.S.; writing—original draft preparation, J.-C.F.A. and T.-R.J.S.; writing—review and editing, J.-C.F.A., T.-R.J.S. and A.-F.M.A.; visualization, J.-C.F.A.; supervision, A.-F.M.A. and T.-A.S.; project administration, A.-F.M.A. and T.-A.S.; funding acquisition, A.-F.M.A., J.-C.F.A., T.-R.J.S. and T.-A.S. All authors have read and agreed to the published version of the manuscript.
Funding
This research received no external funding.
Conflicts of Interest
The authors declare no conflicts of interest.
References
- Singh, Y.; Singh, S.; Ray, A. Bioelectrical Signals as Emerging Biometrics: Issues and Challenges. ISRN Signal Process. 2012, 2012, 712032. [Google Scholar]
- Martinek, R.; Ladrova, M.; Sidikova, M.; Jaros, R.; Behbehani, K.; Kahankova, R.; Kawala-Sterniuk, A. Advanced Bioelectrical Signal Processing Methods: Past, Present and Future Approach—Part I: Cardiac Signals. Sensors 2021, 21, 5186. [Google Scholar] [CrossRef] [PubMed]
- Martinek, R.; Ladrova, M.; Sidikova, M.; Jaros, R.; Behbehani, K.; Kahankova, R.; Kawala-Sterniuk, A. Advanced Bioelectrical Signal Processing Methods: Past, Present and Future Approach—Part II: Brain Signals. Sensors 2021, 21, 6343. [Google Scholar] [CrossRef]
- Ghosh, R. Learning Outcomes of Classroom Research; L’Ordine Nuovo Publication: Rome, Italy, 2022. [Google Scholar]
- Aceves-Fernandez, M. Inteligencia Artificial para Programadores con Prisa; Amazon Self Publishing (Próximamente ed. Planeta): Seattle, WA, USA, 2021. [Google Scholar]
- Samuel, A.L. Some Studies in Machine Learning Using the Game of Checkers. IBM J. Res. Dev. 1959, 3, 210–229. [Google Scholar]
- Du, X.; Cai, Y.; Wang, S.; Zhang, L. Overview of deep learning. In Proceedings of the 2016 31st Youth Academic Annual Conference of Chinese Association of Automation (YAC), Hangzhou, China, 28–30 October 2016; pp. 159–164. [Google Scholar]
- Rangayyan, R.M. Introduction to Biomedical Signals. In Biomedical Signal Analysis; John Wiley & Sons, Ltd.: Hoboken, NJ, USA, 2015; Chapter 1; pp. 1–69. [Google Scholar]
- Koch, K.; Schuettler, M.; Stieglitz, T. Considerations on noise of electrodes in combination with amplifiers for bioelectrical signal recording. Biomed. Tech. Biomed. Eng. 2002, 47 Pt 2 (Suppl. S1), 514–516. [Google Scholar]
- Abdullah, A.; Ibrahim, A.; Alhamadani, A.; Al-obaidi, M.; Ahmed, A. A review for filtering techniques of the Electrooculography (EOG) signals. Glob. J. Eng. Technol. Adv. 2023, 16, 163–171. [Google Scholar]
- Barbara, N.; Camilleri, T.A.; Camilleri, K.P. TEMoD: Target-Enabled Model-Based De-Drifting of the EOG Signal Baseline using a Battery Model of the Eye. In Proceedings of the 2021 43rd Annual International Conference of the IEEE Engineering in Medicine & Biology Society (EMBC), Virtual, 1–5 July 2021; pp. 562–565. [Google Scholar]
- López, A.; Ferrero, F.; Villar, J.R.; Postolache, O. High-Performance Analog Front-End (AFE) for EOG Systems. Electronics 2020, 9, 970. [Google Scholar] [CrossRef]
- Maddirala, A.; Veluvolu, K. Eye-blink artifact removal from single channel EEG with k-means and SSA. Sci. Rep. 2021, 11, 11043. [Google Scholar]
- Mannan, M.M.N.; Kamran, M.; Kang, S.; Jeong, M. Effect of EOG Signal Filtering on the Removal of Ocular Artifacts and EEG-Based Brain-Computer Interface: A Comprehensive Study. Complexity 2018, 2018, 4853741. [Google Scholar]
- Aungsakun, S.; Phinyomark, A.; Phukpattaranont, P.; Limsakul, C. Development of Robust EOG-Based Human-Computer Interface Controlled by Eight-Directional Eye Movements. Int. J. Phys. Sci. 2012, 7, 2196–2208. [Google Scholar]
- Kiloh, L.G.; McComas, A.J.; Osselton, J.W. Clinical Electroencephalography; Butterworth-Heinemann: Oxford, UK, 2013. [Google Scholar]
- Millett, D. Hans Berger: From psychic energy to the EEG. Perspect. Biol. Med. 2001, 44, 522–542. [Google Scholar] [CrossRef] [PubMed]
- Coenen, A.; Zayachkivska, O. Adolf Beck: A pioneer in electroencephalography in between Richard Caton and Hans Berger. Adv. Cogn. Psychol. 2013, 9, 216. [Google Scholar] [CrossRef]
- Lenartowicz, A.; Loo, S.K. Use of EEG to diagnose ADHD. Curr. Psychiatry Rep. 2014, 16, 498. [Google Scholar] [CrossRef] [PubMed]
- Bell, M.A.; Cuevas, K. Using EEG to study cognitive development: Issues and practices. J. Cogn. Dev. 2012, 13, 281–294. [Google Scholar] [CrossRef] [PubMed]
- Noachtar, S.; Rémi, J. The role of EEG in epilepsy: A critical review. Epilepsy Behav. 2009, 15, 22–33. [Google Scholar] [CrossRef]
- Smith, S.J. EEG in the diagnosis, classification, and management of patients with epilepsy. J. Neurol. Neurosurg. Psychiatry 2005, 76, ii2–ii7. [Google Scholar] [CrossRef]
- Petit, D.; Gagnon, J.F.; Fantini, M.L.; Ferini-Strambi, L.; Montplaisir, J. Sleep and quantitative EEG in neurodegenerative disorders. J. Psychosom. Res. 2004, 56, 487–496. [Google Scholar] [CrossRef]
- Niedermeyer, E. Niedermeyer’s Electroencephalography: Basic Principles, Clinical Applications, and Related Fields; Lippincott Williams & Wilkins: Philadelphia, PA, USA, 2011. [Google Scholar]
- Binnie, C.; Prior, P. Electroencephalography. J. Neurol. Neurosurg. Psychiatry 1994, 57, 1308–1319. [Google Scholar] [CrossRef]
- Kumar, J.S.; Bhuvaneswari, P. Analysis of Electroencephalography (EEG) Signals and Its Categorization—A Study. Procedia Eng. 2012, 38, 2525–2536. [Google Scholar] [CrossRef]
- Eldele, E.; Chen, Z.; Liu, C.; Wu, M.; Kwoh, C.K.; Li, X.; Guan, C. An attention-based deep learning approach for sleep stage classification with single-channel EEG. IEEE Trans. Neural Syst. Rehabil. Eng. 2021, 29, 809–818. [Google Scholar] [CrossRef]
- Islam, M.S.; Hussain, I.; Rahman, M.M.; Park, S.J.; Hossain, M.A. Explainable artificial intelligence model for stroke prediction using EEG signal. Sensors 2022, 22, 9859. [Google Scholar] [CrossRef] [PubMed]
- Chakravarthi, B.; Ng, S.C.; Ezilarasan, M.; Leung, M.F. EEG-based emotion recognition using hybrid CNN and LSTM classification. Front. Comput. Neurosci. 2022, 16, 1019776. [Google Scholar] [CrossRef]
- De Miras, J.R.; Ibáñez-Molina, A.J.; Soriano, M.F.; Iglesias-Parro, S. Schizophrenia classification using machine learning on resting state EEG signal. Biomed. Signal Process. Control 2023, 79, 104233. [Google Scholar] [CrossRef]
- Borde, S.; Ratnaparkhe, V. Optimization in channel selection for EEG signal analysis of Sleep Disorder subjects. J. Integr. Sci. Technol. 2023, 11, 527. [Google Scholar]
- Klepl, D.; He, F.; Wu, M.; Blackburn, D.J.; Sarrigiannis, P. EEG-based graph neural network classification of Alzheimer’s disease: An empirical evaluation of functional connectivity methods. IEEE Trans. Neural Syst. Rehabil. Eng. 2022, 30, 2651–2660. [Google Scholar] [CrossRef] [PubMed]
- Gao, Y.; Chen, X.; Liu, A.; Liang, D.; Wu, L.; Qian, R.; Xie, H.; Zhang, Y. Pediatric seizure prediction in scalp EEG using a multi-scale neural network with dilated convolutions. IEEE J. Transl. Eng. Health Med. 2022, 10, 4900209. [Google Scholar] [CrossRef]
- Attallah, O. ADHD-AID: Aiding Tool for Detecting Children’s Attention Deficit Hyperactivity Disorder via EEG-Based Multi-Resolution Analysis and Feature Selection. Biomimetics 2024, 9, 188. [Google Scholar] [CrossRef]
- Kemp, B.; Zwinderman, A.H.; Tuk, B.; Kamphuisen, H.A.; Oberye, J.J. Analysis of a sleep-dependent neuronal feedback loop: The slow-wave microcontinuity of the EEG. IEEE Trans. Biomed. Eng. 2000, 47, 1185–1194. [Google Scholar] [CrossRef]
- Guttag, J. CHB-MIT Scalp EEG Database (Version 1.0.0); PhysioNet: Boston, MA, USA, 2010. [Google Scholar]
- Joselevitch, C. Human retinal circuitry and physiology. Psychol. Neurosci. 2008, 1, 141. [Google Scholar] [CrossRef]
- Quinn, N.; Csincsik, L.; Flynn, E.; Curcio, C.A.; Kiss, S.; Sadda, S.R.; Hogg, R.; Peto, T.; Lengyel, I. The clinical relevance of visualising the peripheral retina. Prog. Retin. Eye Res. 2019, 68, 83–109. [Google Scholar]
- Ala-Laurila, P.; Cornwall, M.; Crouch, R.; Kono, M. The Action of 11-cis-Retinol on Cone Opsins and Intact Cone Photoreceptors. J. Biol. Chem. 2009, 284, 16492–16500. [Google Scholar] [CrossRef] [PubMed]
- Brown, K.T. The electroretinogram: Its components and their origins. Vis. Res. 1968, 8, 633-IN6. [Google Scholar] [CrossRef] [PubMed]
- Barber, C. Electrodes and the recording of the human electroretinogram (ERG). Int. J. Psychophysiol. 1994, 16, 131–136. [Google Scholar] [CrossRef] [PubMed]
- Gupta, S.; Chakraborty, R.; Verkicharla, P. Electroretinogram responses in myopia: A review. Doc. Ophthalmol. 2021, 145, 77–95. [Google Scholar] [CrossRef]
- Einthoven, W.; Jolly, W.A. The Form and Magnitude of the Electrical Response of the Eye to Stimulation by Light at Various Intensities. Q. J. Exp. Physiol. 1908, 1, 373–416. [Google Scholar] [CrossRef]
- Shankar, U.; Gunasundari, R. A Review on Electrophysiology Based Detection of Diabetic Retinopathy. Procedia Comput. Sci. 2015, 48, 630–637. [Google Scholar] [CrossRef][Green Version]
- Barraco, R.; Adorno, D.P.; Brai, M.; Tranchina, L. A comparison among different techniques for human ERG signals processing and classification. Phys. Med. 2014, 30, 86–95. [Google Scholar] [CrossRef] [PubMed]
- Barraco, R.; Persano Adorno, D.; Brai, M. ERG signal analysis using wavelet transform. Theory Biosci. 2011, 130, 155–163. [Google Scholar] [CrossRef] [PubMed]
- Albasu, F.; Kulyabin, M.; Zhdanov, A.; Dolganov, A.; Ronkin, M.; Borisov, V.; Dorosinsky, L.; Constable, P.A.; Al-masni, M.A.; Maier, A. Electroretinogram Analysis Using a Short-Time Fourier Transform and Machine Learning Techniques. Bioengineering 2024, 11, 866. [Google Scholar] [CrossRef]
- Yamashita, T.; Miki, A.; Tabuchi, A.; Funada, H.; Kondo, M. A novel method to reduce noise in electroretinography using skin electrodes: A study of noise level, inter-session variability, and reproducibility. Int. Ophthalmol. 2017, 37, 317–324. [Google Scholar] [CrossRef]
- Kulyabin, M.; Zhdanov, A.; Dolganov, A.; Maier, A. Optimal Combination of Mother Wavelet and AI Model for Precise Classification of Pediatric Electroretinogram Signals. Sensors 2023, 23, 5813. [Google Scholar] [CrossRef] [PubMed]
- Song, Z.; Zou, S.; Zhou, W.; Huang, Y.; Shao, L.; Yuan, J.; Gou, X.; Jin, W.; Wang, Z.; Chen, X.; et al. Clinically applicable histopathological diagnosis system for gastric cancer detection using deep learning. Nat. Commun. 2020, 11, 4294. [Google Scholar]
- Kabir, H.; Wu, J.; Dahal, S.; Joo, T.; Garg, N. Automated estimation of cementitious sorptivity via computer vision. Nat. Commun. 2024, 15, 9935. [Google Scholar] [PubMed]
- Kulyabin, M.; Zhdanov, A.; Maier, A.; Loh, L.; Estevez, J.; Constable, P. Generating Synthetic Light-Adapted Electroretinogram Waveforms Using Artificial Intelligence to Improve Classification of Retinal Conditions in Under-Represented Populations. J. Ophthalmol. 2024, 2024, 1990419. [Google Scholar]
- Posada-Quintero, H.; Manjur, S.; Hossain, M.B.; Marmolejo-Ramos, F.; Lee, I.; Skuse, D.; Thompson, D.; Constable, P. Autism spectrum disorder detection using variable frequency complex demodulation of the electroretinogram. Res. Autism Spectr. Disord. 2023, 109, 102258. [Google Scholar]
- Ghapanchizadeh, H.; Ahmad, S.A.; Ishak, A.J.; Al-Quraishi, M.S. Review of surface electrode placement for recording electromyography signals. Biomed. Res. 2017, 2017, S1–S7. [Google Scholar]
- Feinstein, B.; Lindegård, B.; Nyman, E.; Wohlfart, G. Morphologic studies of motor units in normal human muscles. Acta Anat. 1955, 23, 127–142. [Google Scholar] [CrossRef]
- Soderberg, G.L.; Cook, T.M. Electromyography in Biomechanics. Phys. Ther. 1984, 64, 1813–1820. [Google Scholar] [CrossRef]
- Hakonen, M.; Piitulainen, H.; Visala, A. Current state of digital signal processing in myoelectric interfaces and related applications. Biomed. Signal Process. Control 2015, 18, 334–359. [Google Scholar]
- Shair, E.F.; Ahmad, S.; Abdullah, A.R.; Marhaban, M.H.; Md Tamrin, S. Determining Best Window Size for an Improved Gabor Transform in EMG Signal Analysis. Telkomnika (Telecommun. Comput. Electron. Control) 2018, 16, 1650–1658. [Google Scholar] [CrossRef]
- Reyes, D.; Loaiza-Correa, H.; López, M.; Duarte, J. Expert committee classifier for hand motions recognition from EMG signals. Ingeniare. Rev. Chil. Ing. 2018, 26, 62–71. [Google Scholar] [CrossRef]
- Cavalcanti Garcia, M.A.; Vieira, T. Surface electromyography: Why, when and how to use it. Rev. Andal. Med. Deporte 2011, 4, 17–28. [Google Scholar]
- Loudon, G.; Jones, N.; Sehmi, A. New signal processing techniques for the decomposition of EMG signals. Med. Biol. Eng. Comput. 1992, 30, 591–599. [Google Scholar] [CrossRef]
- Zhang, X.; Wang, Y.; Han, R.P. Wavelet transform theory and its application in EMG signal processing. In Proceedings of the 2010 Seventh International Conference on Fuzzy Systems and Knowledge Discovery, Yantai, China, 26–28 August 2010; Volume 5, pp. 2234–2238. [Google Scholar]
- Sadikoglu, F.; Kavalcioglu, C.; Dagman, B. Electromyogram (EMG) signal detection, classification of EMG signals and diagnosis of neuropathy muscle disease. Procedia Comput. Sci. 2017, 120, 422–429. [Google Scholar] [CrossRef]
- Andrade, A.O.; Nasuto, S.; Kyberd, P.; Sweeney-Reed, C.M.; Van Kanijn, F. EMG signal filtering based on Empirical Mode Decomposition. Biomed. Signal Process. Control 2006, 1, 44–55. [Google Scholar] [CrossRef]
- Pasinetti, S.; Lancini, M.; Bodini, I.; Docchio, F. A Novel Algorithm for EMG Signal Processing and Muscle Timing Measurement. IEEE Trans. Instrum. Meas. 2015, 64, 2995–3004. [Google Scholar] [CrossRef]
- Huang, D.; Chen, B. Surface EMG Decoding for Hand Gestures Based on Spectrogram and CNN-LSTM. In Proceedings of the 2019 2nd China Symposium on Cognitive Computing and Hybrid Intelligence (CCHI), Chengdu, China, 28–30 November 2019; pp. 123–126. [Google Scholar]
- Kok, C.L.; Ho, C.K.; Tan, F.K.; Koh, Y.Y. Machine Learning-Based Feature Extraction and Classification of EMG Signals for Intuitive Prosthetic Control. Appl. Sci. 2024, 14, 5784. [Google Scholar] [CrossRef]
- Farhan, F.; Rupom, F.; Jannat, S.; Tamanna, F.F.; Musa, G.; Johan, A.; Islam, M. EMG Controlled Bionic Robotic Arm using Artificial Intelligence and Machine Learning. In Proceedings of the 2020 IEEE Region 10 Symposium (TENSYMP), Dhaka, Bangladesh, 5–7 June 2020. [Google Scholar]
- Mokri, C.; Bamdad, M.; Abolghasemi, V. Muscle force estimation from lower limb EMG signals using novel optimised machine learning techniques. Med. Biol. Eng. Comput. 2022, 60, 683–699. [Google Scholar] [CrossRef]
- Ramírez Ángeles, I.J.; Razo López, N.B.; Aceves Fernández, M.A.; Gorrostieta Hurtado, E. Metodología para la Adquisición de Señales Electromiográficas en el Brazo Utilizando un Lector de Señales Multicanal. Mecátronica México 2019, 8, 22–36. [Google Scholar]
- Quiñones, A.A.L. Propuesta de Red Neuronal Convolutiva para la Clasificación de Señales Electromiográficas Provenientes de Movimientos de la Mano; Universidad Autonóma de Querétaro: Querétaro, Mexico, 2022. [Google Scholar]
- Kim, M.R.; Yoon, G. Control Signal from EOG Analysis and Its Application. Int. J. Electr. Comput. Eng. 2013, 7, 1352–1355. [Google Scholar]
- Bhandari, A.; Khare, V.; Santhosh, J.; Anand, S. Wavelet based compression technique of Electro-oculogram signals. IFMBE Proc. 2007, 15, 440–443. [Google Scholar]
- Rusydi, M.; Okamoto, T.; Ito, S.; Sasaki, M. Rotation Matrix to Operate a Robot Manipulator for 2D Analog Tracking Objects Using Electrooculography. Robotics 2014, 3, 289–309. [Google Scholar] [CrossRef]
- Merino, M.; Rivera, O.; Gómez, I.; Molina, A.; Dorronzoro, E. A Method of EOG Signal Processing to Detect the Direction of Eye Movements. In Proceedings of the 2010 First International Conference on Sensor Device Technologies and Applications, Nice, France, 18–23 July 2010; pp. 100–105. [Google Scholar]
- López, A.; Fernández, D.; Ferrero, F.J.; Valledor, M.; Postolache, O. EOG signal processing module for medical assistive systems. In Proceedings of the 2016 IEEE International Symposium on Medical Measurements and Applications (MeMeA), Trieste, Italy, 28–30 May 2016; pp. 1–5. [Google Scholar]
- Das, D.; Chowdhury, M.; Chowdhury, A.; Hossain, Q.D.; Cheung, R.C. EOG Signal Processor: An SVM-based Multiclass Classifier to Detect Eye Movements. J. Signal Process. Syst. 2024, 96, 587–600. [Google Scholar] [CrossRef]
- Zhu, X.; Zheng, W.L.; Lu, B.L.; Chen, X.; Chen, S.; Wang, C. EOG-based drowsiness detection using convolutional neural networks. In Proceedings of the 2014 International Joint Conference on Neural Networks (IJCNN), Beijing, China, 6–11 July 2014; pp. 128–134. [Google Scholar]
- Pérez-Reynoso, F.D.; Rodríguez-Guerrero, L.; Salgado-Ramírez, J.C.; Ortega-Palacios, R. Human–Machine Interface: Multiclass Classification by Machine Learning on 1D EOG Signals for the Control of an Omnidirectional Robot. Sensors 2021, 21, 5882. [Google Scholar] [CrossRef] [PubMed]
- Lee, K.R.; Chang, W.D.; Kim, S.; Im, C.H. Real-Time “Eye-Writing” Recognition Using Electrooculogram. IEEE Trans. Neural Syst. Rehabil. Eng. 2017, 25, 37–48. [Google Scholar] [CrossRef]
- Ileri, R.; Latifoglu, F.; Demirci, E. A novel approach for detection of dyslexia using convolutional neural network with EOG signals. Med. Biol. Eng. Comput. 2022, 60, 3041–3055. [Google Scholar] [CrossRef] [PubMed]
- Alberto, G.E.C.; Antonio, A.F.M.; Carmen, C.H.; Saúl, T.A. Clasificación de Niveles de Atención con Datos de Desempeño y de Seguimiento Ocular Durante la Prueba ADEM. Mecatrónica México Enero 2024, 13, 19–39. [Google Scholar]
- Sampedro, A.G.; Richman, J.; Pardo, M. The Adult Developmental Eye Movement Test (A–DEM). J. Behav. Optom. 2003, 14, 101–105. [Google Scholar]
- Surawicz, B.; Knilans, T. Chou’s Electrocardiography in Clinical Practice: Adult and Pediatric; Elsevier Health Sciences: Amsterdam, The Netherlands, 2008. [Google Scholar]
- Goldberger, A.L.; Goldberger, Z.D.; Shvilkin, A. Goldberger’s Clinical Electrocardiography—A Simplified Approach: First South Asia Edition-E-Book; Elsevier Health Sciences: Amsterdam, The Netherlands, 2017. [Google Scholar]
- Wagner, G.S.; Strauss, D.G. Marriott’s Practical Electrocardiography; Lippincott Williams & Wilkins: Philadelphia, PA, USA, 2014. [Google Scholar]
- Jalaleddine, S.M.; Hutchens, C.G.; Strattan, R.D.; Coberly, W.A. ECG data compression techniques-a unified approach. IEEE Trans. Biomed. Eng. 1990, 37, 329–343. [Google Scholar] [CrossRef]
- Hurst, J.W. Naming of the waves in the ECG, with a brief account of their genesis. Circulation 1998, 98, 1937–1942. [Google Scholar] [CrossRef]
- Sivapalan, G.; Nundy, K.K.; Dev, S.; Cardiff, B.; John, D. ANNet: A lightweight neural network for ECG anomaly detection in IoT edge sensors. IEEE Trans. Biomed. Circuits Syst. 2022, 16, 24–35. [Google Scholar] [CrossRef] [PubMed]
- Goldberger, A.L.; Amaral, L.A.; Glass, L.; Hausdorff, J.M.; Ivanov, P.C.; Mark, R.G.; Stanley, H.E. PhysioBank, PhysioToolkit, and PhysioNet: Components of a new research resource for complex physiologic signals. Circulation 2000, 101, e215–e220. [Google Scholar] [CrossRef]
- Jin, Y.; Li, Z.; Qin, C.; Liu, J.; Liu, Y.; Zhao, L.; Liu, C. A novel attentional deep neural network-based assessment method for ECG quality. Biomed. Signal Process. Control 2023, 79, 104064. [Google Scholar]
- Mathunjwa, B.M.; Lin, Y.T.; Lin, C.H.; Abbod, M.F.; Shieh, J.S. ECG arrhythmia classification by using a recurrence plot and convolutional neural network. Biomed. Signal Process. Control 2021, 64, 102262. [Google Scholar]
- Loh, H.W.; Ooi, C.P.; Oh, S.L.; Barua, P.D.; Tan, Y.R.; Molinari, F.; March, S.; Acharya, U.R.; Fung, D.S.S. Deep neural network technique for automated detection of ADHD and CD using ECG signal. Comput. Methods Programs Biomed. 2023, 241, 107775. [Google Scholar]
- Nita, S.; Bitam, S.; Heidet, M.; Mellouk, A. A new data augmentation convolutional neural network for human emotion recognition based on ECG signals. Biomed. Signal Process. Control 2022, 75, 103580. [Google Scholar]
- Katsigiannis, S.; Ramzan, N. DREAMER: A database for emotion recognition through EEG and ECG signals from wireless low-cost off-the-shelf devices. IEEE J. Biomed. Health Inform. 2017, 22, 98–107. [Google Scholar] [CrossRef]
- Wang, T.; Lu, C.; Sun, Y.; Yang, M.; Liu, C.; Ou, C. Automatic ECG classification using continuous wavelet transform and convolutional neural network. Entropy 2021, 23, 119. [Google Scholar] [CrossRef]
- Moody, G.; Mark, R. The impact of the MIT-BIH Arrhythmia Database. IEEE Eng. Med. Biol. Mag. 2001, 20, 45–50. [Google Scholar] [CrossRef]
- Śmigiel, S.; Pałczyński, K.; Ledziński, D. ECG signal classification using deep learning techniques based on the PTB-XL dataset. Entropy 2021, 23, 1121. [Google Scholar] [CrossRef]
- Wagner, P.; Strodthoff, N.; Bousseljot, R.D.; Kreiseler, D.; Lunze, F.I.; Samek, W.; Schaeffter, T. PTB-XL, a large publicly available electrocardiography dataset. Sci. Data 2020, 7, 154. [Google Scholar] [CrossRef] [PubMed]


Disclaimer/Publisher’s Note: The statements, opinions and data contained in all publications are solely those of the individual author(s) and contributor(s) and not of MDPI and/or the editor(s). MDPI and/or the editor(s) disclaim responsibility for any injury to people or property resulting from any ideas, methods, instructions or products referred to in the content. |
© 2025 by the authors. Licensee MDPI, Basel, Switzerland. This article is an open access article distributed under the terms and conditions of the Creative Commons Attribution (CC BY) license (https://creativecommons.org/licenses/by/4.0/).