Abstract
With the rise of digital video technologies and the proliferation of processing methods and storage systems, video-surveillance systems have received increasing attention over the last decade. However, the spread of cameras installed in public and private spaces makes it more difficult for human operators to perform real-time analysis of the large amounts of data produced by surveillance systems. Due to the advancement of artificial intelligence methods, many automatic video analysis tasks like violence detection have been studied from a research perspective, and are even beginning to be commercialized in industrial solutions. Nevertheless, most of these solutions adopt centralized architectures with costly servers utilized to process streaming videos sent from different cameras. Centralized architectures do not present the ideal solution due to the high cost, processing time issues, and network bandwidth overhead. In this paper, we propose a lightweight autonomous system for the detection and geolocation of violent acts. Our proposed system, named LAVID, is based on a depthwise separable convolution model (DSCNN) combined with a bidirectional long-short-term memory network (BiLSTM) and implemented on a lightweight smart camera. We provide in this study a lightweight video-surveillance system consisting of low-cost autonomous smart cameras that are capable of detecting and identifying harmful behavior and geolocate violent acts that occur over a covered area in real-time. Our proposed system, implemented using Raspberry Pi boards, represents a cost-effective solution with interoperability features making it an ideal IoT solution to be integrated with other smart city infrastructure. Furthermore, our approach, implemented using optimized deep learning models and evaluated on several public datasets, has shown good results in term of accuracy compared to state of the art methods while optimizing reducing power and computational requirements.
1. Introduction
Nowadays, surveillance systems are widely spread over our cities. They are designed to keep an eye on monitored areas by recording events and help authorities to detect any kind of anomaly, violence, suspicious behaviors and prospective crime that may occur inside monitored areas, such as public establishments, hospitals, airports, and even on city streets. For public safety, the need for robust and efficient surveillance systems that detect violence and can predict potential risks has significantly increased.
The large number of installed surveillance cameras and the enormous amount of data being generated daily make the task of analyzing video footage too tedious and difficult to manage by a human operator. Moreover, the use of traditional methods and manual approaches is very costly and time-consuming [1]. For these reasons and more, automatic violence detection systems have been proposed and designed to analyze the behavior of individuals in real-time and detect potential violent actions in video scenes [2,3,4]. These methods, which rely mostly on computer vision and deep learning algorithms, have led to phenomenal results in the detection and categorization of activities.
Deep learning has shown its efficiency in the field of computer vision, and specifically in image processing and video sequence analysis. Deep learning techniques used for violence detection in video-surveillance systems rely on specific methods and algorithms that analyzes audio and video footage to recognize events and behaviors that may be signs of violence [5,6].
However, anomaly and violence detection in the real world is a much more difficult and challenging process to manage [3]. Occlusion, changing light levels, and adverse weather conditions result in a significant change in the nature of the input data fed to the deep learning model, which can lead to high anomaly scores and low accuracy rates [7]. In addition, the detection of dangerous objects carried by individuals can be difficult. Detecting small objects is not a simple task and raises several issues as they contain less semantic information, fewer pixels, and can easily be confused and blended with the background [8]. In addition, there are no large-scale datasets of small objects as the majority of the available datasets used for the object detection field are designed to detect objects of a common size, like ImageNet [9] or MS COCO [10]. Moreover, the nature of the problem, which consists of processing a huge amount of data derived from a large number of cameras scattered around the monitored areas, requires costly servers that consume significant resources, which may lead to possible server overloading, excessive resource usage, and network bandwidth overhead. Hence, to cover a wide area and ensure safety in our cities, low-cost violence detection systems implemented in a distributed architecture are highly recommended to avoid the high-cost of centralized architectures that use costly processing units.
In this paper, we propose a lightweight system for violence detection and geolocation. Our main intention is to create an autonomous lightweight violence detection system that is efficient in terms of resource consumption while being accurate and inexpensive. The proposed system, implemented on low-cost embedded devices, addresses several issues. First, our proposed method relies on a depthwise separable convolution network coupled with BiLSTM to encode spatio-temporal variations and analyze the local motion between consecutive frames. By doing so, we overcome the long-term dependencies issue which results in lower accuracy.
The task of violence detection entails local deployment on an embedded device using a deep learning method. In this way, bandwidth requirements can be reduced to simply transferring the relevant data, as only descriptive features and important (informative) data are processed and transmitted over the proposed system. Hence, we avoid the necessity of sharing video data with a costly central server for scene processing, which can lead to excessive usage of resources, such as bandwidth and energy. If our system detects a scene of violence, the geographical position where the violent act was committed is extracted by our proposed lightweight system and the geographical coordinates are sent to the relevant authorities for appropriate intervention. Thus, we are able to enhance the safety level of our cities and improve the efficiency of surveillance systems while contributing to the development of smart cities.
The paper is organized as follows: Section 2 reviews some related works that describe the most common methods used for detecting violence in video sequences. Section 3 gives a description of our proposed system. Section 4 reports the experiment results enriched by a comparative study. The conclusions and future work are addressed in Section 5.
2. Related Works
Video surveillance is a growing and challenging research field. One of its main applications is public safety improvement by searching and detecting any kind of abnormal and violent acts, such as theft, fights, intrusion, fire or others. Security systems equipped with surveillance cameras are installed at all important points on site, so that security operators can constantly monitor all areas, searching for specific behaviors that may indicate an emergency or potentially dangerous situation requiring intervention.
However, no matter how good the surveillance system is, the weakest link remains, in most cases, the human operator. Indeed, manual monitoring of several screens and constantly analyzing all scenes efficiently and without losing concentration is a tedious task. Humans are prone to fatigue, which inevitably leads to a drop in productivity, increases response time, and tends to increase the risk of human error.
The integration of automated solutions, powered by artificial intelligence methods and algorithms, into video-surveillance systems enables better security management and efficient violence detection in all monitored areas [11,12]. Analysis of video scenes from security cameras using AI algorithms ensures better situational awareness in monitored areas in real time and simplifies the tedious tasks of long hours of video observation by humans. AI-based video-surveillance systems automatically detect scenes of violence and inform human operators, such as authorities, of real dangers so they can make more informed decisions about what action to take and what measures to implement. Additionally, such AI-based solutions have the advantage of operating both day and night, with the ability to detect objects at great distances and to process large numbers of video streams in real-time. All this and more is what inspires researchers with an interest in violence detection systems to meet tomorrow’s challenges and develop innovative solutions.
For this purpose, the authors of [13] propose a triple-staged end-to-end deep learning violence detection system. First and foremost, the proposed system reduces the amount of data to be processed by carrying out processing leading to the identification of people in the surveillance video stream using a mobileNet CNN pre-trained model [14]. Then, a sequence of 16 frames including the detected people is fed to the 3D CNN. The spatiotemporal features of each frame are extracted and fed to the Softmax classifier. For optimization purposes, the authors utilized OPENVINO, an open visual inference and neural networks optimization tool created by the Intel Corporation, which transforms the training model into a more optimal intermediate representation to be executed on the final platform to achieve better violence prediction. When violent behavior is detected, an alarm is sent to the relevant authorities so that the necessary measures can be taken.
Kang et al. [15] introduced a novel violence detection system that includes three parts: The first part consists of avoiding modeling irrelevant features from video scenes and focusing on human actions by using a Motion Saliency Map (MSM) module that can highlight moving objects and generate an attended image feature. Afterwards, the identified images are sent to a 2D CNN backbone. To extract spatio-temporal information from videos, the authors used a method named frame-grouping which consists of regrouping three consecutive frames and feeding them to the 2D CNN backbones to learn spatio-temporal representation. Finally, they used a Temporal Squeeze-and-Excitation (T-SE) block to recalibrate the temporal information and classify events. Hence, the computational costs of the proposed method are minimized.
In [16], the authors proposed a framework for crime scene violence detection using deep learning architectures. Firstly, the input videos are processed and converted to frames. Afterwards, the features in every frame are extracted using a spatio-temporal technique which uses forward, backward, and bidirectional predictions. Finally, the extracted features are classified using a deep reinforcement neural network technique (DRNN).
Another method was proposed by Serrano Gracia Ismael et al. [17]. The authors assumed that in combat scenes, motion blobs have a specific shape and position. The authors calculated the difference between consecutive images and generated resulting images called absolute difference images. Then, the absolute difference images were binarized, and the largest motion blobs in each consecutive binarized absolute difference image were marked. Afterwards, important information was extracted from the k largest blobs that were selected for the classification process. To rank the k blobs, different parameters were calculated, such as the area, perimeter, and distance between the blobs. Then, the blobs were characterized as combat and non-combat.
Based on the YOLO algorithm v4, Guanbo Wang et al. in [18] present a real-time weapon detection system for closed-circuit television (CCTV). The suggested model detector is based on YOLO v4, which has improved performance and accuracy over earlier versions of the algorithm (YOLO v1 [19], YOLO v2 [20] and YOLO v3 [21]). To improve the model’s small object recognition accuracy while preserving real-time performance, the authors redesigned the network structure. The original features of the base layer input are first extracted using an improved Spatial Attention Mechanism (SAM), and then the spatial information of the features is extracted before they are combined with CSP-ResNet features using a fusion layer. In order to make the model more objectively precise, capture high-dimensional information, and obtain higher resolution features, the authors use a multi-scale receptive field that preprocesses the input feature maps via dilation convolution in the Neck region of the network. Use of the F-PaNet module, which enhances the flow of position information in the deepNeck region of the network and provides various feature information for the final detection layer, is the final suggestion made by the authors.
Abdussalam Elhanashi et al. in [22] provide an edge AI-based system that prevents the spread of COVID-19. They used the fusion of three different YOLOv4-tiny models to simultaneously monitor and extract social distancing, face-mask detection, and facial temperature measurement in real-time. Visible and thermal cameras, installed and executed on NVIDIA devices, are operated simultaneously for face mask detection, social distance classification, and facial temperature measurement. The experiments performed on Jetson nano and Jetson Xavier AGX showed good real-time performance compared to state-of-the-art methods while reducing power consumption.
The authors in [23] proposed an automatic weapon detection system for surveillance and control purposes. The problem is reformulated into a classification issue, where a trained classifier is applied to several areas of the input image to detect the weapon using a Fine-tuned VGG-16 classifier. Then, the best classification model is assessed using two approaches: sliding window and region proposal. The first approach consists of scanning every part of the input image with a window and runs the classifier at each of the windows. However, detection models that rely on the sliding window approach remain too slow to be used in online detection. The second approach, which is region proposal, consists of selecting candidate regions using detection proposal methods [24], adjusting the obtained regions into images of the same size, and passing them to a powerful CNN-based classifier to extract their features. Thereafter, the boxes are evaluated using an SVM and adjusted using a linear model. Finally, duplicate detections are eliminated using non-maximal suppression. The authors used Faster Region-based CNN [25] to evaluate the detection process using this approach, finding a good balance between precision and recall.
In addition, and using a proactive approach, numerous studies and researchers address detecting violent content in movies to better control the content watched by people since they may affect a person’s behavior and, for example, incite children to commit acts of violence [26]. For example, the authors in [6] propose a violence detection scheme for movies. Firstly, the most salient frames of each shot are extracted by segmenting the movie into shots using a histogram-based method [27]. Then, in order to minimize the time complexity of the proposed approach, the key-frames with the maximum information are selected using a sparse sampling and kernel density-based saliency estimation method [28]. Finally, the key frames are processed using a MobileNet model with a transfer learning approach to identify the violence sequence. Once the key frame is identified as violent, the entire shot is discarded and the non-violent frames are merged to generate a movie without scenes of violence. Elly et al. in [29] proposed a method for automatic violence detection in movies. Firstly, the video input is preprocessed and the frames are extracted and resized into 224 × 224 pixels. Then, the features from each frame are extracted using Discrete Wave Transform (DWT) [30] with several mother wavelets. Afterwards, the extracted features are fed to a Gated Recurrent Unit (GRU) network as an input to build the final model and generate the classes.
3. Proposed System
Creating a robust and accurate violence detection system is one of the essential tasks in the field of video-surveillance and the development of secure smart cities. However, given the nature of the problem, performance and accuracy are not the only major challenges. System architecture, cost, and response time are key parameters for the optimal implementation and efficient deployment of such a system. Furthermore, the capability to identify and monitor the precise location where the act of violence occurred in real-time is a valuable feature of such a system. It enables better intervention by the authorities and effective decision-making, which will decrease the risk of harm and increase security levels.
Inspired by that idea, we propose in this work LAVID, a low-cost real-time system for detecting and geolocating violence. The architecture of our proposed system uses an end-to-end deep learning scheme for data processing deployed using an Internet of Things (IoT) device. Our proposed deep learning method consists of a pre-trained depthwise separable convolutional neural network (DSCNN) combined with a bidirectional long short-term memory network (BiLSTM) which we have named DSCNN-BiLSTM. This method is implemented on an embedded device connected to a camera sensor and a geolocation dongle. The camera sensor records video sequences which are fed into our proposed method to extract spatio-temporal features and predict whether the activity contained in the video sequence indicates an act of violence or not. When violence is detected, the actual geoposition of our system is located and stored in real-time using the geolocation dongle and Firebase. This ability to geolocate violence acts in real-time is such an important feature for a violence detection system, especially to help authorities act quickly and effectively. In the section below, we will explain our proposed system in detail, examining each step based on its function.
3.1. System Components
Our proposed system, LAVID, has been designed as a lightweight method implemented on lightweight single-board computers. The idea is to design a low-cost, low-resource consumption system for detecting and geolocating acts of violence in real-time. Our choice fell on a Raspberry Pi board, considering the various strengths it offers. These include, but are not limited to, the following:
- Its low cost makes it the most affordable solution for implementing a distributed system.
- Its large community of users helps to increase knowledge and skills, and exchange technical solutions and publications.
- Its modularity allows it to support a variety of external peripherals and sensors, such as cameras, geolocation devices, edge AI hardware accelerators and Vision Processing Units (VPUs).
- Its versatility enables a wide variety of applications and solutions to be used, as it supports a wide range of operating systems and programming languages, including Python, which is used to implement deep learning algorithms.
We used a Raspberry Pi 4 Model B with 8 GB of RAM, along with a Quimat camera sensor to run our pre-trained model and predict acts of violence occurring in a video scene in real-time. This camera sensor includes an embedded removable IR-CUT filter that enhances the quality of video sequences in both day and night. In addition, to determine the location where the act of violence occurred, we equipped our Raspberry Pi board with a geolocation dongle known as DIYmalls G72 USB GPS. This GPS module utilizes the latest chip (M8130-KT) and delivers location information with high accuracy. Furthermore, the G72 USB GPS is compatible with most operating systems and is plug-and-play when it comes to Linux distributions. Figure 1 illustrates the hardware components of the proposed system.
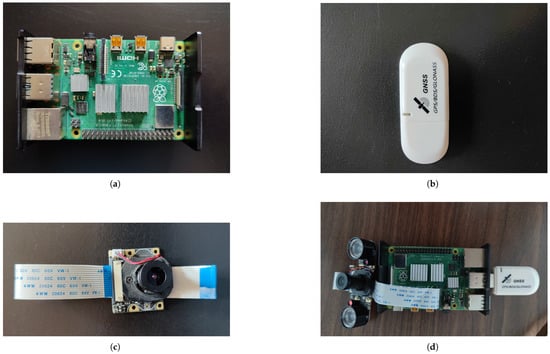
Figure 1.
Our smart system components consisting of a Raspberry Pi 4 Model B with 8 GB of RAM, Quimat camera sensor, and DIYmall usb GPS module. (a) Raspberry Pi 4 board. (b) GPS module. (c) Quimat camera sensor. (d) Our proposed smart violence detection system.
3.2. System Architecture
The LAVID architecture is based on a pre-trained model implemented on Raspberry Pi to run the violence detection process. Figure 2 illustrates the main architecture of the proposed approach. Two phases are involved in this approach: model training and local processing.

Figure 2.
The global architecture for the proposed system two.
3.2.1. Model Training
Among the tools and methods used for image processing, Convolutional Neural Networks (CNNs) are widely utilized and continue to be a dominant tool in the field of computer vision. Their captivating results have motivated researchers to explore their application to various problems, such as object detection and behavior analysis. However, this approach has shown some limitations when applied to videos. A video consists of an ordered sequence of frames. Each frame contains spatial and temporal information. Processing a video to extract the most relevant information requires generating a spatio-temporal representation extracted from each frame. From this perspective, traditional CNNs may not be the optimal solution when used for video processing. While most 3-dimensional Convolutional Neural Network-based methods (3D-CNNs) are computationally expensive and not suitable for real-time violence recognition on lightweight devices, 2D Convolutional Neural Networks (2D-CNNs) are unable to encode temporal information. To address this situation, we present in this study a hybrid method that combines 2D-CNNs for modeling spatial information with a bidirectional long short-term memory network (BiLSTM) for encoding temporal information, as visually explained in Figure 3. Hence, our proposed system, trained bidirectionally, extracts spatio-temporal characteristics while being computationally less expensive. The details are given as follows:
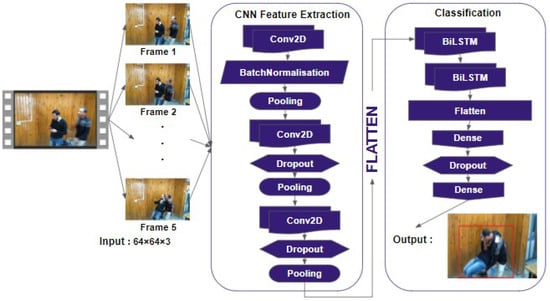
Figure 3.
Architecture of our proposed method using Depthwise Separable convolution combined with BiLSTM.
LAVID consists of three convolutional blocks followed by a BiLSTM network. The first convolutional block contains a Conv2D layer and a MaxPooling layer, and their outputs are normalized using the Batch Normalization method. Subsequently, each of the two remaining convolutional blocks contains a Conv2D layer, Dropout layer, and a MaxPooling layer. The convolutional blocks will learn the feature maps, while the BiLSTM network effectively handles the classification task. Between these two processes, the flatten layer converts the features extracted by the convolutional layers into a one-dimensional tensor that will be fed to the BiLSTM network. The proposed convolutional blocks are based on a depthwise separable convolutional network. Depthwise separable convolutions have been adopted by popular model architectures such as MobileNet [14] and Xception [31]. They split the channel and spatial convolutions that are usually combined in standard convolutional layers. Depthwise separable convolutions are factorable convolutions that consist of depthwise convolution and pointwise convolution. This factorization significantly reduces the model size and computational cost. Depthwise convolution applies convolution independently over each input channel, while pointwise convolution performs a 1 × 1 convolution to convolve over the resulting outputs. As shown in Figure 4, a standard convolution filters and combines inputs into a new set of outputs in one step, while depthwise separable convolution breaks down the process into two simple steps. Suppose that a standard convolutional layer takes data of size as input, where represents the image size (the spatial height and width), and M is the number of input channels (three for an RGB image). Suppose there are N square kernels of size . A typical convolution operation generates an output feature map of size , where represents the height and width of the output feature map G and N is the number of output channels. For the input feature maps F, the convolution kernels K, and the output feature maps G, the standard convolution operation can be defined as follows:
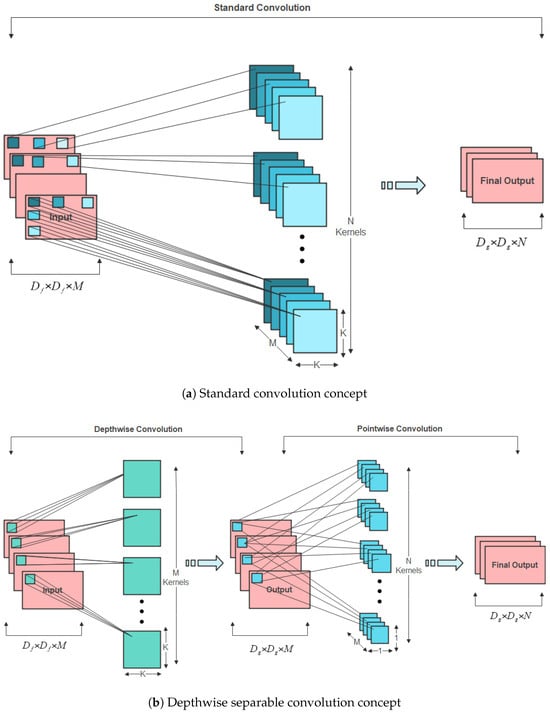
Figure 4.
(a) Standard convolutional neural network and (b) depthwise separable neural network.
The number of multiplications required to process one convolution operation will be . Since there are N filters and each filter slides vertically and horizontally over the input image times, the computational cost of standard convolutions is as follows:
Depthwise separable convolution is a process that involves two operations: depthwise convolutions and pointwise convolutions. Unlike standard convolution, where the convolution process is performed for all M channels simultaneously, depthwise convolution is applied to a single channel at a time. Hence, the kernels will be of size , the output will have a size of , and the computational cost of depthwise convolution is as follows:
However, depthwise convolution does not combine input channels to generate new feature maps. Pointwise convolution, a simple convolution, is then used to create a linear combination of the output of the depthwise layer and generate new features. This operation uses N filters of size and the output size will be . The pointwise convolution cost is:
This combination of depthwise convolution and pointwise convolution forms what is called depthwise separable convolution, which has a lower computational cost as depicted in the equation below:
The ratio of Equations (2) and (5) is shown in the equation below:
Clearly, from the ratio calculations, the parameters and calculations for depthwise separable convolution are only times those for standard convolution. Hence, the main idea behind depthwise separable convolutions is to replace the one-step feature learning handled by regular convolutions with two simpler steps: a spatial feature learning step and a channel combination step. In addition to our chosen convolutional concept, we have computed two simple global hyperparameters that provide an efficient balance between latency and accuracy. The first parameter is the width parameter , which is multiplied with the input and output channels (N and M) to narrow the network for a more refined model. The second parameter is the resolution parameter , which is multiplied by the feature map to adjust the spatial dimensions of the feature maps and the input image. The computational cost and the number of parameters can be reduced quadratically by roughly and . This significantly reduces the number of parameters and calculation time in the final model while generating the output feature maps.
It is not enough to simply generate a feature map using a computationally efficient convolutional network. It is also important to ensure that these feature maps can be efficiently extracted while maintaining the robustness of the model. The limitation of convolutional layers is that their feature map output captures the precise location of the input features.
This implies that slight changes in the feature’s location in the input image will produce a different feature map. Re-cropping, rotating, shifting, and other minor alterations to the supplied image can lead to this issue.
To resolve this situation, a pooling layer is then incorporated into the convolutional blocks. Pooling layers are a crucial part of CNNs. They reduce the computational cost by decreasing the number of parameters to learn and provide basic translation invariance to the internal representation, making the model more robust to variations in the input, such as rotation and object repositioning. Hence, the pooling process increases the predictive power of the model and reduces the spatial dimensions of the input. A block of size H × W, where H represents the block’s height and W its width, slides across the input data during this pooling process. The stride, i.e., the number of steps taken while sliding, is often equal to the pool size, resulting in a reduction in both height and width. We obtain a downsampled outcome by performing this process for each pool. The operation merely entails calculating the maximum value for each block, or “pool”.
The pooling process reduces the computational cost by downsizing the number of learned parameters and provides basic translation invariance to the internal representation, making the model more robust to variations in the input and enhancing its predictive power.
However, optimizing the model in terms of computational cost and parameter number is not the only issue to be addressed. Improving the pre-training time and the model’s ability to withstand various changes and variations is one of the major challenges in designing a robust model. To improve the training speed and address the changing distributions of the input data during the training process, our proposed model utilizes a Batch Normalization method to normalize the layer inputs. By incorporating normalization into the model architecture and applying it to each training mini-batch, Batch Normalization helps us to avoid non-convergence of the model and overcome the phenomenon of Internal Covariate Shift [32]. The model training procedure is significantly impacted by normalizing the inputs to the layer because it drastically reduces the number of epochs needed. This input standardization can be applied to the activations from a hidden layer for deeper levels, or to the input variables for the initial hidden layer. To reduce the network’s sensitivity to weight initialization, we decided to apply Batch Normalization to the input variables in the first Conv2D layer. As a result, Batch Normalization speeds up our training and leads to a higher learning rate while reducing the impact of initialization.
Lastly, even though Batch Normalization may appear to have a regularization effect by reducing the generalization error, it is generally insufficient to be used as an activation regularization technique.
To enhance our model’s performance and regularize its behavior during training, we apply Dropout as a regularization technique [33]. During the training process, some layer outputs are arbitrarily ignored and dropped out. As a result, the layer appears to have a different number of nodes and synapses than the preceding one. During training, the random removal of nodes and synapses is performed using a configurable parameter that determines the probability at which outputs of the layer are retained. In neural networks, a common practice is to use a probability value of 0.5 for retaining the output of each node in hidden layers, while a value close to 1.0 is often used for the input layer. Hence, adding dropout to the convolutional layers has the effect of making the training process noisy. This conceptualization suggests that dropout may disrupt situations where network layers co-adapt to rectify errors from previous layers, thereby enhancing the model’s robustness. Dropout can be used with most types of layers, such as convolutional layers and recurrent ones (e.g., long short-term memory (LSTM) networks). We implemented dropout in our convolutional blocks alongside the BiLSTM network. Thus, we ensure consistency throughout the training process and improve our model’s performance. Finally, the last stage in the development of our violence detection method is frame classification. This classification stage consists of two BiLSTM layers, two dense layers, and one dropout layer. The extracted features from the earlier 2D convolutional blocks are passed through a flatten layer and fed to a bidirectional LSTM network (BiLSTM) to retrieve information in both forward and reverse directions for learning patterns of anomalous activities. A bidirectional long short-term memory (BiLSTM) network is a type of recurrent neural network (RNN) that consists of two long short-term memory (LSTM) networks whose outputs are combined. BiLSTM, which is trained to utilize all available input data from both past and future time frames, helps to overcome the limitations of a standard LSTM. The concept is to divide the state neurons of a conventional LSTM into two sections: forward states, which handle the positive time direction, and backward states, which handle the negative time direction. This processing of sequence data in both forward and backward directions enhances model performance on sequence classification tasks. BiLSTM consists of memory cells that have a gated cell structure. Based on the importance of features, gated cells in the LSTM memory determine whether to store or delete information. Weights are assigned to the significant features during the algorithm’s learning process. Over time, the network learns important features. The input, forget, and output gates constitute an LSTM. When a new input is received, the input gate determines whether to allow it, discard it as unimportant (forget gate), or let it affect the output at the current time step (output gate). The BiLSTM network helps the model capture long-term dependencies in the input sequence while requiring a low-complexity implementation, making it an excellent solution for real-time video processing. The output from the last BiLSTM layer is passed to a dense layer, as illustrated in Figure 3, and the issue of overfitting is circumvented by employing the dropout technique. This technique not only encourages the network to learn more effective features but also enhances the model’s generalization capabilities.
3.2.2. Local Processing
In this phase, we implement our model on a Raspberry Pi single-board computer. This implementation aims to process real-time video streams transmitted by a camera sensor. There are two essential parts in our system implementation: motion detection and violence detection.
Motion Detection
Motion detection is based on the background subtraction method. This technique aims to identify moving entities in a video stream by carefully examining each frame and comparing it with a previously acquired background frame. In this regard, two algorithms from the OpenCV library were selected for this purpose: the absolute difference method and the BackgroundSubtractorMOG2.
Absolute difference method: The absolute difference method [34] assumes that moving areas are significantly different from their previous states. In this method, the current image is subtracted pixel-by-pixel from the previous image, allowing the calculation of the absolute difference between the two images. When the absolute difference exceeds a predefined threshold, a pixel is classified as moving. A major advantage of this method is its conceptual simplicity and ease of application. Nevertheless, it is susceptible to noise and lighting variations, which can lead to incorrect detection.
BackgroundSubtractorMOG2: This algorithm relies on statistical modeling of the image background to isolate moving objects and separate them from the background. It determines the distribution of background pixels by using a Gaussian Mixture Model (GMM) and distinguishes them from moving pixels [35]. In contrast to absolute difference methods, BackgroundSubtractorMOG2 considers lighting variability and can be adjusted to accommodate various lighting conditions. With this approach, background motion is detected efficiently, reducing the impact of noise and lighting changes.
Comparison between the two methods: The key difference between the two techniques lies in their approach to background motion detection. Due to its sensitivity to disturbances such as noise and lighting variations, the absolute difference method is attractive for its simplicity but may lack precision. In contrast, BackgroundSubtractorMOG2 provides more refined background modeling, leading to better adaptation to changing conditions and reducing the occurrences of false positives and false negatives. It may, however, require greater computing power due to its increased complexity.
For our study, we have chosen to utilize the BackgroundSubtractorMOG2 algorithm. Our decision is based on our goal of achieving more accurate and robust background motion detection. Computational complexity was addressed by adopting a depthwise separable convolutional network model. By making this choice, we will achieve the best possible outcomes tailored to the specific context of our application.
Violence Detection
The next phase after motion detection in a real-time video stream is of utmost importance: the violence detection. By using a refined approach that utilizes the visual characteristics of the captured images, this stage aims to identify video sequences where violence may exist. Figure 5 illustrates the process.
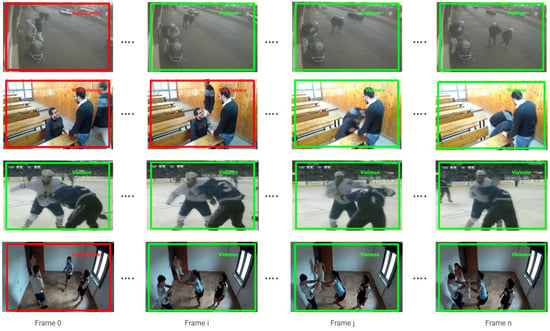
Figure 5.
Violence-extracted sequences (framed in green) and non-violence-extracted sequences (framed in red) using our proposed method DSCNN-BiLSTM.
When the smart cameras start processing video streams, the BachgroundSubtractorMOG2 algorithm is applied. It continuously analyzes images to detect any significant movement. After identifying an activity, a five-second video is captured to provide the necessary context for further analysis.
In the next step, each captured video frame is extracted and resized to create 64 × 64 pixel images, which is an optimal format for further analysis. During this stage, we convert the video into a user-friendly format that captures every important moment.
It is interesting to note that the DSCNN-BiLSTM deep neural network model is being applied to the violence detection phase. This model combines the advantages of depthwise separable convolutional neural networks (DSCNNs) and bidirectional long short-term memory (BiLSTM) in capturing sequential relationships. Its features enable it to detect significant temporal contexts and extract complex visual patterns.
We can predict the presence of violence in each video by applying the previously trained weights of our model to the extracted images from the videos. In the event of violence, the video will be stored in a central database (Central DB) for later analysis. Otherwise, if the video does not contain violent elements, it is saved in the local database (Local DB).
Geolocation and Mapping of Violence Coordinates
Detection of violence is followed by geolocation, which is an essential step. Aiming to determine the geographical coordinates, including longitude and latitude, of the area under surveillance is the purpose of this step. We achieve this by using a USB GPS module, enabling us to collect geospatial data with a high level of accuracy. With these coordinates, we can generate a detailed map of the area in question.
GPS is a Global Positioning System that detects the latitude and longitude of a location on Earth, along with a specified Coordinated Universal Time (UTC). The GPS module plays a central role in our study of the multi-camera surveillance and geolocation system for detecting violence. It receives satellite coordinates at one-second intervals, including time and date. The GPS module sends real-time tracking data in the form of NMEA. The $GPGGA string contains the coordinates, time, and other useful information, as shown in Figure 6. the coordinates can be extracted by counting the commas in the string. The latitude can be found after two commas and the longitude can be found after four commas, as shown in Table 1 [36].
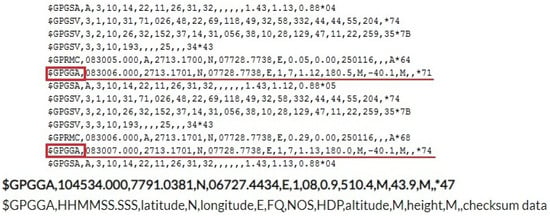
Figure 6.
Sample $GPGGA string with description.

Table 1.
The $GPGGA string description.
The next step involves collecting and integrating the geographical coordinates into a central database. Smart cameras store the geographical coordinates each time a violent act is detected. This process is executed continuously to provide a real-time tracking system. For robust and reliable storage, we selected Firebase, a scalable platform that offers real-time data handling capabilities.
After the data are stored in Firebase’s central database (see Figure 7), we begin the visualization procedure by sending the coordinates to Mapbox, an interactive mapping service. Mapbox processes the coordinates and displays the geolocation in real-time. This live visualization enables the rapid tracking and identification of violent events in monitored areas, and allows effective and faster intervention by the authorities and low enforcement (see Figure 8).
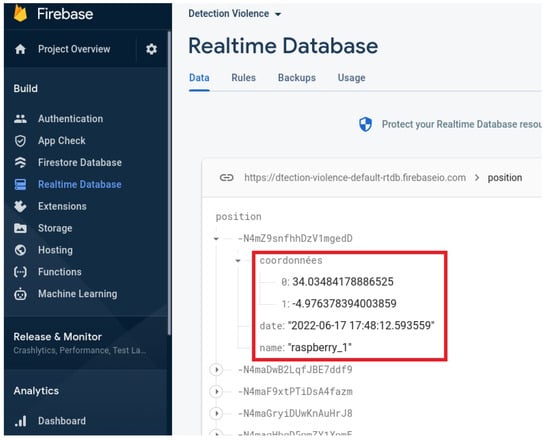
Figure 7.
Data transfer process from the proposed system to the central database (Firebase).
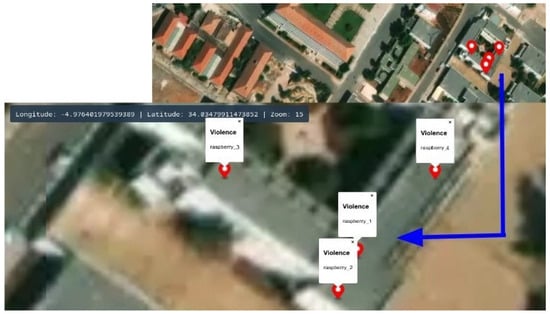
Figure 8.
Geolocation violence process.
Geolocation and visualization together bring a vital dimension to smart surveillance systems. In fact, violent events can be precisely mapped and geolocation data can be securely stored in a database (Firebase). Hence, real-time visual representations can be created to enable proactive and rapid decision-making (see Figure 9).
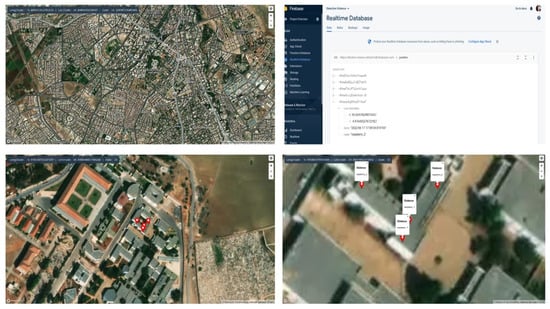
Figure 9.
Geolocation and visualization.
4. Experimental Setup and Results
In this section, we present the results obtained from our experiments to evaluate the performance of our method. To establish a robust context, we will start by presenting the datasets used.
4.1. Implementation Details
Our proposed lightweight smart video-surveillance system consists of a model designed for low-cost single-board computers. To implement the entire system, we loaded our trained model on a Raspberry Pi 4 with 8 GB of RAM and an ARM Cortex-A72 processor running at 1.5 GHz. The effectiveness of our proposed method in identifying violent acts in video sequences was thoroughly assessed experimentally to compare it with other methods proposed in the literature. Our proposed model’s training stages were run on a computer operating on Windows 11. The computer was equipped with an Intel i7-10750H processor running at 2.6 GHz and 16 GB of RAM. NVIDIA GTX 1080 Ti GPU with 6 GB of video memory is utilized for parallel computation. Our designed model was developed using Python (version 3.9), TensorFlow (version 2.10) on the backend, and Keras (version 2.10) as a powerful deep learning API. As an optimizer, we utilized Adam with a batch size of 100. Our model is trained with 150 epochs using a callback method called EarlyStopping. This callback, which has several arguments, helps to stop training when a monitored metric has ceased to improve. We set the monitored metric argument to “loss” and “patience argument”, which determines the number of epochs without improvement before training is terminated to 4. Hence, at the end of each epoch, we check to see if the loss is still decreasing, considering the patience value. The training is stopped once it is determined that it is no longer decreasing after four successive epochs.
During deployment, LAVID processes diverse video sequences with varying durations (ranging from 1 to 5 s) on the Raspberry Pi 4, extracting 5 frames per video at a resolution of 64 × 64. The system achieves a latency of 32 ms per frame, a processing frame rate of 31.25 fps, and a total execution time of 160 ms per video, making it suitable for real-time violence detection.
4.2. Dataset
Due to heterogeneity of the existing violence detection datasets, it is still challenging to assess a method across them all. Thus, to evaluate the effectiveness of our violence detection model, we tested our proposed method using consistent datasets, such as Hockey Fights, Violent Crowd, RLVS, and RWF-2000. This approach allowed us to validate the performance of our method across various scenarios and compare it with existing methods.
- Nievas et al. presented two video datasets for violence detection, namely, Hockey Fights and Movies Fights [37]. The Hockey Fights dataset comprises 1000 short video clips captured from National Hockey League games. Each clip consists of approximately 50 frames with a resolution of 360 × 288 pixels. The clips primarily showcase close-up footage of fights between players. The dataset presents various challenges for detection models, including diverse viewpoints, camera movement, and the variety of individuals involved in each violence clip.The Movies Fights dataset includes 200 short video clips showcasing 100 person-on-person fights. This collection also contains 100 non-fight scenarios showcasing various sports footage and samples from the Weizmann action recognition dataset. Each sequence consists of around 50 frames with a resolution of 720 × 480, although some have a resolution of 720 × 576. Movies Fights offers a wider variety of scenes but may be impacted by interlacing artifacts.
- Hassner et al. introduced the Violent Crowd [38] dataset, which comprises 246 short video sequences from YouTube depicting various settings like football stadiums, bars, and demonstrations. The videos capture indoor and outdoor areas using both stationary and mobile cameras, with an image resolution of 320 × 240 and varying video lengths ranging from 50 to 150 frames. Challenges in this dataset include image quality issues such as compression artifacts, motion blur, text overlay, flashlights, and differing temporal resolutions, which make accurate extraction of motion information challenging.
- Soliman et al. presented the RLVS-2000 [5] dataset, which includes 1000 violence and 1000 non-violence videos depicting real-life situations sourced from YouTube videos and other sources. The dataset features various real street fight scenarios in different environments and conditions, while the non-violence videos encompass diverse human actions, such as sports, eating, walking, and more.
- Cheng et al. developed a new dataset called the RWF-2000 [39], comprising 2000 videos recorded by surveillance cameras in real-world settings. Each video has a duration of 5 s, with half of the videos depicting violent behaviors and the remaining videos showcasing non-violent actions. A few samples from each dataset were visually displayed in Figure 10, Figure 11, Figure 12 and Figure 13, while Table 2 presents a statistical overview of each dataset used in the evaluation of our proposed model.
 Figure 10. A few pictures from the Violent Crowd dataset.
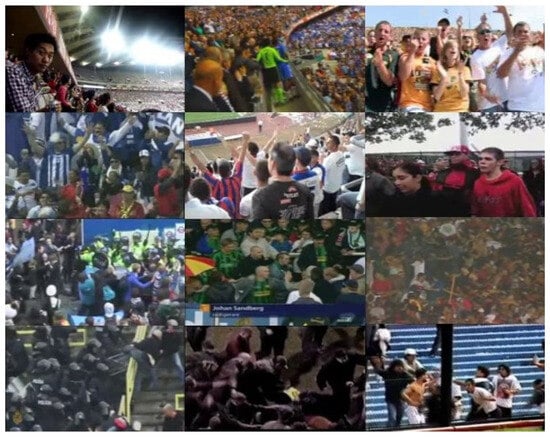 Figure 11. A few pictures from the Hockey Fights dataset.
 Figure 12. A few pictures from the RLVS-2000 dataset.
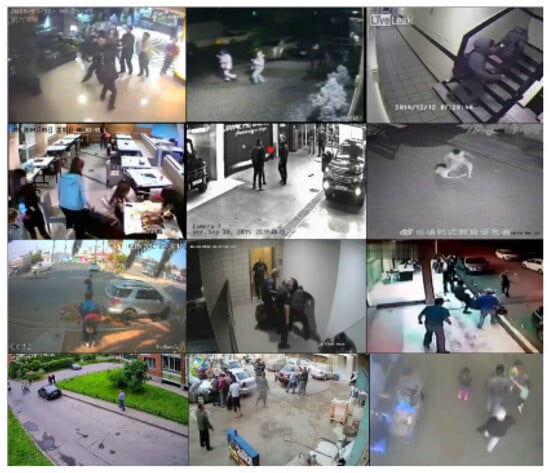 Figure 13. A few pictures from the RWF-2000 dataset.
 Table 2. Statistical details of datasets used in the evaluation of our proposed model.
4.3. Results
As part of our efforts to ensure the reliability of our model, we took some important steps. For both sets of training data, we utilized data augmentation techniques. We applied transformations such as rotation, horizontal and vertical shifts, zooming, and horizontal flipping randomly to the videos. These variations in the data enabled our model to learn to recognize different perspectives and variations from the original videos.
To enhance the efficiency of our proposed system, we implemented the DSCNN-BiLSTM architecture. This architecture consists of several layers designed for violence detection. Model optimization was performed using the Adam optimizer and binary cross-entropy loss functions. To mitigate overfitting, we employed early termination criteria during the training process. Furthermore, we used an image generator to train our model with augmented data. We conducted a convergence assessment by monitoring training and validation metrics across multiple epochs.
To evaluate LAVID, we divided the Hockey Fight, Violent Crowd, Real-word-Fighting (RWF-2000), and Real-life violence situations (RLVS) datasets into two parts: 70% for model training and 30% for testing. This approach enabled us to achieve significant results in terms of our model’s ability to generalize new data.
To evaluate the effectiveness of our proposed violence detection model, we utilized several important performance metrics that provide insight into its prediction abilities. These include the confusion matrix, accuracy, precision, recall, and F1-score. The results of these metrics demonstrate the effectiveness of our model on the four datasets during the validation stage. For example, in the Hockey Fight, we observed a validation accuracy of 80.83% at the beginning of epoch 1, with a validation loss of 19.4537. For training, accuracy increased steadily to reach 95.17% at the end of epoch 31, with a validation loss of 0.2110. These results demonstrate our model’s capability to effectively capture the nuances present in the Hockey Fights dataset, highlighting its successful generalization (see Figure 14). Regarding the Violent Crowd dataset, our model demonstrated its capability to efficiently learn relevant features. Despite starting with a validation accuracy of 53.40% and a validation loss of 22.0369, we observed significant improvement as training progressed. The accuracy reached 96.60% by the end of epoch 50, and the validation loss was reduced to 0.1387. These results demonstrate the adaptability of our model in handling complex and diverse data, highlighting its capability to extract pertinent information even in challenging scenarios (see Figure 14).
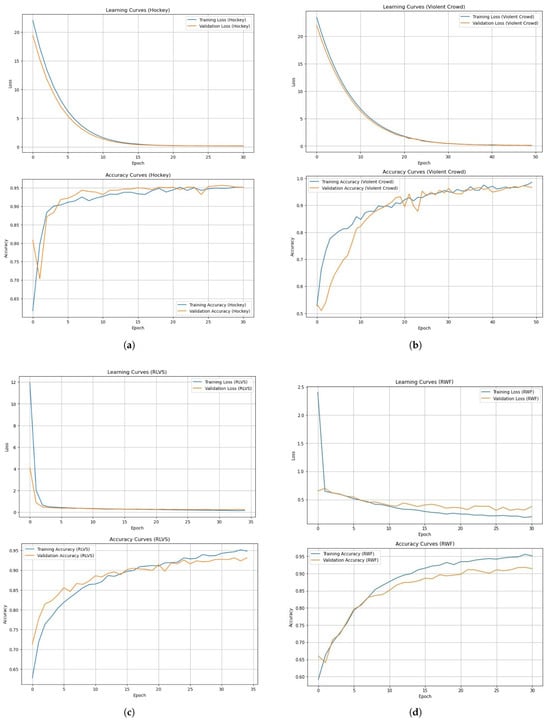
Figure 14.
Detailed accuracy analysis for each of the four used datasets over training epochs. (a) Accuracy obtained from the Hockey Fights dataset. (b) Accuracy obtained from the Violent Crowd dataset. (c) Accuracy obtained from the RLVS dataset. (d) Accuracy obtained from the RWF-2000 dataset.
Regarding the RLVS dataset, our model also yielded promising results. Despite starting with a validation accuracy of 71.36% and a validation loss of 4.1336, we observed a steady improvement in accuracy, which reached 93.16% at the end of epoch 35, accompanied by a significant decrease in validation loss to 0.2378. These results highlight the ability of our model to adapt to the RLVS dataset and improve its performance for training, reinforcing its ability to generalize effectively (see Figure 14). Finally, on the RWF dataset, our model maintained impressive performance consistently during training. Despite an initial validation accuracy of 66.70% and a validation loss of 0.6375, our model continued to improve progressively, reaching an accuracy of 90.93% at the end of epoch 24, with a decreased validation loss of 0.3146. These results illustrate the ability of our model to understand the RWF dataset in-depth, underlining its robustness and ability to extract relevant information in complex contexts (see Figure 14). For the testing stage, we evaluated our proposed method for each dataset to compare it with the state-of-the-art methods. The results are summarized in Table 3 below.

Table 3.
Performance metrics of our model tested on several state-of-the-art datasets.
After analyzing metrics such as accuracy, precision, recall, and F1-score for each dataset, we will now examine the confusion matrix of each dataset in detail to gain a more comprehensive understanding of the model’s performance in detecting violence. In the Hockey Fights dataset, for example, we can observe that the classifier correctly identified 286 examples as “Non-violent” (TN) and 286 examples as “Violent” (TP). Nonetheless, there were instances where the classifier erred, including 12 cases classified as “Non-violent” when they should have been classified as “Violent” (FN). Furthermore, 16 examples were incorrectly classified as “Violent” when they were actually “Non-violent” (FP) as shown in Figure 15. Although the classifier managed to correctly predict a number of examples, the confusion matrix indicates that the model is capable of correctly classifying most scenes, despite a few misclassified examples to improve on, proving its effectiveness for this task.
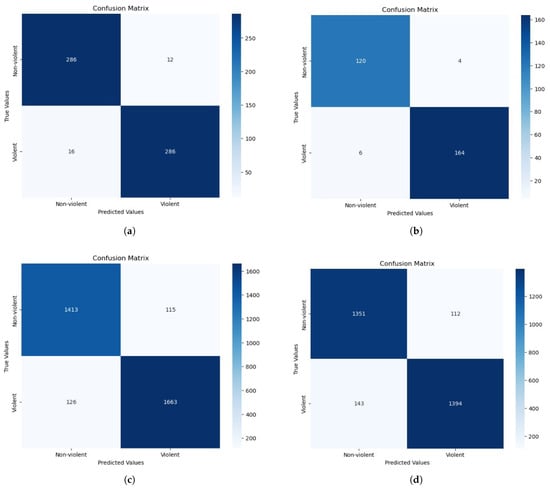
Figure 15.
Visual representation of the confusion matrix over each dataset. (a) Confusion matrix for Hockey Fights dataset. (b) Confusion matrix for Violent Crowd dataset. (c) Confusion matrix for RLVS dataset. (d) Confusion matrix for RWF dataset.
The confusion matrix of the Violent Crowd dataset, as depicted in Figure 15, demonstrates that the classifier has produced satisfactory results. With proper classification, the classifier identified 120 samples as “Non-violent” (TN) and 164 samples as “Violent” (TP). Nevertheless, four samples that should have been categorized as “Violent” (FN) were mistakenly labeled as “Non-violent”. Moreover, six examples that belonged in the “Non-violent” (FP) category were mistakenly assigned to the “Violent” category.
Regarding the next dataset RLVS, we can observe that the classifier correctly classified 1663 examples of violent behavior as “Violent” (TP), while 1413 instances are classified as “Non-violent” (TN). Nevertheless, 115 instances were mistakenly classified as “Non-violent” when they should have been categorized as “Violent” (FN), and 126 instances were classified as “Violent” when they should have been classified as “Non-violent” (FP) (see Figure 15).
Finally, in the confusion matrix obtained for the RWF-2000 dataset, we can observe that the classifier correctly identified 1351 examples as “Non-violent” (TN) and 1394 examples as “Violent” (TP). Nonetheless, there were instances where the classifier erred, including 112 cases classified as “Non-violent” when they actually should have been classified as “Violent” (FN). Furthermore, 143 examples were incorrectly classified as “Violent” when they were actually “Non-violent” (FP), as shown in Figure 15. The classifier consistently yielded good results, with a high number of true positives and true negatives, as indicated by the analysis of the confusion matrices for the four datasets: Hockey Fights, Violent Crowd, RLVS, and RWF-2000. Though false positives and false negatives can be found in all datasets, there are some misclassification cases.
4.4. Cost Analysis
Automated video-surveillance systems offer promising benefits, but also face several limitations, especially in terms of cost and resource consumption. To overcome these limits, we have proposed a distributed video-surveillance network made up of nodes where each node compromises a lightweight smart camera that integrates a Raspberry Pi board with a local database linked to a camera sensor. The nodes are linked by a 5G connection and synchronize with the other nodes in their databases by adding the new detections.
In order to compare the two architectures, we have chosen an airport setting to calculate the financial, time, and bandwidth costs required for such a system and compared them with a centralized video-surveillance system using benchmarks to estimate the different costs and resources for the centralized architecture [40,41,42,43,44], and we were inspired by the work of Mali et al. [45] to calculate our effective cost using our proposed system parameters. The chosen scenario involves monitoring an airport with 50 zones () (e.g., boarding halls, security checkpoints, terminals), where each zone is covered by one camera, detecting an average of 100 people every 5 min (). Table 4 resumes the general assumptions for this study.

Table 4.
System parameters.
The total cost per distributed node () can be determined through the following formula:
where , , , and represent the hardware cost of the Raspberry Pi 4B (8 GB RAM), Quimat camera module HD, local storage (microSD 128 GB), and 5G module (Quectel RM502Q-AE), respectively. The total cost to cover all the 50 zones can be calculated as follows:
For the centralized system, which comprises a central server (GPU, 64 GB RAM, SSD) with a 5G IP camera, the total cost is the sum of all the 5G IP camera costs and the server cost, represented as follows:
where , , represent the cost of the 5G IP camera, the central server cost and the total system cost, respectively.
Correspondingly, based on the computational data of our proposed system, the bandwidth consumption of the metadata transmission task (10 KB per detection since we only exchange new detections between nodes) per zone every 5 min and total bandwidth required for the 50 monitored zones are calculated as follows:
As for the centralized system, the necessary bandwidth to transmit a 5 Mbps video of each IP camera for the 50 zones is computed as:
Adding the necessary bandwidth to transmit the violence detection frames (5 s clips):
Consequently, the total bandwidth for the centralized system is calculated as follows:
Moving to our proposed distributed system processing time and latency , the formulas below show the results correspondingly:
As for the centralized system, the processing time and latency are calculated as follows:
The Table 5 summarizes the comparative results of the proposed distributed system and a centralized one:

Table 5.
Final comparison of distributed vs. centralized surveillance systems.
The results show that the distributed system has significant advantages in terms of bandwidth efficiency, time processing, and scalability, requiring only 1.33 Mbps compared to 254.17 Mbps for the centralized system and 10 ms less processing time. Accordingly, the distributed approach is recommended for real-time applications where the bandwidth is limited.
4.5. Discussion
In this section of the study, we compare the results obtained from our approach with those of recent studies using four datasets: Hockey Fights, Violent Crowd, RLVS, and RWF-2000, as illustrated in Table 6. Our focus is on accuracy as it is the most widely used evaluation metric for comparing model performances in this field.

Table 6.
Comparison of our proposed model (DSCNN-BiLSTM) with existing studies in terms of accuracy across four datasets and number of parameters.
For the Hockey Fights dataset, we compare our DSCNN-BiLSTM approach with other state-of-the-art methods. Deep learning-based approaches generally outperform manual feature-based approaches. For example, Hassner et al. [38] proposed the Vif descriptor for feature extraction and utilized a linear SVM for classification, achieving an accuracy of 82.90%. Gao et al. [46] combined their new OViF descriptor with ViF and utilized an SVM+AdaBoost as a classifier, achieving an accuracy of 87.50%, which surpassed that of ViF alone. Serrano et al. [50] proposed an approach that combines manual features with deep learning using Hough Forest + 2D CNN, achieving an accuracy of 94.60%. Our DSCNN-BiLSTM architecture outperforms these traditional approaches. Although the FightCNN + BiLSTM + attention approach by Akti et al. [51] achieves an accuracy of 95.00%, our method achieved an accuracy of 95.33%, which is a slight difference of 0.3% compared to the Akti et al. approach, but demonstrates its superiority in violence detection over the Hockey Fights dataset. For the Violent Crowd dataset, approaches based on classical methods, such as ViF [38] and OViF [46], achieved accuracies of 81.30% and 88.00%, respectively. These results are inferior to those of approaches based on deep learning, which extract relevant features from the data more efficiently. Indeed, the Flow Gated Network [39], which combines 3D CNN and optical flow, achieved an accuracy of 88.87%. Song et al. utilized 3D convolutional networks and achieved an accuracy of 94.30%, demonstrating a slight difference of 0.2% compared to the Flow Gated Network. Su et al. [54], with their SPIL approach based on interactions between points on the human skeleton to extract spatio-temporal features, achieved an accuracy rate of 94.50%. Our DSCNN-BiLSTM approach outperforms all of these methods on the Violent Flow dataset, achieving an accuracy of 96.59%.
For the RLVS dataset, methods that combine transfer learning and LSTM have shown promising results. Indeed, CNN+LSTM [48] achieved an accuracy of 92.00%, while DenseNet121+LSTM [56] achieved an accuracy of 92.05%. In our approach, we opted to use bidirectional long short-term memory (BiLSTM) to better capture the spatio-temporal information in both directions. This enabled us to achieve an accuracy of 92.73%, slightly outperforming other approaches. On the RWF-2000 dataset, several methods have been proposed for detecting violence. Aldahoul et al. [57] achieved an accuracy of 73.35% with their CNN+LSTM approach. Another approach utilizing a MobileNetV2 pre-trained model with LSTM, as suggested by Romas et al. [58], achieved an accuracy of 82%. Choqueluque-Roman et al. [60] proposed a Fast R-CNN architecture to extract spatio-temporal information, achieving an accuracy of 88.71%. In comparison, our DSCNN-BiLSTM approach achieved 91.06% accuracy on the RWF-2000 dataset.
By evaluating our model in terms of the number of parameters, after comparing its accuracy to that of existing approaches, we observe remarkable efficiency. With only 0.57 million parameters, LAVID stands out for its lightweight design compared to heavier models such as Fast-RCNN-style [60] (>30 M), ConvLSTM [52] (9.6 M), and FightCNN + BiLSTM + attention [51] (9 M), reducing the number of parameters by 16 to over 50 times while surpassing their accuracy. Compared to intermediate models like MobileNet + LSTM [58] (4.074 M) and VD-Net [59] (4.4 M), LAVID uses approximately 7 to 8 times fewer parameters while delivering superior accuracy (91.06% vs. 82.0% on RWF for MobileNet + LSTM). When compared to the lightest model, Flow Gated Network [39] (0.27 M), LAVID doubles the number of parameters but significantly improves accuracy (91.06% vs. 87.25% on RWF). These results highlight the superiority of our LAVID approach over existing methods. Indeed, the performance achieved on the four datasets (Hockey Fights, Violent Crowd, RLVS, and RWF-2000) demonstrates that LAVID outperforms all current methods in terms of violence detection in videos, combining high accuracy with exceptional computational efficiency.
5. Conclusions
In this research, we propose a distributed lightweight system capable of detecting and geolocating acts of violence occurring in a monitored area. Our proposed system, comprising intelligent cameras, consists of a Raspberry Pi board paired with a Quimat camera sensor for real-time video recording. Additionally, it utilizes a DIYmalls G72 USB GPS to transmit the geolocation data of each smart camera. The cameras run a lightweight deep learning model.
In the experimental analysis, our proposed model delivers outstanding results, demonstrating competitive performance and significantly reducing the number of parameters compared to several state-of-the-art methods on most benchmark datasets. The way we have constructed our model, utilizing depthwise separable neural networks followed by BiLSTM networks, makes it potentially lightweight and energy-efficient. This design is ideal for implementation in low-cost, lightweight embedded devices and for real-time violence detection scenarios. Although our proposed system has potential benefits in monitoring and detecting violence, it must overcome several technical, ethical, and operational challenges to be fully effective. Optimizing the proposed system to handle these limitations will require careful consideration of the hardware, algorithms, communication infrastructure, power requirements, and privacy concerns. In our future work, we intend to enhance our system’s performance and processing speed by integrating a compact AI accelerator. In addition, we aim to enhance the utilization of distributed architecture and edge computing by improving communication between smart cameras to effectively monitor objects and events and harness the power of massive data more effectively by automating the review process of video footage.
6. Patents
The work reported in this manuscript is part of our patent on autonomous distributed video surveillance for real-time event detection and monitoring, which is now recognized worldwide and can be consulted under the publication number “WO2022260505A1” or using the following link: https://patents.google.com/patent/WO2022260505A1 (accessed on 1 January 2025).
Author Contributions
Conceptualization, M.A. and H.S.; methodology, M.A., H.S. and A.A.; software, M.A. and H.S.; validation, M.A., H.S. and A.A.; formal analysis, M.A., H.S. and A.A.; investigation, M.A., H.S., A.A., H.T. and H.Q.; resources, M.A., H.S. and A.A.; data curation, M.A. and H.S.; writing—original draft preparation, M.A. and H.S.; writing—review and editing, M.A., H.S. and A.A.; visualization, M.A., H.S., A.A., H.T. and H.Q.; supervision, A.A., H.T. and H.Q.; project administration, M.A., H.S., A.A., H.T. and H.Q. All authors have read and agreed to the published version of the manuscript.
Funding
This research received no external funding.
Data Availability Statement
The original contributions presented in this study are included in the article. Further inquiries can be directed to the corresponding author.
Conflicts of Interest
The authors declare no conflicts of interest.
References
- Singh, V.; Singh, S.; Gupta, P. Real-Time Anomaly Recognition Through CCTV Using Neural Networks. Procedia Comput. Sci. 2020, 173, 254–263. [Google Scholar] [CrossRef]
- Ullah, F.U.M.; Obaidat, M.S.; Ullah, A.; Muhammad, K.; Hijji, M.; Baik, S.W. A Comprehensive Review on Vision-Based Violence Detection in Surveillance Videos. ACM Comput. Surv. 2023, 55, 200:1–200:44. [Google Scholar] [CrossRef]
- Mumtaz, N.; Ejaz, N.; Habib, S.; Mohsin, S.M.; Tiwari, P.; Band, S.S.; Kumar, N. An overview of violence detection techniques: Current challenges and future directions. Artif. Intell. Rev. 2023, 56, 4641–4666. [Google Scholar] [CrossRef]
- Zahrawi, M.; Shaalan, K. Improving video surveillance systems in banks using deep learning techniques. Sci. Rep. 2023, 13, 7911. [Google Scholar] [CrossRef]
- Soliman, M.M.; Kamal, M.H.; El-Massih Nashed, M.A.; Mostafa, Y.M.; Chawky, B.S.; Khattab, D. Violence Recognition from Videos using Deep Learning Techniques. In Proceedings of the 2019 Ninth International Conference on Intelligent Computing and Information Systems (ICICIS), Cairo, Egypt, 8–10 December 2019; pp. 80–85. [Google Scholar] [CrossRef]
- Khan, S.U.; Haq, I.U.; Rho, S.; Baik, S.W.; Lee, M.Y. Cover the Violence: A Novel Deep-Learning-Based Approach Towards Violence-Detection in Movies. Appl. Sci. 2019, 9, 4963. [Google Scholar] [CrossRef]
- Leroux, S.; Li, B.; Simoens, P. Multi-branch Neural Networks for Video Anomaly Detection in Adverse Lighting and Weather Conditions. In Proceedings of the 2022 IEEE/CVF Winter Conference on Applications of Computer Vision (WACV), Waikoloa, HI, USA, 3–8 January 2022; pp. 3027–3035, ISSN: 2642-9381. [Google Scholar] [CrossRef]
- Shuang, K.; Lyu, Z.; Loo, J.; Zhang, W. Scale-balanced loss for object detection. Pattern Recognit. 2021, 117, 107997. [Google Scholar] [CrossRef]
- Deng, J.; Dong, W.; Socher, R.; Li, L.J.; Li, K.; Fei-Fei, L. ImageNet: A large-scale hierarchical image database. In Proceedings of the 2009 IEEE Conference on Computer Vision and Pattern Recognition, Miami, FL, USA, 20–25 June 2009; pp. 248–255, ISSN: 1063-6919. [Google Scholar] [CrossRef]
- Lin, T.Y.; Maire, M.; Belongie, S.; Hays, J.; Perona, P.; Ramanan, D.; Dollár, P.; Zitnick, C.L. Microsoft COCO: Common Objects in Context. In Proceedings of the Computer Vision—ECCV 2014; Fleet, D., Pajdla, T., Schiele, B., Tuytelaars, T., Eds.; Springer: Cham, Switzerland, 2014; pp. 740–755. [Google Scholar] [CrossRef]
- Lejmi, W.; Khalifa, A.B.; Mahjoub, M.A. Challenges and Methods of Violence Detection in Surveillance Video: A Survey. In Proceedings of the Computer Analysis of Images and Patterns; Vento, M., Percannella, G., Eds.; Springer: Cham, Switzerland, 2019; pp. 62–73. [Google Scholar] [CrossRef]
- Kaur, G.; Singh, S. Violence Detection in Videos Using Deep Learning: A Survey. In Advances in Information Communication Technology and Computing, Proceedings of the Advances in Information Communication Technology and Computing; Goar, V., Kuri, M., Kumar, R., Senjyu, T., Eds.; Springer: Singapore, 2022; pp. 165–173. [Google Scholar] [CrossRef]
- Ullah, F.U.M.; Ullah, A.; Muhammad, K.; Haq, I.U.; Baik, S.W. Violence Detection Using Spatiotemporal Features with 3D Convolutional Neural Network. Sensors 2019, 19, 2472. [Google Scholar] [CrossRef]
- Howard, A.G.; Zhu, M.; Chen, B.; Kalenichenko, D.; Wang, W.; Weyand, T.; Andreetto, M.; Adam, H. MobileNets: Efficient Convolutional Neural Networks for Mobile Vision Applications. arXiv 2017. [Google Scholar] [CrossRef]
- Kang, M.S.; Park, R.H.; Park, H.M. Efficient Spatio-Temporal Modeling Methods for Real-Time Violence Recognition. IEEE Access 2021, 9, 76270–76285. [Google Scholar] [CrossRef]
- Sahay, K.B.; Balachander, B.; Jagadeesh, B.; Anand Kumar, G.; Kumar, R.; Rama Parvathy, L. A real time crime scene intelligent video surveillance systems in violence detection framework using deep learning techniques. Comput. Electr. Eng. 2022, 103, 108319. [Google Scholar] [CrossRef]
- Gracia, I.S.; Suarez, O.D.; Garcia, G.B.; Kim, T.K. Fast Fight Detection. PLoS ONE 2015, 10, e0120448. [Google Scholar] [CrossRef]
- Wang, G.; Ding, H.; Duan, M.; Pu, Y.; Yang, Z.; Li, H. Fighting against terrorism: A real-time CCTV autonomous weapons detection based on improved YOLO v4. Digit. Signal Process. 2023, 132, 103790. [Google Scholar] [CrossRef]
- Redmon, J.; Divvala, S.; Girshick, R.; Farhadi, A. You Only Look Once: Unified, Real-Time Object Detection. In Proceedings of the 2016 IEEE Conference on Computer Vision and Pattern Recognition (CVPR), Las Vegas, NV, USA, 27–30 June 2016; pp. 779–788, ISSN: 1063-6919. [Google Scholar] [CrossRef]
- Redmon, J.; Farhadi, A. YOLO9000: Better, Faster, Stronger. In Proceedings of the 2017 IEEE Conference on Computer Vision and Pattern Recognition (CVPR), Honolulu, HI, USA, 21–26 July 2017; pp. 6517–6525, ISSN: 1063-6919. [Google Scholar] [CrossRef]
- Redmon, J.; Farhadi, A. YOLOv3: An Incremental Improvement. arXiv 2018. [Google Scholar] [CrossRef]
- Elhanashi, A.; Saponara, S.; Dini, P.; Qinghe, Z.; Morita, D.; Raytchev, B. An integrated and real-time social distancing, mask detection, and facial temperature video measurement system for pandemic monitoring. J. Real-Time Image Process. 2023, 20, 95. [Google Scholar] [CrossRef]
- Olmos, R.; Tabik, S.; Herrera, F. Automatic handgun detection alarm in videos using deep learning. Neurocomputing 2018, 275, 66–72. [Google Scholar] [CrossRef]
- Hosang, J.; Benenson, R.; Dollár, P.; Schiele, B. What Makes for Effective Detection Proposals? IEEE Trans. Pattern Anal. Mach. Intell. 2016, 38, 814–830. [Google Scholar] [CrossRef]
- Ren, S.; He, K.; Girshick, R.; Sun, J. Faster R-CNN: Towards Real-Time Object Detection with Region Proposal Networks. IEEE Trans. Pattern Anal. Mach. Intell. 2017, 39, 1137–1149. [Google Scholar] [CrossRef]
- Durham, R.; Wilkinson, P. Joker: How ‘entertaining’ films may affect public attitudes towards mental illness—Psychiatry in movies. Br. J. Psychiatry 2020, 216, 307. [Google Scholar] [CrossRef]
- Li, Z.; Liu, X.; Zhang, S. Shot Boundary Detection based on Multilevel Difference of Colour Histograms. In Proceedings of the 2016 First International Conference on Multimedia and Image Processing (ICMIP), Bandar Seri Begawan, Brunei, 1–3 June 2016; pp. 15–22. [Google Scholar] [CrossRef]
- Rezazadegan Tavakoli, H.; Rahtu, E.; Heikkilä, J. Fast and Efficient Saliency Detection Using Sparse Sampling and Kernel Density Estimation. In Image Analysis; Heyden, A., Kahl, F., Eds.; Springer: Berlin/Heidelberg, Germany, 2011; pp. 666–675. [Google Scholar] [CrossRef]
- Imah, E.M.; Laksono, I.K.; Karisma, K.; Wintarti, A. Detecting violent scenes in movies using Gated Recurrent Units and Discrete Wavelet Transform. Regist. J. Ilm. Teknol. Sist. Inf. 2022, 8, 94–103. [Google Scholar] [CrossRef]
- Zhang, D. Wavelet Transform. In Fundamentals of Image Data Mining: Analysis, Features, Classification and Retrieval; Zhang, D., Ed.; Springer International Publishing: Cham, Switzerland, 2019; pp. 35–44. [Google Scholar] [CrossRef]
- Chollet, F. Xception: Deep Learning with Depthwise Separable Convolutions. In Proceedings of the 2017 IEEE Conference on Computer Vision and Pattern Recognition (CVPR), Honolulu, HI, USA, 21–26 July 2017; pp. 1800–1807, ISSN: 1063-6919. [Google Scholar] [CrossRef]
- Ioffe, S.; Szegedy, C. Batch normalization: Accelerating deep network training by reducing internal covariate shift. In Proceedings of the 32nd International Conference on International Conference on Machine Learning, ICML’15, Lille, France, 6–11 July 2015; Volume 37, pp. 448–456. [Google Scholar]
- Srivastava, N.; Hinton, G.; Krizhevsky, A.; Sutskever, I.; Salakhutdinov, R. Dropout: A simple way to prevent neural networks from overfitting. J. Mach. Learn. Res. 2014, 15, 1929–1958. [Google Scholar]
- Youssef, K.; Woo, P.Y. Difference of the Absolute Differences—A New Method for Motion Detection. Int. J. Intell. Syst. Appl. 2012, 4, 1–14. [Google Scholar] [CrossRef]
- Rakesh, S.; Hegde, N.P.; Venu Gopalachari, M.; Jayaram, D.; Madhu, B.; Hameed, M.A.; Vankdothu, R.; Suresh Kumar, L. Moving object detection using modified GMM based background subtraction. Meas. Sensors 2023, 30, 100898. [Google Scholar] [CrossRef]
- Odunlade, E. Raspberry Pi GPS Module Interfacing Tutorial. 2017. Available online: https://circuitdigest.com/microcontroller-projects/raspberry-pi-3-gps-module-interfacing (accessed on 15 March 2025).
- Bermejo Nievas, E.; Deniz Suarez, O.; Bueno García, G.; Sukthankar, R. Violence Detection in Video Using Computer Vision Techniques. In Proceedings of the Computer Analysis of Images and Patterns; Real, P., Diaz-Pernil, D., Molina-Abril, H., Berciano, A., Kropatsch, W., Eds.; Springer: Berlin/Heidelberg, Germany, 2011; pp. 332–339. [Google Scholar] [CrossRef]
- Hassner, T.; Itcher, Y.; Kliper-Gross, O. Violent flows: Real-time detection of violent crowd behavior. In Proceedings of the 2012 IEEE Computer Society Conference on Computer Vision and Pattern Recognition Workshops, Providence, RI, USA, 16–21 June 2012. ISSN: 2160-7516. [Google Scholar] [CrossRef]
- Cheng, M.; Cai, K.; Li, M. RWF-2000: An Open Large Scale Video Database for Violence Detection. In Proceedings of the 2020 25th International Conference on Pattern Recognition (ICPR), Milan, Italy, 10–15 January 2021; pp. 4183–4190, ISSN: 1051-4651. [Google Scholar] [CrossRef]
- Gedel, I.A.; Nwulu, N.I. Low Latency 5G Distributed Wireless Network Architecture: A Techno-Economic Comparison. Inventions 2021, 6, 11. [Google Scholar] [CrossRef]
- Shariati, B.; Velasco, L.; Pedreno-Manresa, J.J.; Dochhan, A.; Casellas, R.; Muqaddas, A.; Gonzalez de Dios, O.; Luque Canto, L.; Lent, B.; Lopez de Vergara, J.E.; et al. Demonstration of latency-aware 5G network slicing on optical metro networks. J. Opt. Commun. Netw. 2022, 14, A81–A90. [Google Scholar] [CrossRef]
- Safe and Sound Security. CCTV Camera Installation Cost: 2024 Price Guide. 2024. Available online: https://getsafeandsound.com/blog/surveillance-camera-installation-cost/ (accessed on 15 March 2025).
- Cisco Networking, Security, Collaboration, and Cloud Solutions. 2025. Available online: https://www.cisco.com/ (accessed on 15 March 2025).
- Axis Communications Security Cameras and Video Surveillance Solutions. 2025. Available online: https://www.axis.com/ (accessed on 15 March 2025).
- Mali, J.; Atigui, F.; Azough, A.; Travers, N.; Ahvar, S. How to Optimize the Environmental Impact of Transformed NoSQL Schemas through a Multidimensional Cost Model? arXiv 2023. [Google Scholar] [CrossRef]
- Gao, Y.; Liu, H.; Sun, X.; Wang, C.; Liu, Y. Violence detection using Oriented VIolent Flows. Image Vis. Comput. 2016, 48–49, 37–41. [Google Scholar] [CrossRef]
- Sharma, M.; Baghel, R. Video Surveillance for Violence Detection Using Deep Learning. In Proceedings of the Advances in Data Science and Management; Borah, S., Emilia Balas, V., Polkowski, Z., Eds.; Springer: Singapore, 2020; pp. 411–420. [Google Scholar] [CrossRef]
- Moaaz, M.M.; Mohamed, E.H. Violence Detection In Surveillance Videos Using Deep Learning. FCI-H Inform. Bull. 2020, 2, 1–6. [Google Scholar] [CrossRef]
- Dong, Z.; Qin, J.; Wang, Y. Multi-stream Deep Networks for Person to Person Violence Detection in Videos. In Proceedings of the Pattern Recognition; Tan, T., Li, X., Chen, X., Zhou, J., Yang, J., Cheng, H., Eds.; Springer: Singapore, 2016; pp. 517–531. [Google Scholar] [CrossRef]
- Serrano, I.; Deniz, O.; Espinosa-Aranda, J.L.; Bueno, G. Fight Recognition in Video Using Hough Forests and 2D Convolutional Neural Network. IEEE Trans. Image Process. 2018, 27, 4787–4797. [Google Scholar] [CrossRef]
- Akti, S.; Tataroglu, G.A.; Ekenel, H.K. Vision-based Fight Detection from Surveillance Cameras. In Proceedings of the 2019 Ninth International Conference on Image Processing Theory, Tools and Applications (IPTA), Istanbul, Turkey, 6–9 November 2019; pp. 1–6. [Google Scholar] [CrossRef]
- Sudhakaran, S.; Lanz, O. Learning to detect violent videos using convolutional long short-term memory. In Proceedings of the 2017 14th IEEE International Conference on Advanced Video and Signal Based Surveillance (AVSS), Lecce, Italy, 29 August–1 September 2017; pp. 1–6. [Google Scholar] [CrossRef]
- Song, W.; Zhang, D.; Zhao, X.; Yu, J.; Zheng, R.; Wang, A. A Novel Violent Video Detection Scheme Based on Modified 3D Convolutional Neural Networks. IEEE Access 2019, 7, 39172–39179. [Google Scholar] [CrossRef]
- Su, Y.; Lin, G.; Zhu, J.; Wu, Q. Human Interaction Learning on 3D Skeleton Point Clouds for Video Violence Recognition. In Proceedings of the Computer Vision—ECCV 2020; Vedaldi, A., Bischof, H., Brox, T., Frahm, J.M., Eds.; Springer: Cham, Switzerland, 2020; pp. 74–90. [Google Scholar] [CrossRef]
- Jain, A.; Vishwakarma, D.K. Deep NeuralNet For Violence Detection Using Motion Features From Dynamic Images. In Proceedings of the 2020 Third International Conference on Smart Systems and Inventive Technology (ICSSIT), Tirunelveli, India, 20–22 August 2020; pp. 826–831. [Google Scholar] [CrossRef]
- Elkhashab, Y.R.; H. El-Behaidy, W. Violence Detection Enhancement in Video Sequences Based on Pre-trained Deep Models. FCI-H Inform. Bull. 2023, 5, 23–28. [Google Scholar] [CrossRef]
- AlDahoul, N.; Karim, H.A.; Datta, R.; Gupta, S.; Agrawal, K.; Albunni, A. Convolutional Neural Network—Long Short Term Memory based IOT Node for Violence Detection. In Proceedings of the 2021 IEEE International Conference on Artificial Intelligence in Engineering and Technology (IICAIET), Kota Kinabalu, Malaysia, 13–15 September 2021; pp. 1–6. [Google Scholar] [CrossRef]
- Vijeikis, R.; Raudonis, V.; Dervinis, G. Efficient Violence Detection in Surveillance. Sensors 2022, 22, 2216. [Google Scholar] [CrossRef]
- Ullah, F.U.M.; Muhammad, K.; Haq, I.U.; Khan, N.; Heidari, A.A.; Baik, S.W.; de Albuquerque, V.H.C. AI-Assisted Edge Vision for Violence Detection in IoT-Based Industrial Surveillance Networks. IEEE Trans. Ind. Inform. 2022, 18, 5359–5370. [Google Scholar] [CrossRef]
- Choqueluque-Roman, D.; Camara-Chavez, G. Weakly Supervised Violence Detection in Surveillance Video. Sensors 2022, 22, 4502. [Google Scholar] [CrossRef]
Disclaimer/Publisher’s Note: The statements, opinions and data contained in all publications are solely those of the individual author(s) and contributor(s) and not of MDPI and/or the editor(s). MDPI and/or the editor(s) disclaim responsibility for any injury to people or property resulting from any ideas, methods, instructions or products referred to in the content. |
© 2025 by the authors. Licensee MDPI, Basel, Switzerland. This article is an open access article distributed under the terms and conditions of the Creative Commons Attribution (CC BY) license (https://creativecommons.org/licenses/by/4.0/).