1. Introduction
The overhead power line (OPL) system delivers electricity for residential and industrial use. The OPLs are built with dampers, conductors, insulators, and spacers on top of stationary vertical towers. OPL components are susceptible to damage from natural disasters like lightning, fires, and windstorms, as well as human activities such as pollutant leaks. This damage leads to infrastructure issues, including arcing, overheating, and erosion [
1]. The OPL should be regularly inspected to promptly identify and fix any damage in order to guarantee the effective and dependable transmission of high-voltage electricity.
Skilled engineers traditionally went up and moved along the OPL to identify flaws and conduct regular maintenance. Line crawling is the predominant method for inspection in the majority of countries globally. However, this procedure is unsafe because engineers could fall off the wire or be electrocuted [
2]. Several methods have been developed for OPL inspection, such as observation of the lines from the ground with telescopes [
3], power transmission line inspection robots (PTLIRs) [
4], helicopter-assisted inspection [
5], and automated helicopter-assisted inspection [
6]. However, these methods mostly depend on human observation, are less effective, and contain high risk.
In order to create a solution for OPL inspection that is more effective and less risky, researchers recently began conducting research on drone-assisted automated inspection [
7,
8,
9]. The creation of more reliable technology is a major obstacle for numerous researchers and corporations. Drones with cameras and sensors monitor OPL equipment to evaluate and identify damage. The drone system features an edge computing platform with a vision-based approach for real-time processing of the recorded image [
10]. An autonomous drone requires a portable computing system with artificial intelligence (AI) capabilities for automatic inspection. An edge computing device is one of the portable computing systems that incorporates a microprocessor or microprocessors, memory, input/output (I/O), and other vital parts of a computer. Edge computing platforms, including Raspberry Pi, Jetson Nano, Jetson TX2, NVIDIA AGX Xavier, and FPGA-based systems like Ultra96 and Kria KV-260 [
11,
12], are frequently utilized for AI processing on drones. The edge computing platform is expected to perform real-time component or damage inference. One of the challenges for real-time OPL inspection with drones and edge computing is to develop an efficient machine or deep learning method with high precision because of the restricted resources of the edge computing devices [
13]. Another challenge is to develop the dataset with sufficient training data to obtain the high-precision model [
14].
This paper discusses a study on OPL component detection utilizing a deep learning approach and edge computing platforms. This result is the continuation of our previous research, which proposed YOLOv3 in Raspberry Pi 4B [
15]. Our previous results show that YOLOv3 can achieve acceptable detection performance but cannot achieve real-time detection performance. To improve previous results, YOLOv7, the real-time object detection method that was introduced in 2022 by Wang et al., is utilized in this paper [
16]. This method is mainly optimized for real-time object detection using edge devices. Wang et al. show in their study that the YOLOv7 achieves the highest performance compared to the previous YOLO version [
16]. In some studies, it is also shown that YOLOv7 achieves competitive performance in terms of detection accuracy and real-time detection compared to the newer YOLO versions [
17,
18]. Previous studies also show the superior performance of YOLOv7 compared to other methods, such as single-shot multibox detector (SSD), SSD-MobileNet V2, and faster region-based convolutional neural network (R-CNN) [
19,
20,
21]. We also evaluate Jetson Nano and Jetson Orin Nano, the lightweight and powerful edge computing platforms equipped with NVIDIA GPU [
13]. The original dataset of OPL in Tokyo is also created in this research. This paper is an extended version of the published conference paper [
22].
There are two main objectives of this research, which are:
To evaluate the necessary size of training datasets to reach a particular detection performance level. It includes evaluating the effectiveness of data augmentation in improving detection performance.
To assess if real-time detection and low resource consumption can be achieved with the edge computing platforms. It includes evaluating the effectiveness of a lightweight model (YOLOV7-Tiny), model quantization, and different deep learning frameworks to improve real-time performance.
To achieve the first objective, this research evaluates YOLOv7 with 3 different training dataset sizes. On the other hand, the YOLOv7 model was also evaluated on the edge platforms regarding detection time, RAM utilization, and power consumption to achieve the second objective. There are three edge platforms used in this research, which are Raspberry Pi 4B, Jetson Nano, and Jetson Orin Nano. In hardware performance evaluation, the effect of the lightweight YOLOv7 model (YOLOv7-Tiny), the model compression technique (quantization), and the selection of the deep learning framework are discussed.
The structure of the paper is as follows.
Section 2 provides an explanation of the literature review.
Section 3 provides an explanation of the research methodology.
Section 4 presents the results and discussions. Finally, in
Section 5, the study is concluded.
2. Literature Review
Some of the researchers have studied the modified version of CNN for component and damage detection of OPL. Nguyen et al. proposed the improvement of the RESNET model for OPL component classification [
14]. Their proposed method can achieve weight precision of 74% and 96.93% for cross-arm cop and pole crop classifiers, respectively. In another study, Tao et al. proposed a novel deep CNN cascading architecture for localization and defect detection in insulators [
23]. The cascading network transforms defect inspection into a two-level object detection by employing a CNN based on a region proposal network (RPN). The proposed method achieves 91% and 96% precision (
Pr) and recall (
Rc), respectively, for insulator defect detection. Finally, Liang et al. proposed a detection model based on Faster R-CNN to detect the 10 categories, including 8 component defect types, nests, and foreign bodies. Their proposed method can achieve a mean average precision (
mAP) of 91.1% and a false rate of 0.68% of 10 categories of OPL condition classification [
24]. However, all of this research focused on improving the detection model.
On the other hand, some researchers also conducted research about power line component detection on edge devices. Siddiqui et al. proposed an improved version of YOLO V3 that can achieve a maximum precision of 87.5% for some types of OPL damage detection [
25]. Some of the damage types considered in their research are broken shed, balisor fading, rust in sag adjusters, and splits in PolSTI. In this research, they also reported the inference time results of implementation on Jetson TX2 platforms. Another research on the Jetson platform was proposed by Liu et al. [
26]. They proposed the TensorRT-optimized REPYOLO algorithm to be implemented on the NVIDIA Jetson Xavier NX platform. In another research, Ayoub et al. trained the YOLOv4-tiny and YOLOv3-tiny models and evaluated the performance on several platforms, such as Raspberry Pi 4, NVIDIA Jetson TX2, NVIDIA Jetson Nano, and NVIDIA AGX Xavier [
9]. Finally, Rosende et al. [
27] evaluated some YOLO models on several platforms, such as Raspberry Pi 3B+, Raspberry Pi 4, Google Coral, and Jetson Nano.
In this research, we conduct a deeper study on OPL component detection using edge platforms. Previous studies lacked exploration in terms of the adequacy of training dataset quantity, edge device optimization, and the evaluated performance metrics. The original dataset is created in this study. There are some significances of this study compared to previous studies. Firstly, we explore the influence of data training size on detection performance. Secondly, there are two edge device implementation optimizations utilized in this research, which are TensorRT and model quantization. Thirdly, broader evaluation metrics that measure performance in terms of detection accuracy and hardware performance are introduced in this research. We also explore the performance of YOLOv7 and YOLOv7-tiny on several platforms, such as Raspberry Pi 4B, Jetson Nano, and Jetson Orin Nano. The summary of the comparison with related studies is presented in
Table 1.
3. Research Method
3.1. Deep Learning Framework for OPL Detection
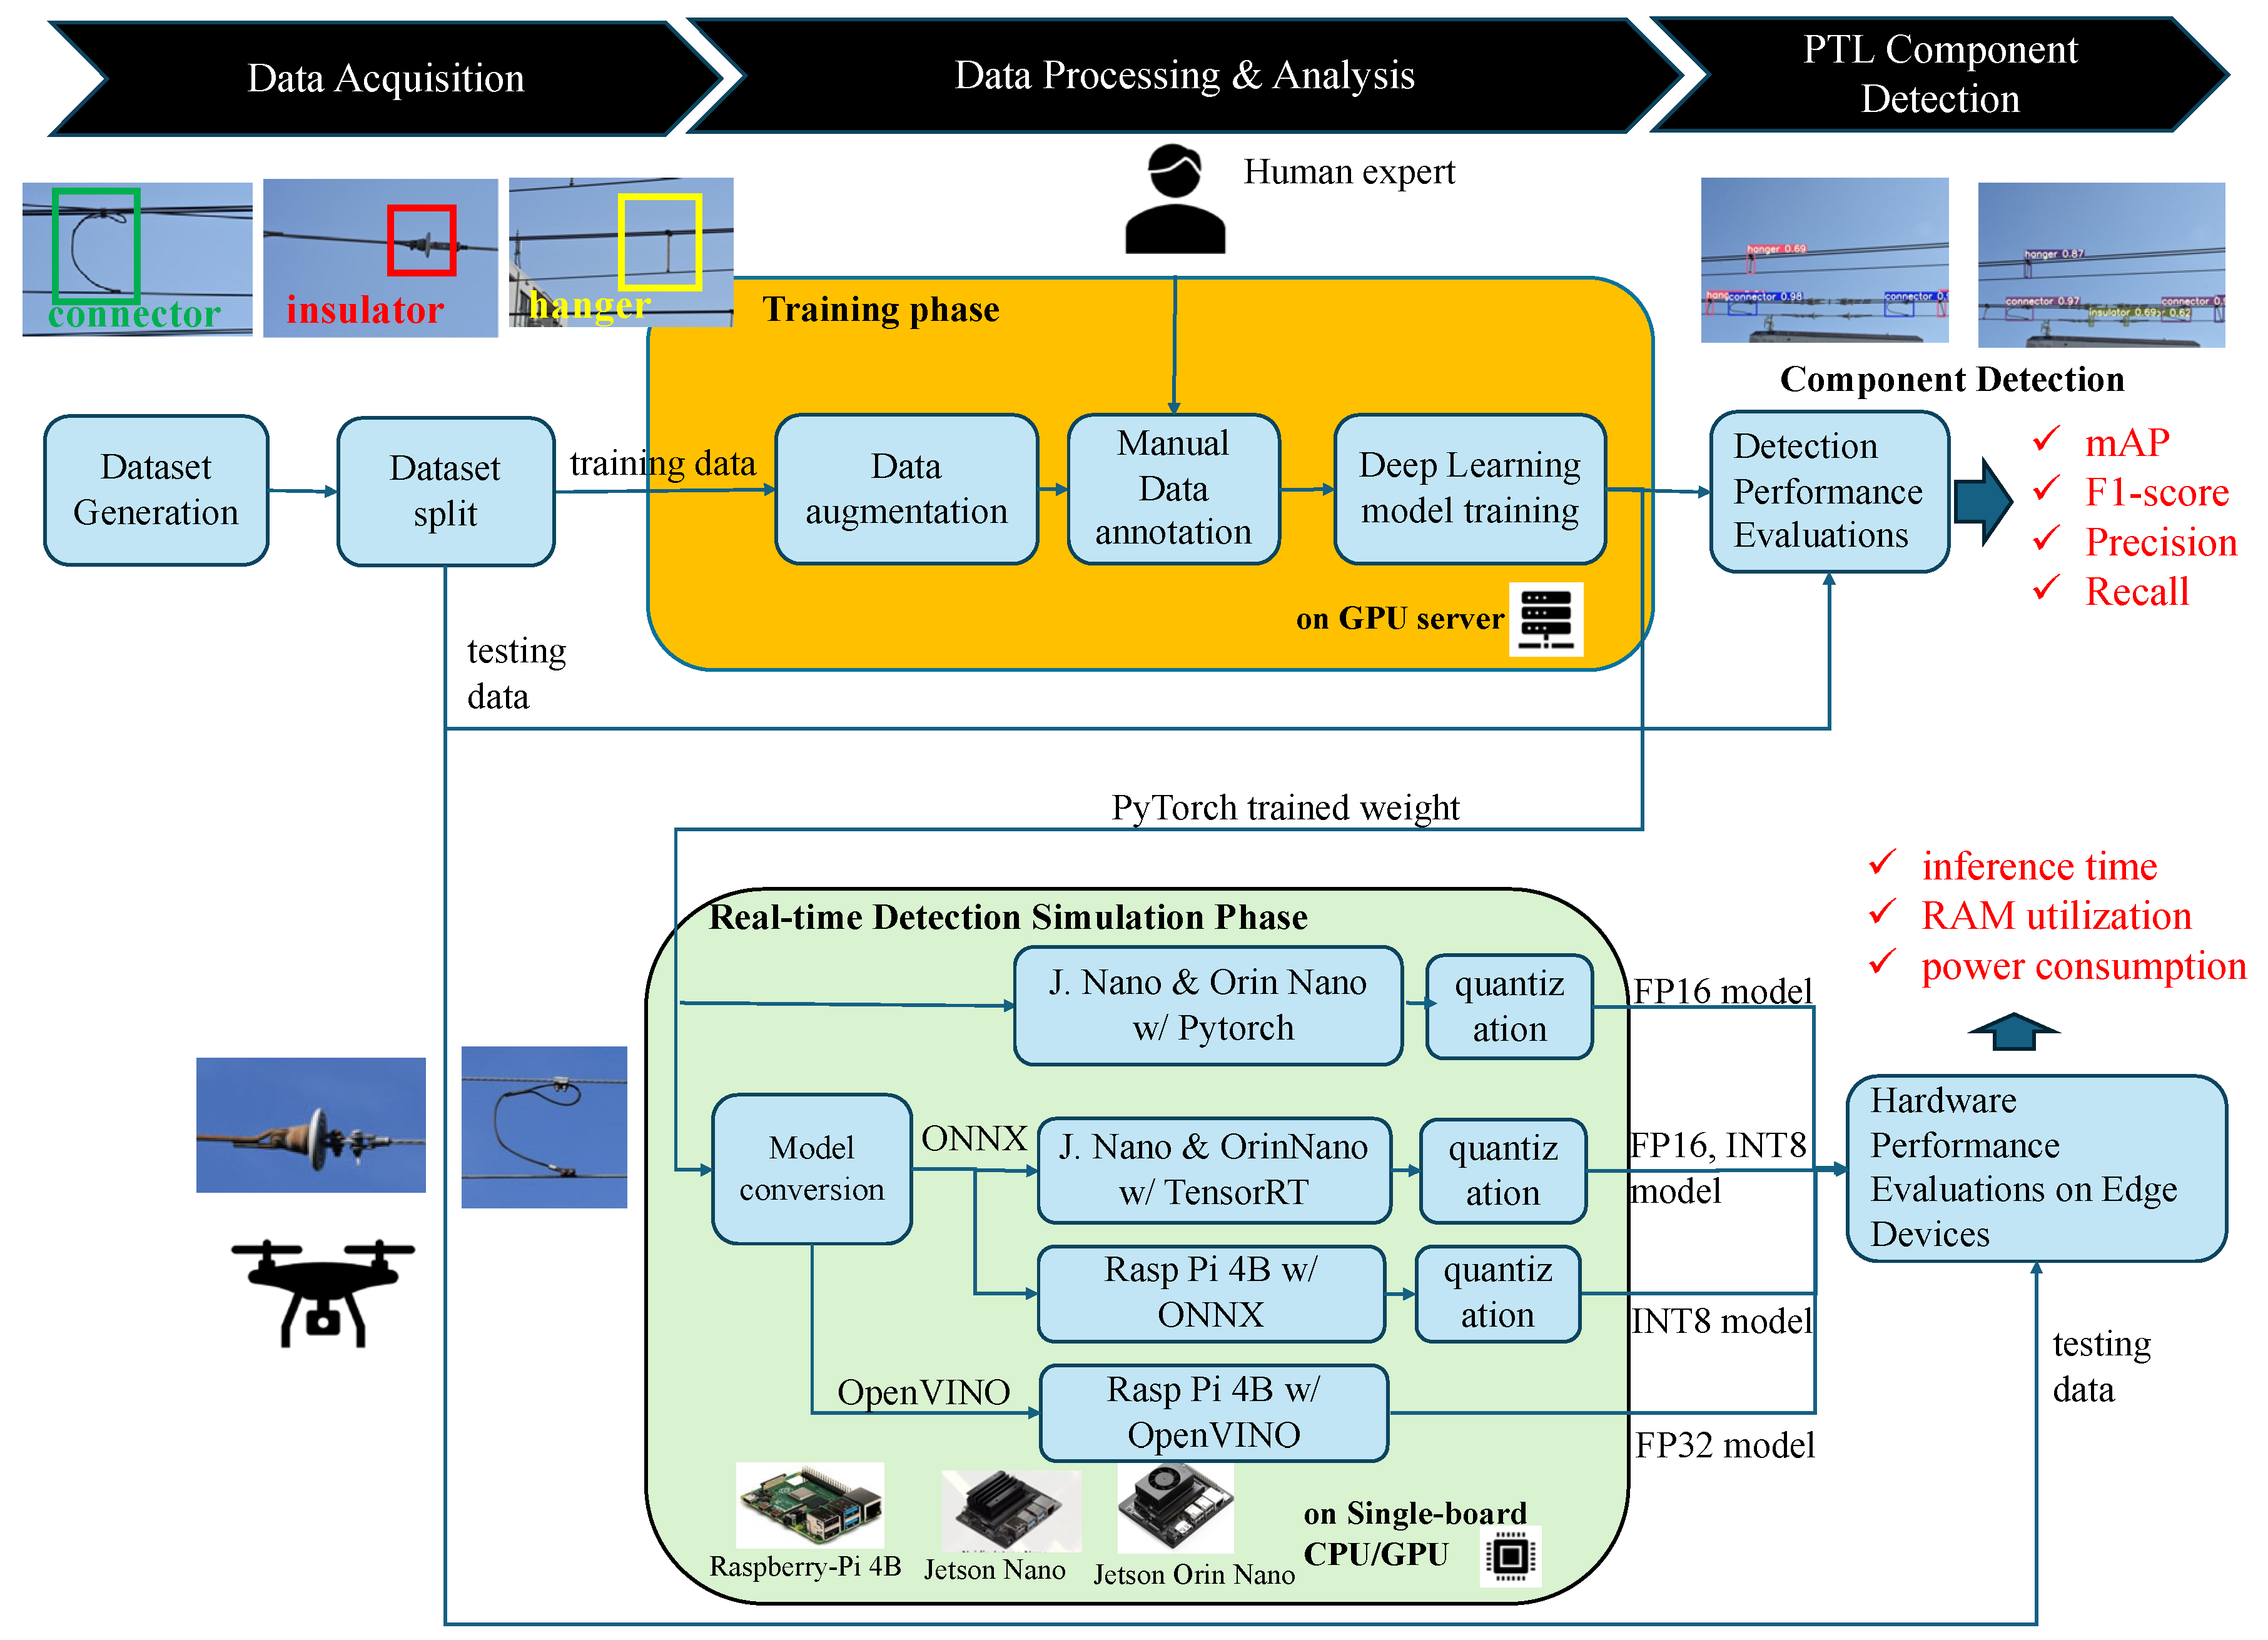
The deep learning method consists of two primary phases: training and real-time detection, as illustrated in
Figure 1. The objective of the training phase is to create the dataset for data training and to train the deep neural network (DNN) model in order to acquire certain training weights. Data augmentation is conducted by slightly modifying the existing data to increase the training image dataset. Manual annotation is a data labeling process by a human expert. In this research, three components are detected. Data training is conducted during this phase using a high-end GPU workstation. After the data training, the data testing is conducted to evaluate the performance of the trained model. In this stage, detection model accuracy performance is obtained. The obtained detection performance metrics include
mAP,
F1
-score,
precision, and
recall.
In the real-time detection phase, the evaluation of the trained model is conducted on several edge computing devices, such as Raspberry Pi 4B, Jetson Nano, and Jetson Orin Nano. Some deep learning frameworks are also evaluated in this research, such as PyTorch, ONNX, OpenVINO, and TensorRT. The model quantization to FP16 and INT8 is also evaluated in this research. From this stage, the hardware performance results are obtained. The obtained hardware performance metrics include inference time, RAM utilization, and power consumption.
3.2. Dataset Generation
The dataset for this research consists of three classes, which are connector, insulator, and hanger. The overview of the dataset is shown in
Figure 2. As shown in
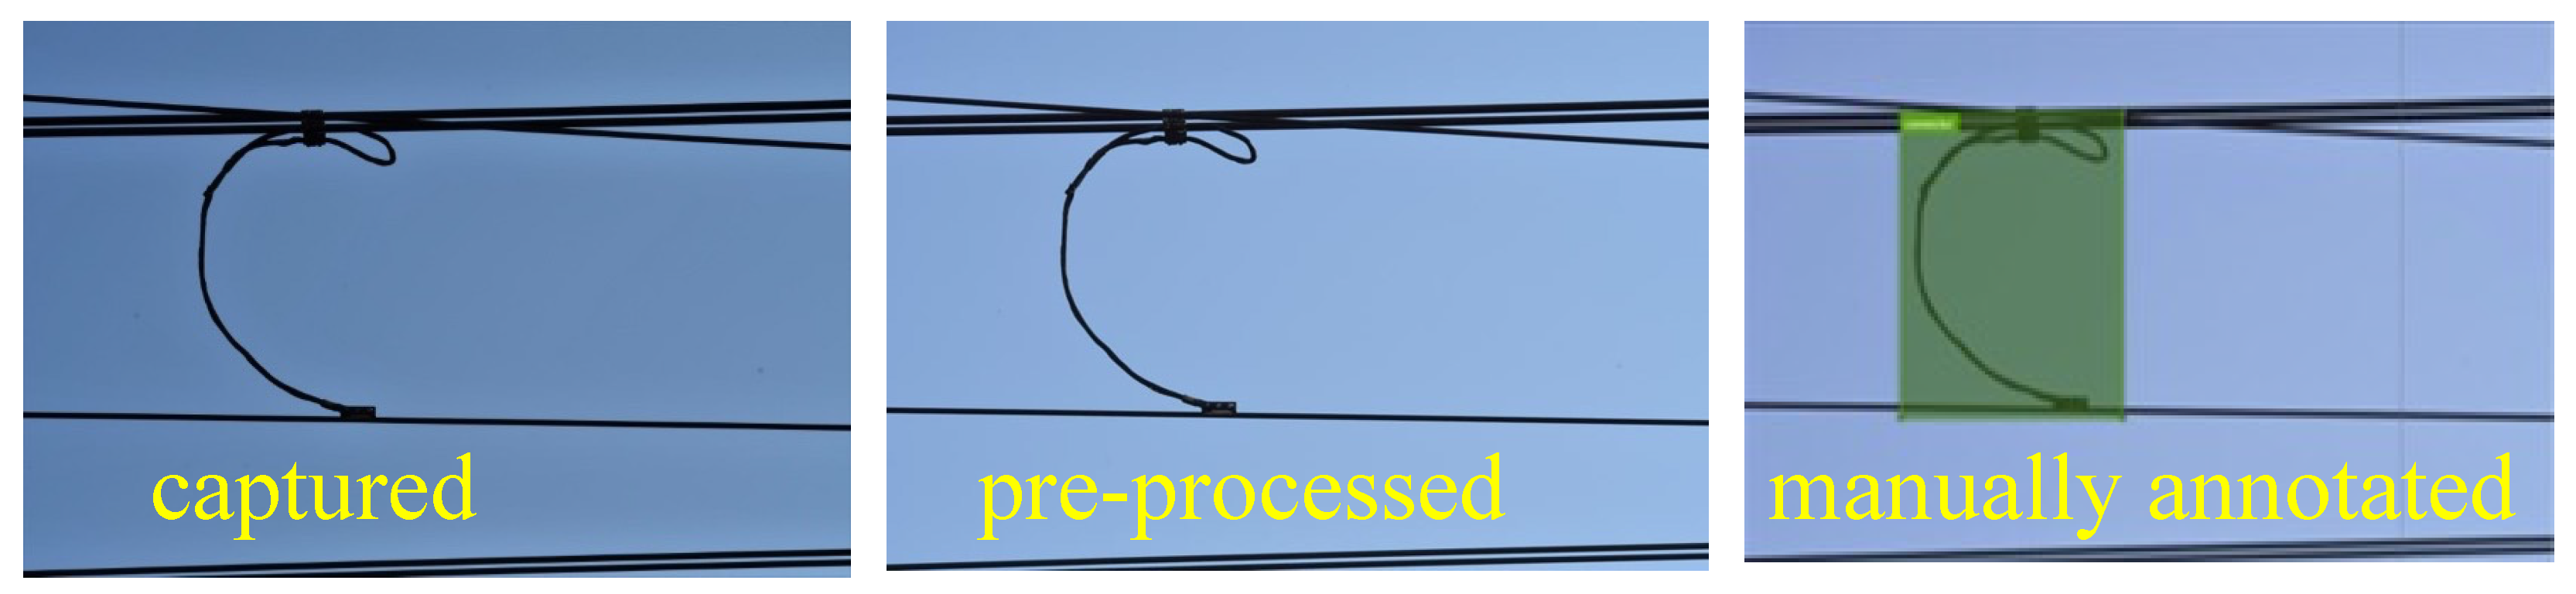
Figure 3, the dataset generation consists of three steps, i.e., data collection, data augmentation, and manual data annotation. Initially, the OPL equipment is captured using a camera. The training dataset is generated by capturing images of OPL using a Nikon D500 camera with an AF-S NIKKOR 24–70 mm f/2.8 G ED lens. The photograph was captured within the bright sunlight (sunny day) and overcast lighting conditions (cloudy day). It was also taken with a low oblique angle (upward and slightly upward). The photographs were captured along the route between Kamata Station and Keihin-Tohoku Line Kawasaki Station in Tokyo, Japan. We conduct image pre-processing on data captured by Adobe Lightroom, including adjustments for exposure and scaling.
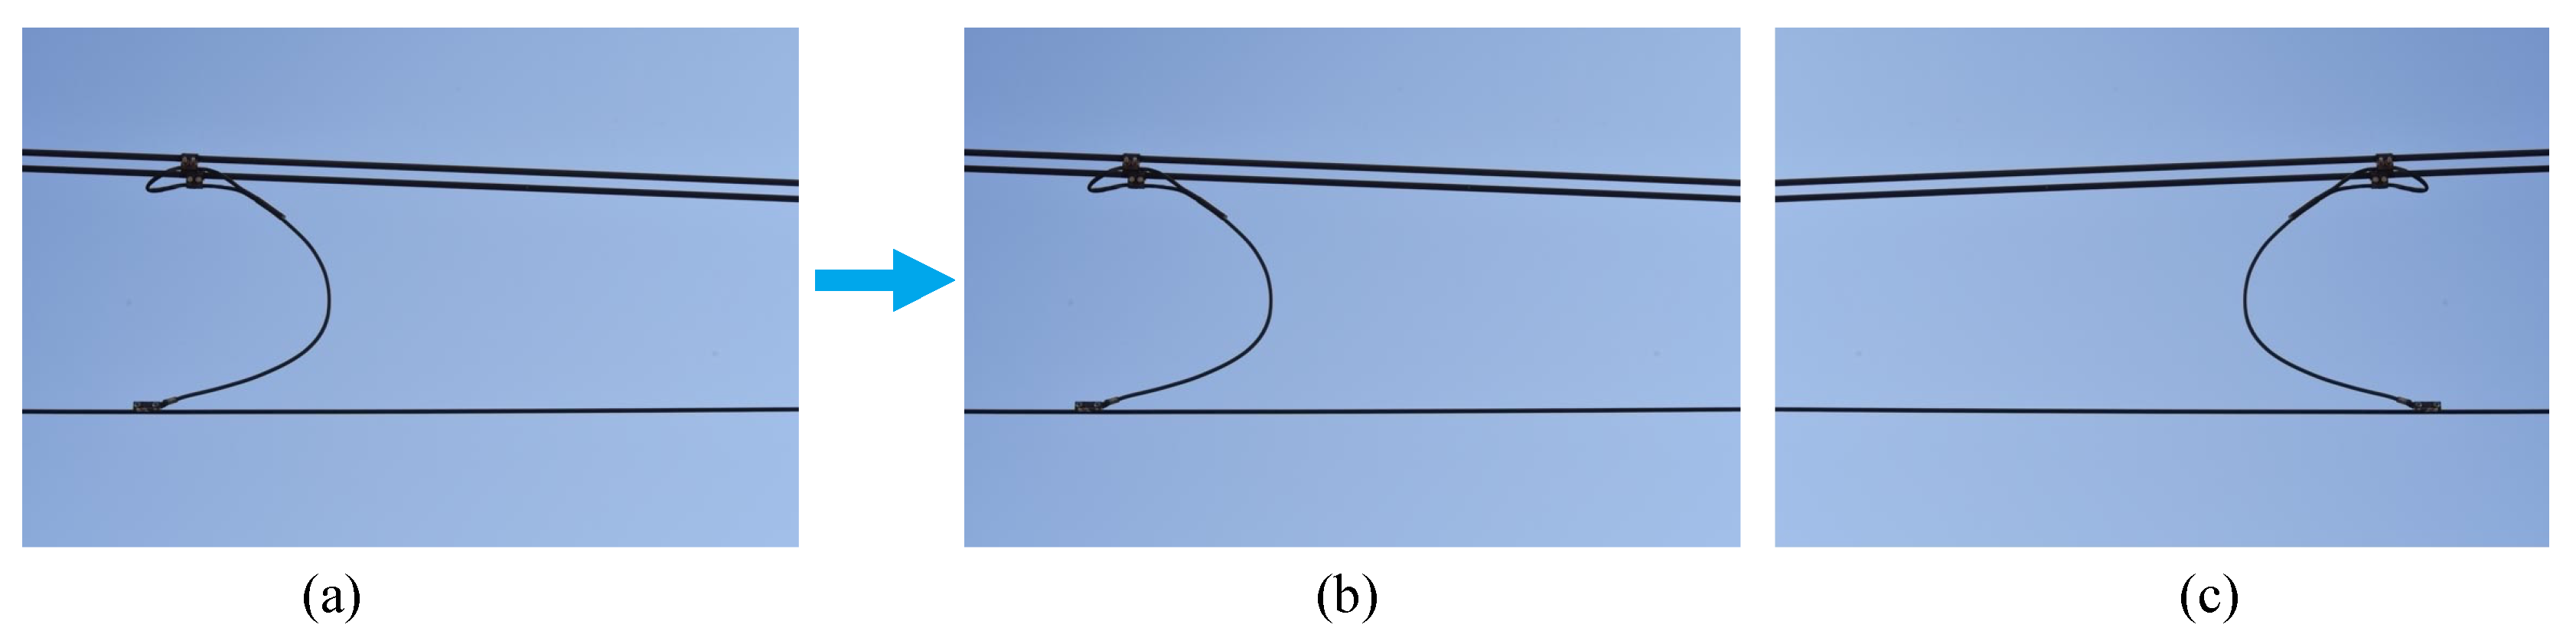
During the second step, data augmentation is conducted. Using the captured data, we created two datasets with different image data quantities, which are dataset small (DS) and dataset medium (DM). DS consists of 1200 image data with a size of 736 × 736 pixels each. Specifically, it consists of 400 image data of each of the hanger, connector, and insulator components, while DM consists of 2400 image data. Specifically, it consists of 800 images of each of the hanger, connector, and insulator components. In this research, we aim to ensure that an equal number of image datasets is provided for each component. However, an imbalance occurred due to the varying quantity of recognized components in each image. To evaluate the influence of data augmentation, we also conducted data augmentation in this research. We use a simple horizontal-flip method to double up DM to create dataset large (DL). DL consists of 4800 image data, twice that of DM. The illustration of horizontal flip data augmentation is shown in
Figure 4.
During the third step, manual annotation is performed using a tool called Visual Object Tagging Tools (VoTT) developed by Microsoft Corporation to identify the location and nature of objects in the captured image.
3.3. YOLOv7 and YOLOv7-Tiny Model Training
YOLOv7 and YOLOv7-Tiny are the two models discussed in this paper. YOLOv7 is an advanced real-time object detection model that introduces trainable auxiliary architectures and optimizes the network for real-time object detection [
16]. It introduces extended efficient layer aggregation networks (E-ELAN) to enhance the network learning capabilities without disrupting the original gradient path [
28]. Planned re-parameterized convolution (RepConv) improves inference efficiency by optimizing layer structures during training. YOLOv7 also implements model scaling with compound scaling to balance accuracy and computational efficiency across different model sizes. YOLOv7 achieves higher FPS and better mean
mAP than previous YOLO versions while maintaining real-time performance, making it suitable for applications like autonomous driving, surveillance, and industrial automation.
The Tiny YOLO v7 [
29] is part of the YOLOv7 series. The modifications to create YOLOv7-tiny involve reducing the model size and using a simplified architecture. It significantly reduces the number of parameters to 6.2 million, compared to 36.9 million in YOLOv7. It also uses a leaky rectified linear unit (RELU), which has less complexity than the sigmoid linear unit (SILU) used in YOLOV7. Throughout its development, YOLOv7-Tiny models have consistently aimed to balance speed, accuracy, and computational efficiency for surveillance, robotics, and IoT applications.
The training in these files is performed using the PyTorch framework (3.9) and employs a YOLOv7 and YOLOv7-Tiny-based model architecture, which was pretrained on the COCO dataset [
30]. It was trained with a stochastic gradient descent (SGD) optimizer, with an initial learning rate of 0.01, a momentum of 0.937, and a weight decay of 0.0005. The batch size is set to 8, and the network is trained for 100 epochs. Overall, the training process combines a standard pretrained YOLOv7 backbone, standard PyTorch tooling, and carefully tuned hyperparameters to fine-tune the detector on a custom dataset.
3.4. YOLOv7 Detection Performance Evaluation
In this research, detection performance evaluations are conducted. Four variables of detection performance utilized include precision (Pr), recall (Rc), F1-score, and mAP.
Precision refers to the ability of a model to accurately identify relevant objects. It denotes the ratio of correct positive predictions.
Rc refers to the ability of the model to identify all relevant instances, such as all ground-truth bounding boxes [
31]. It is the ratio of correct positive predictions to all ground truths. The
Pr and
Rc calculations are provided by (1) and (2).
Prior to computing Pr and Rc, each identified bounding box needs to be classified as:
True positive (TP) refers to the accurate detection of labeled OPL components.
False positive (FP) refers to an inaccurate detection of a non-existent object, or an existing object is mistakenly identified as one of the indicated OPL components.
False negative (FN): An undetected labeled OPL component.
The
F1
-score is the harmonic mean of the
Pr and
Rc. The
F1
-score is commonly utilized to evaluate the precision of an imbalanced dataset. Due to the imbalanced dataset of the three components in this research, we utilized these measurements.
mAP is a widely used performance metric in the field of computer vision, particularly in the context of object detection tasks. It measures the quality of an object detection algorithm by considering both precision and recall over multiple classes or categories of objects. The equation of average precision (
AP) is shown by (4).
where
is the precision at a given recall value
. The equation of
mAP is shown by (5).
where
is the
AP value for the
i-th class, and
C is the total number of evaluated classes.
The evaluation is conducted using 5-fold cross-validation as shown by
Figure 5. The 5-fold cross-validation is used in this research for more efficient use of data and aggregate performance metrics. Since our dataset is limited, the cross-validation ensures every image is used for both training and validation at some point; therefore, it can maximize the amount of data used for model training. The dataset is divided into five equal-sized data parts. For each iteration, the simulation is conducted using four parts as training data and one part as testing data. The model is trained using training data and evaluated using testing data. For each iteration, a different data part is selected as testing data. After every iteration, the model performance scores (
mAP,
F1
-score,
Pr, and
Rc) are obtained. Finally, the five performance scores are averaged to obtain a single score of model performance. This evaluation is conducted to obtain more stable performance for each evaluated metric.
3.5. Evaluation on Edge Computing Platforms
After the detection performance evaluation, the trained weight data are configured on edge computing platforms. In this stage, the DM dataset is utilized. The implementation is conducted on three edge computing platforms, which are Raspberry Pi 4B, Jetson Nano, and Jetson Orin Nano. These edge computing devices are selected due to their performance and lightweight size.
Raspberry Pi 4B is the least expensive among the evaluated edge computing devices. It is equipped with a 1.5 GHz quad-core Cortex A-72 CPU and 8 GB LPDDR4 RAM. It does not have a GPU on board. Jetson Nano is a small but more powerful edge computing platform produced by NVIDIA [
32]. It is equipped with a 128-core NVIDIA Maxwell architecture GPU that can achieve 0.236 TeraFLOPS (TFLOPS) in default mode, which is floating-point 32 bits (FP-32). The Jetson Orin Nano is the most powerful edge computing device evaluated in this paper. It is equipped with a 1024-core NVIDIA Ampere architecture GPU that can achieves 1.3 TeraFLOPS (TFLOPS) in default mode (FP-32) [
33].
In this study, YOLOv7 and YOLOv7-Tiny are implemented on Raspberry Pi 4B using the OpenVINO and ONNX frameworks. OpenVINO is a framework specially made for the Intel hardware ecosystem [
34]. The ONNX is a framework that provides cross-compatibility on several platforms [
35]. On the other hand, YOLOv7 and YOLOv7-Tiny are implemented in Jetson Nano and Jetson Orin Nano with the PyTorch and TensorRT frameworks. TensorRT is a framework to optimize the performance of deep learning models on NVIDIA hardware, such as Jetson platforms. Optimization of computation precision reduces computation and memory usage by using half-precision floating-point (FP16) and integer arithmetic (INT8). Reduced-precision inference significantly minimizes latency, which is required for many real-time detection processes. This study verified patterns optimized for FP16 and INT8 computational precision. However, since the GPU architecture of the Jetson Nano does not support INT8, experiments were conducted using only FP16 for the Jetson Nano. The hardware and software specifications of the edge computing devices are defined in
Table 2.
The evaluation is conducted to evaluate the hardware performance of each edge computing platform in executing the YOLOv7 and YOLOv7-Tiny models. By this evaluation, the feasibility of implementing the real detection on a drone using the edge computing platform will be discussed. There are three performance metrics evaluated in this stage, which are the detection time, RAM utilization, and power consumption (instantaneous value). The detection is conducted 50 times at room temperature, and the three performance metrics are recorded. The average value of the three metrics will be shown in this paper.
4. Results and Discussion
This section discusses the result of OPL component detection and hardware implementation performance. Firstly, the detection performance evaluation is conducted to evaluate the accuracy performance of the deep learning model. Secondly, the deep learning models (the original model and quantized model) are implemented on some edge device platforms, and some hardware performance metrics are evaluated.
4.1. Detection Performance Evaluation
The detection performance evaluation is conducted for three dataset sizes, i.e., DS, DM, and DL. The purpose of this evaluation is to evaluate the necessary size of training datasets to reach a particular detection performance level. It includes evaluating the effectiveness of data augmentation in improving detection performance.
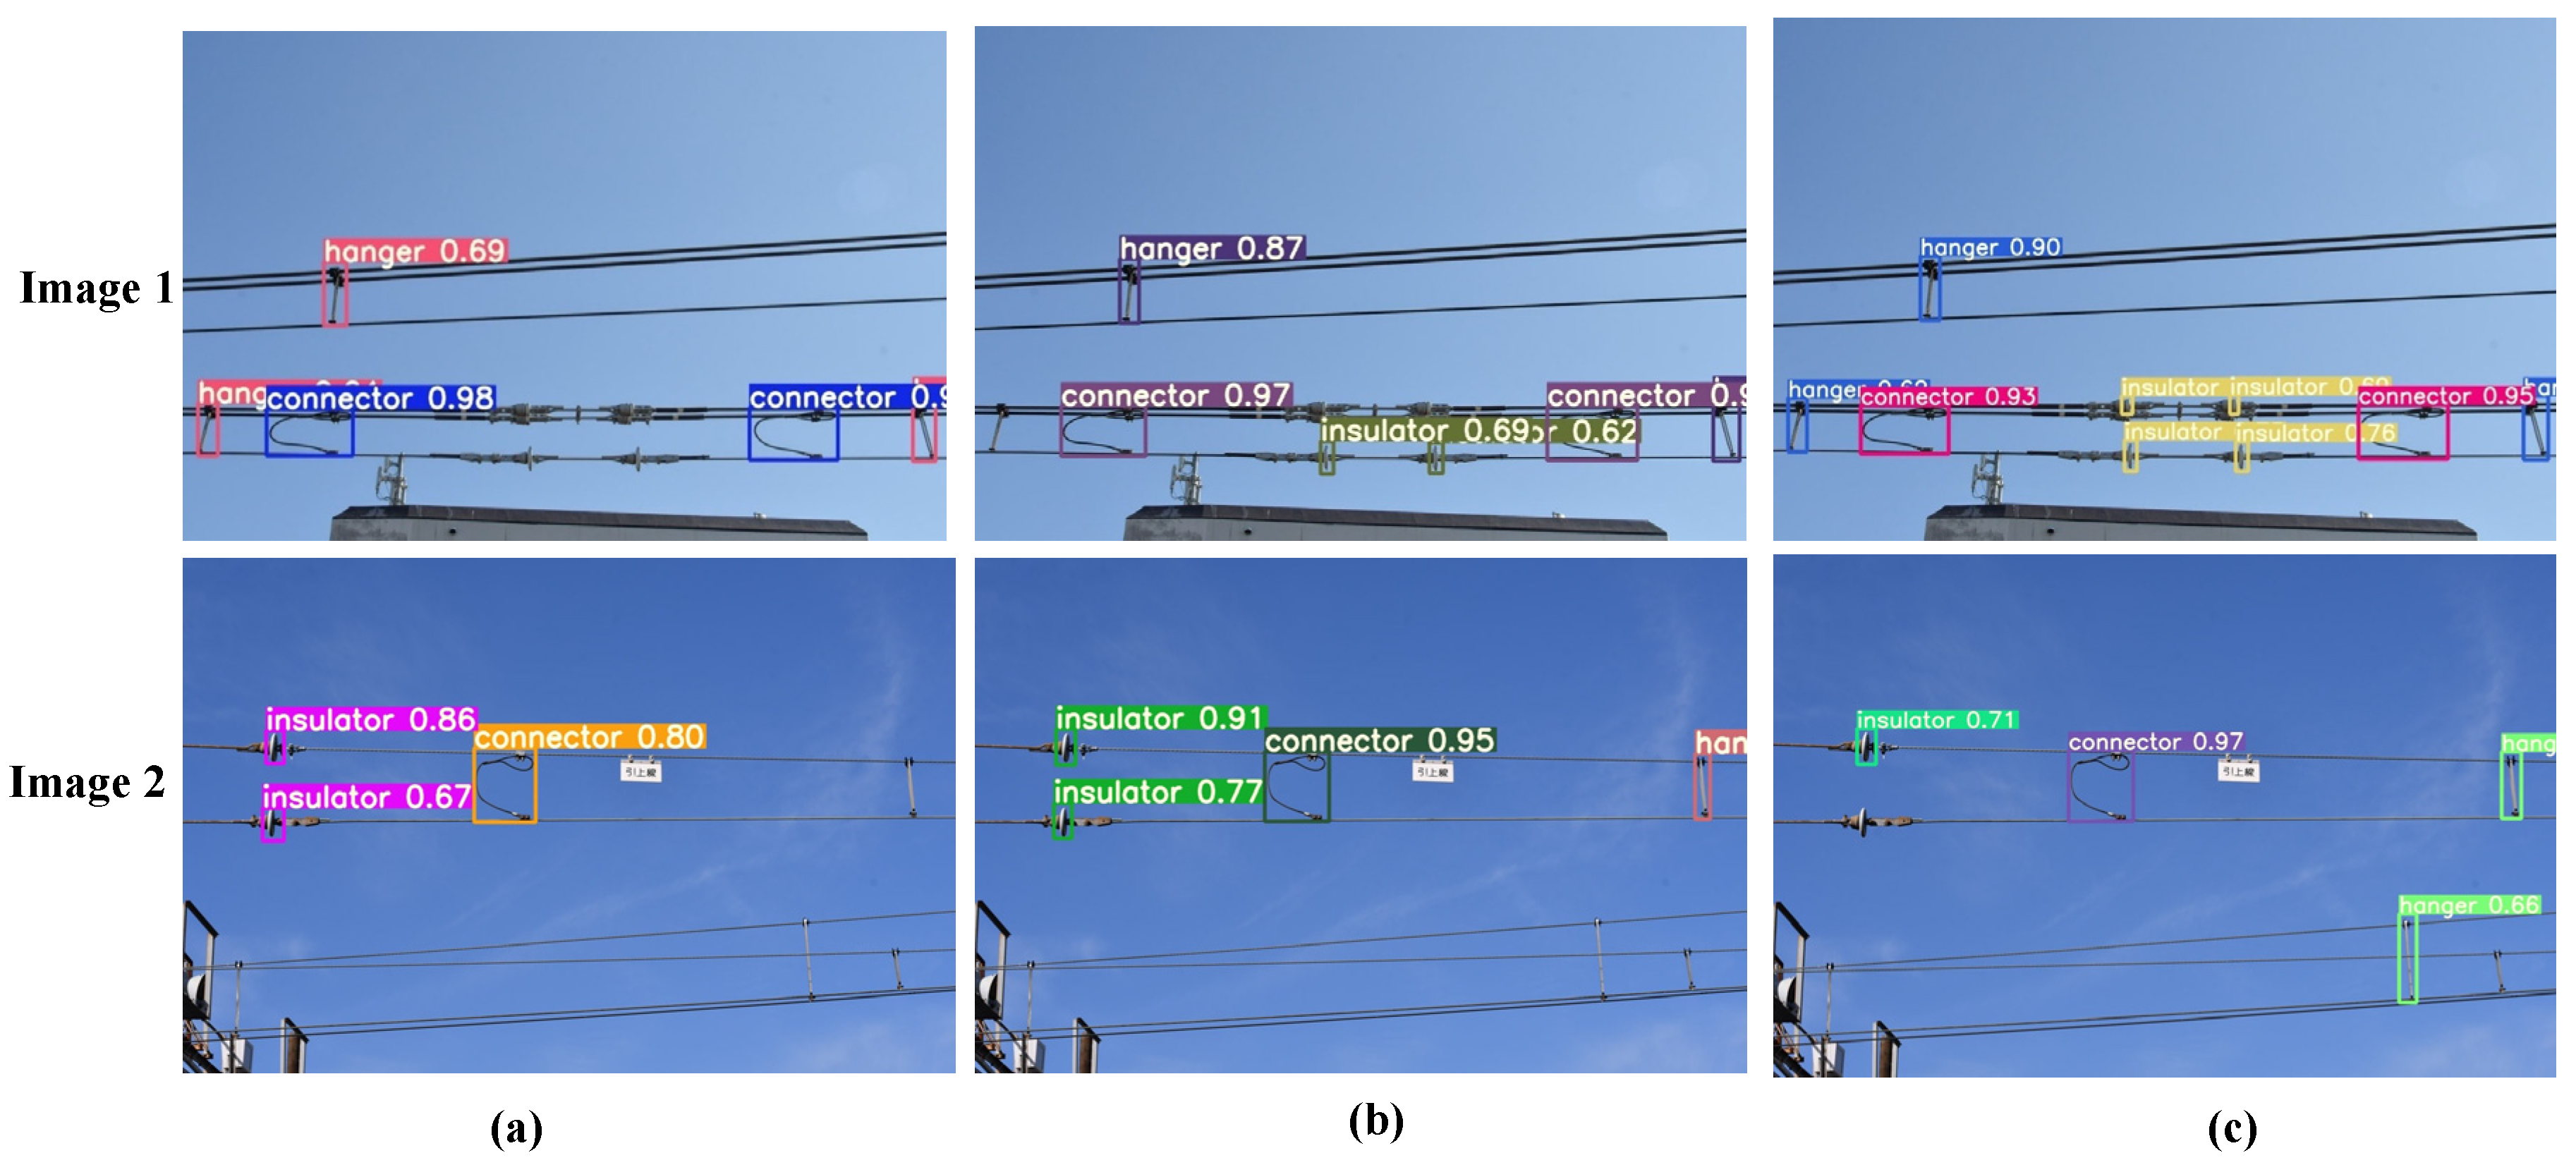
Figure 6 presents a bounding box visualization that shows that enhancing detection performance is achievable by increasing the number of datasets utilized. It is evident that an increase in the number of training datasets results in more accurately recognized components in the same image. We can also notice an improvement in the confidence score when the number of training datasets becomes larger. In image 1 (first row) of
Figure 6a, when the DS dataset is utilized, there are five correctly detected components. In
Figure 6b, when the DM dataset is utilized, there are seven correctly detected components. Finally, in
Figure 6c, when the DL dataset is utilized, there are nine correctly detected components. The same patterns are also shown by image 2 (second row) of
Figure 6, where the number of correctly detected components shows improvement when the dataset size is increased.
In order to obtain some numerical results to evaluate the sufficiency of the dataset for achieving a specific detection performance by evaluating metrics such as
mAP,
Pr,
Rc, and
F1
-score.
Figure 7 shows the Pr vs. Rc graph of the first iteration of the simulation. In this simulation, we evaluate
mAP when the intersection over union (IoU) threshold is 0.5 (
mAP@0.5). In this case, the IoU ≥ 0.5 is considered a TP, and the rest are considered FPs. In general, DL shows the highest performance considering the higher area under the curve compared to DL and DM. For every component detection, the insulator shows much lower performance compared to the hanger and connector.
Figure 8 shows the results of
mAP. The
mAP results in
Figure 8 are the aggregated results from 5 iterations conducted during 5-fold cross-validations. The
mAP result indicates that the model attains its highest level of performance when trained on the DL dataset, achieving a
mAP of 90.80% for all component detections. It is interesting to notice that the
mAP improvement for all components from DM to DL becomes less significant. The increase rate of
mAP when increasing from DM to DL is 1.80%. It is less significant than the increase rate of
mAP from DS to DM, which is around 5.90%. From this result, we can understand that the applied data augmentation method can improve the detection performance but not as effectively as the improvement of the collected dataset.
It is noteworthy that even when using a DL dataset, the mAP for detecting insulators is considerably lower compared to the other components. In a DL dataset, the insulator detection achieves mAP of 79.78%, more than 13% lower than the mAP of hanger and connector detection. We assume this result occurs due to the small size of the insulator compared to other components. To enhance the detection performance in the future, it is necessary to augment the trained data size specifically for the insulator component.
Other than
mAP, the
F1
-score,
Pr, and
Rc are also evaluated in this research.
Figure 9 shows the
F1-score vs. confidence level for the first simulation of three sizes of datasets. In general, it shows that there is an increase in performance along with the increase in the number of datasets, especially for higher confidence level values. The average
F1
-score,
Pr, and
Rc results at a
confidence level of 0.5 for five iterations are calculated and shown in
Figure 10. The
F1
-score,
Pr, and
Rc results (
Figure 10) show that the model achieves maximum performance in the DL dataset with 90.90%
F1
-score, 89.80%
Pr, and 89.42%
Rc.
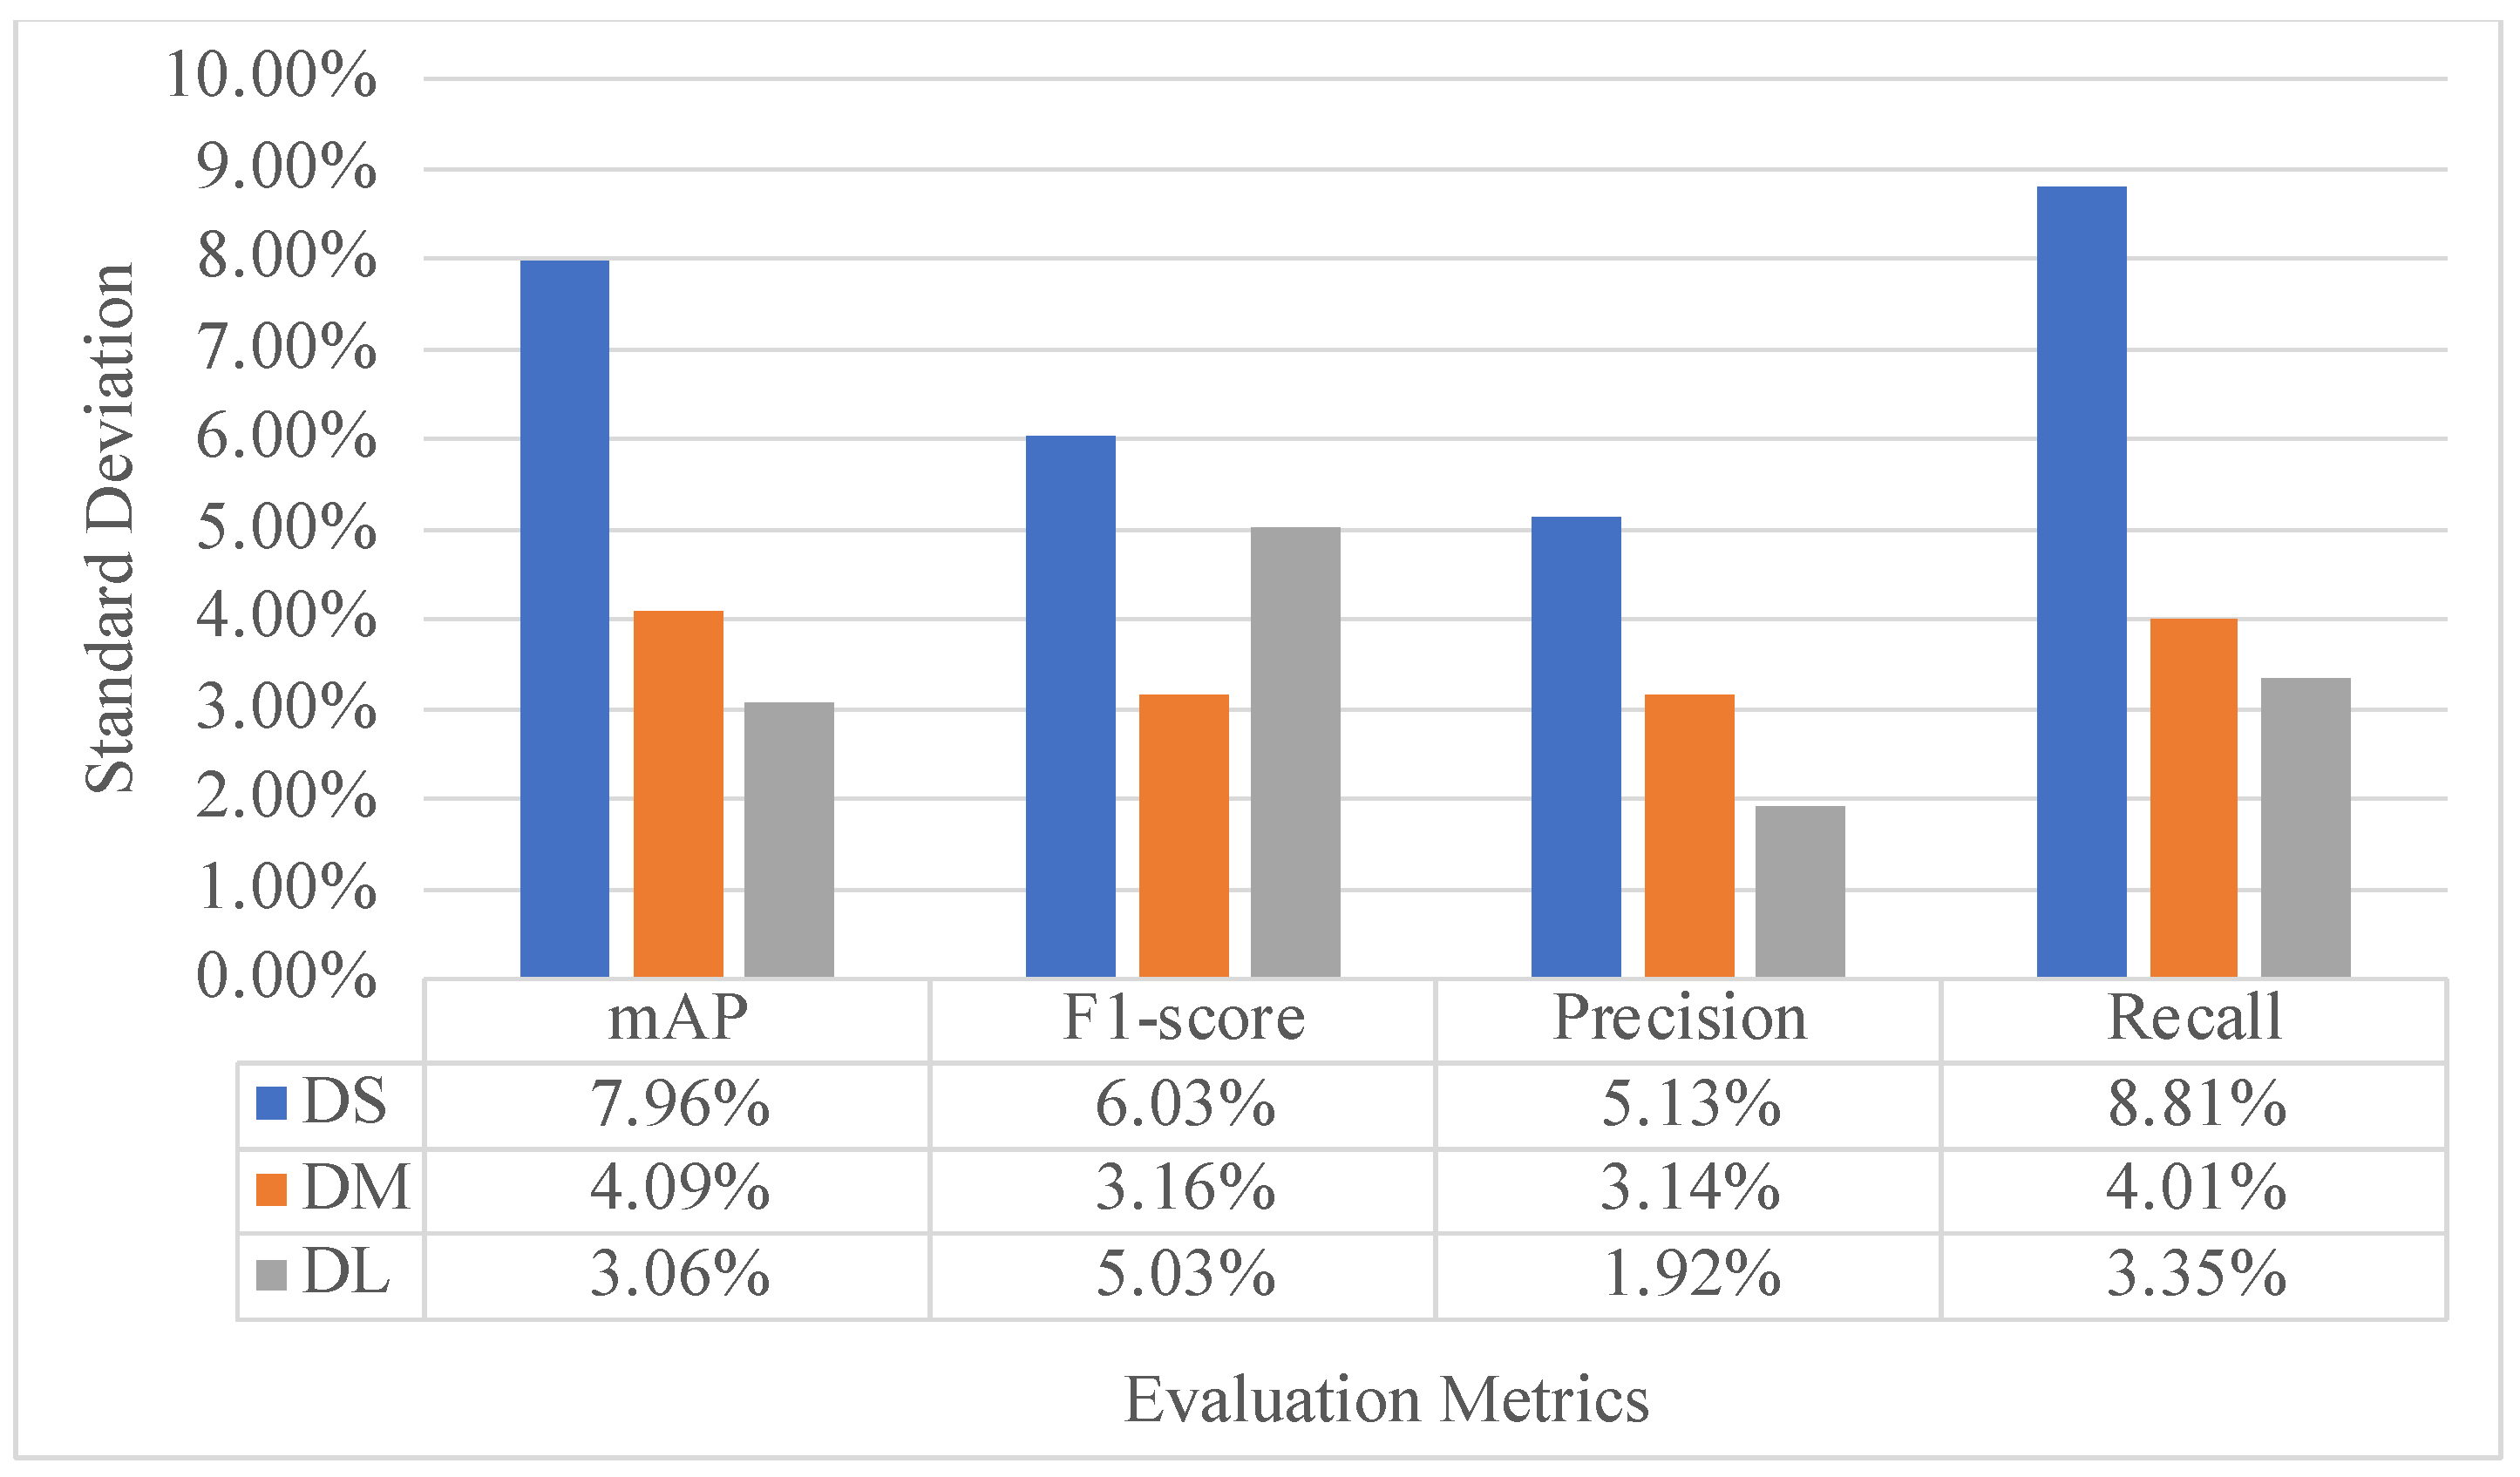
Figure 11 is presented to show the variability across cross-validation folds. In general, the standard deviation of evaluation metrics decreases along with the increase in dataset size. The DL can achieve a standard deviation of about 5% or less for all evaluation metrics.
With this result, the DL dataset looks sufficient to achieve precision, recall, and an F1-score of approximately 90%. However, in order to achieve superior performance, a larger quantity of properly trained data is necessary. More variations in data augmentation could be explored further to improve the detection performance of YOLOv7 significantly.
4.2. Hardware Performance Evaluation
In the hardware evaluation performance, there are three edge computing platforms evaluated, which are Raspberry Pi 4B, Jetson Nano, and Jetson Orin Nano. As a benchmark, we also simulate a desktop PC.
Table 3 shows the hardware evaluation results. It shows that the detection processing time in Raspberry Pi 4B is significantly longer compared to other platforms, which is 16.4 s. From this result, we can understand that the YOLOv7 is not possible for real-time detection on the Raspberry Pi 4B platform. The Jetson Nano in default mode (FP 32) achieves a 1.24 s detection time, while it achieves 0.33 s for FP16 mode. The Jetson Orin Nano, as expected, achieves the shortest detection time, which is less than 0.08 s for every mode. Raspberry Pi 4B achieves the least RAM utilization at 3119 megabytes (MB). However, the RAM utilization of Jetson Nano and Jetson Orin Nano is still acceptable in the 4000–6000 MB range. Raspberry Pi 4B also achieves the least power consumption at 4590 milliwatts (mW). The power consumption of the Jetson Nano and Jetson Orin Nano is larger, which is in the range of 6000–8000 mW. It means Raspberry Pi 4B can reserve battery power longer than Jetson Nano and Jetson Orin Nano.
On the other hand, using YOLOv7-tiny on Raspberry Pi4B can reduce the inference time to 2.74 s. While the YOLOv7-tiny can achieve 0.06 s inference time using FP16-quantized model on Jetson Nano with the TensorRT framework, and it can achieve 0.008 s inference time using an INT8 quantized model on Jetson Orin Nano with the TensorRT framework. In terms of RAM utilization and power consumption, the implementation with Raspberry Pi 4B achieves the lowest RAM utilization and power consumption.
It is also interesting to evaluate the real-time performance based on the utilized edge deep learning framework. For example, the implementation of YOLOv7 with the ONNX framework can reduce the inference time to 5.10 s, which is much lower compared to the implementation with OpenVINO (16.40 s). It occurs due to the better support of the ONNX runtime for ARM CPU-based devices, such as Raspberry Pi. ONNX runtime can leverage multi-threading more efficiently on ARM CPU. Moreover, the ONNX runtime also supports model quantization, which can enhance the inference time even more. In the case of Jetson devices, the implementation with TensorRT can reduce the inference time for every case of implementation compared to PyTorch. For example, it can reduce the inference time for quantized YOLOv7 from 1.24 s to 0.33 s. This result can be obtained due to the hardware-specific optimization performed by TensorRT for NVIDIA GPUs, including those in Jetson devices [
36].
The model quantization is also conducted in this evaluation. In the Raspberry Pi case, the quantized INT8 YOLOv7 model can enhance the inference time to 2.51 s. While the quantized INT8 of the YOLOv7-Tiny model can enhance the inference time to 0.3 s. In the Jetson case, the quantized INT8 YOLOv7 model can enhance the inference time to 0.02 s. While the quantized INT8 of the YOLOv7-Tiny model can enhance the inference time to 0.08 s. It means the model quantization can improve the real-time detection performance even more.
Table 4 shows the comparison of accuracy among the evaluated methods. It shows the
mAP performance difference with YOLOv7 FP-32 bits that is used as a benchmark. In the case of quantized YOLOv7, the YOLO-v7 INT8 only suffers a 1.6% decrease in performance. While, in the case of quantized YOLOv7-Tiny, it suffers a 2.3% decrease in performance compared to YOLOv7 FP-32. It also only suffers 2% performance compared to the YOLOv7-Tiny FP-32. Therefore, it can be understood that the use of lightweight models such as YOLOv7-Tiny and model compression such as quantization can significantly improve real-time performance and reduce resource consumption without a significant decrease in accuracy performance.
From this result, we can understand that even though Raspberry Pi 4B achieves the best RAM utilization and power consumption, the significant amount of detection time makes the implementation of YOLOv7 in Raspberry Pi 4B not possible for real-time detection. Some optimization techniques are required for implementation on Raspberry Pi 4B, such as implementing a light-weight model (YOLOv7-Tiny), careful edge deep learning framework selection, and model quantization. On the other hand, the implementation of YOLOv7 and YOLOv7-Tiny using Jetson Nano and TensorRT with FP16 models shows the promising performance. It achieves very low detection time with acceptable RAM utilization and power consumption.
It is also important to note that the Jetson Orin Nano price (670 USD) is much more expensive than the Jetson Orin Nano (200 USD) and Raspberry Pi 4B (75 USD) as shown by price in
Table 2. In the case of real-time performance, the best performance of YOLOv7-Tiny in Raspberry Pi (INT 8 ONNX), Jetson Nano (FP 16 TensorRT), and Jetson Orin Nano (INT 8 TensorRT) is 0.3 s, 0.03 s, and 0.008 s, respectively. While, in terms of power consumption, the performance on three different platforms is only slightly different. Therefore, if we consider the trade-off between price, real-time performance, and power consumption, the Jetson Nano might be more feasible compared to other platforms. It is equipped with a GPU but comes with a moderate price. In order to improve the real-time performance even more on resource-constrained edge devices, some model compression techniques can be considered, such as layer pruning [
37], layer fusion [
38], and knowledge distillation [
39].
5. Conclusions
This study addressed the utilization of the YOLOv7 series model on the edge computing platform to detect OPL components. In order to obtain a specific detection performance, three possible dataset sizes are trained using YOLOv7 to determine the required training datasets. The experimental results demonstrate that we can attain satisfactory detection performance using the DL datasets. From the detection performance result, we also understand that the applied data augmentation method still does not improve the detection performance significantly. From hardware performance evaluation, we understand that we can achieve real-time detection with Jetson Nano and Jetson Orin Nano with default mode. Optimization with TensorRT in Jetson Nano makes Jetson Nano the most feasible edge computing device for real-world implementation if we consider the performance and cost. On the other hand, some optimization techniques are required for feasible implementations on Raspberry Pi 4 platforms. This study still has some limited assumptions for further improvement; for example, we still do not consider the video streaming and video pre-processing aspects during the real-time inspection. And also, the dataset is taken from the ground that might have different characteristics with data taken from the drone, such as in terms of lighting conditions and shadows.
In the real-world deployment of drone-based OPL inspection, several key challenges might arise. For example, latency issues during real-time streaming. The large volumes of high-resolution video data that must be processed or transmitted with minimal delay can strain communication links and edge computing resources. In addition, integrating specialized AI systems directly into drone platforms requires careful attention to onboard hardware constraints—such as limited processing power, battery capacity, and payload weight—to ensure that computational demands do not compromise flight performance or safety. Finally, thorough field testing under diverse environmental conditions, such as varying weather and light conditions, is essential for validating system accuracy and overall effectiveness.
In future work, we consider exploring the implementation on other edge computing platforms, such as FPGA and Google Coral to achieve high accuracy, real-time, and low-power performance. We also consider exploring more advanced model compression techniques such as pruning, knowledge distillation, and layer fusion for more optimized performance on edge devices. Since the large number of training data are important for this research, more variations in data augmentation methods such as rotation, brightness variation, cropping, or Gaussian noise can also be explored further in the future to improve the detection performance of the deep learning method. We also consider taking more realistic data using a camera installed on the drone to develop a dataset for our future research. We would also like to consider latency issues during real-time video streaming.


