Article

Heart Rate Variability-Based Stress Detection and Fall Risk Monitoring During Daily Activities: A Machine Learning Approach

by
Ines Belhaj Messaoud
1 and
Ornwipa Thamsuwan
2,*
1
Department of Software and Information Technology Engineering, École de Technologie Supérieure, Montreal, QC H3C 1K3, Canada
2
Department of Mechanical Engineering, École de Technologie Supérieure, Montreal, QC H3C 1K3, Canada
*
Author to whom correspondence should be addressed.
Computers 2025, 14(2), 45; https://doi.org/10.3390/computers14020045
Submission received: 2 December 2024 / Revised: 17 January 2025 / Accepted: 20 January 2025 / Published: 30 January 2025
(This article belongs to the Special Issue Wearable Computing and Activity Recognition)

Abstract

:
Impaired balance and mental stress are significant health concerns, particularly among older adults. This study investigated the relationship between the heart rate variability and fall risk during daily activities among individuals over 40 years old. This aimed to explore the potential of the heart rate variability as an indicator of stress and balance loss. Data were collected from 14 healthy participants who wore a Polar H10 heart rate monitor and performed Berg Balance Scale activities as part of an assessment of functional balance. Machine learning techniques applied to the collected data included two phases: unsupervised clustering and supervised classification. K-means clustering identified three distinct physiological states based on HRV features, such as the high-frequency band power and the root mean square of successive differences between normal heartbeats, suggesting patterns that may reflect stress levels. In the second phase, integrating the cluster labels obtained from the first phase together with HRV features into machine learning models for fall risk classification, we found that Gradient Boosting performed the best, achieving an accuracy of 95.45%, a precision of 93.10% and a recall of 85.71%. This study demonstrates the feasibility of using the heart rate variability and machine learning to monitor physiological responses associated with stress and fall risks. By highlighting this potential biomarker of autonomic health, the findings contribute to developing real-time monitoring systems that could support fall prevention efforts in everyday settings for older adults.

1. Introduction

The risk of losing balance and falls is one of the major public health concerns. According to the World Health Organization (WHO) in 2021, every year, around a third of people over 65 experience a fall, making it one of the leading causes of injury and hospitalization in this age group [1], and the fall prevalence has risen to 42% among people at the age of 70 years or older [2]. This issue has become urgent due to the aging of the baby boomer generation. While physiological factors such as reduced muscle strength and proprioception are primary contributors to balance impairments [3], psychological factors, such as the fear of falling, and environmental risks related to unsuitable living conditions also contribute to the fall risk [4]. These multifaceted risk factors highlight the complex interplay between the physical and psycho-physiological components that affect postural control.
In addition to the aforementioned factors, stress has emerged as a significant contributor to the fall risk. Chronic stress can disrupt the autonomic nervous system (ANS), often resulting in a reduced heart rate variability (HRV), which is an essential indicator of the body’s adaptability to environmental demands [5]. HRV analysis has thus become a tool for assessing responses to physiological and psychological stress, particularly in the elderly, whose ANS regulation may be altered by health conditions or age-related changes. Given that ANS responses to stress can influence postural balance, HRV analysis could aid in the detection and prevention of falls.
The following subsections provide a literature review on the connections between the HRV, stress and postural balance. The association between HRV parameters and stress are examined, along with advances in algorithms for stress prediction based on HRV data. Finally, this section ends with the objectives of this present study.

1.1. Heart Rate Variability, Stress and Postural Balance

Problems with postural balance sometimes coincide with increased stress, because stress can interfere with motor control, further affecting stability [6,7]. Consequently, effective fall prevention strategies should account for stress management to support physiological mechanisms essential for postural balance [3]. In the elderly, a low HRV, which is often a result of chronic stress, has been linked to diminished postural control. This reduction in the HRV, which signifies heightened sympathetic nervous system activity, has been associated with a reduced ability to maintain posture [5,8]. This connection between a low HRV and impaired balance highlights the importance of considering stress-related autonomic dysfunction in assessing fall risks.
The HRV provides a non-invasive measure of ANS responses to external stimuli, with specific parameters indicating the balance between sympathetic and parasympathetic activities. Previous research has demonstrated a relationship between reductions in the HRV and both short-term [9] and long-term [10] stress. That is, an occupational health study [9] revealed that the HRV was strongly correlated with the perceived stress level of employees. In terms of chronic stress, the other study [10] found a statistically significant difference in HRV measures between the stressed and non-stressed student groups.
HRV parameters could be derived from electrocardiogram (ECG) signals and used to indicate stress patterns [11,12,13]. A meta-analysis [11] revealed that an ANS imbalance was associated with changes in some HRV parameters including the following:
  • RR Intervals: The intervals between consecutive heartbeats.
  • The Standard Deviation of RR Intervals (SDRR): This measures the variability in RR intervals.
  • The Root Mean Square of the Successive Differences in RR Intervals (RMSSD): This quantifies the short-term variability in RR intervals.
  • The Proportion of NN50: The number of pairs of successive RR intervals that differ by more than 50 ms, divided by the total number of RR intervals, denoted as pNN50.
  • Spectral Power in High-Frequency Components: This reflects the parasympathetic activity.
  • Low-Frequency/High-Frequency Ratio (LF/HF Ratio): This indicates the balance between sympathetic and parasympathetic nervous system activities.
An ECG could be a component of a wearable device [14,15], enabling stress detection in real-world situations. Besides ECGs, another wearable sensor, the Polar heart rate monitor, which measures beat-to-beat intervals, has already been validated to be able to obtain reliable HRV parameters [16,17].
Furthermore, integrating the HRV with parameters from additional physiological signals, such as an electroencephalogram (EEG) [18], electromyography (EMG) [15,19,20,21] and electrodermal activity (EDA) [21], could enhance the stress detection accuracy. For example, a study on cardiovascular health among the elderly employed a software tool, “PhysioLab” (version 1.0, developed using Matlab release 2013a), to visualize physiological responses during physical activities [21] and used clustering and regression techniques to analyze the heart rate (HR), HRV and maximal oxygen consumption ( V O 2 max). The study found significant correlations between these metrics and traditional fitness assessments, underscoring the value of a multivariate approach in assessing both physical and mental stress in the elderly.
The application of the HRV for monitoring stress levels is particularly relevant in high-stress professional environments. A systematic review [22] examined the use of the HRV as a stress indicator among emergency physicians, a profession known for its high levels of psychological stress. The study showed the associations of HRV measures with long working hours, exposure to traumatic events and the cognitive load. In addition, wearable ECG together with smartphone applications could help detect stressful events in on-duty firefighters [23]. Due to the non-invasive nature of the HRV and its sensitivity to various stressors, the HRV was proposed as a screening tool to prevent professional burnout in high-stress occupations. Given this information,  HRV analysis might also be useful for the detection of stress and, eventually, balance loss in the elderly.

1.2. Machine Learning in HRV Analysis

With the recent advancement of machine learning algorithms, various studies have applied both traditional and deep learning models to improve the accuracy and adaptability of stress detection methods. The aforementioned systematic review [22] underlined the effectiveness of machine learning, particularly those methods incorporating logistic regression and random forest (RF) classifiers, for detecting stress states. After that, another study on a large dataset (WESAD) [12] proposed a Support Vector Machine (SVM) model applied to HRV parameters to detect stress with an accuracy of 94.8%, outperforming the k-Nearest Neighbor (KNN) and Classification and Regression Tree (CART) models.
Deep learning applied to HRV parameters and other physiological signals such as EMG signals has shown promise for the classification of stress states. A previous study [19] employed a deep learning framework to classify patients with sleep disorders, including obstructive sleep apnea (OSA) and restless legs syndrome (RLS), using ECG and EMG signals. These disorders, generally associated with mental stress, were detected using signal processing techniques such as a synchro-squeezed wavelet transform (SSWT) and modeled using a multimodal deep neural network (DNN). The approach achieved an average accuracy of 72%, outperforming conventional methods, including multilayer perceptron (MLP), SVM, RF, KNN and XGBoost models. These findings supported the role of deep learning in enhancing our understanding of the relationship between stress and sleep disturbances.
A comparison of HRV- and ECG-based models for stress detection [24] showed the adaptability of HRV measures in a range of situations. A study on fatigue detection in firefighters [25] demonstrated the effectiveness of XGBoost algorithms and decision trees in classifying fatigue levels during intense physical exercise. Key physiological features, including the HR, respiratory rate and body temperature, were segmented into one-minute intervals to enable the precise assessment of fatigue state changes. The group cross-validation technique ensured the generalizability of the results, with an accuracy of up to 82% for detecting fatigue levels.
Moreover, a previous study proposed a personalized approach to stress detection by applying unsupervised learning techniques to open-source data (WESAD) as well as field data collected via wearable sensors [26]. The fully customized model, based on a Self-Organizing Map (SOM), achieved an accuracy of 92% on field data, outperforming generic models, which had an accuracy of 60%. Then, stress patterns were further discovered through K-means clustering, which successfully grouped trends in HRV characteristics.
Finally, a related study on continuous stress assessment [20] developed a fuzzy clustering system based on HRV and EMG features to estimate a Mental Stress Index (MSI) and segment it into three levels: low, moderate and high. With an average accuracy of 96.7% for the moderate- and high-stress classes, the results demonstrated a significant link between the perceived stress score and the MSI. This high model performance was also achieved through the application of the sliding window methodology and real-time assessment, showing that HRV-based methods, when combined with fuzzy clustering, can be adapted to dynamic contexts to track variations in stress.
In summary, the applications of machine learning to HRV analysis have given us valuable insights into stress detection across diverse settings, from high-stress professions to clinical and personalized health.

1.3. Objectives of the Study

Building on the previously described foundations, this study aimed to explore how the HRV can inform our understanding of stress and postural balance in healthy adults. The specific objectives of this study were twofold. First, we identified patterns in the HRV that may indicate stress during daily activities, using clustering techniques to uncover natural groupings in the data. Second, through supervised classification, we evaluated whether HRV features can be used to predict the fall risk by categorizing balance states as “low risk” (steady balance) and “high risk” (impending loss of balance) through supervised machine learning methods. This work is meant to establish a foundation for developing pragmatic tools, such as wearable devices, to monitor balance continuously and warn individuals of potential falls.

2. Materials and Methods

2.1. Participants

A total of 14 participants (6 women and 8 men), with an average age of 59.0 years (standard deviation (SD) of 10.5), average weight of 75.1 kg (SD of 15.0) and average height of 170.9 cm (SD of 9.2), reflecting a broad spectrum of a healthy population in middle age as well as older adults, were recruited. Before participating in the research, all individuals underwent a preliminary screening to confirm their eligibility based on health criteria established in the study protocol. Additionally, the participants were asked not to consume caffeine 3 hours before the experiment.
This study was approved by the Research Ethics Comittee of the École de technologie supérieure (Reference No. H20221103) on 2 February 2023. All the participants provided their informed consent before participating in the study.

2.2. Data Collection

The participants were equipped with a heart rate monitor (Polar H10, Polar Electro Oy, Kempele, Finland) connected to a smartphone on which Elite HRV software (version 5.5.9, Elite HRV LLC) was used to measure the participants’ inter-beat intervals (IBIs) at a sampling rate of 250 Hz throughout the experiment period.
The experimental activities were carefully chosen to mimic daily activities that most healthy persons could do. Participants performed the tasks prescribed in the Berg Balance Scale (BBS) [27], which included sitting, standing and transitioning from one position to another. The BBS method was chosen as one of the commonly used tools for assessing functional balance [28].
Before the start of the BBS test, a 10-min quiet sitting period was prescribed as a baseline for the body’s unstressed state. After completing each task, two researchers gave a BBS discrete score for the participant’s performance. This score ranged from 0 to 4, representing the dependency of the participant in performing each task. A score of 4 meant that the participant exhibited no noticeable imbalance during tasks, whereas a score of 0 meant that the participant was unable to maintain balance and needed support.

2.3. IBI Signal Pre-Processing

In this part, we explain the processing steps we applied to ensure that all artifacts and noise were removed.
In the dynamic environments of everyday life, capturing clean physiological signals could be a challenge. The collected IBI data were susceptible to artifacts from body movements which can affect the derived HRV [29] and, thus, necessitated careful error removal. To remove motion artifacts and environmental noise, we employed both a median filter and a Butterworth low-pass filter [30].
The median filtering was performed by replacing each data point with the median of points within its 5-point window. This method reduced the sharp fluctuations in the IBIs. A 5-point window median filter was chosen after a preliminary analysis comparing different window sizes (from 2 to 10). After that, we implemented a 4th-order Butterworth low-pass filter with a 20 Hz cutoff frequency to remove the higher frequency noise in the IBI signal.

2.4. HRV Feature Extraction

In this subsection, we present the HRV parameters used further in the next step, as well as their significance in the interpretation of the ANS activity and their methods of derivation.

2.4.1. Non-Linear Dynamics

We created a Poincaré plot from the filtered IBIs for each of the 14 participants. From the Poincaré plots, we computed the SD1 and SD2 indices, which represent the short- and long-term HRV variability, respectively [31].

2.4.2. Time Domain HRV

We converted each filtered IBI signal into HRV parameters. We chose to explore the following parameters in the time domain analysis to understand the basic principles of HRV:
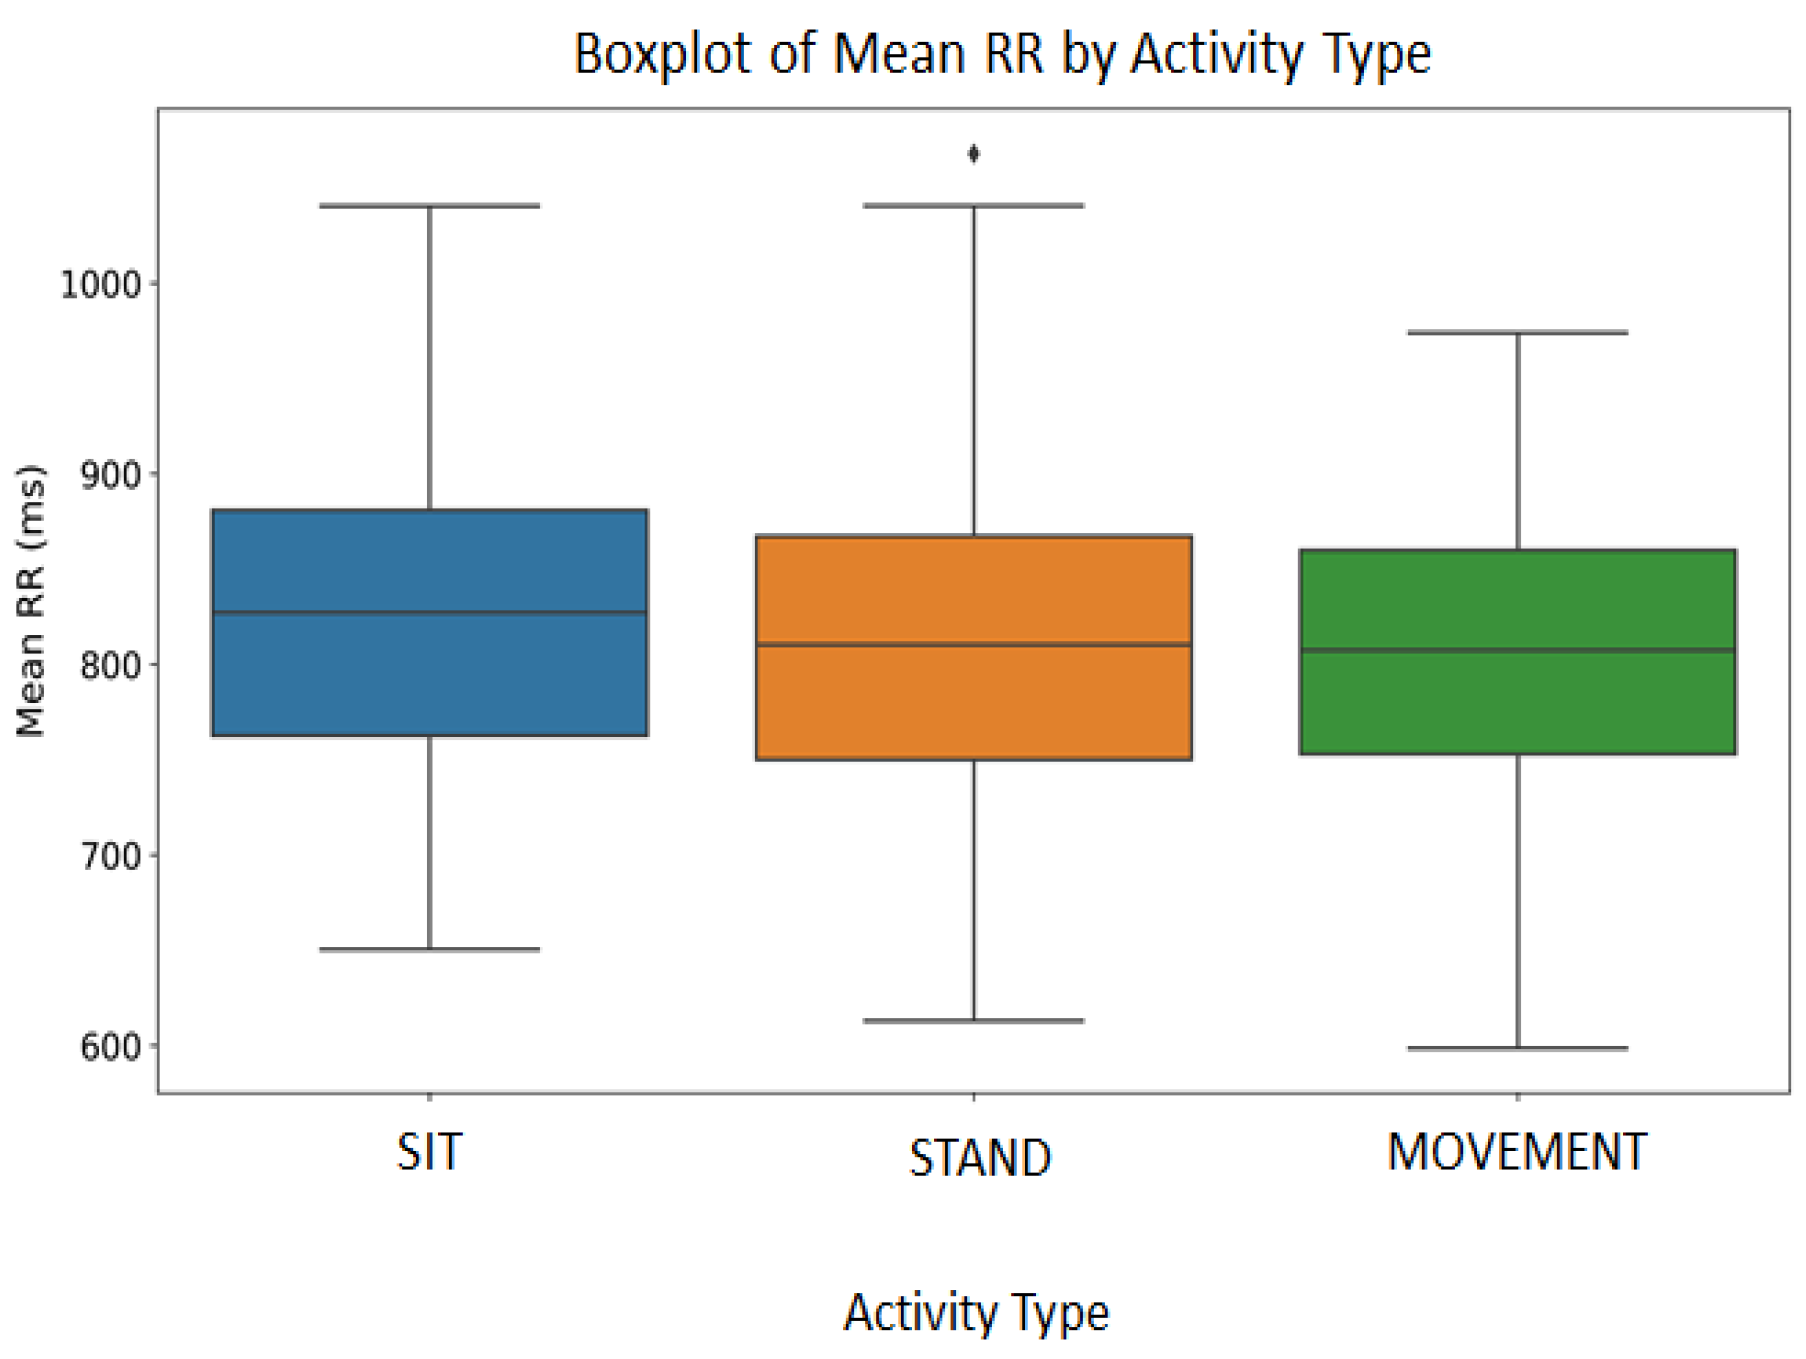
  • Mean RR: We assumed that the IBI signals could be used as RR intervals. For each participant and each of the 14 BBS tasks, we calculated the mean of the IBI intervals.
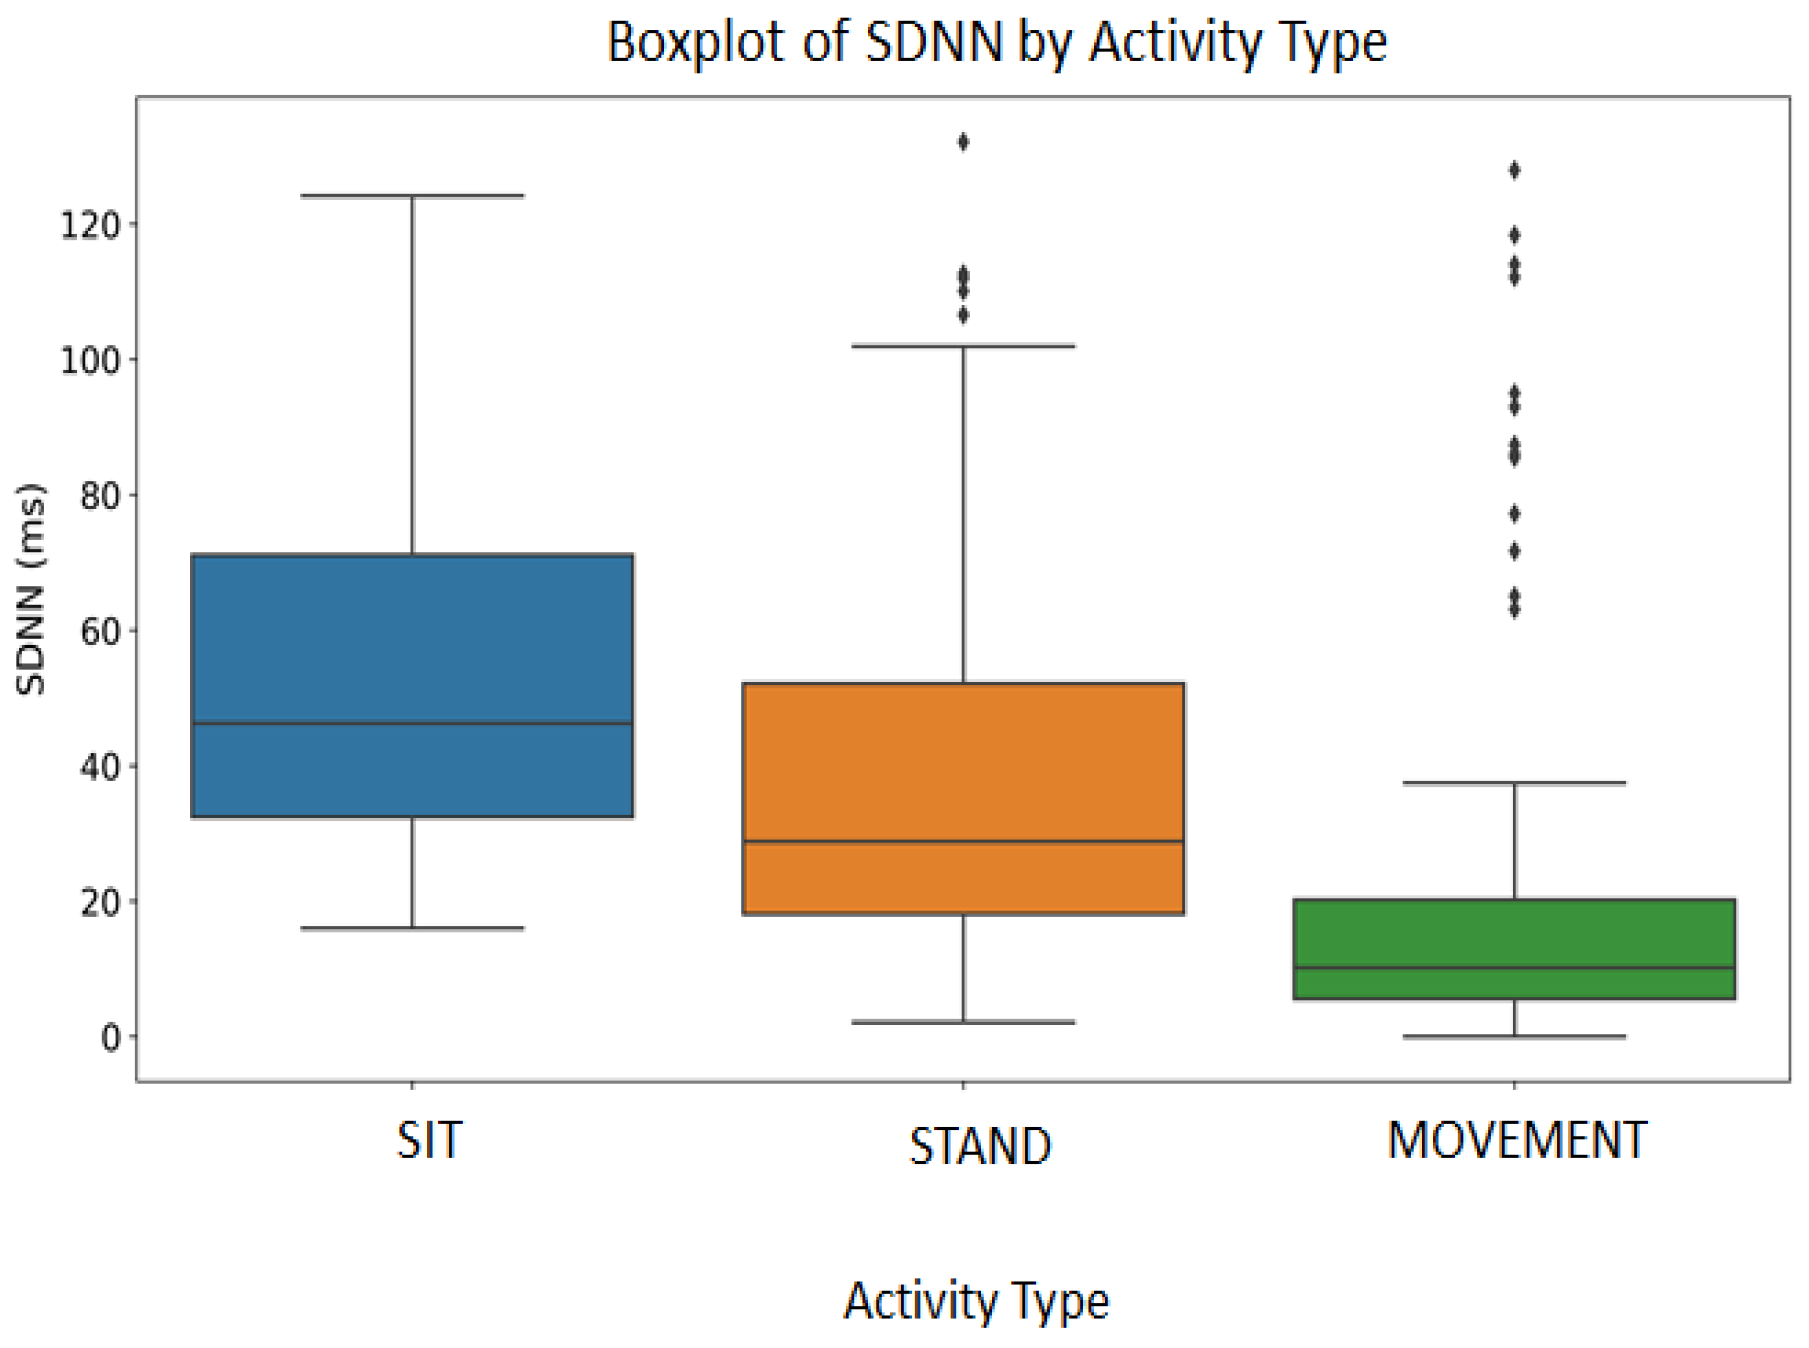
  • SDNN: To evaluate the total HRV, we first extracted the successive changes between heartbeats that were considered normal, or NN intervals (normal-to-normal intervals), and then calculated their standard deviation. This metric captures the fluctuations in the HRV.
  • RMSSD: The parasympathetic ANS activity could be represented by the root mean square of successive deviations between the NN intervals. This measure could identify the quick variations in the HRV.
  • pNN50: We quantified the number of times that IBIs differed by more than 50 ms (NN50) and expressed this as a percentage of the total (pNN50). This measure evaluates the frequency of significant changes in the HRV.

2.4.3. Frequency Domain HRV

We conducted a spectral analysis of the filtered IBIs to explore trends in the oscillatory parts of the heart rate signals. We were interested in the following frequency domain HRV parameters:
  • The LF Power, or the spectral power in the low-frequency band (0.04–0.14 Hz): The LF Power is typically associated with both sympathetic and parasympathetic ANS activities. This parameter may reflect baroreceptor activity and indicate the human body’s response to various stressors and regulatory processes related to blood pressure control [32].
  • The HF Power, or the spectral power in the high-frequency band (0.15–0.50 Hz): The HF Power is predominantly associated with parasympathetic activity, reflecting respiratory sinus arrhythmia [33]. Since this parameter is responsive to breathing, it can assess the vagal tone, which is crucial for relaxation and rapid stress recovery.
  • The LF/HF ratio: The ratio between the LF Power and HF Power can provide information on the balance between the sympathetic and parasympathetic ANS activities. A higher LF/HF ratio indicates the dominance of sympathetic activity relative to parasympathetic activity, while a lower ratio suggests the opposite.
  • The Total Power, or TP: This measure simply takes the sum of the spectral power within the range from 0 to 0.5 Hz.

2.4.4. HR Measurements

Heart rate (HR) signals were created by inverting the IBI signals. We then computed the statistics of the HR, including the mean, standard deviation, minimum and maximum. These measures completed our knowledge by providing a comprehensive picture of cardiac activity.

2.5. Physical Activity Categorization

Since different physical activities among the 14 BBS tasks could differently affect the HRV but may not necessarily be stressful, we added a categorical variable of the activity type to adjust for this effect. That is, we divided the activities into three categories: SIT, STAND and MOVEMENT. Specifically, we assigned each activity to one of the three groups based on the nature of the physical task:
  • SIT: This category included activities characterized by a long time of sitting or resting in a sitting posture. In these time periods, we expected participants to exert minimal physical effort, but their mental or cognitive load remains uncertain.
  • STAND: Unlike sitting or vigorous exercise, activities that require participants to stay standing still for an extended period could put their cardiovascular systems through a distinct kind of strain. In this category, the standing activities included standing with one leg, standing with their eyes closed and standing with two legs in tandem.
  • MOVEMENT: We considered that physical movements may cause greater cardiovascular activity, which could cause noticeable alterations in the HR and possibly also in the HRV. These activities included but were not limited to changing posture from sitting to standing and vice versa, turning around to look behind them, and squatting or bending over to pick up an object from the floor.
Using dictionary mapping, we assigned each activity in our dataset to one of the three categories.

2.6. Clustering Analysis

Before applying a clustering algorithm, it was crucial to ensure the accuracy of the data. We dealt with incomplete data by replacing the missing values with the mean value of each feature. After that, we standardized the data to ensure all HRV features were on the same scale; that is, equally important in the clustering. We coded every parameter using the Z-Score normalization technique so that the standardized features had a zero mean and a unit variance.
We applied the K-means clustering algorithm with the hypothesis that each cluster might be indicative of a distinct physiological state or response pattern, providing information about the behavior of the ANS. With the K-means clustering, one of the major choices was the number of clusters. We used the Elbow Method to figure out this number by plotting the Sum of Squared Errors (SSE) against the number in the cluster. We looked for a knee in the plot where the SSE stopped decreasing as quickly. In addition, to test the quality of the clusters formed, we calculated the silhouette score, which quantifies how similar each point is to other points in its own cluster compared to points in a nearby cluster. A high silhouette score denotes that clusters are well defined and separate from one another. The silhouette score runs from −1 to +1.
After obtaining the clusters, we used an ANOVA to test which features contributed most to differentiating these groups. A significance level of 0.95 was used to determine if any HRV parameters were different across the K clusters.
Lastly, as we wanted to understand further if there was any link between the membership of clusters and the activity-type feature, we built a contingency table and conducted a Chi-squared test with a significance level of 0.95.

2.7. Binary Classification of BBS

In addition to unsupervised clustering to group the stressful moments, we further exploited machine learning techniques to predict the moment of balance loss based on HRV features. That is, we expected that HRV features may contribute to the prediction of balance loss. We used the BBS scores to indicate the moment when the participant lost their postural balance.
Since most of the male participants had nearly perfect BBS scores, resulting in a lack of data for the balance loss class, we only used data from the female participants, where greater variability in BBS scores offered a more balanced dataset for model training and validation.

2.7.1. Data Preparation

A new binary variable called the Binary-BBS was created to replace the original categorical BBS scores. The BBS scores of 4 were coded as “0” (absence of imbalance), while the other scores, including 0, 1, 2 and 3, were coded as “1” (presence of imbalance).
Nevertheless, the classes of the targeted variable, the Binary-BBS, were initially unbalanced, with 69.79% of observations in class “0” (absence of fall risk) and 30.21% in class “1” (presence of fall risk). Therefore, the Synthetic Minority Oversampling Technique (SMOTE) was applied to mitigate this issue. With this SMOTE technique, new synthetic samples were generated by interpolating between an existing minority example and one of its nearest neighbors that belonged to the same class. The formula is shown as Equation (1):
x new = x i + λ ( x j x i )
where the following apply:
  • x i is an example of the minority class;
  • x j is one of the k nearest neighbors of x i ;
  • λ is a random number in the interval [ 0 , 1 ] .
Note that, for the baseline resting period, the Binary-BBS value was set to 0, reflecting the assumption that participants do not exhibit postural imbalance while resting. Categorical features, such as the activity type, were encoded using Python 3.7 OneHotEncoder library [34] to transform these categorical values into multiple binary features.

2.7.2. Machine Learning Classifiers, Performance Metrics and Cross-Validation

We employed several classification algorithms to predict the Binary-BBS based on HRV features. The classification approach was developed using a variety of methods including logistic regression, a random forest classifier, a Gradient Boosting classifier, an AdaBoost classifier, a Support Vector Machine, multilayer neural networks, XGBoost, LightGBM and CatBoost.
The performance metrics—accuracy, recall, precision and F1 score—were used to evaluate the models’ ability to classify these binary balance states. Among these, the recall was critical to ensure the model captured all high-risk moments, minimizing missed instances of instability in balance. The precision validated the reliability of the model in predicting high-risk moments, ensuring the identified instances were indeed associated with potential balance loss. The F1 score, as the harmonic mean of the precision and recall, provided a balanced evaluation of the model’s performance, especially important in the presence of a class imbalance.
To finely tune the hyperparameters of the classifier to optimize the model performance, GridSearchCV was employed for each classification model. That is, we performed an exhaustive search over a predefined grid of hyperparameter values in Table 1 and identified the best combination based on the cross-validated performance.

3. Results

3.1. Poincaré Plots

The Poincaré plots (Figure 1) for the 14 participants represent a variety of patterns in the HRV, which reflect distinct ANS dynamics. We can distinguish shapes like the following:
  • Elliptical or Torpedo-Shaped Plots: Data from many participants displayed plots with a prominent, elongated elliptical shape (Participants 1, 3, 4, 6, 10 and 12), typically oriented along a 45-degree line through the origin. Such shapes generally suggested a healthy balance between sympathetic and parasympathetic ANS activities. The width on the x-axis of the ellipse (SD1) was a short-term HRV measure, while the length (SD2) on the y-axis indicated a long-term HRV variability measure [35].
  • Dispersed Patterns: Some plots showed more scattered yet elliptical distributions (Participants 5, 7, 8, 9, 13 and 14). These patterns may indicate an irregular HRV, often linked to heightened stress responses [36].
  • Dense Clustering: Some plots featured tightly clustered patterns (Participants 2 and 11), with points densely packed near the identity line ( y = x ). This pattern could suggest a reduced HRV, potentially signaling cardiac instability or early-stage cardiovascular issues. Research has associated tightly clustered Poincaré plots with high risks of cardiac events [37].

3.2. Exploratory Data Analysis

In our study, activities were not equally represented in the dataset. The counts of each activity type were as follows: MOVEMENT: 98 cases; SIT: 28 times; and STAND: 98 times.
As shown in Figure 2, the box plot of the Mean RR illustrates the distribution of the average time between heartbeats across the three categorized activities. The SIT activity showed a higher median of the Mean RR than the STAND and MOVEMENT activities (890.0 ms for SIT, compared to 870.0 ms and 850.0 ms for STAND and MOVEMENT, respectively). In the MOVEMENT activity, the Mean RR lay in a lower range, from approximately 600 ms to 950 ms, compared to those in SIT and STAND activities. This resulted from the quicker heart rate required for metabolism.
Figure 3 shows the box plot of the SDNN, which sheds light on the HRV across the three categories of activity types. That is, for the SIT activity, we observed a higher HRV, with a median SDNN of approximately 45–50 ms. The range of the SDNN in this activity extended from about 20 ms to 120 ms, representing a stable parasympathetic autonomic response. Compared to SIT, the STAND activity showed a lower median SDNN of around 30 ms, with a range from approximately 5 ms to 100 ms.
The MOVEMENT activity demonstrated a lower median SDNN of about 10 ms, with a narrower range from approximately 5 ms to 35 ms. The reduced HRV during physical movement is indicative of a more consistent cardiac response.

3.3. K-Means Clustering

The curve in Figure 4 reveals that the most pronounced inflection occurred in three clusters. There was no more substantial change in the rate at which the decrease in the SSE occurred after three clusters. This point marks a transition where the addition of clusters did not result in much reduction in the SSE. Beyond this point, the curve begins to flatten, meaning that each new cluster brought a smaller marginal improvement.

3.3.1. Significant Features

The average (SD) of the HRV parameters within each cluster is shown in Table 2. Cluster 0 comprised 163 sessions with a Mean IBI of 845.60 ms, and the measures of variability included an SDNN of 39.00 ms and an RMSSD of 33.61 ms, which may indicate a resting or low-stress state. Cluster 1, with 59 sessions, had a reduced Mean IBI at 684.93 ms, a significantly lower SDNN at 16.52 ms and an RMSSD at 8.30 ms, suggesting increased sympathetic activity in response to stress. Cluster 2, although comprising only two sessions, showed a Mean IBI similar to that of Cluster 0 at 837.16 ms but with extreme values of variability, such as an SDNN at 120.85 ms and an RMSSD at 471.13 ms, which could indicate atypical physiological fluctuations or measurement artifacts. These two points corresponded to Participant 2, a female aged 71 years old, performing a sitting task. This subject was the only one who had reported during the screening that they had a heart disease.
According to the ANOVA, the p-value for the HF Power was smaller than 0.05 and close to 0, indicating statistically significant differences in the HF Power between clusters, underlining its crucial role in group distinction. Similarly, the NN50, which measures large variations between successive pairs of IBIs exceeding 50 ms, and the LF Power, which reflects variations in the low-frequency part of the HRV, both demonstrated strong significance (p-values < 0.05).
Moreover, the Mean RR, SDNN, RMSSD, pNN50, LF:HF ratio and all the statistical measures of the HR, including the Min HR, Mean HR, Max HR and STD HR, were also statistically significant, affirming their importance in the clustering. In other words, these parameters were influential in our clustering analysis. However, for the LF/HF Ratio, the p-value from the ANOVA was 0.40. Thus, this measure was not useful in distinguishing groups in our current dataset.

3.3.2. Vizualisation and Performance of K-Means Clustering

Figure 5 illustrates how clusters were separated according to the Mean HR and Max HR. Cluster 0, which is shown in purple, had lower Mean HR and Max HR values. For both metrics, it was usually grouped between 60 and 100. As for Cluster 1, represented in blue, we see that the cluster was composed of few points with high maximum and mean HRs. This group could indicate moments under intense stress or vigorous physical activity. Cluster 2, represented in yellow, contained periods with intermediate maximal and average HR values.
In Figure 5, it is clear that there is a positive correlation between the Max HR and Mean HR. This positive relationship is in line with the established theories that hold that periods of a higher maximal HR also tend to increase the average HR [38].
Nonetheless, the silhouette score of the K-means clustering was 0.33. This low score suggests that there was not much density in the clusters and/or that there was not much distinction between the various clusters.

3.3.3. Relationship Between Clustering Membership and Activity Type

As shown in Table 3, activities categorized as MOVEMENT (68 instances) and STAND (75 instances) made up the majority of activities in Cluster 0, with SIT (20 instances) being less common. This implies that the sessions in Cluster 0 might have been more active or involved standing-intensive activities, which could be indicative of an active lifestyle.
With a minimal count of SIT (6), Cluster 1 had a more balanced but notably smaller distribution of MOVEMENT (30) and STAND (23). This cluster may represent a group that engaged in various activities but recorded fewer total activity sessions. Cluster 2 was special since it had no MOVEMENT or STAND activities, but just two occurrences of SIT activities. They were found to be resting sessions.
A Chi-squared test showed that the activity type and cluster membership were dependent. The Chi-squared test statistic of 15.593 with five degrees of freedom yielded a p-value of 0.0036, resulting in the rejection of the null hypothesis of independence.

3.4. BBS Classification

The performance of different classification models applied to balance loss detection using HRV data showed varied results. As shown in Table 4, the Gradient Boosting model achieved the highest accuracy, recall, precision and F1 score.
This study evaluated several classification models to determine their effectiveness on the dataset, with varying results depending on the metric used.
The logistic regression model achieved a relatively high precision of 88.89% but a recall of 71.43%, translating into an F1 score of 55.56% and an overall accuracy of 72.41%. This model appeared to capture positive cases well but lacked the sensitivity to correctly identify all instances, which may have been due to its linear nature, limiting its ability to capture complex relationships in the data.
The random forest performed relatively well in terms of the overall accuracy (79.31%), but it had a low recall (42.86%), indicating that the model struggled to detect all positive instances. These results can be explained by a tendency to over-fit subsets of the data, making the model biased towards the majority class and limiting its ability to be generalized.
The SVM achieved a precision of 84.21%; however, just like the random forest, its recall was low (57.14%), leading to an F1 score of 47.06%. This moderate performance may have been linked to the SVM’s sensitivity to the parameter choice and its difficulty in properly separating classes in less linear data, especially in the presence of noise.
In contrast, Gradient Boosting achieved outstanding results on all metrics, with a precision of 95.45%, a recall of 85.71%, an F1 score of 85.71% and an overall accuracy of 93.10%. This good performance could be explained by the fact that Gradient Boosting is particularly effective for handling non-linear relationships and capturing complex interactions in data.
The XGBoost model’s performance followed closely behind, with 90.48% accuracy and 71.43% recall, achieving an F1 score of 66.67% and an overall accuracy of 82.76%. Like Gradient Boosting, XGBoost uses an ensemblistic approach but is often more optimized for fast calculations, which may explain why its performance was slightly lower on certain metrics.
LightGBM showed a precision of 83.33% and a recall of 42.86%, with an F1 score of 50.00% and an accuracy of 79.31%. Despite its optimization and speed capabilities, LightGBM appeared to have had difficulty identifying positive instances in this dataset.
For the CatBoost model, the precision was 86.96% with a recall of 57.14% and an F1 score of 61.54%, leading to an accuracy of 82.76%. Its overall performance was good, demonstrating its ability to handle categorical data efficiently.
AdaBoost showed solid performance in this study, with 91.30% precision, 71.43% recall, a 76.92% F1 score and 89.66% overall accuracy. This model works by giving more weight to misclassified observations during each iteration, allowing the model to gradually correct its errors.
Finally, the neural network showed the worst results compared to the other models, with a precision of 76.19% and a recall of 28.57%, resulting in an F1 score of 26.67% and an overall accuracy of 62.07%. This relatively poor performance may have been due to the fact that the model was not sufficiently trained or that it required more hyperparametric tuning to generalize well due to the inherent complexity of neural networks and their tendency to require large amounts of data to avoid under-learning.

4. Discussion

4.1. HRV and HR Among Various Physical Activities

Lower HRVs were associated with milder stress reactions and lower levels of aggression [39]. From the exploratory data analysis, it was found that participants had a lower HRV during the STAND activity compared to SIT. This lowered HRV was normal, as it reflected physiological adjustments to maintain posture and balance when standing. In other words, maintaining balance and the blood flow while standing requires an increased cardiac workload and ANS responses.
When we observed the MOVEMENT activity, we saw that the distribution of the HR and HRV was noticeably larger, which might be a sign that different directions and intensities of movement can cause dynamic changes in the HRV. High sympathetic activation during stress could also be accompanied by high heart rates and greater reductions in parasympathetic activity [40].

4.2. Clustering Analysis Based on HRV and HR

To being with, it should be mentioned that there were only two observed sessions in Cluster 2. This cluster may represent a state of moderate relaxation, which was also mentioned in a previous study [10] showing that individuals with moderate HRV levels often showed reduced variations in response to stress, indicating a balance between rest and light-to-moderate activity.
While the activity types appeared to be more evenly distributed between clusters, MOVEMENT sessions were concentrated in a single cluster. The significant result in the Chi-square test confirmed that the cluster membership was possibly influenced by characteristics intrinsic to each activity type. Thus, clustering based on the HRV did not directly reflect the types of activities undertaken by participants. Our research is significant as it highlights that the HRV, although often used as an indicator of mental stress, can be influenced by factors independent of physical activities.
The results of K-means clustering played a fundamental role in enriching the features used in the classification models. Indeed, the cluster label, resulting from the K-means, was integrated as a new additional feature in our database, enabling us to exploit the similarities and distinctions discovered between participants to improve the quality of predictions.

4.3. Balance Loss Prediction

It should first be noted that the most important performance metric in our study was the recall since it assessed the ability of models to detect the incidence of balance loss.
The Gradient Boosting model had a strong balance between the precision and recall, with the highest accuracy (93.10%), recall (85.71%) and F1 score (85.71%). This is in line with previous research [41] that has demonstrated the improved performance of Gradient Boosting Decision Trees (GBDTs), which include models such as XGBoost, CatBoost and LightGBM, in classification tasks, especially when applied to structured, tabular data. The authors of the study [41] showed that these ensemble approaches perform better than deep learning models and conventional machine learning models such as the SVM and logistic regression, particularly in medical diagnosis tasks. These models’ reduced complexity and computational efficiency make them ideal for applications requiring a high degree of accuracy.
The performances of conventional models, i.e., the SVM (68.97% accuracy and 57.14% recall) and logistic regression (72.41% accuracy and 71.43% recall), were below that of Gradient Boosting (93.10% accuracy and 71.43% recall). According to two studies [42,43], simpler models frequently perform worse than ensemble approaches on real-world classification problems, even though they are commonly selected for their interpretability and simplicity.
The neural network model in this study performed the worst, with a recall of just 26.67% and an overall accuracy of 28.57%. This poor performance is in line with recent research [41] showing that deep learning models, apart from being black boxes, usually need a great deal of fine-tuning and more data to provide reliable results compared to boosting models.
The random forest model provided reasonably good metrics, but boosting strategies outperformed it. This is consistent with a study showing that boosting techniques [43], including XGBoost and CatBoost, frequently outperformed random forest models by iteratively fixing gradients in earlier steps of the training cycle. According to the same study [43], boosting was found to be more suited for complicated, unbalanced data than bagging approaches like random forests since it is especially good at lowering bias.
One main takeaway is that the use of Gradient Boosting achieved high performance, suggesting a good ability to capture the non-linear aspect of HRV features and predict the target variable, the Binary-BBS. The application of K-means clustering was also crucial in structuring the data meaningfully, providing a solid basis for classification.

4.4. Methodological Considerations

We employed median filtering to deal with sudden decreases and strong spikes in the heart rate data, also called “salt-and-pepper noise”. This kind of movement artifact is usually found during practiced activities where there are a lot of quick movements. We manually changed the settings and found that a window smaller than five was insufficient for removing short-duration peaks. A larger window could have potentially smoothed data too much and eliminated important physiological variations. Another related work [44] proved the usefulness of this window size choice; it provided an optimal balance and reduced noise without signal distortion.
We also considered incorporating a low-pass filter to refine the data by removing high-frequency noise that median filtering might not fully eliminate. This noise could occur from electronic interference or rapid physiological changes unrelated to the HRV, obscuring the true heartbeat signals. The choice of the fourth-order Butterworth low-pass filter with a cutoff frequency of 20 Hz was based on the noise frequency characteristics and the IBI signal. Knowing that most of the meaningful HRV components are below 0.4 Hz [45], a 20 Hz cutoff was expected to provide a “safety buffer” that helps retain all relevant HRV information while attenuating higher frequency noise [46].
Apart from these two filters, we tested other techniques such as wavelet filtering to ensure our signals were as informative and clear as possible. The use of the Daubechies 4 (db4) wavelet has been successful in biomedical signal processing; we used it in our investigation to filter IBI cardiac data. Multiple decomposition levels provided a detailed depiction of HRV data using the db4 wavelet, which was selected for its harmony between smoothness and its sensitivity to abrupt changes in the signal properties. Although wavelets offer flexibility in time–frequency analysis, an improper wavelet basis might result in signal distortions. In particular, they may not provide the steady filtering required for physiological signals, but they are excellent at managing transitory signals. In Figure 6, we present the effect of the two filters on IBI signals from two participants.
While our investigation used only the traditional forms of Poincaré plots to analyze the HRV, we realize that there are more advanced methods. Specifically, in two studies presented by Ganan-Calvo and co-authors [47,48], generalized graphical Poincaré multidimensional methods presented more informative and complex sequential HRV features with qualitative and quantitative assessments of the HRV data. The scope of the present study focused on established, widely-used HRV analysis methods; therefore, these multidimensional Poincaré methods were not incorporated. However, future research could leverage these methods to enhance the understanding of the intricate dynamics underlying the HRV and its relationship to the fall risk.
The use of methods such as clustering to identify variations in the HRV can be supported by advanced analysis methods that focus on personalized mental stress detection [26]. In the study just cited, the authors applied a Self-Organizing Map, which is a form of clustering, to effectively classify physiological states in real-life and laboratory conditions, demonstrating the ability of such methods to interpret patterns in HRV data.
One important consideration for K-means clustering is that the features have to be normally distributed. We applied a Shapiro–Wilk test for the normality of each continuous variable ( α = 0.05) and found that variables other than the Mean RR were not normally distributed. Despite the non-normal distribution of the data, the clear separation of clusters (Figure 5) indicated that the K-means could still perform reasonably well in this context.
Also, when we prepared our data for the binary classification, the first big challenge was the class imbalance. This issue would have hindered the ability of classification models to learn the characteristics of the minority class, as they might have been biased in favor of the majority class. To alleviate this problem, the SMOTE was used; it generated new synthetic instances for the minority class, which encompassed the low scores that indicated an absence of imbalance, to re-balance the data and ensure a better representation of both classes in the training set.

4.5. Limitations

One of the challenges in this study was the difficulty in recruiting participants. The biggest obstacle was to find volunteers of 40–65 years of age who would spend one hour of their busy day participating in this study and people above 65 years old who would agree to do the prescribed BBS tasks, since we found that some of them were afraid of falling. This problem resulted in a limited sample size of only 14. However, for the better generalizability and robustness of our findings, a preliminary study [49] suggested a minimum sample size of 19 participants. We also acknowledge that the number of people we were able to find was still far from that of a comparable study employing machine learning classification to the HRV to detect physical stress among 24 participants (6 women and 18 men) [25]. Our small sample size not only diminished the statistical power but also increased the risk of new patterns potentially going undetected. Nevertheless, this study provided methods and preliminary results that could serve as a proof of concept to guide future research, which should aim for a larger sample size and balanced characteristics of the participants in terms of the gender, pre-existing medical conditions, experience of falls and an active lifestyle such as being engaged in regular physical activities.
Another constraint in our study was the inter-individual HRV signals, which varied due to distinct physiological traits and varying responses to extrinsic stressors among the participants. Our dataset from people over 40 years old might not be comparable to other research conducted on younger populations [45], including college students, as seen in a related study [10]. To increase the statistical power and generalizability, future research should take these aspects into account by collecting a larger and more varied sample, depending on the research questions.
In the classification part, we only focused on building models that could detect the risk of falling based only on data collected from the female participants. On one hand, this could be beneficial as it was precisely customized for women; on the other hand, it could be considered a limitation since our classifiers could not be tested on men.
Despite these drawbacks, the focus we had on HRV measures provided insightful information on the connections between various activity types and HRV characteristics. Not considering factors like EEGs, EMG and EDA like in other studies [15,18,19,20,21] may seem to limit the breadth of our study, but this could also improve the knowledge and techniques needed to identify significant patterns free from the influence of additional physiological factors. Most of all, we were able to maintain a better level of sensitivity, specificity and accuracy in our analyses by focusing on only the HRV and HR, which opens the way for future research and applications that may not be able to include other physiological markers.

5. Conclusions and Future Work

This study used a two-stage approach to explore the relationship between HRV characteristics, stress and the risk of balance loss. The first step was applying a K-means clustering algorithm to identify the moments potentially related to participants’ stress in response to physical activity. This exploratory analysis revealed relevant underlying structures, improving our understanding of stress-related factors and patterns.
Several classification models were implemented in the second phase to predict the fall risk using HRV features and the cluster labels, aiming to minimize the false negative rate, or undetected fall risk cases. Among the models tested, Gradient Boosting proved to be the best performer in capturing the link between the HRV and the risk of postural imbalance. However, while this study focused on the model performance as a whole, identifying the specific HRV or HR parameters most indicative of the fall risk remains an open question. Future analyses could address this by incorporating feature importance techniques that would allow for a more detailed quantification of the contribution of individual HRV or HR parameters to predictive models. Although outside the scope of the current study, such analyses could provide valuable insights into the specific role of each parameter in fall risk assessments.
Several approaches can be investigated to expand on the findings of this study and create clinical applications that can help people have a less stressful lifestyle. More detailed knowledge of the mechanisms driving the loss of balance might be obtained by considering further data, such as environmental information (such as obstructions or ground conditions) or motion measures (such as accelerometry), which can easily be integrated into the heart rate monitor and further increase the prediction accuracy. Additionally, as a loss of balance and perceptions of the fall risk may be related to impairments in the vestibulo-ocular reflex, which is crucial for preserving gaze stability during head movements, future research could benefit from integrating vestibular function tests or dynamic visual acuity assessments with HRV and HR analysis.
Implementing machine learning models represents a promising way to enable prompt preventive treatments by developing real-time systems that use wearable sensors to monitor vulnerable people such as the elderly in their everyday surroundings. Lastly, the clinical validation of the models on bigger, more diverse populations is crucial to guarantee that the results can be applied to various demographic groups and to modify the models to each person’s unique circumstances.
In conclusion, this study highlights the utility of machine learning approaches to better understand and predict fall risks. Such a predictive capability is essential for improving the quality of life of vulnerable individuals, enabling more targeted interventions and a significant reduction in falls.

Author Contributions

Conceptualization, O.T.; methodology, I.B.M. and O.T.; software, I.B.M.; validation, O.T.; formal analysis, I.B.M.; investigation, I.B.M. and O.T.; resources, O.T.; data curation, I.B.M. and O.T.; writing—original draft preparation, I.B.M.; writing—review and editing, O.T.; visualization, I.B.M. and O.T.; supervision, O.T.; project administration, O.T.; funding acquisition, O.T. All authors have read and agreed to the published version of the manuscript.

Funding

This research was partially funded by the École de technologie supérieure and the Natural Sciences and Engineering Research Council of Canada Discovery Grant Program (RGPIN-2022-0327).

Institutional Review Board Statement

This study was conducted in accordance with the Declaration of Helsinki and approved by the Ethics Committee of the École de technologie supérieure (Protocol No. H20221103 and date of approval 2 February 2023) for studies involving humans.

Informed Consent Statement

Informed consent was obtained from all subjects involved in the study.

Data Availability Statement

The data collected in this study were made available publicly at https://doi.org/10.5281/zenodo.14681093.

Acknowledgments

We would like to thank all the study participants and the research team members including Youssef Nkizi and Yasmine Gherbi who helped with the data collection. We would also like to thank the Notre-Dame-de-Grâce Community Council for their help with the participant recruitment and the Department of Mechanical Engineering at the École de Technologie Supérieure for the use of their infrastructure.

Conflicts of Interest

The authors declare no conflicts of interest. The funders had no role in the design of the study; in the collection, analyses or interpretation of data; in the writing of the manuscript; or in the decision to publish the results.

References

  1. GBD 2021 Diseases and Injuries Collaborators. Global incidence, prevalence, years lived with disability (YLDs), disability-adjusted life-years (DALYs), and healthy life expectancy (HALE) for 371 diseases and injuries in 204 countries and territories and 811 subnational locations, 1990–2021: A systematic analysis for the Global Burden of Disease Study 2021. Lancet 2024, 403, 2133–2161. [Google Scholar] [CrossRef]
  2. Organisation Mondiale de la Santé. Chutes. Available online: https://www.who.int/fr/news-room/fact-sheets/detail/falls (accessed on 30 November 2024).
  3. Shumway-Cook, A.; Woollacott, M. Motor control: Translating research into clinical practice. In Osteoporosis International; Lippincott Williams & Wilkins: Philadelphia, PA, USA, 2006. [Google Scholar] [CrossRef]
  4. Tinetti, M.E.; Speechley, M.; Ginter, S.F. Risk factors for falls among elderly persons living in the community. N. Engl. J. Med. 1988, 319, 1701–1707. [Google Scholar] [CrossRef]
  5. Thayer, J.F.; Lane, R.D. A model of neurovisceral integration in emotion regulation and dysregulation. J. Affect. Disord. 2000, 61, 201–216. [Google Scholar] [CrossRef]
  6. Vieira, E.R.; Palmer, R.C.; Chaves, P.H. Prevention of falls in older people living in the community. BMJ 2016, 353, i1419. [Google Scholar] [CrossRef] [PubMed]
  7. Ye, P.; Liu, Y.; Zhang, J.; Peng, K.; Pan, X.; Xiao, S.; Armstrong, E.; Er, Y.; Duan, L.; Ivers, R.; et al. Falls prevention interventions for community-dwelling older people living in mainland China: A narrative systematic review. BMC Health Serv. Res. 2020, 20, 808. [Google Scholar] [CrossRef]
  8. Shaffer, F.; McCraty, R.; Zerr, C.L. A healthy heart is not a metronome: An integrative review of the heart’s anatomy and heart rate variability. Front. Psychol. 2014, 5, 1040. [Google Scholar] [CrossRef] [PubMed]
  9. Orsila, R.; Virtanen, M.; Luukkaala, T.; Tarvainen, M.; Karjalainen, P.; Viik, J.; Savinainen, M.; Nygård, C.-H. Perceived mental stress and reactions in heart rate variability—A pilot study among employees of an electronics company. Int. J. Occup. Saf. Ergon. (JOSE) 2008, 14, 275–283. [Google Scholar] [CrossRef] [PubMed]
  10. Kim, D.; Seo, Y.; Salahuddin, L. Decreased long term variations of heart rate variability in subjects with higher self-reporting stress scores. In Proceedings of the 2008 Second International Conference on Pervasive Computing Technologies for Healthcare, Tampere, Finland, 30 January–1 February 2008; pp. 289–292. [Google Scholar] [CrossRef]
  11. Castaldo, R.; Melillo, P.; Bracale, U.; Caserta, M.; Triassi, M.; Pecchia, L. Acute mental stress assessment via short-term HRV analysis in healthy adults: A systematic review with meta-analysis. Biomed. Signal Process. Control 2015, 18, 370–377. [Google Scholar] [CrossRef]
  12. Wang, L.; Hao, J.; Zhou, T.H.; Song, F. ECG stress detection model based on heart rate variability feature extraction. In Proceedings of the HP3C ’23: 7th International Conference on High Performance Compilation, Computing and Communications, Nanjing, China, 19–21 May 2023; pp. 184–188. [Google Scholar] [CrossRef]
  13. Salahuddin, L.; Kim, D. Detection of acute stress by heart rate variability using a prototype mobile ECG sensor. In Proceedings of the 2006 International Conference on Hybrid Information Technology, Cheju Island, Republic of Korea, 9–11 November 2006; pp. 453–459. [Google Scholar] [CrossRef]
  14. Dalmeida, K.M.; Masala, G.L. HRV Features as Viable Physiological Markers for Stress Detection Using Wearable Devices. Sensors 2021, 21, 2873. [Google Scholar] [CrossRef]
  15. Murty, P.S.R.C.; Anuradha, C.; Naidu, P.A.; Balaswamy, C.; Nagalingam, R.; Jagatheesaperumal, S.K.; Ponnusamy, M. An intelligent wearable embedded architecture for stress detection and psychological behavior monitoring using heart rate variability. J. Intell. Fuzzy Syst. 2023, 45, 8203–8216. [Google Scholar] [CrossRef]
  16. Schaffarczyk, M.; Rogers, B.; Reer, R.; Gronwald, T. Validity of the Polar H10 Sensor for Heart Rate Variability Analysis during Resting State and Incremental Exercise in Recreational Men and Women. Sensors 2022, 22, 6536. [Google Scholar] [CrossRef]
  17. Hernández-Vicente, A.; Hernando, D.; Marín-Puyalto, J.; Vicente-Rodríguez, G.; Garatachea, N.; Pueyo, E.; Bailón, R. Validity of the Polar H7 Heart Rate Sensor for Heart Rate Variability Analysis during Exercise in Different Age, Body Composition, and Fitness Level Groups. Sensors 2021, 21, 902. [Google Scholar] [CrossRef]
  18. Attar, E.T.; Balasubramanian, V.; Subasi, E.; Kaya, M. Stress Analysis Based on Simultaneous Heart Rate Variability and EEG Monitoring. IEEE J. Transl. Eng. Health Med. 2021, 9, 2700607. [Google Scholar] [CrossRef]
  19. Jarchi, D.; Andreu-Perez, J.; Kiani, M.; Vysata, O.; Kuchynka, J.; Prochazka, A.; Sanei, S. Recognition of Patient Groups with Sleep-Related Disorders Using Bio-signal Processing and Deep Learning. Sensors 2020, 20, 2594. [Google Scholar] [CrossRef] [PubMed]
  20. Pourmohammadi, S.; Maleki, A. Continuous mental stress level assessment using electrocardiogram and electromyogram signals. Biomed. Signal Process. Control 2021, 68, 102694. [Google Scholar] [CrossRef]
  21. Muñoz, J.E.; Gouveia, E.R.; Cameirão, M.S.; Bermúdez i Badia, S. PhysioLab—A multivariate physiological computing toolbox for ECG, EMG, and EDA signals: A case study of cardiorespiratory fitness assessment in the elderly population. Multimed. Tools Appl. 2018, 77, 11521–11546. [Google Scholar] [CrossRef]
  22. Thielmann, B.; Pohl, R.; Böckelmann, I. Heart rate variability as a strain indicator for psychological stress for emergency physicians during work and alert intervention: A systematic review. J. Occup. Med. Toxicol. 2021, 16, 24. [Google Scholar] [CrossRef] [PubMed]
  23. Rodrigues, S.; Dias, D.; Paiva, J.S.; Cunha, J.P.S. Psychophysiological Stress Assessment Among On-Duty Firefighters. In Proceedings of the 2018 Annual International Conference of the IEEE Engineering in Medicine and Biology Society (EMBC), Honolulu, HI, USA, 17–21 July 2018; pp. 4335–4338. [Google Scholar] [CrossRef]
  24. Prajod, P.; André, E. On the generalizability of ECG-based stress detection models. In Proceedings of the 2022 21st IEEE International Conference on Machine Learning and Applications (ICMLA), Nassau, Bahamas, 12–15 December 2022; pp. 549–554. [Google Scholar] [CrossRef]
  25. Bustos, D.; Cardoso, F.; Rios, M.; Vaz, M.; Guedes, J.; Costa, J.T.; Baptista, J.S.; Fernandes, R.J. Machine Learning Approach to Model Physical Fatigue during Incremental Exercise among Firefighters. Sensors 2022, 23, 194. [Google Scholar] [CrossRef]
  26. Tervonen, J.; Puttonen, S.; Sillanpää, M.J.; Hopsu, L.; Homorodi, Z.; Keränen, J.; Pajukanta, J.; Tolonen, A.; Lämsä, A.; Mäntyjärvi, J. Personalized mental stress detection with self-organizing map: From laboratory to the field. Comput. Biol. Med. 2020, 124, 103935. [Google Scholar] [CrossRef]
  27. Berg, K.O.; Wood-Dauphinee, S.L.; Williams, J.I.; Maki, B. Measuring balance in the elderly: Validation of an instrument. Can. J. Public Health 1992, 83 (Suppl. S2), S7–S11. [Google Scholar] [PubMed]
  28. Steffen, T.M.; Hacker, T.A.; Mollinger, L. Age- and gender-related test performance in community-dwelling elderly people: Six-Minute Walk Test, Berg Balance Scale, Timed Up & Go Test, and gait speeds. Phys. Ther. 2002, 82, 128–137. [Google Scholar] [CrossRef]
  29. Aygun, A.; Ghasemzadeh, H.; Jafari, R. Robust Interbeat Interval and Heart Rate Variability Estimation Method From Various Morphological Features Using Wearable Sensors. IEEE J. Biomed. Health Inform. 2020, 24, 2238–2250. [Google Scholar] [CrossRef] [PubMed]
  30. Saleem, S.; Khandoker, A.H.; Alkhodari, M.; Hadjileontiadis, L.J.; Jelinek, H.F. A two-step pre-processing tool to remove Gaussian and ectopic noise for heart rate variability analysis. IEEE Access 2022, 10, 54081–54092. [Google Scholar] [CrossRef]
  31. Brennan, M.; Palaniswami, M.; Kamen, P. Poincaré plot interpretation using a physiological model of HRV based on a network of oscillators. Am. J. Physiol. Heart Circ. Physiol. 2002, 283, H1873–H1886. [Google Scholar] [CrossRef]
  32. Bernardi, L.; Leuzzi, S.; Radaelli, A.; Passino, C.; Johnston, J.A.; Sleight, P. Low-frequency spontaneous fluctuations of R-R interval and blood pressure in conscious humans: A baroreceptor or central phenomenon? Clin. Sci. 1994, 87, 649–654. [Google Scholar] [CrossRef]
  33. Yasuma, F.; Hayano, J. Respiratory sinus arrhythmia: Why does the heartbeat synchronize with respiratory rhythm? Chest 2004, 125, 683–690. [Google Scholar] [CrossRef]
  34. Pedregosa, F.; Varoquaux, G.; Gramfort, A.; Michel, V.; Thirion, B.; Grisel, O.; Blondel, M.; Prettenhofer, P.; Weiss, R.; Dubourg, V.; et al. Scikit-learn: Machine learning in Python. J. Mach. Learn. Res. 2011, 12, 2825–2830. [Google Scholar]
  35. Malik, M.; Camm, A.J.; Bigger, J.T.; Kleiger, R.E.; Malliani, A.; Moss, A.J.; Schwartz, P.J. Heart rate variability: Standards of measurement, physiological interpretation, and clinical use. Eur. Heart J. 1996, 17, 354–381. [Google Scholar] [CrossRef]
  36. Satti, R.; Abid, N.U.; Bottaro, M.; De Rui, M.; Garrido, M.; Raoufy, M.R.; Montagnese, S.; Manj, A.R. The Application of the Extended Poincaré Plot in the Analysis of Physiological Variabilities. Front. Physiol. 2019, 10, 116. [Google Scholar] [CrossRef]
  37. Stein, M.B.; Roy-Byrne, P.P.; Craske, M.G.; Bystritsky, A.; Sullivan, G.; Pyne, J.M.; Katon, W.; Sherbourne, C. Functional impact and health utility of anxiety disorders in primary care outpatients. Med. Care 2005, 43, 1164–1170. [Google Scholar] [CrossRef] [PubMed]
  38. Nakao, M. Heart Rate Variability and Perceived Stress as Measurements of Relaxation Response. J. Clin. Med. 2019, 8, 1704. [Google Scholar] [CrossRef]
  39. Taelman, J.; Vandeput, S.; Spaepen, A.; Huffel, S.V. Influence of Mental Stress on Heart Rate and Heart Rate Variability. In Proceedings of the World Congress on Medical Physics and Biomedical Engineering, Munich, Germany, 7–12 September 2009; pp. 1360–1363. [Google Scholar] [CrossRef]
  40. Berntson, G.G.; Cacioppo, J.T.; Binkley, P.F.; Uchino, B.N.; Quigley, K.S.; Fieldstone, A. Autonomic cardiac control. III. Psychological stress and cardiac response in autonomic space as revealed by pharmacological blockades. Psychophysiology 1994, 31, 599–608. [Google Scholar] [CrossRef]
  41. Yıldız, A.Y.; Kalayci, A. Gradient boosting decision trees on medical diagnosis over tabular data. arXiv 2024, arXiv:2410.03705. [Google Scholar] [CrossRef]
  42. Lynam, A.L.; Dennis, J.M.; Owen, K.R.; Oram, R.A.; Jones, A.G.; Shields, B.M.; Ferrat, L.A. Logistic regression has similar performance to optimised machine learning algorithms in a clinical setting: Application to the discrimination between type 1 and type 2 diabetes in young adults. Diagn. Progn. Res. 2020, 4, 6. [Google Scholar] [CrossRef] [PubMed]
  43. Bentéjac, C.; Csörgő, A.; Martínez-Muñoz, G. A comparative analysis of gradient boosting algorithms. Artif. Intell. Rev. 2021, 54, 1937–1967. [Google Scholar] [CrossRef]
  44. Gungor, M.A.; Karagoz, I. The effects of the median filter with different window sizes for ultrasound image. In Proceedings of the 2016 2nd IEEE International Conference on Computer and Communications (ICCC), Chengdu, China, 14–17 October 2016; pp. 549–552. [Google Scholar] [CrossRef]
  45. Task Force of the European Society of Cardiology; the North American Society of Pacing and Electrophysiology. Heart rate variability: Standards of measurement, physiological interpretation, and clinical use. Circulation 1996, 93, 1043–1065. [Google Scholar] [CrossRef]
  46. Shaffer, F.; Ginsberg, J.P. An Overview of Heart Rate Variability Metrics and Norms. Front. Public Health 2017, 5, 258. [Google Scholar] [CrossRef] [PubMed]
  47. Gañán-Calvo, A.; Fajardo-López, J. Universal structures of normal and pathological heart rate variability. Sci. Rep. 2016, 6, 21749. [Google Scholar] [CrossRef]
  48. Gañán-Calvo, A.M.; Hnatkova, K.; Romero-Calvo, Á.; Fajardo-López, J.; Malik, M. Risk stratifiers for arrhythmic and non-arrhythmic mortality after acute myocardial infarction. Sci. Rep. 2018, 8, 9897. [Google Scholar] [CrossRef]
  49. Gherbi, Y.; Thamsuwan, O. Berg balance test for predicting a fall risk in older adults living at home: A preliminary study on the effect of pre-existing health conditions on postural balance. In Proceedings of the 22nd Triennial Congress of the International Ergonomics Association (IEA), Jeju, Republic of Korea, 25–29 August 2024. [Google Scholar]
Figure 1. Poincaré Plots for each of the 14 participants.
Computers 14 00045 g001
Figure 2. Boxplot of Mean RR across activity types.
Computers 14 00045 g002
Figure 3. Boxplot of Mean SDNN across activity types.
Computers 14 00045 g003
Figure 4. The Elbow Method showing the relationship between the Sum of Squared Errors and the number of clusters.
Computers 14 00045 g004
Figure 5. K-means clustering of HRV features (x: Max HR; y: Mean HR).
Computers 14 00045 g005
Figure 6. The effect of the median and Butterworth filters on the HRV signals of two participants.
Computers 14 00045 g006
Table 1. Hyperparameter values used for the training of each model.
ModelHyperparameterValues Tested
Logistic RegressionC[0.01, 0.1, 1, 10, 100, 1000]
solver[‘liblinear’, ‘saga’, ‘lbfgs’]
Random Forestn_estimators[50, 100, 200, 300, 500]
max_depth[None, 10, 20, 30, 40]
min_samples_split[2, 5, 10]
min_samples_leaf[1, 2, 4]
SVMC[0.01, 0.1, 1, 10, 100]
kernel[‘linear’, ‘rbf’, ‘poly’, ‘sigmoid’]
gamma[‘scale’, ‘auto’]
Gradient Boostingn_estimators[50, 100, 200, 300]
learning_rate[0.01, 0.05, 0.1, 0.2]
max_depth[3, 4, 5, 6]
min_samples_split[2, 5, 10]
min_samples_leaf[1, 2, 4]
XGBoostn_estimators[50, 100, 200, 300]
learning_rate[0.01, 0.05, 0.1, 0.2]
max_depth[3, 4, 5, 6]
colsample_bytree[0.3, 0.7]
LightGBMn_estimators[50, 100, 200, 300]
learning_rate[0.01, 0.05, 0.1, 0.2]
num_leaves[31, 40, 50]
boosting_type[‘gbdt’, ‘dart’]
CatBoostiterations[50, 100, 200, 300]
learning_rate[0.01, 0.05, 0.1, 0.2]
depth[3, 4, 5, 6]
AdaBoostn_estimators[50, 100, 200, 300]
learning_rate[0.01, 0.05, 0.1, 0.2]
Neural Networkhidden_layer_sizes[(50, 50), (100, 50)]
activation[‘tanh’, ‘relu’]
solver[‘adam’, ‘sgd’]
alpha[0.0001, 0.001, 0.01]
Table 2. Mean (SD) of HRV metrics in each cluster.
MetricCluster 0 (N = 163)Cluster 1 (N = 59)Cluster 2 (N = 2)
Mean IBI (ms)845.60 (64.42)684.93 (45.15)837.16 (2.61)
SDNN (ms)39.00 (33.77)16.52 (14.45)120.85 (4.73)
RMSSD (ms)33.61 (49.17)8.30 (5.80)171.13 (12.89)
NN50 (count)4.53 (14.44)0.90 (3.45)462.00 (2.83)
pNN50 (%)13.53 (27.66)0.46 (1.97)77.13 (0.47)
Mean HR (bpm)71.63 (5.39)88.05 (5.73)73.31 (0.43)
STD HR (bpm)3.60 (3.39)2.10 (1.84)11.70 (1.12)
Min HR (bpm)66.04 (5.35)83.80 (7.13)50.60 (0.94)
Max HR (bpm)78.74 (11.43)91.70 (7.91)134.00 (17.68)
LF Power (ms2)2.15 × 10⁵ (4.60 × 10⁵)1.74 × 10⁵ (6.40 × 10⁵)1.07 × 10⁷ (8.07 × 10⁴)
HF Power (ms2)1.30 × 10⁵ (4.60 × 10⁵)2.76 × 10⁴ (1.14 × 10⁵)2.42 × 10⁷ (7.87 × 10⁵)
LF/HF Ratio6.20 (7.19)8.76 (20.13)0.44 (0.02)
TP (ms2)2.23 × 10¹¹ (9.40 × 10¹¹)1.05 × 10¹¹ (3.85 × 10¹¹)2.92 × 10¹² (3.90 × 10¹⁰)
SD1 (ms)24.40 (37.32)5.40 (4.10)121.11 (9.12)
SD2 (ms)45.80 (35.70)22.52 (20.25)120.51 (0.31)
Table 3. Contingency table of counts based on activity type and cluster membership.
ClusterSITSTANDMOVEMENT
“0”207568
“1”62330
“2”200
Table 4. The classification results of different models trained on the women’s dataset.
ModelPrecisionRecallF1 ScoreOverall Accuracy
Logistic Regression88.89%71.43%55.56%72.41%
Random Forest83.33%42.86%50.00%79.31%
Support Vector Machine (SVM)84.21%57.14%47.06%68.97%
Gradient Boosting95.45%85.71%85.71%93.10%
XGBoost90.48%71.43%66.67%82.76%
LightGBM83.33%42.86%50.00%79.31%
CatBoost86.96%57.14%61.54%82.76%
AdaBoost91.30%71.43%76.92%89.66%
Neural Network76.19%28.57%26.67%62.07%
Disclaimer/Publisher’s Note: The statements, opinions and data contained in all publications are solely those of the individual author(s) and contributor(s) and not of MDPI and/or the editor(s). MDPI and/or the editor(s) disclaim responsibility for any injury to people or property resulting from any ideas, methods, instructions or products referred to in the content.

