1. Introduction
In recent years, the acceleration of global digital transformation has reshaped the way organizations operate, collaborate, and compete. This transformation was further intensified by the COVID-19 pandemic, which exposed the fragility of traditional business models and highlighted the urgent need for resilient, digitally connected ecosystems capable of sustaining operations under disruptive conditions. In this context, Virtual Organizations (VOs) emerged as a strategic response to global competition and the growing demand for personalized, rapidly delivered products and services. A VO is a temporary or long-term alliance of independent entities—such as companies, institutions, or professionals—that collaborate through digital platforms to achieve shared objectives while maintaining their organizational autonomy. Strengthening the mechanisms that support VOs has therefore become essential for ensuring agile resource integration, continuous innovation, and sustainable value creation within the evolving landscape of Industry 4.0. Guamushig et al. [
1] establishes five fundamental aspects for the formation of a VO: (a) Allies: It refers to the participating organizations involved in the formation of the VO, which must meet different essential characteristics for their effective participation; (b) Elements to share: They are those resources of the participating organizations that become part of the VO to collaborate and achieve shared objectives; (c) Infrastructure: The VO works in the cloud using a cyber-physical system, formed by the different technologies that support it since it does not have a physical location for its exclusive management and handling; (d) Time: Refers to temporality. As the VO is dynamic, it is subject to having a beginning and an end depending on the need to shape it; (e) Offer: It is the result of the formation of the VO, either products or services, which determines the lifetime of the formation of the VO.
In turn, ACODATs consist of a set of analytical tasks divided into three types: observing, analyzing, and making decisions [
2,
3]. These tasks involve the study and management of the supervised process, the data collection, and the processing of all sources of information required to oversee the process, among other tasks. This technology has been successfully applied in different fields, such as smart manufacturing, nanotechnology, and online education [
4]. Additionally, Industry 4.0 is revolutionizing business management [
4]. This work’s main objective is to apply ACODATs to each phase of the VO life cycle by applying Industry 4.0 technologies. The most recent related work proposed a dual analysis approach to address the complexities of requirements engineering for VOs [
5]. This framework introduces two key perspectives: a boundary perspective (intra-organizational, inter-organizational, and extra-organizational) and an abstract perspective (intentional, organizational, and operational). The framework addresses limitations in traditional single organization approaches by enhancing collaboration, communication, and the formal identification of requirements.
The architecture implements ACODAT principles through autonomous cycles and data-driven mechanisms, establishing a structured framework for VO management that combines digital supply chain automation with systematic partner evaluation processes. The approach focuses on inclusive partner selection and dynamic supply chain formation, utilizing data-driven evaluation methods that consider historical AVO information and external data sources. By integrating Industry 4.0 technologies such as data analytics and cloud computing, the architecture enables objective partner selection and efficient resource allocation, particularly benefiting small businesses and independent professionals. The architecture will be validated by instantiating the most influential cycle in the autonomous management of VO. To determine which cycle holds this critical role, a comprehensive evaluation of all proposed cycles will be conducted, analyzing their impact and relationships within the system. This methodological approach will validate the selected cycle’s implementation and provide valuable insights into the interconnected nature of the autonomous cycles and their collective contribution to VO management.
This work builds on a previous work where the FAVO 4.0 framework [
6] was proposed, which addresses the digital transformation of organizations and enables the creation of AVOs by leveraging Industry 4.0 technologies. This framework addresses a critical gap in the literature by enabling effective inter-organizational and autonomous management through data-driven analytical cycles and collaborative digital processes aligned with the principles of Industry 4.0. Despite significant research efforts in virtual organization (VO) management, most existing frameworks remain conceptual and lack the automation, interoperability, and real-time adaptation required to operate in complex digital ecosystems. Moreover, current approaches rarely incorporate mechanisms that ensure inclusivity for small and medium-sized enterprises (SMEs), which continue to face structural and technological barriers to participation in dynamic virtual consortia.
To overcome these limitations, this study introduces the Architecture for Virtual Organization Management (AVOMA)—a comprehensive model that combines the autonomous analytical cycles of ACODAT with the standardized structure of RAMI 4.0. This integration supports intelligent decision-making, continuous evaluation, and adaptive coordination among distributed partners. The proposed architecture promotes the formation of Autonomous Virtual Organizations (AVOs) that are capable of self-management, real-time monitoring, and sustainable operation through the use of Industry 4.0 technologies such as artificial intelligence, data analytics, and cloud computing.
The main contributions of this article are as follows:
Design an architecture that models the interaction among actors and processes in a VO through ACODATs, achieving an AVO that is self-managing, self-sustaining, and aligned with Industry 4.0 standards.
Specify in detail each autonomous cycle of the proposed architecture, defining their analytical tasks, data sources, and technological enablers.
Develop and validate a functional prototype, demonstrating the feasibility and performance of the architecture through a real-world case study involving an editorial consortium.
This paper is organized as follows:
Section 2 reviews related works and presents the theoretical framework.
Section 3 introduces the Autonomous Virtual Organizations Management Architecture (AVOMA).
Section 4 details the autonomous cycles for AVO management.
Section 5 describes the data model supporting the proposed architecture.
Section 6 provides a walk-through of the developed computational prototype, while
Section 7 presents a case study focused on a VO within an editorial consortium.
Section 8 discusses the evaluation and analysis of the prototype, and
Section 9 benchmarks the time efficiency of traditional versus AVOs.
Section 10 conducts a comparative analysis with existing architectures and frameworks, positioning AVOMA within the broader Industry 4.0 ecosystem.
Section 11 concludes the paper and outlines future research directions.
2. Related Works and Theoretical Framework
The following section provides the theoretical framework and a concise review of the state of the art that supports the conceptual basis of the proposal.
2.1. Autonomous Cycles of Data Analysis Tasks (ACODAT)
Aguilar et al. [
2,
3] have defined ACODAT as a set of autonomous data analysis tasks that supervise and control a process. These tasks are based on knowledge models such as prediction, description, and diagnosis, and they interact according to the cycle’s objectives. Each task has a specific function: observing the process, analyzing and interpreting what is happening, and making decisions to improve the process.
ACODATs are designed using the Methodology for developing Data-Mining Applications based on Organizational Analysis (MIDANO). MIDANO integrates data analysis tasks into a closed-loop system capable of solving complex problems and generating strategic knowledge to achieve business objectives. The methodology comprises the following task categories:
Monitoring: Tasks that observe the system, capture data and information about its behavior, and prepare data for further steps (e.g., preprocessing and feature selection).
Analysis: Tasks that interpret, understand, and diagnose the monitored system, building knowledge models based on system dynamics.
Decision-making: Tasks that define and implement actions to improve or correct the system based on the prior analysis. These tasks affect the system’s dynamics, with their effects evaluated by subsequent monitoring and analysis tasks, thereby restarting the cycle.
This integrated approach ensures a consistent application of data-analysis tasks, generating valuable insights to meet business goals. ACODAT addresses challenges in smart factories and classrooms by integrating different actors and self-managing processes [
6]. The framework proposed involves coordination, cooperation, and collaboration, treating the business process as a service (BPaaS) and leveraging the Internet of Services (IoS) and the Internet of Everything (IoE) for decision-making [
7].
Despite the demonstrated effectiveness of ACODAT in various domains, ranging from smart factories and classrooms to energy management in buildings, there remains a clear gap in its application to the management of AVOs. Leveraging autonomous data analysis cycles could benefit AVOs by enabling real-time supervision, decision-making, and process optimization. However, no existing studies have been found that utilize ACODAT specifically within the context of VO. This gap underlines the focus of the present work, which aims to explore and demonstrate how ACODAT can be adapted and employed to enhance AVO management.
Recent research highlights the transformative impact of Large Language Models (LLMs) and agent-based systems in autonomous data analysis. According to Tang et al. [
8], these models enable semantic-aware reasoning, multimodal data integration, and self-orchestrated analytical pipelines that can autonomously adapt to dynamic environments. Unlike traditional rule-based systems, LLM-powered agents can interpret complex and heterogeneous data—including structured, semi-structured, and unstructured sources—through natural language interfaces and context-aware decision-making. This evolution marks a significant step toward intelligent analytical ecosystems capable of continuous learning, adaptive optimization, and self-improvement across industrial and organizational domains.
2.2. Virtual Organizations (VO)
AVO is a group of companies or independent individuals that temporarily collaborate to achieve common objectives by leveraging advanced information technologies to communicate and coordinate despite geographical dispersion [
9]. Recent studies have emphasized the potential of digital tools to overcome physical and structural limitations of organizations, enhancing flexibility and adaptability in global markets. Soleimani [
10] explores how VOs enhance their market reach by sharing capacities through integrated business services. Building on this concept, the paper presents a methodology designed to optimize and consolidate these shared services, streamlining collaboration among VO partners. The effectiveness of this approach is demonstrated through a case study in the construction industry, where the methodology leads to more efficient and coordinated service delivery. Lazarova-Molnar et al. [
11] examined how digital technologies enhance collaboration within virtual teams, while [
12] analyzed effective coordination and communication mechanisms in such organizations. Polyantchikov [
13] investigated the sustainability and resilience of VO, emphasizing the integration of advanced digital tools. These contributions highlight the evolving nature of VO and provide a robust theoretical basis for developing innovative architectures and management approaches in this domain.
2.3. Management in VOs in the Industry 4.0 Context
In previous works, a framework (FAVO) [
6] was proposed to manage AVOs. FAVO provided guidelines on technologies, user layers, and conceptual elements, defining detailed architecture with specific technologies and interaction protocols, clearly identified actors, and transversal tasks. It autonomously guided the creation and management of VO based on Industry 4.0 principles, comprising five operational layers—such as the user and organizations layers—and a Virtual Breeding Environment (VBE) that established suitable conditions for communication with potential members [
5]. Other recent research has explored various approaches to decentralized and VO management. Several studies [
9,
14,
15,
16] focus on Decentralized Autonomous Organizations (DAOs), emphasizing blockchain technology, smart contracts, and Web3 integration for governance and operations. These works highlight the importance of decentralized decision-making, transparent governance, and automated processes through blockchain. For instance, Ref. [
17] explores DAOs in architecture and the construction industry, while Ref. [
18] addresses incentive mechanisms and antimonopoly strategies.
Recent studies have advanced the field of decentralized and virtual organization management through diverse proposals highlighting key contributions. For instance, Marko et al. [
17] emphasize the transformative potential of DAOs by leveraging blockchain technology and smart contracts to ensure transparency and automate governance. However, they also point out gaps in implementation and standardization. In parallel, Refs. [
14,
17,
19] extend this approach by integrating Web3 and blockchain protocols to improve internal operations and decentralize decision-making through human–robot collaboration and streamlined member elections. Moreover, Sreckovic et al. [
20] introduced a novel perspective by applying network design principles in the AEC industry, demonstrating how DAOs can disrupt traditional models through innovative structural integration. Lastly, Refs. [
16,
18] focus on governance, presenting advanced incentive mechanisms and risk management strategies that address monopolistic behaviors, thereby ensuring equitable participation.
The reviewed literature provides a significant contribution to the proposed architecture for AVOs. DAO studies [
14,
16,
17,
19] provide insights into transparent and automated governance, while the Web3 and blockchain approach Refs. [
14,
15] enhance secure communication and contract execution. Network design principles applied in the AEC industry [
20] inform the integration of sector-specific needs, and the FAVO framework [
6] offers a robust basis for layered operational structures. Additionally, incentive and risk management strategies [
18] support fair partner selection and collaboration. Critical elements identified in these studies—spanning automated decision-making, dynamic partnership mechanisms, secure communication protocols, and sustainable management practices—have been incorporated into the proposed architecture, which leverages Industry 4.0 technologies to effectively manage Virtual Organizations in the contemporary digital economy.
2.4. Digital Supply Chain (DSC)
Traditional supply chains typically follow a linear model, where materials, information, and finances move sequentially from suppliers and manufacturers to distributors, and finally, to customers [
21]. This process often relies on centralized management and manual coordination, which can lead to inefficiencies and limited transparency. In contrast, digital supply chains harness emerging technologies such as blockchain, IoT, and advanced data analytics to create decentralized and automated networks. These digital supply chains offer enhanced transparency, real-time decision-making, and autonomous collaboration among various stakeholders, enabling a more agile and adaptable response to market demands [
22,
23].
DSCs represent a transformative evolution in supply chain management, integrating advanced technologies to enhance operational efficiency and decision-making capabilities. As highlighted by [
24], DSCs leverage Industry 4.0 technologies such as IoT, cloud computing, and artificial intelligence (AI) to create resilient and adaptive supply networks. This digital transformation enables real-time visibility, predictive analytics, and automated processes crucial for maintaining competitive advantage in today’s dynamic market environment.
Integrating DSCs with Industry 4.0 has fundamentally changed traditional supply chain operations by implementing cyber-physical systems and digital twins. According to Büyüközkan et al. [
22], this integration enables organizations to achieve enhanced sustainability performance while improving operational efficiency through innovative manufacturing capabilities and intelligent logistics systems. Furthermore, according to Son et al. [
23], DSCs facilitate improved information systems and enhanced integration of management processes. However, their implementation remains challenging as organizations struggle to embrace these technologies fully.
While DSCs offer significant advantages regarding operational efficiency, sustainability, and market responsiveness, a notable research gap exists in their application to VO. The authors of [
24] emphasized that DSCs provide organizations with the capability to build resilient supply networks. However, the specific implementation and adaptation of DSCs within VO structures remains largely unexplored, representing a significant opportunity for future research to investigate how DSC capabilities can be leveraged to enhance VO operations and collaboration mechanisms.
2.5. Digital Twins and Sustainable Supply Chains in the Era of Industry 4.0
The evolution of supply chain management in the Industry 4.0 era is increasingly shaped by the convergence of AI, digital twin technology, and sustainability-oriented strategies. As organizations strive for greater resilience and transparency, digital transformation has become a critical enabler of operational excellence and environmental responsibility. Bhegade et al. [
25] emphasize that digital supply chains now rely on advanced technologies, such as AI, the Internet of Things (IoT), blockchain, big data analytics, and multi-cloud environments to enhance agility, visibility, and adaptability. These innovations enable real-time decision-making, predictive optimization, and collaborative data sharing across globally distributed networks.
Sustainability has emerged as a central pillar of digital transformation. Dubey et al. [
26] demonstrate that digital technologies positively influence sustainable supply chain performance by strengthening internal capabilities, such as agility, collaboration, and resilience. Their study shows that integrating digital tools into supply chain operations not only improves economic efficiency but also aligns industrial ecosystems with ESG (Environmental, Social, and Governance) objectives, reinforcing ethical and long-term business value. At the same time, Sankhla [
27] highlights how digital twins, enhanced with AI and machine learning, enable real-time modeling, simulation, and predictive analytics across logistics and production processes. These virtual replicas provide organizations with a continuous learning loop that improves responsiveness to disruptions and optimizes resource use. In this direction, Di Capua et al. [
28] present the SmarTwin project, which implements an intelligent Digital Supply Chain Twin (iDSCT) capable of integrating heterogeneous data into a unified semantic framework. The system leverages predictive analytics and early-warning alerts to enhance decision-making, risk management, and sustainability outcomes.
Collectively, these studies underscore a paradigm shift toward intelligent, data-driven, and environmentally conscious supply chains. The integration of digital twins, AI, and ESG principles is redefining how organizations achieve efficiency, resilience, and sustainability, setting the foundation for next-generation supply chain ecosystems within the Industry 4.0 landscape.
2.6. Cybersecurity and Data Governance in Industry 4.0 Context
In the context of Industry 4.0, cybersecurity and data governance are critical to ensuring the resilience, trust, and operational continuity of interconnected digital ecosystems. As organizations increasingly rely on AI, big data, and IoT technologies, they face growing challenges in safeguarding data integrity, privacy, and compliance. The convergence of intelligent cybersecurity systems and structured governance frameworks has therefore become essential to achieving sustainable and secure digital transformation. Kezron [
29] proposes an AI-based cybersecurity framework for smart cities that integrates machine learning, federated learning, and blockchain to predict and prevent cyber threats while ensuring rapid recovery from incidents. This approach highlights how AI can enhance threat anticipation, automate defensive responses, and strengthen the resilience of complex urban and industrial networks. Complementarily, Anil and Babatope [
30] emphasize the strategic role of data governance in enhancing cybersecurity resilience within global enterprises. Their study demonstrates how well-defined governance structures—supported by policies, accountability mechanisms, and compliance with regulations such as GDPR and CCPA—can protect data integrity and confidentiality while enabling adaptive risk management. They also highlight the contribution of AI and machine learning tools in enabling real-time monitoring and intelligent decision-making across distributed environments.
In parallel, Osaka and Ricky [
31] present a big data governance model focused on reinforcing cybersecurity in smart enterprises. Their framework aligns data stewardship, access control, metadata management, and blockchain auditing to ensure transparency, traceability, and accountability. By integrating emerging technologies such as federated learning and AI-based anomaly detection, this model demonstrates how governance can evolve into a proactive mechanism for protecting digital assets and maintaining compliance in large-scale data ecosystems.
Collectively, these studies reveal that the synergy between AI-driven cybersecurity, robust governance structures, and big data management forms the foundation of resilient Industry 4.0 environments. They illustrate the ongoing transition from reactive defense models to proactive, intelligent systems capable of ensuring both security and sustainability in complex digital infrastructures.
2.7. Literature Analysis
The frameworks analyzed for creating VOs provide conceptual and structural foundations but lack the technical and operational details necessary for their practical implementation. The main gaps are the absence of detailed architectural specifications, technological requirements, and autonomous decision-making and self-adaptation mechanisms. While the frameworks emphasize collaboration, sustainability, and strategic alignment, they do not address critical aspects such as governance, risk management, and lifecycle management. In addition, the frameworks lack empirical validation and scalability considerations, which limit their applicability to real-world scenarios. To enable the creation of AVOs, future frameworks must incorporate detailed technical architecture and comprehensive governance models. They must also address the entire lifecycle of service organizations, including dynamic evolution, performance monitoring, and dissolution. In addition, autonomous operating mechanisms such as self-adaptation, conflict resolution, and automated resource allocation are essential. By addressing these gaps, frameworks can move from conceptual models to practical solutions supporting scalable, AVO.
The integration of Industry 4.0 technologies, such as AI, data mining, and big data analytics, with ACODAT has the potential to transform DSCs by enabling real-time decision-making, predictive analytics, and self-organizing capabilities. AI and data mining techniques can process vast amounts of supply chain data to uncover patterns, optimize operations, and predict disruptions. In contrast, big data analytics provide the foundation for real-time monitoring and strategic insights [
24]. These technologies align with ACODAT principles by enabling autonomous systems to sense, analyze, and respond to dynamic supply chain conditions. However, a critical gap exists in generating these DSCs for VO, which require advanced coordination mechanisms, dynamic resource sharing, and seamless integration across decentralized networks. Addressing this gap is essential for leveraging AI and big data to enhance the adaptability and efficiency of virtual supply networks, presenting a significant opportunity for future research. This work proposes an architecture to fill this gap, using, in addition to ACODAT, RAMI 4.0 as design principles [
32].
3. Autonomous Virtual Organizations Management Architecture (AVOMA) Based on ACODATs
Based on the RAMI 4.0 standard [
32,
33,
34] and ACODAT, this study proposes an architecture for AVO Management (see
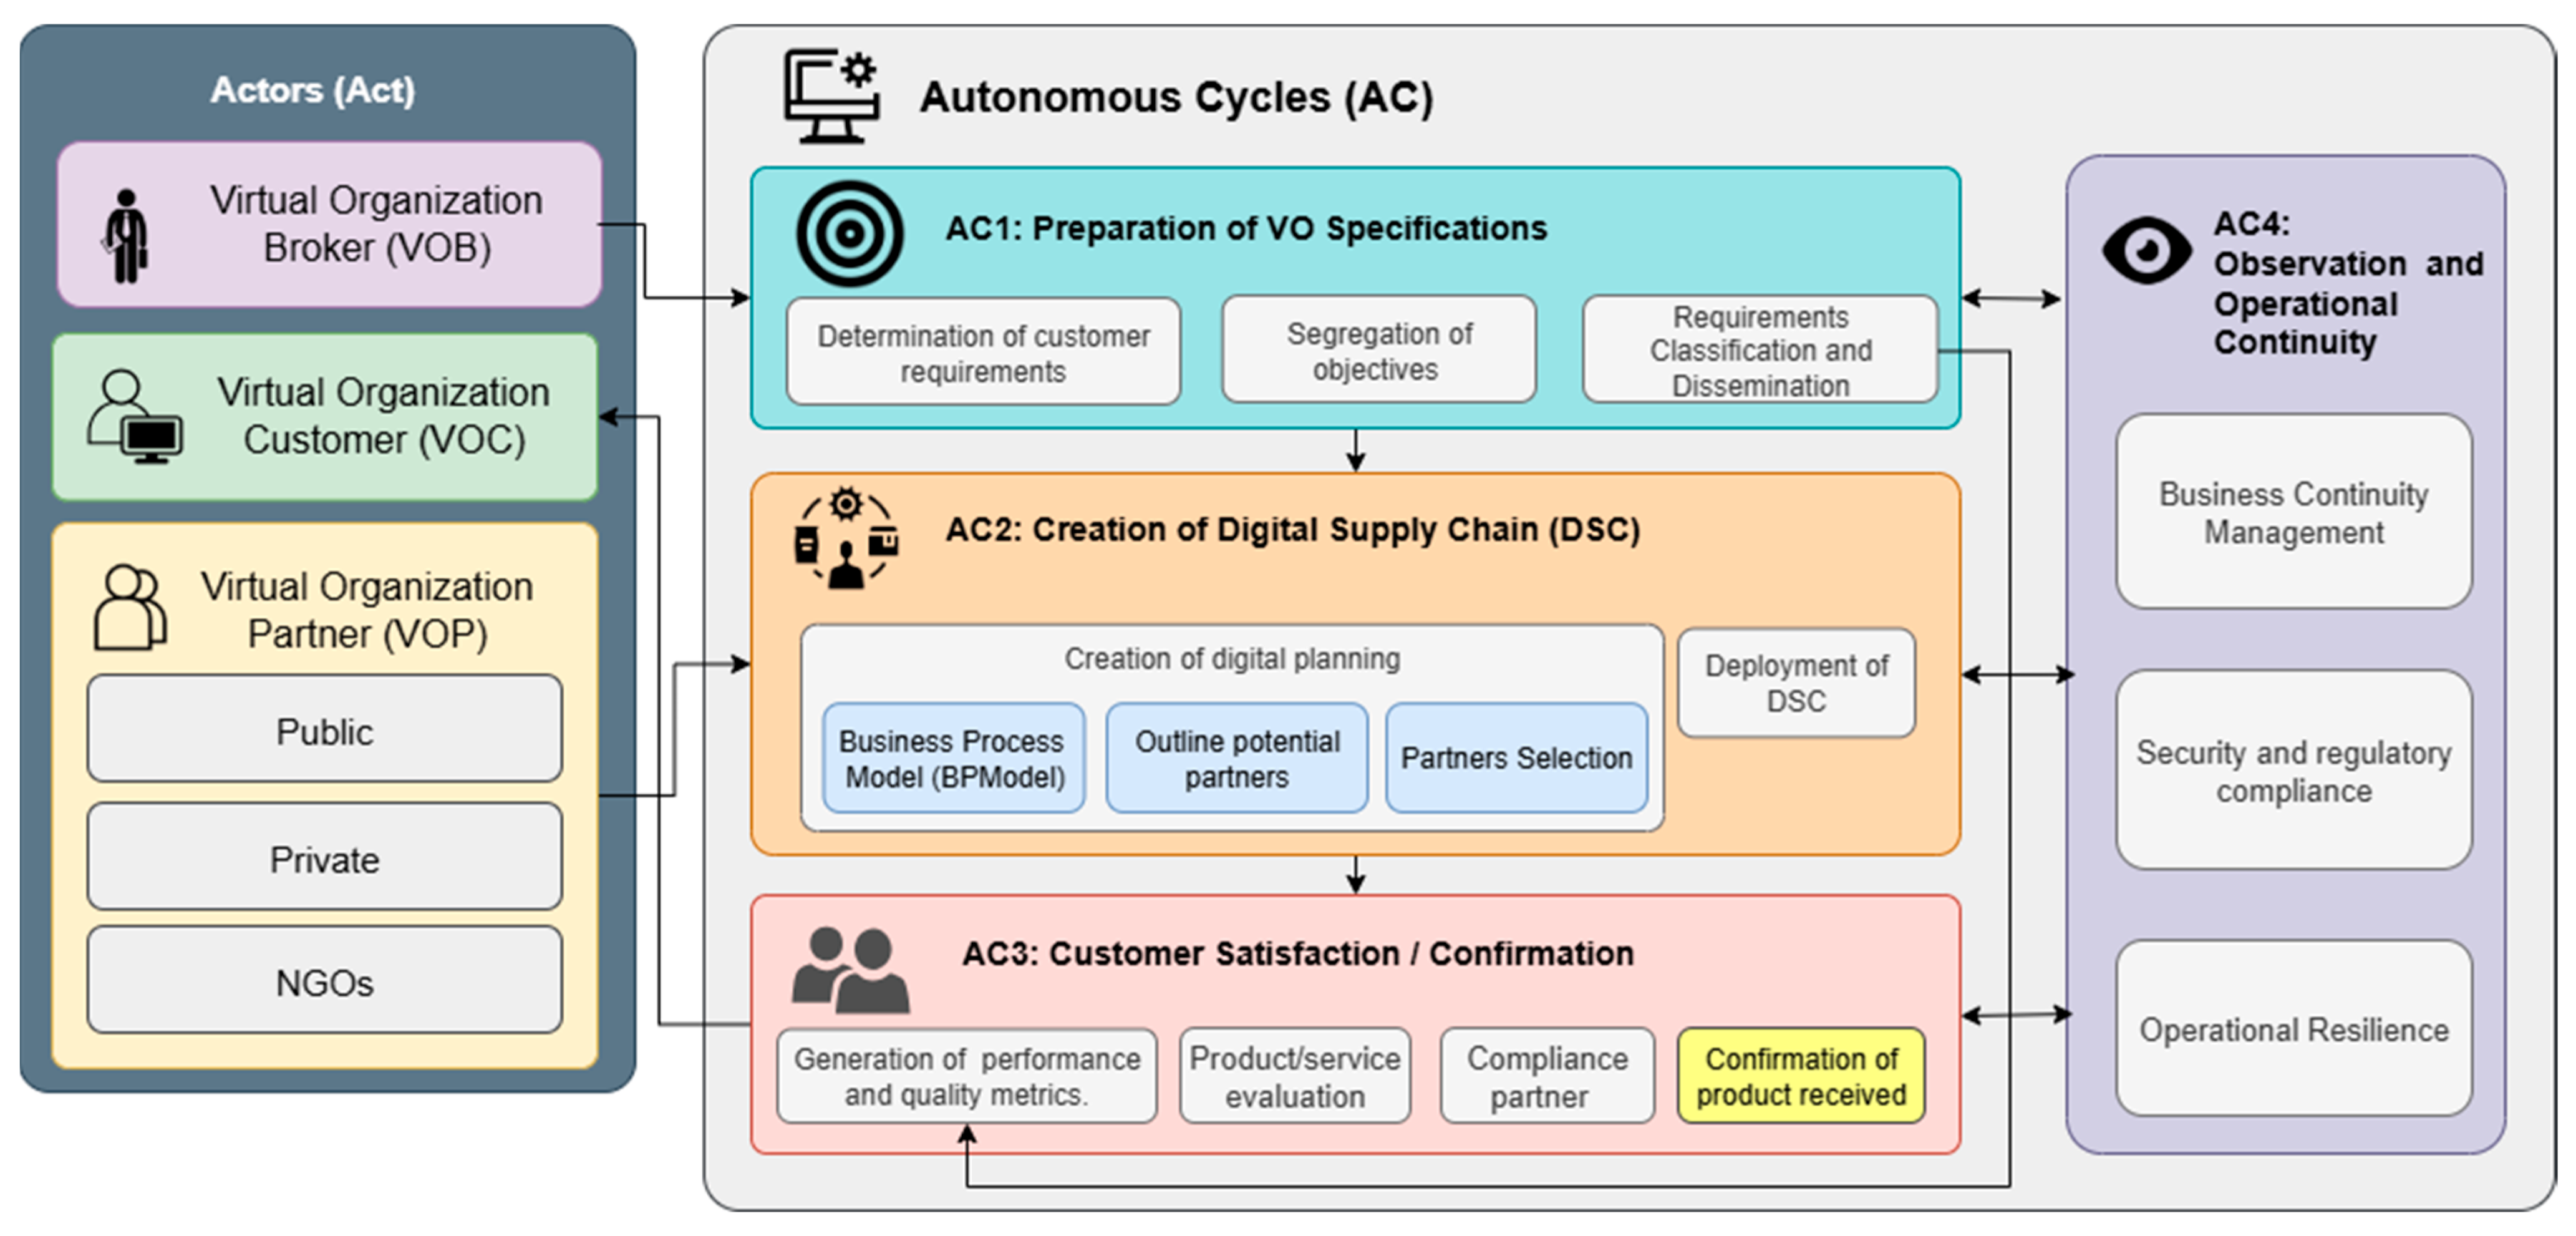
Figure 1). Built upon the RAMI 4.0, this architecture maintains a one-to-one correspondence between its layers and RAMI’s standardized architectural framework, ensuring systematic integration of Industry 4.0 capabilities. This architecture consists of two layers: the first layer contains the actors that intervene in the process. This layer, called the
actor layer, has the VOB (Virtual Organization Broker) that will supervise the management of the process, from the collection of the requirements from the VOC (Virtual Organization Client) to the management of the list of possible partners (VOP, Virtual Organization Partner) of the VO. The actor client will be the one who makes the specifications for their needs, detailing general and specific objectives. These objectives must be clear, concise, and verifiable. The possible partners (VOP) can be public or private organizations or NGOs, and will be the ones who will receive the invitations to participate in a partner selection process. They must express their voluntary acceptance to participate, sending relevant information on their business model, such as activities that it carries out and resources with which it could contribute. The second layer is the
Autonomous Cycles (AC) layer, which contains four autonomous cycles, which will be explained in
Section 4.
4. Specification of the Autonomic Cycles for AVO Management
The ACODATs for AVOs Management proposed in this paper characterizes a set of data analysis tasks to permit the creation of VOs in an autonomous way allowing to generate the AVO objective, select the finest set of possibles partners, define the business processes flow, observe the process to recognize shortcomings, recommend improved activities, and finally, score the partners and asses the final product. Specifically, the architecture comprises four ACODATs, as depicted below:
AC1: This initial cycle focuses on defining VO specifications through an iterative requirement engineering process. Customer needs are captured and refined via structured dialogue and continuous feedback until validated objectives are achieved. Each task is categorized into services or products and mapped to specific deliverables, timelines, and quality standards. The resulting specification framework is shared across stakeholders through a centralized platform, ensuring transparency and alignment with the client’s vision. This systematic approach establishes the foundation for the next autonomous cycles and promotes consistent communication among participants.
AC2: The second cycle constructs the Business Process Model (BP Model) from client-defined tasks and requirements, which guides the identification of needed capabilities and potential partners. Partner selection follows established criteria evaluating competence, performance history, and compliance with project needs. The resulting Digital Supply Chain (DSC) forms a dynamic, demand-driven network that configures itself based on partner capabilities. Unlike traditional linear supply chains, this adaptive structure enables real-time reconfiguration, automated task assignment, and efficient resource allocation, enhancing flexibility and responsiveness.
AC3: This cycle ensures that final deliverables align with predefined quality, functionality, and timeline requirements. Partner performance is evaluated based on contractual adherence, contribution quality, and responsiveness. Customer satisfaction is gathered through structured feedback, quantified via scores and qualitative insights. These evaluations feed into a continuous improvement framework, enabling corrective actions and reinforcing long-term collaboration and trust within the DSC.
AC4: The final cycle operates transversally, ensuring VO stability through continuous analysis of DSC data, client feedback, and product evaluations. It integrates Business Continuity Management, Security and Regulatory Compliance, and Crisis Management. These mechanisms collectively monitor partner performance, safeguard data privacy, ensure adherence to regulations, and trigger adaptive responses to disruptions. This cycle supports operational integrity, resilience, and adaptability—core enablers of sustainable performance in Industry 4.0 environments.
Below is described in detail each of the ACODAT, in particular, the tasks that the components perform, the data sources they use, among other things.
4.1. AC1: Prepare the VO Specifications
The main challenge of this AC is to identify the objectives of the new VO, starting from the requirements given by the customer and disseminating the formalized specifications. This cycle is composed of the tasks shown in
Table 1, which also contains the data sources and IA techniques used in each task. For example, Generative AI is used for initial requirements processing, Natural Language Processing (NLP) for objective segregation, and a combination of NLP with Machine Learning for effective requirements classification and dissemination. These tasks are:
Task AC1.1 Determine the customer’s requirements
Task AC1.2 Segregate objectives
Task AC1.3 Classify and Disseminate Requirements
Task AC1.1. Determine the customer’s requirements: This task initiates the observation process by analyzing the client’s initial list of requirements using natural language processing (NLP) and generative AI. NLP extracts key terms and themes, while generative AI formulates targeted questions to clarify ambiguities, reveal hidden needs, and suggest additional functionalities. The process is iterative—AI analyzes responses, detects gaps, and refines questions until all requirements are validated with the client. The outcome is a comprehensive and refined list of requirements that accurately reflects the customer’s expectations, forming a solid basis for subsequent analysis and decision-making.
Task AC1.2. Segregate objectives: This task employs generative AI to systematically break down the client’s primary requirements into detailed subtasks, ensuring a comprehensive understanding of the VO’s goals. After capturing the main requirements, the system utilizes generative AI to analyze each primary task and automatically generate a structured set of subtasks, complete with specific objectives and required resources. These generated subtasks are then presented to the client for review and validation through an iterative refinement. If the client disagrees with any aspect of the proposed subtasks, the system collects their feedback, analyzes areas of concern, and regenerates improved versions based on the client’s input. This feedback loop continues until the client confirms their acceptance of all subtasks, thereby formalizing the objectives of the VO. This systematic approach ensures that the final breakdown accurately reflects the client’s needs while maintaining operational feasibility, creating a solid foundation for subsequent resource allocation and partner matching within the VO.
Task AC1.3. Classify and disseminate specifications: After formalizing objectives, the VO platform automatically classifies requirements using the International Standard Industrial Classification (ISIC) to align project needs with provider capabilities [
35]. Based on this categorization, the system identifies and notifies providers whose ISIC profiles match the required services. Each invitation includes detailed task specifications linked to the corresponding ISIC codes, ensuring precise alignment between project requirements and provider offerings.
Table 1 contains the data sources, including customer submitted requirements, information collected from previous tasks, and partner registration data.
4.2. AC2: Create the Digital Supply Chain (DSC) Management
This AC, considered the critical phase of the process, is responsible for establishing the VO by implementing the BP MODEL, outlining the potential partners, selecting the most suitable partners, and deploying the DSC to deliver the product or service. BPM ensures the structured management and optimization of workflows, enabling efficient coordination and execution of partner tasks. On the other hand, the DSC plays a vital role in organizing the supply chain by assigning specific functions to providers and clearly defining their responsibilities, timelines, and associated costs. The cycle consists of the following tasks (See
Table 2):
Task AC2.1 Create the Business Process Flow.
Task AC2.2 Outline potential partners
Task AC2.3 Select partners.
Task AC2.4 Deploy the DSC
Task AC2.1. Create the Business Process Model: The creation of the BP MODEL begins with the detailed information gathered in AC1.2, where client requirements are divided into tasks and subtasks. These elements are analyzed to identify dependencies, priorities, and logical sequences. Each task is represented as a process activity, while subtasks are detailed as specific actions within those activities. The BP MODEL is then structured by arranging processes logically, incorporating sequential and parallel tasks, decision gateways, and resource allocation points. Using standard BP MODEL symbols, the model visually represents the workflow, ensuring clarity and alignment with the specified requirements. This organized and logical sequence of processes forms the foundation for efficient execution and collaboration within the VO.
Task AC2.2. Outline potential partners: This task identifies and profiles the most suitable partners for the functions described in AC1.2 while analyzing responses from providers who accepted invitations and submitted offers. The process begins with provider profiling, where service portfolios, capabilities, and historical performance are evaluated to assign suitability scores. Simultaneously, responses to task invitations are collected and analyzed based on pricing, timelines, and alignment with requirements.
Task AC2.3. Select partners: This step utilizes the ranked list of potential partners from AC2.2 to implement a systematic decision-making process for final partner selection. The system analyzes candidates based on suitability scores and applies predefined rules, such as prioritizing SMEs and individual providers over larger companies when scores are equal. This data-driven approach ensures that the selection process is efficient and fair while the selected model undergoes validation to ensure accuracy and reliability in partner matching. The process then moves to the execution phase, where agreement documents are automatically generated and sent to each selected partner. If any partner declines the agreement, the system immediately extends the invitation to the next best-qualified candidate from the ranked pool. This iterative process continues until all required partners are confirmed, ensuring that the VO comprises the most suitable and capable members to meet the defined specifications. The systematic and rule-based approach guarantees transparency and efficiency in forming the optimal team for project execution.
Task AC2.4. Deploy the DSC: The Digital Supply Chain (DSC) is the core structure of the VO, organizing partners, resources, and tasks into an integrated network. Using Industry 4.0 technologies, it autonomously manages processes, defines partner roles, and allocates resources to ensure efficient collaboration. Through process and data mining, the DSC optimizes logistics, inventory, and distribution, guaranteeing seamless operations where every task contributes to the delivery of customized products or services.
Table 2 summarizes the creation of the Digital Supply Chain (DSC) through four analytical tasks.
AC2.1 generates the Business Process Model (BP Model) from VO specifications using data mining and generative AI.
AC2.2 identifies potential partners by analyzing requirements and responses through data and social mining.
AC2.3 ranks and selects partners with machine learning models, integrating information from previous tasks. Finally,
AC2.4 consolidates partner, task, cost, and deadline data to deploy the DSC. This structured process leverages advanced analytics to ensure efficient collaboration and optimized resource management.
4.3. AC3: Rate the Customer Satisfaction/Confirmation
The Customer Satisfaction/Confirmation cycle leverages Data Mining, Data Integration, Big Data Analytics, and Machine Learning to comprehensively evaluate service/product quality. The system calculates performance metrics based on process data and customer feedback, generating automated ratings that reflect objective measurements and subjective assessments. Additionally, Machine Learning algorithms evaluate partner compliance by comparing actual performance against SLAs (Service Level Agreement) and initial agreements, analyzing key performance indicators throughout the process. Finally, the system integrates all evaluation results—including individual partner assessments, overall product quality metrics, and customer satisfaction indicators—to validate and confirm the final service/product delivery, ensuring it meets or exceeds the specified initial requirements and customer expectations. The cycle consists of the following tasks:
Task AC3.1 Product/service evaluation.
Task AC3.2 Assess the partners’ compliance.
Task AC3.3 Confirm the final product/service.
Task AC3.1. Product/service evaluation: This step consists of two parts. In the first instance, performance and quality metrics are established based on the requirements defined in AC1. Once the product is completed and all partners confirm that they have completed their assignments, this phase begins. This phase starts by recording the key indicators derived from the specified objectives, followed by the systematic collection of internal data that reflects the product’s adherence to the established requirements, tasks, and subtasks. These observation activities provide a solid foundation for the subsequent analysis phase.
Task AC3.2. Assess the partners’ compliance: The analytical step implements a structured evaluation process that uses the information gathered in AC3.1 to assess partner performance and product quality based on the defined metrics. This involves reviewing the recorded performance indicators and comparing the results of each partner’s task against their assigned responsibilities and the established objectives. The process evaluates task completion, quality of execution, adherence to timelines, and resource utilization, ensuring alignment with the initial requirements. By systematically comparing these outcomes with the expected standards, the evaluation generates performance scores for each partner, providing an objective assessment of compliance and identifying areas for potential improvement.
Task AC3.3. Confirm the final product/service: This task validates the successful completion of the deliverable through three integrated evaluations. First, partner performance scores from AC3.2 are correlated with quality metrics from AC3.1 to form a matrix showing how execution affects final quality. Second, the deliverable is compared against client specifications using a detailed checklist to verify full compliance with the BP and DSC models. Finally, customer feedback—ratings and comments—is analyzed alongside performance and compliance data to obtain a comprehensive assessment. Any discrepancies are flagged for correction, ensuring that the final product or service meets both technical standards and client expectations.
Table 3 summarizes the tasks of AC3, including their technologies and data sources.
AC3.1 uses data mining, integration, big data analytics, and machine learning to evaluate product or service quality based on performance metrics.
AC3.2 applies data integration and machine learning to assess partner compliance and generate performance scores.
AC3.3 employs big data analytics and machine learning to synthesize evaluation results—combining partner performance, technical compliance, and customer satisfaction—into the final confirmation decision.
4.4. AC4: Observation and Operational Continuity
The observation and operational continuity cycle is a transversal and iterative process interacting with all other cycles in the VO. Its primary purpose is to ensure business continuity, maintain robust security controls, uphold regulatory compliance, and achieve operational resilience. The cycle consists of the following tasks (See
Table 4).
Task AC4.1. Business Continuity Management
Task AC4.2. Security and regulatory compliance
Task AC4.3. Operational Resilience
Task AC4.1. Business Continuity Management: This task involves systematic monitoring and data collection across the three previous cycles (AC1, AC2, and AC3) to ensure operational stability and identify potential risks. This process begins by gathering critical information from:
AC1 Cycle: Monitoring the requirements specifications and their evolution throughout the project lifecycle, including any modifications or adjustments to initial specifications.
AC2 Cycle: Observing the DSC performance, including partner interactions, workflow execution, and process adherence to the established BP Model.
AC3 Cycle: Collecting data on product/service quality metrics, partner compliance scores, and customer satisfaction indicators.
The observation process continuously tracks key performance indicators, operational metrics, and system behaviors across these cycles, creating a comprehensive view of the VO’s operational status. This collected data is the foundation for subsequent analysis and decision-making regarding business continuity measures.
Task AC4.2 Analysis of Security and Regulatory Compliance: This task evaluates security measures and regulatory compliance across all cycles of the VO. In this step, data from AC1 is reviewed to ensure that initial security requirements and regulatory standards are correctly specified and adhered to; data from AC2 is analyzed to assess the security measures within the DSC and partner compliance with access controls and data protection procedures; and data from AC3 is examined to verify that the final product/service meets both quality and regulatory standards, including the security attributes embedded in partner performance scores and customer feedback. This integrated analysis consolidates all relevant information to pinpoint vulnerabilities and maintain robust security and regulatory frameworks throughout the organization.
Task AC4.3. Operational Resilience: This process ensures fault tolerance within the VO by recording and analyzing service disruptions. Incident data are examined to identify risks, predict vulnerabilities, and recommend mitigation strategies—such as reallocating resources or adjusting workflows—to prevent recurrences. Through this proactive approach, the VO maintains continuous service and strengthens its operational resilience against unexpected challenges.
Table 4 describes the three tasks of AC4. For AC4.1 (Business Continuity Management), the process collects data from all previous cycles (AC1, AC2, AC3) and its cycle (AC4), utilizing Data Mining to extract patterns, Process Mining to analyze workflows, and Data Integration to consolidate information, to produce a comprehensive Contingency Plan. In AC4.2 (Security and Regulatory Compliance), Big Data Analytics processes extensive data from all cycles, generating a detailed Report on Security and Regulatory Compliance that validates adherence to security protocols and regulatory requirements across the VO. Finally, AC4.3 (Operational Resilience) combines Process Mining to analyze operational workflows, Big Data Analytics to process large volumes of incident data, and Machine Learning to predict vulnerabilities and recommend solutions. This task produces a Comprehensive Action Plan and Incident Management Report, ensuring fault tolerance and operational stability.
5. Data Model
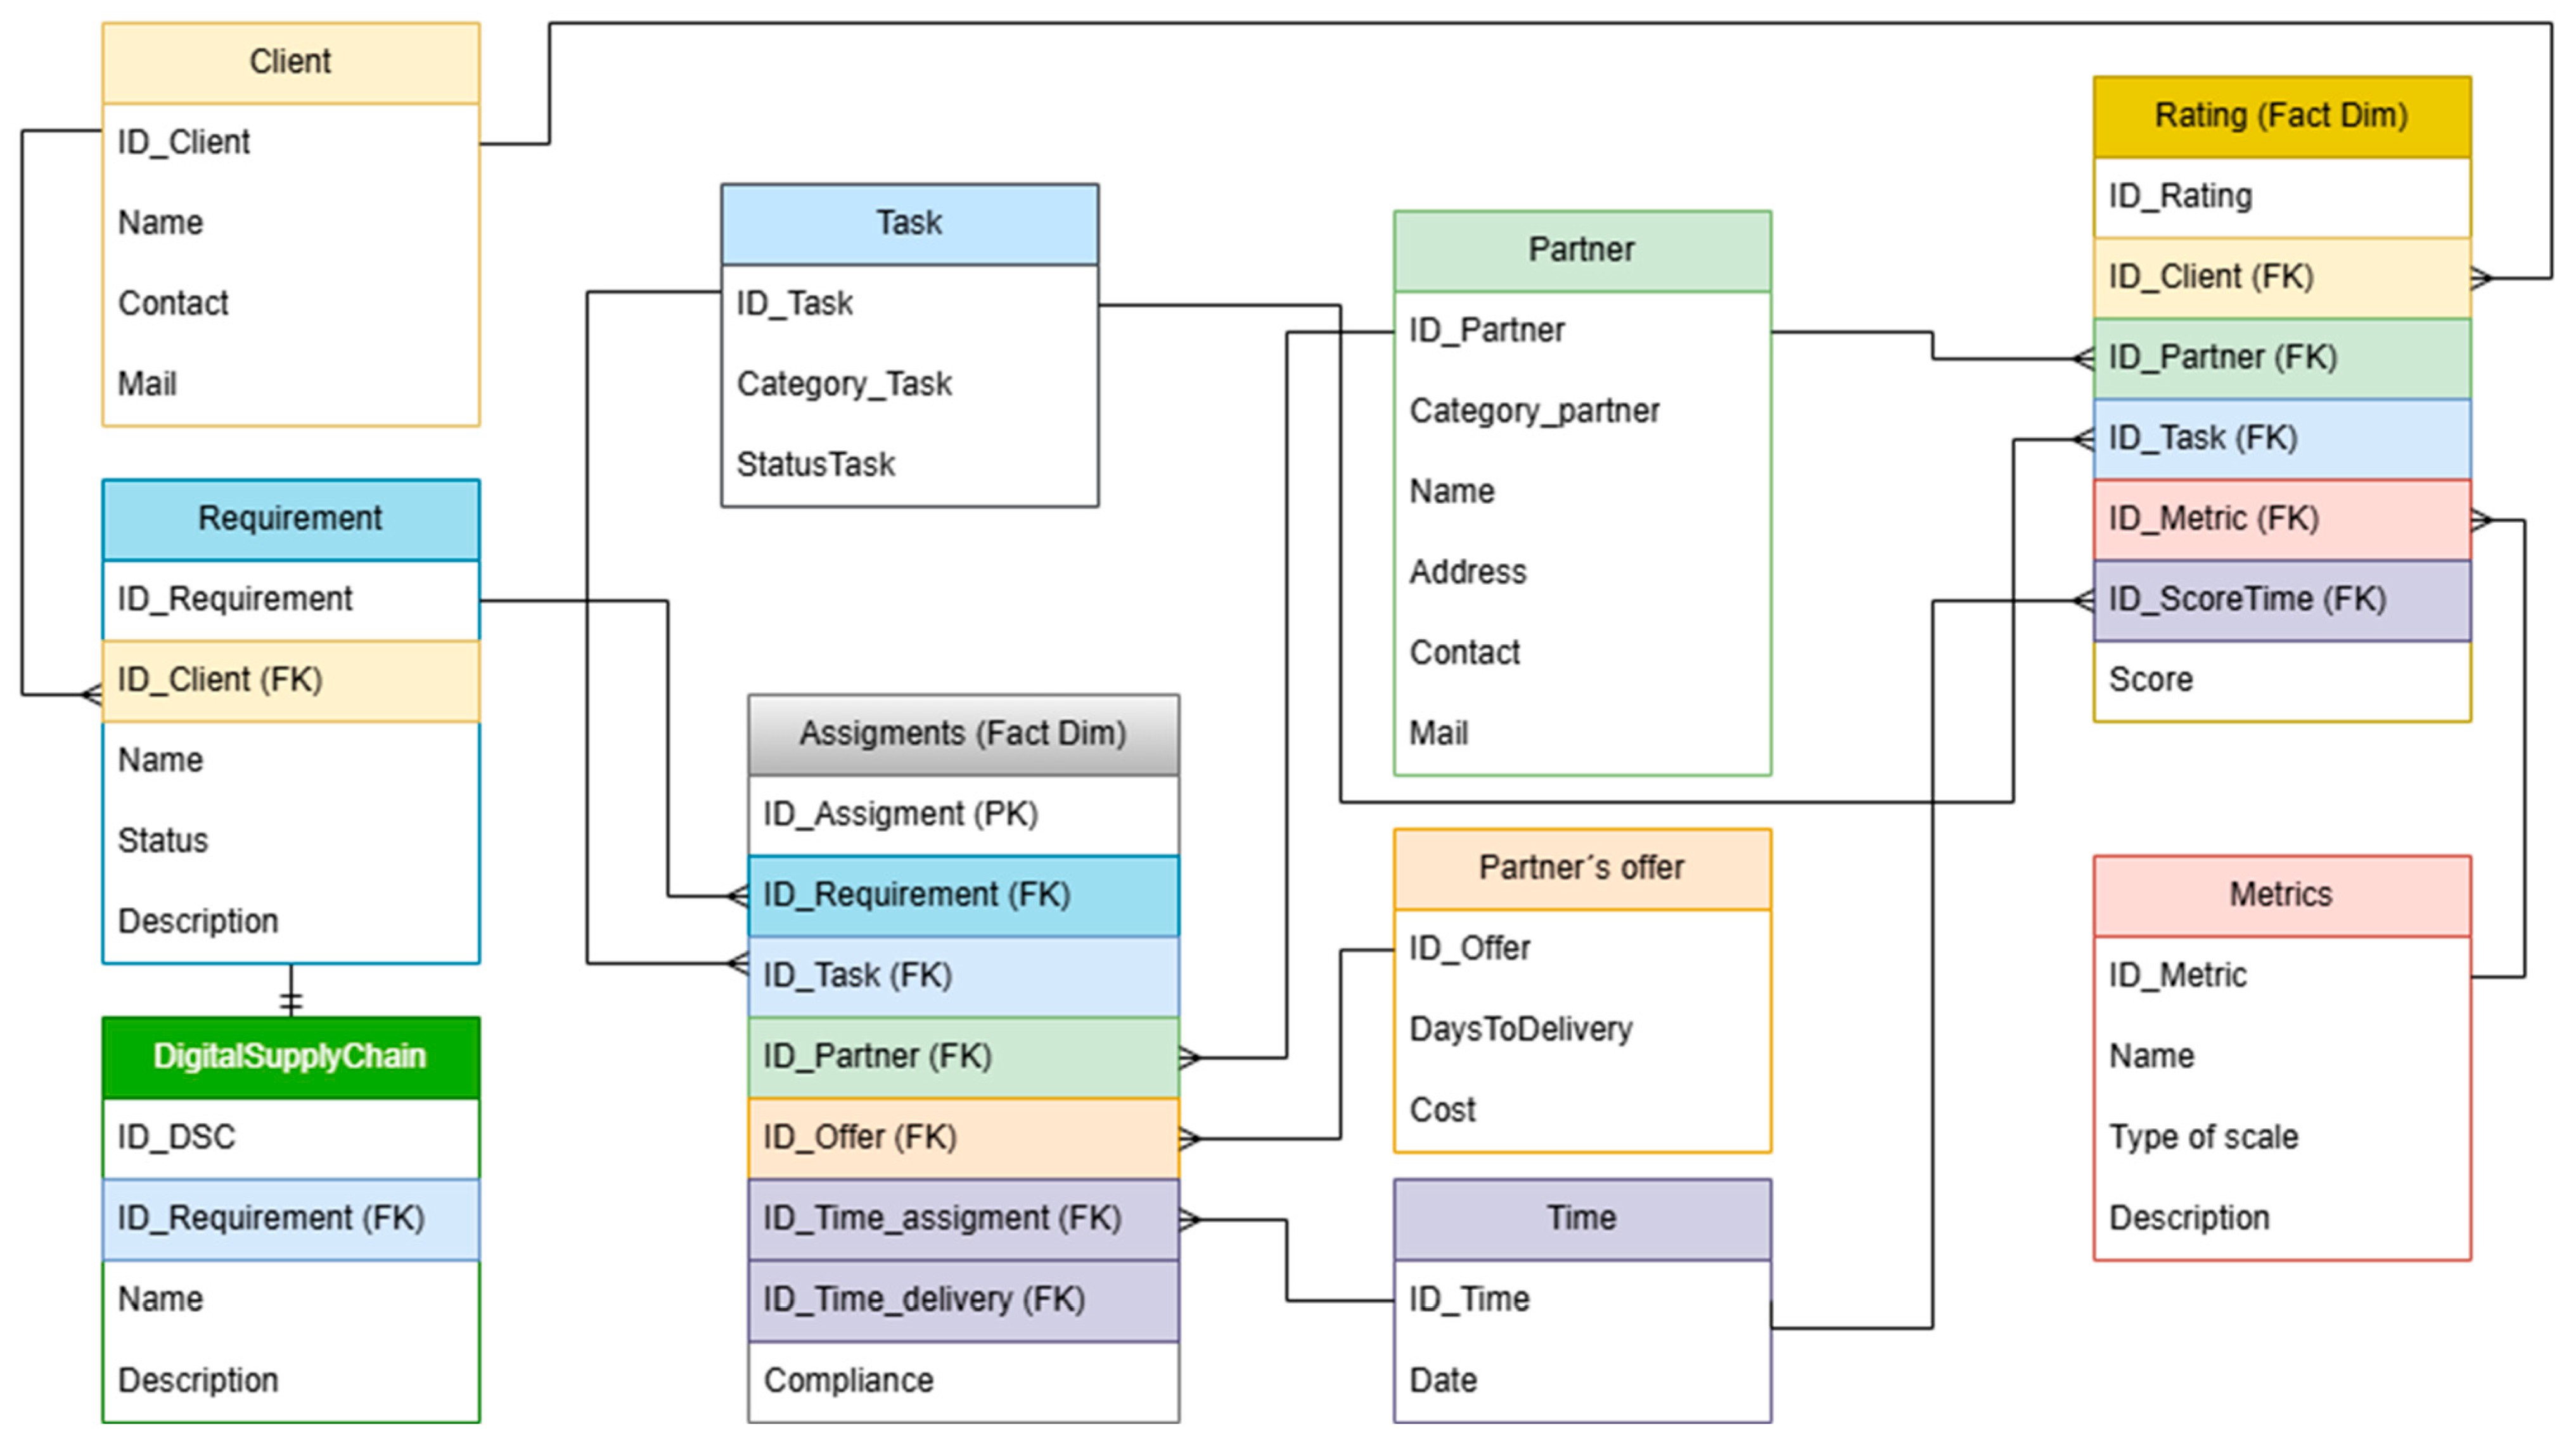
Figure 2 illustrates the dimensional constellation model that addresses the needs of the proposed AVOMA architecture. This model is structured around two main fact tables (FactAssignments and FactRating) and multiple dimensions (Customer, Requirement, Task, Partner, Offer, Metric, Time, etc.). Unlike traditional approaches that detail every supply chain node, this design focuses on capturing each requirement’s tasks and the partners assigned to them, selected through the best offer and supported by a set of evaluation metrics. By dividing the events into two distinct facts—assignments and ratings—this constellation facilitates comprehensive analysis of operational data (costs, delivery times, fulfillment status) and quality/performance evaluations (customer feedback, automated KPIs), all within a single analytical environment. The characteristics of the two fact tables (Assignments and Ratings) and their dimensions are described below:
The Assignments fact table is linked to multiple dimensions: Time, Requirements, Tasks, Partners, and Partner Offerings. This structure enables tracking of task allocations, resource utilization, and partner engagement across different temporal periods. Each task is categorized based on internationally recognized standards, ensuring a structured and consistent approach to defining the program’s needs.
The Ratings fact table connects to Client, Metrics, Partner, and Time dimensions, facilitating the evaluation of partner performance and client satisfaction over time. This measurement framework allows for continuous monitoring and assessment of service quality and partner effectiveness.
Additionally, the Requirements dimension table maintains a relationship with both the DSC (Digital Supply Chain) and Client dimensions, enabling traceability between client needs and supply chain capabilities. This interconnected structure ensures that partner selection and task assignments align with both technical requirements and client expectations.
Table 5 presents the relationship between AC tasks and multidimensional components (the data structures of the multidimensional model used by each data analysis task). For example,
Table 5 shows that the first task of AC1 (AC1.1: Determination of the client’s Requirements) uses the dimensions Client, Requirements, and DSC (DigitalSupplyChain). Likewise, task 2 (AC1.2: Segregation of objectives) uses the dimensions Requirements and Task. Thus, for the rest of the tasks of the different ACs.
6. Overview of Prototype Implementation
This section provides an overview of the prototype implementation and the main user interfaces. The prototype operationalizes two key flows—AC1 (Preparation of VO Specifications) and AC2 (Formalization of the Digital Supply Chain)—to validate the system’s functional and operational feasibility. Below is presented the workflow followed by the prototype and at what time each of the ACODATs implemented (AC1 and AC2) is invoked:
During
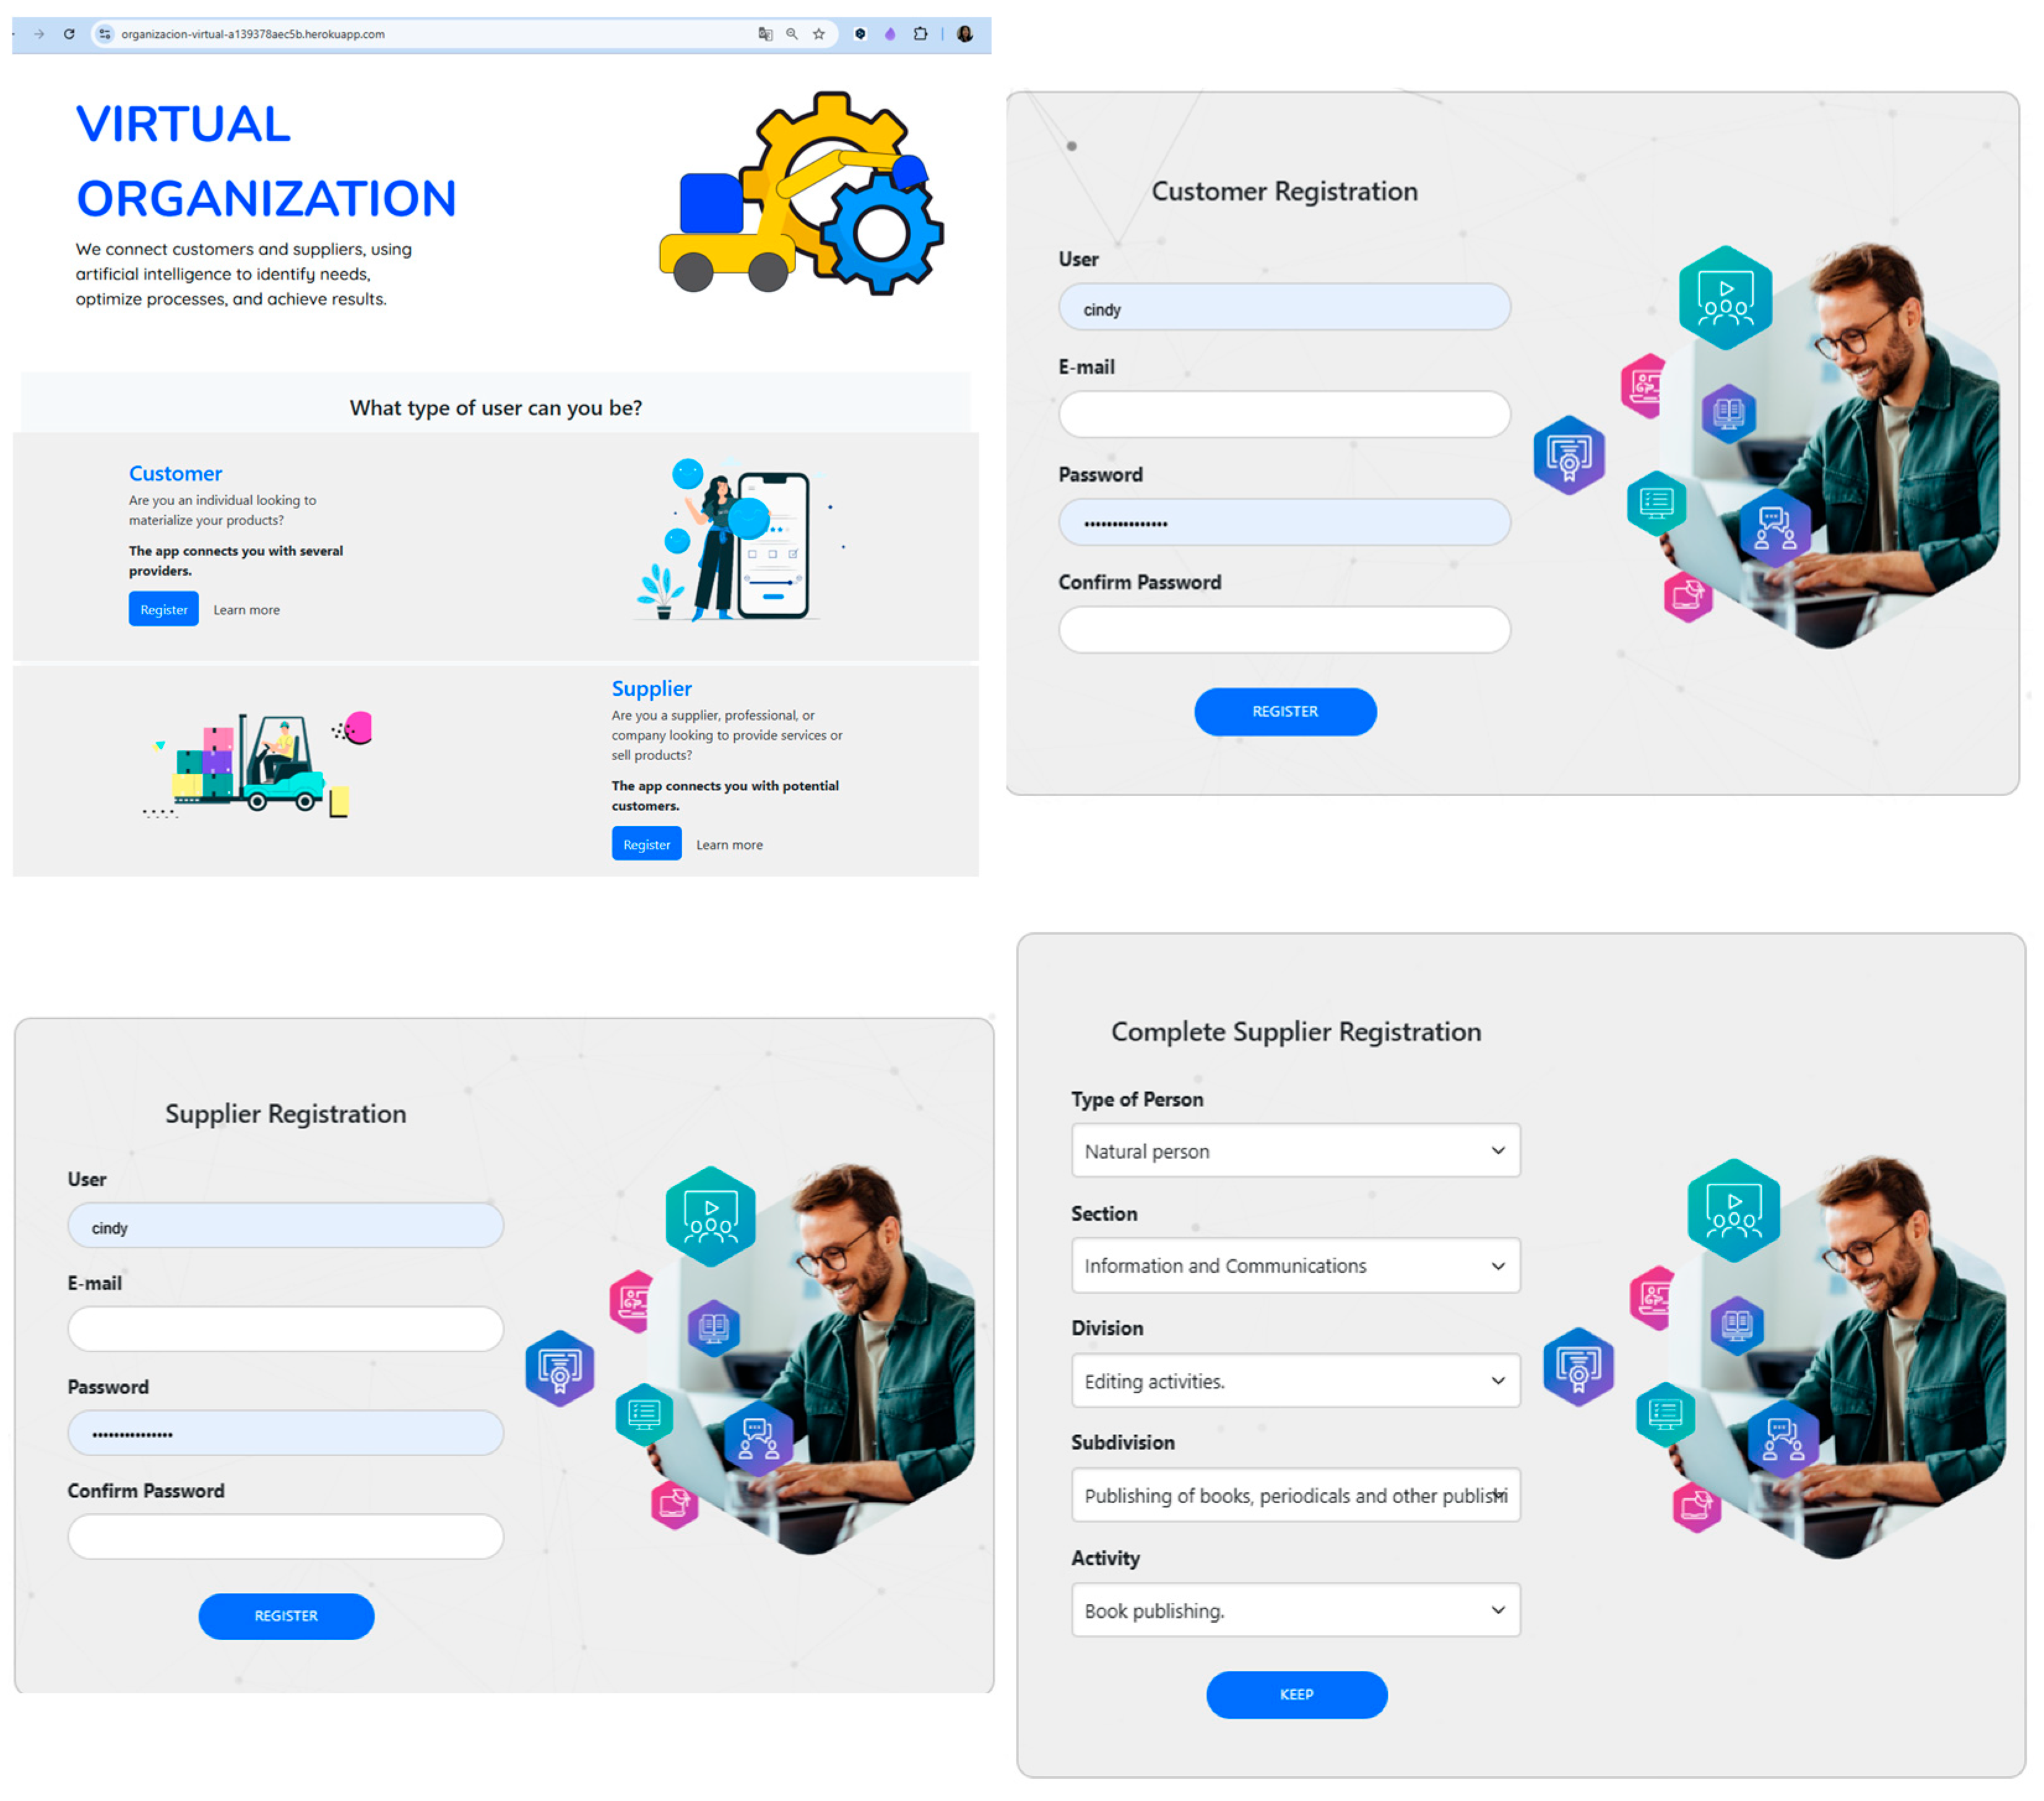
AC1, the system generates dedicated registration forms for both customers and potential partners (See
Figure 3, which shows the initial and registration screens).
Candidate partners use these forms to declare their offered services, selecting the corresponding category from a drop-down list aligned with the United Nations’
International Standard Industrial Classification (ISIC/CIIU) [
35]. Each partner also specifies its business size—micro, small, medium, or large—according to annual revenue and workforce ranges indicated on the form. This information supports the inclusivity criterion by allowing the platform to prioritize or weight SMEs in subsequent partner-selection algorithms.
Once specifications are submitted, the prototype stores each service together with its ISIC code, ensuring that the following integration phase (AC2) relies on a standardized and traceable catalogue of offerings. The prototype includes two interactive dashboards that enable users—customers and suppliers—to track their requests and monitor their current status in real time.
The system’s interface was designed following usability and accessibility principles, emphasizing clarity, intuitive navigation, and consistency across screens. Visual cues, structured layouts, and responsive elements help users complete tasks efficiently, minimizing cognitive load. This user-friendly design ensures accessibility for both technical and non-technical participants, contributing to a positive and inclusive user experience.
6.1. Supplier Dashboard
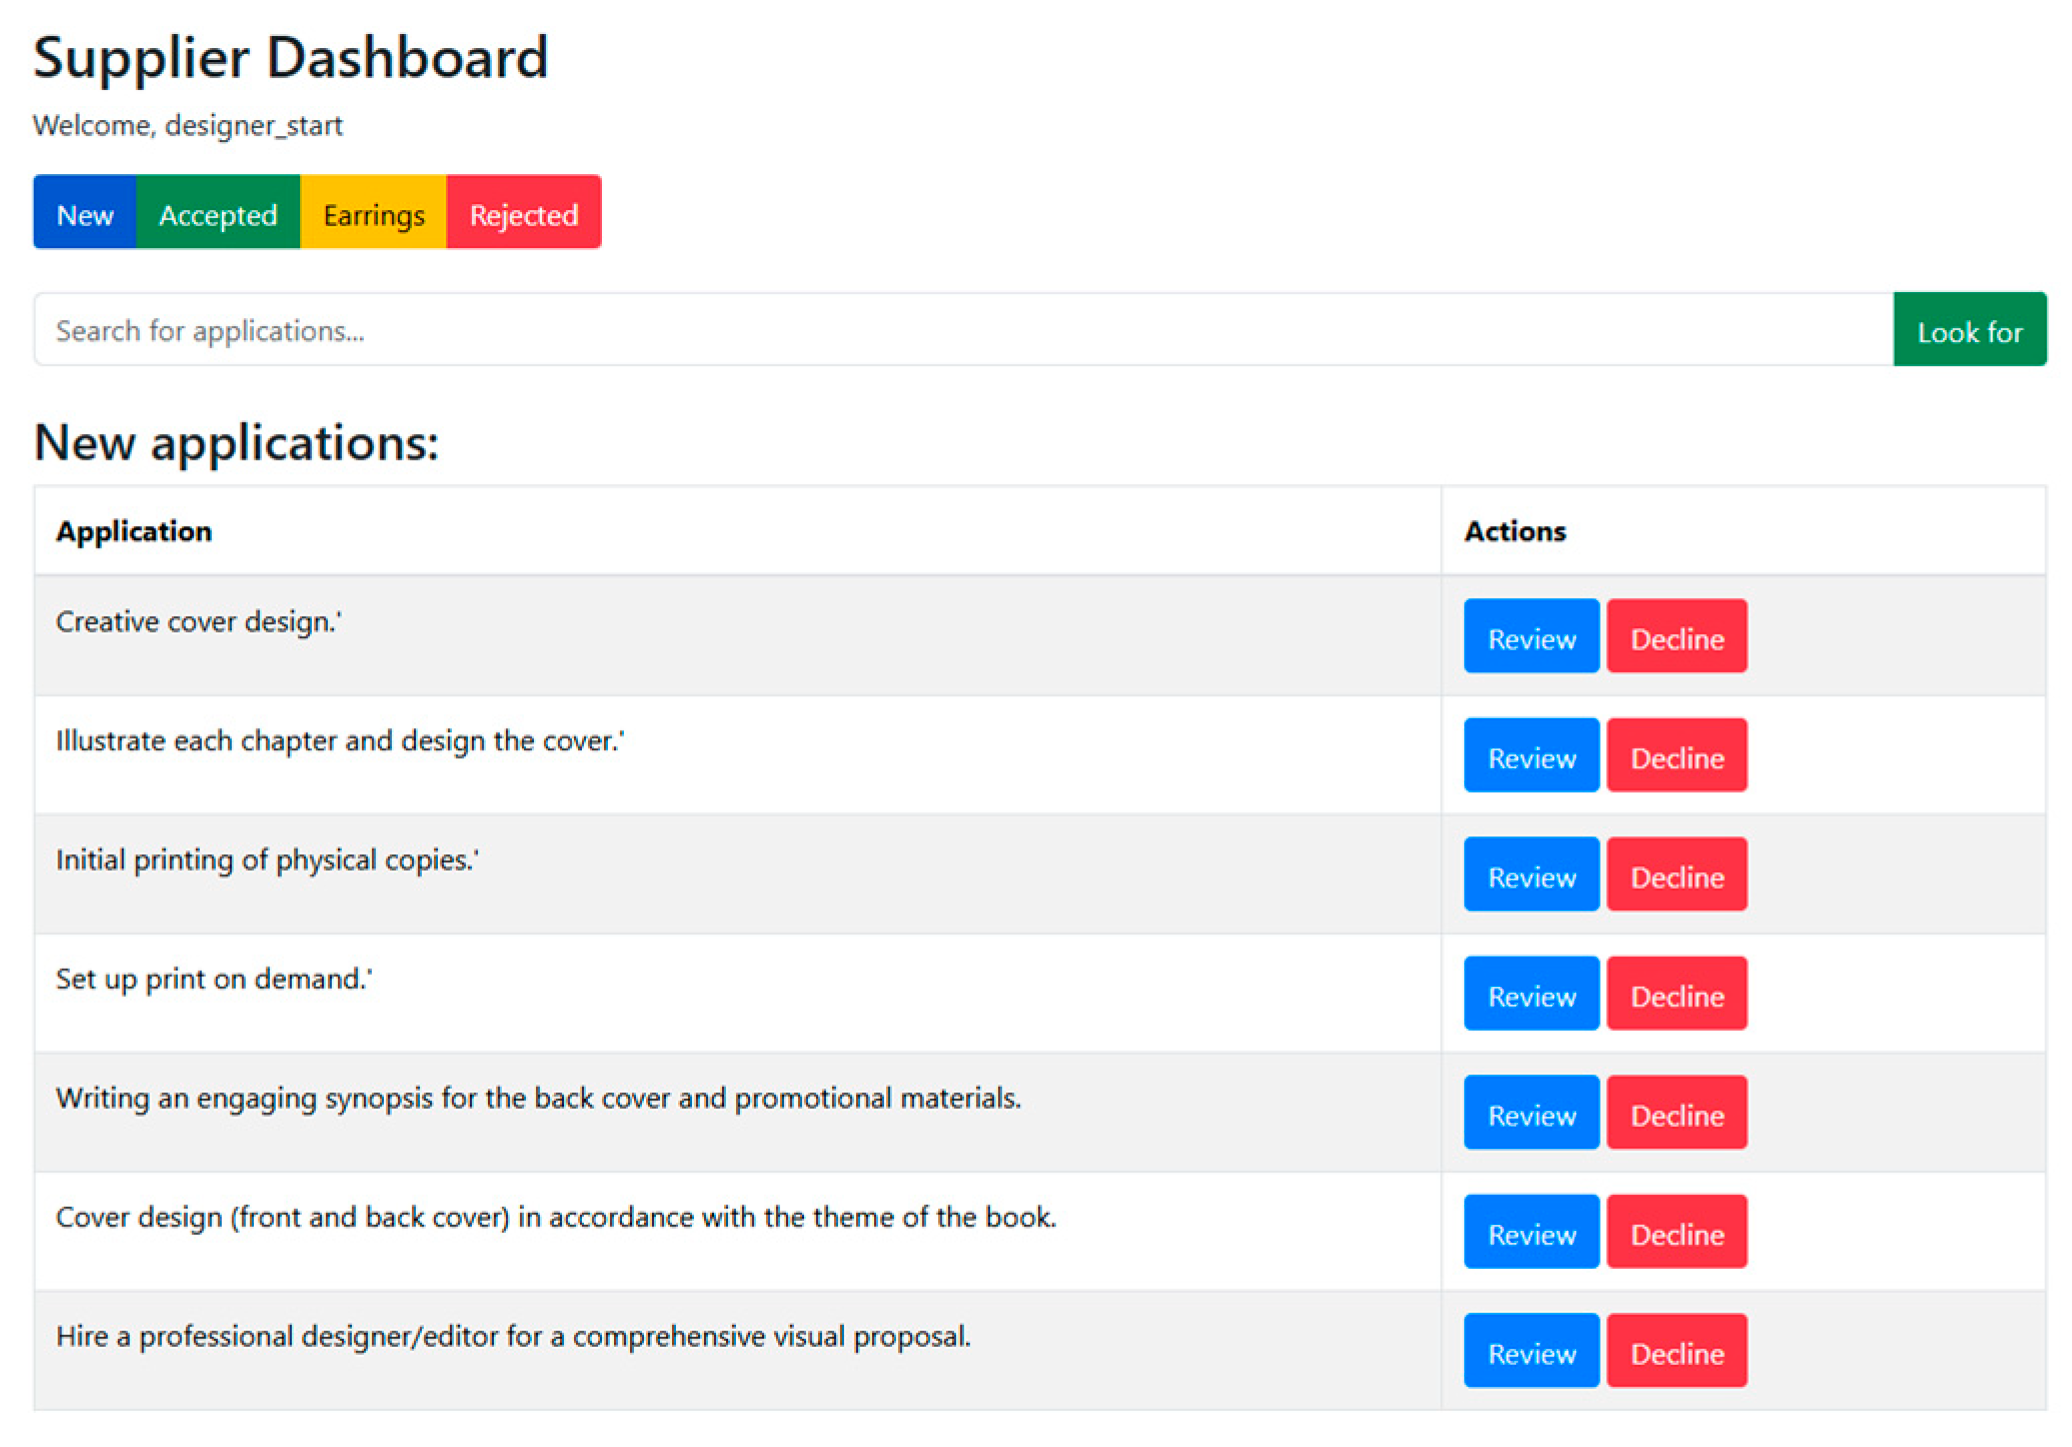
The dashboard provides a clear and efficient interface for suppliers to track and manage their application requests. Color-coded indicators and a simple table layout allow quick status checks and actions. When no new requests exist, the view remains clean, while filter buttons and a search bar enable easy access to past submissions (See
Figure 4).
6.2. Client Dashboard
The Client Dashboard gives end users a single, self-service view of every request they have submitted to the VO. A header identifies the logged-in client, four colour-coded buttons instantly filter requests by status (New, Accepted, In Review, Rejected), and a search bar retrieves specific items. A dynamic table then lists each request with its date, status tag, and a “View” action for drill-down detail. By exposing real-time contract data generated in AC1 and AC2, the interface ensures full traceability, supports autonomous monitoring, and underpins inclusivity and smart-performance goals through seamless links to the platform’s analytic micro-services (See
Figure 5).
7. Case Study: Virtual Organization in an Editorial Consortium
To validate the proposed architecture, it was implemented in a virtual editorial consortium involving bookstores, authors, designers, and printers. Using a web-based prototype, the AC1 and AC2 cycles defined partner roles, configured the digital supply chain, and automatically generated a compliance report (See
Table 6).
The different tasks and interfaces used by the prototype to implement the two cycles, AC1 and AC2, are described below.
7.1. New Product Client Request
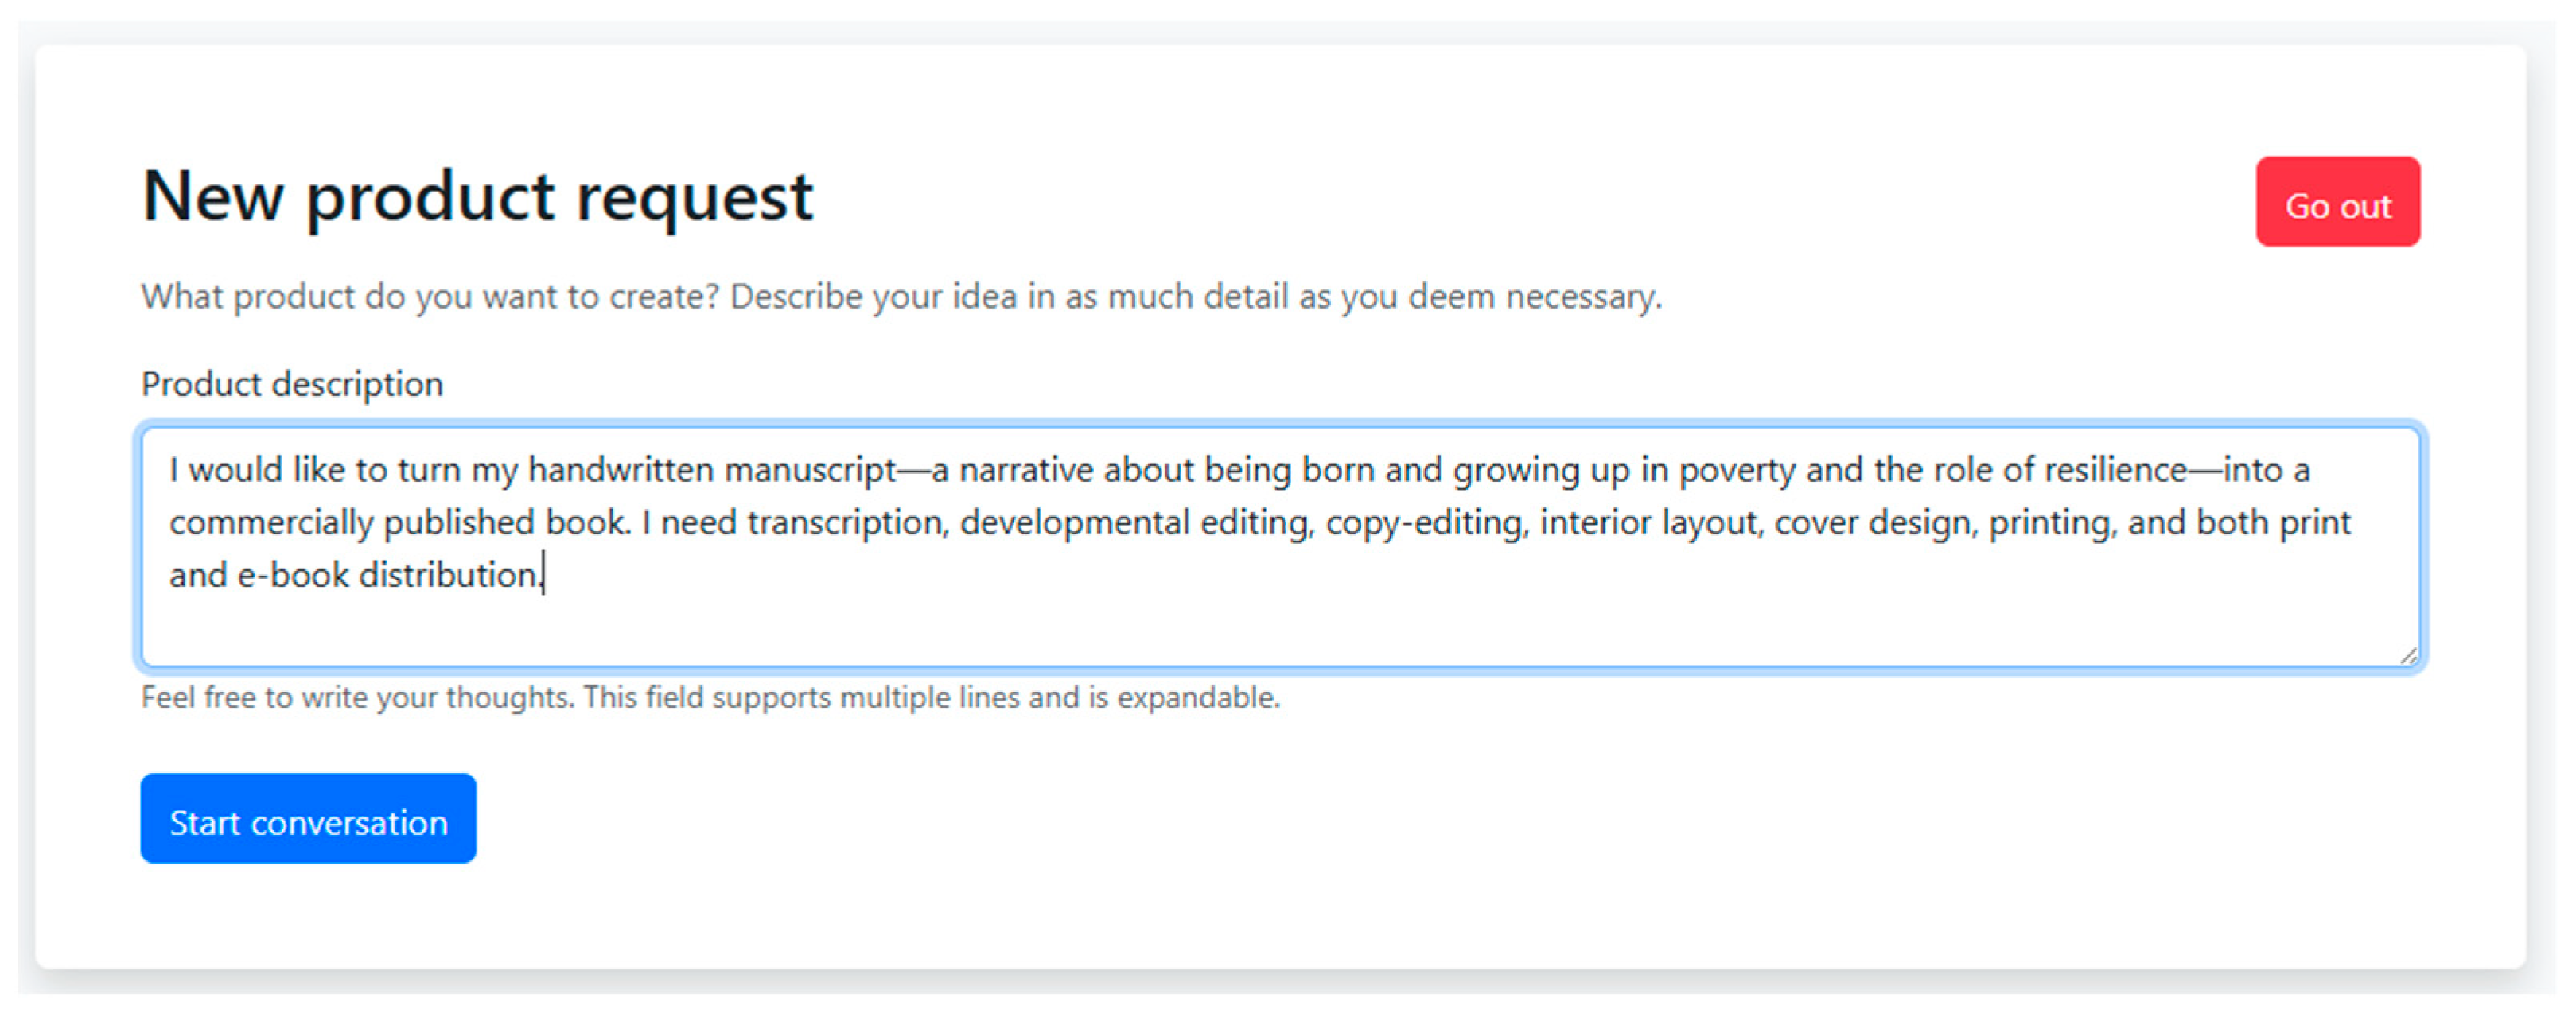
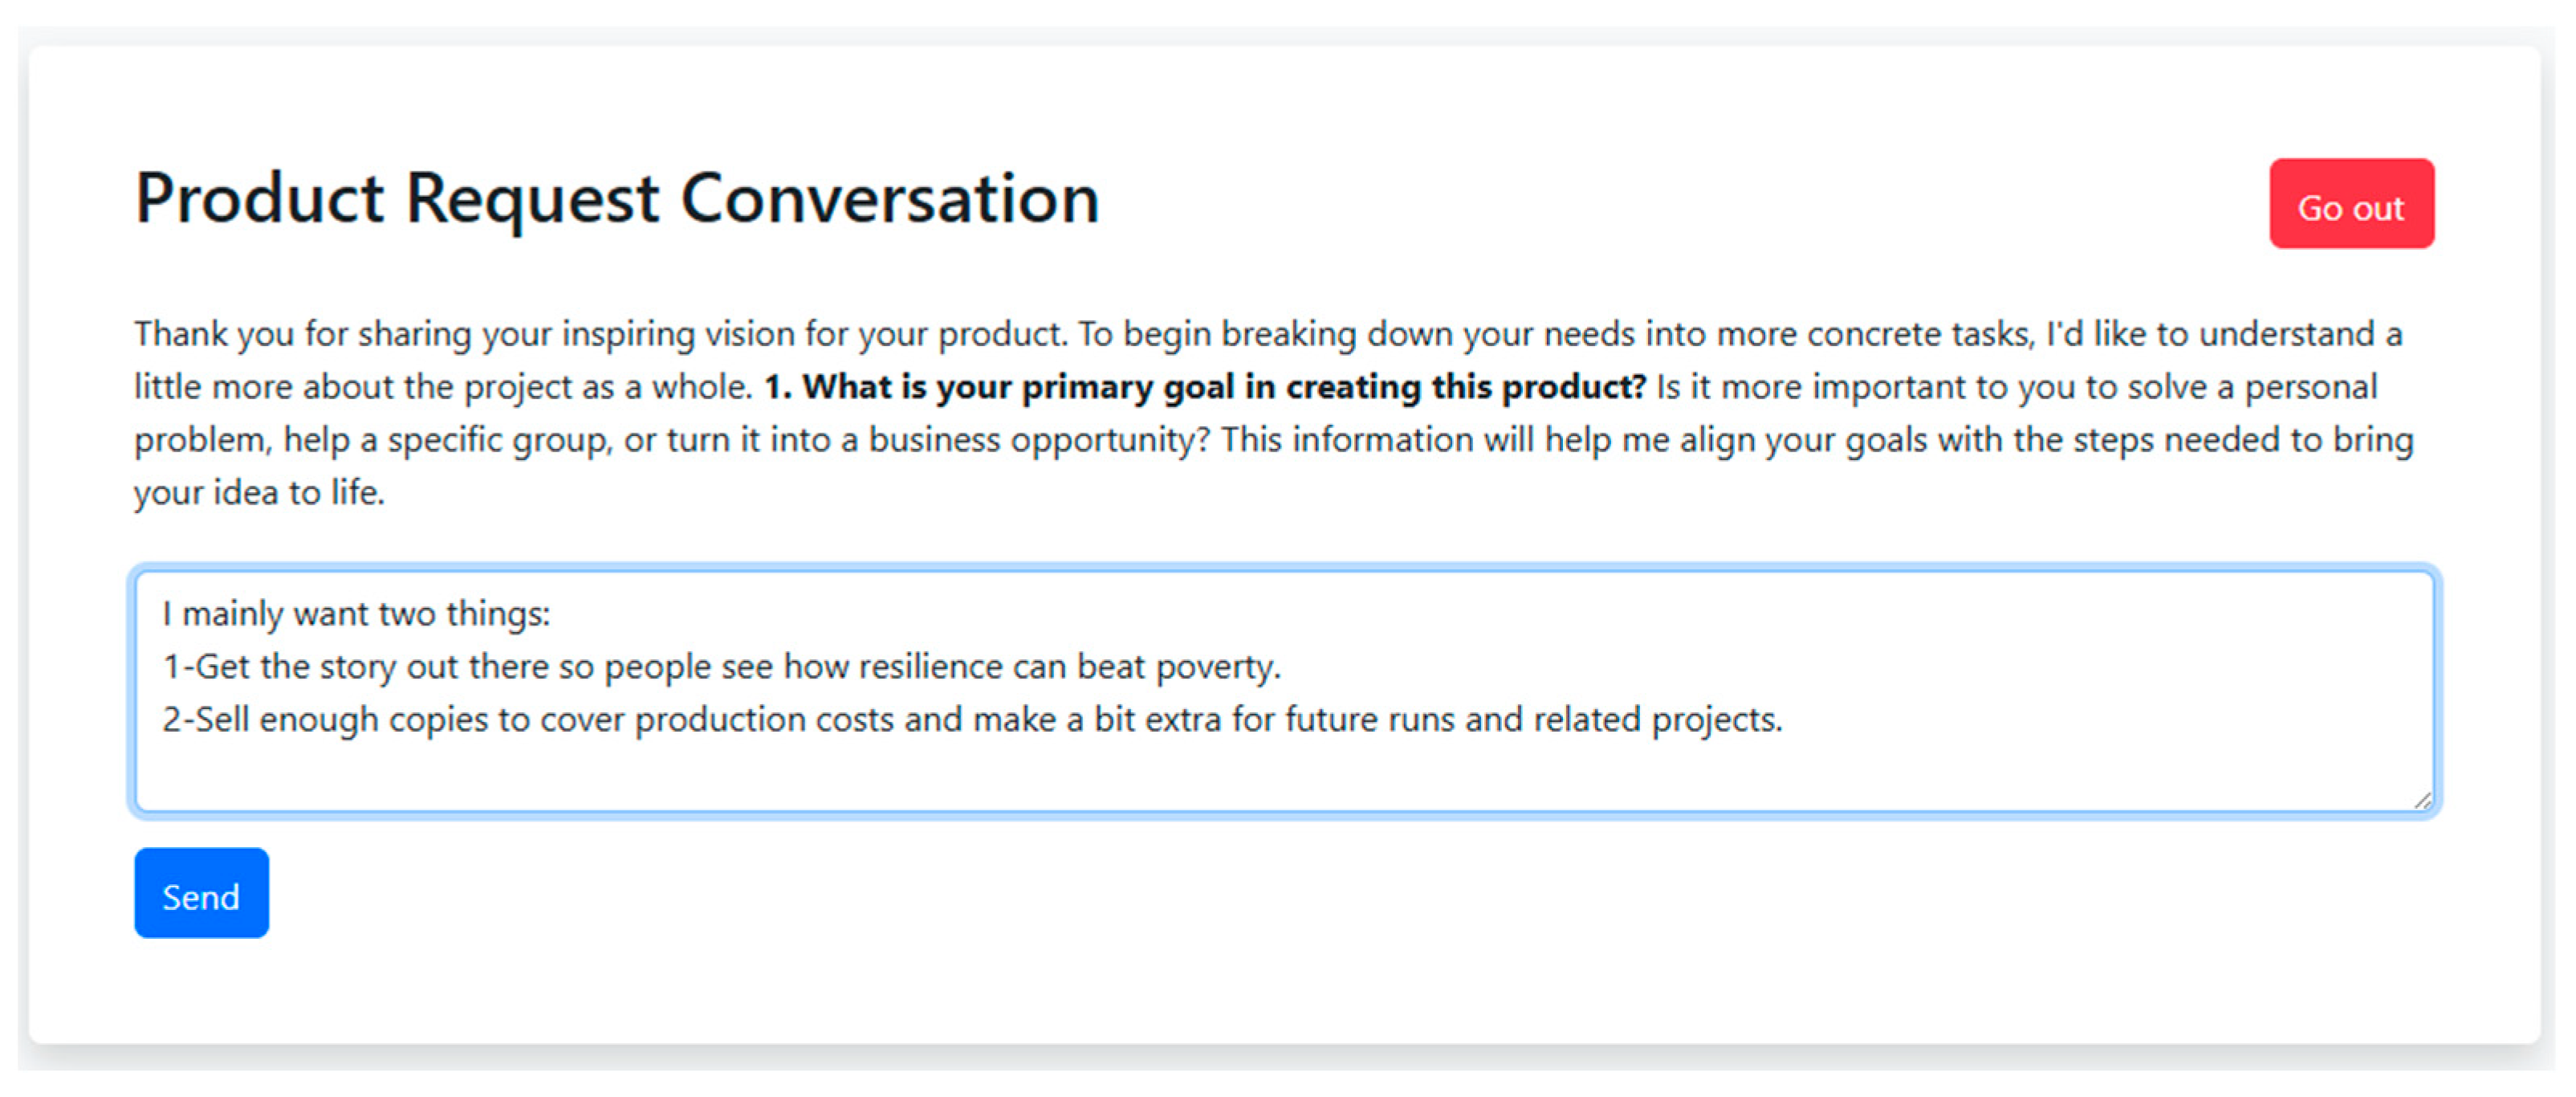
During AC1, the platform guides the client through a structured sequence of clarifying questions (See
Figure 6 and
Figure 7). The dialogue covers word-count, target launch date, print-run, budget, preferred partner size, and intended readership. Once the requirement set is consistent, the consolidated specification is forwarded to the relevant partners, who are then prompted to confirm their acceptance of the proposed scope and constraints. All question–answer exchanges produced in this interaction are synthesized in
Table 7.
7.2. Requirement Definition and Product Classification
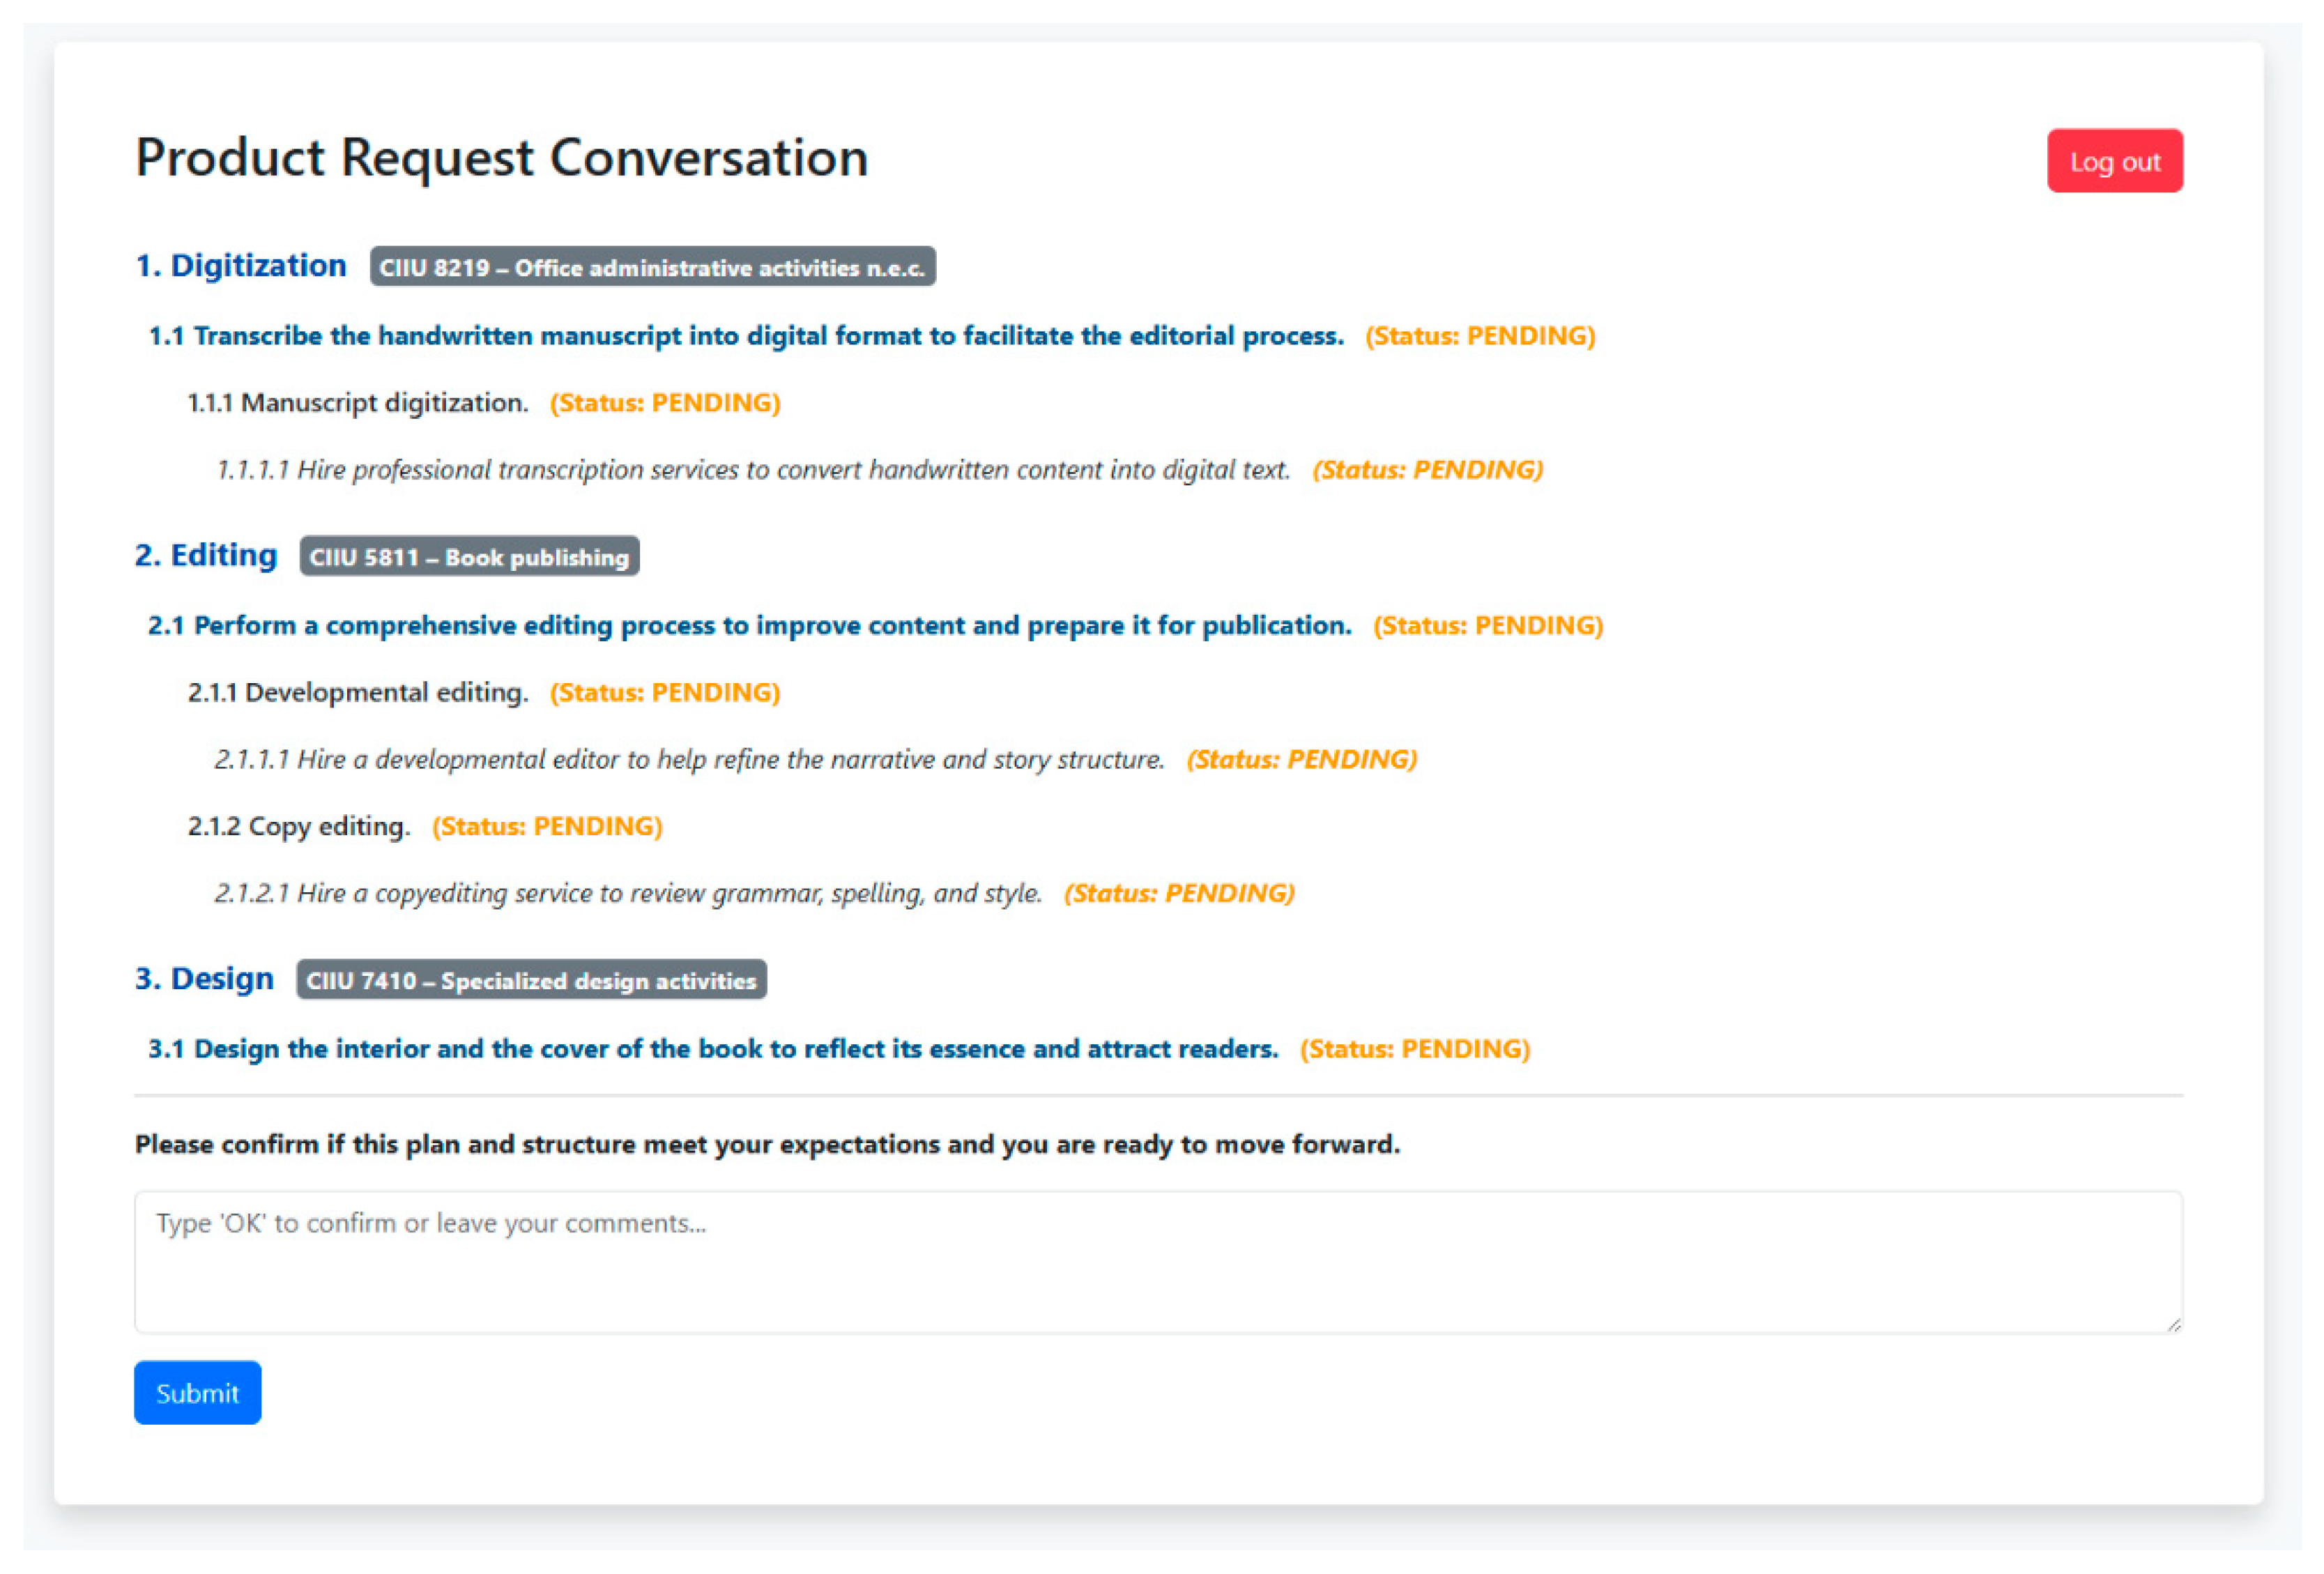
The interface presents the outcome of AC1: every data point validated by the client is consolidated in a single view. Just below, a validation card marked “Type ‘OK’ to confirm or leave your comment” signals that the user has approved the information. Each derived task—transcription, editing, layout, cover design, printing and distribution—appears at the bottom, mapped to its corresponding ISIC code, ensuring standardization for the upcoming AC2 cycle (See
Figure 8).
7.3. Candidate-Partner Offers Matched to Relevant Product Categories
Once AC2 has generated the work-packages, the platform queries its registry of partners and pushes each task only to suppliers whose registered ISIC codes match the service category (e.g., 7430 = transcription, 1811 = printing). Every recipient sees the package in a personal Supplier Dashboard where they can:
Open the full task brief,
Decide whether to submit a price-and-schedule offer, or
Decline with a single click.
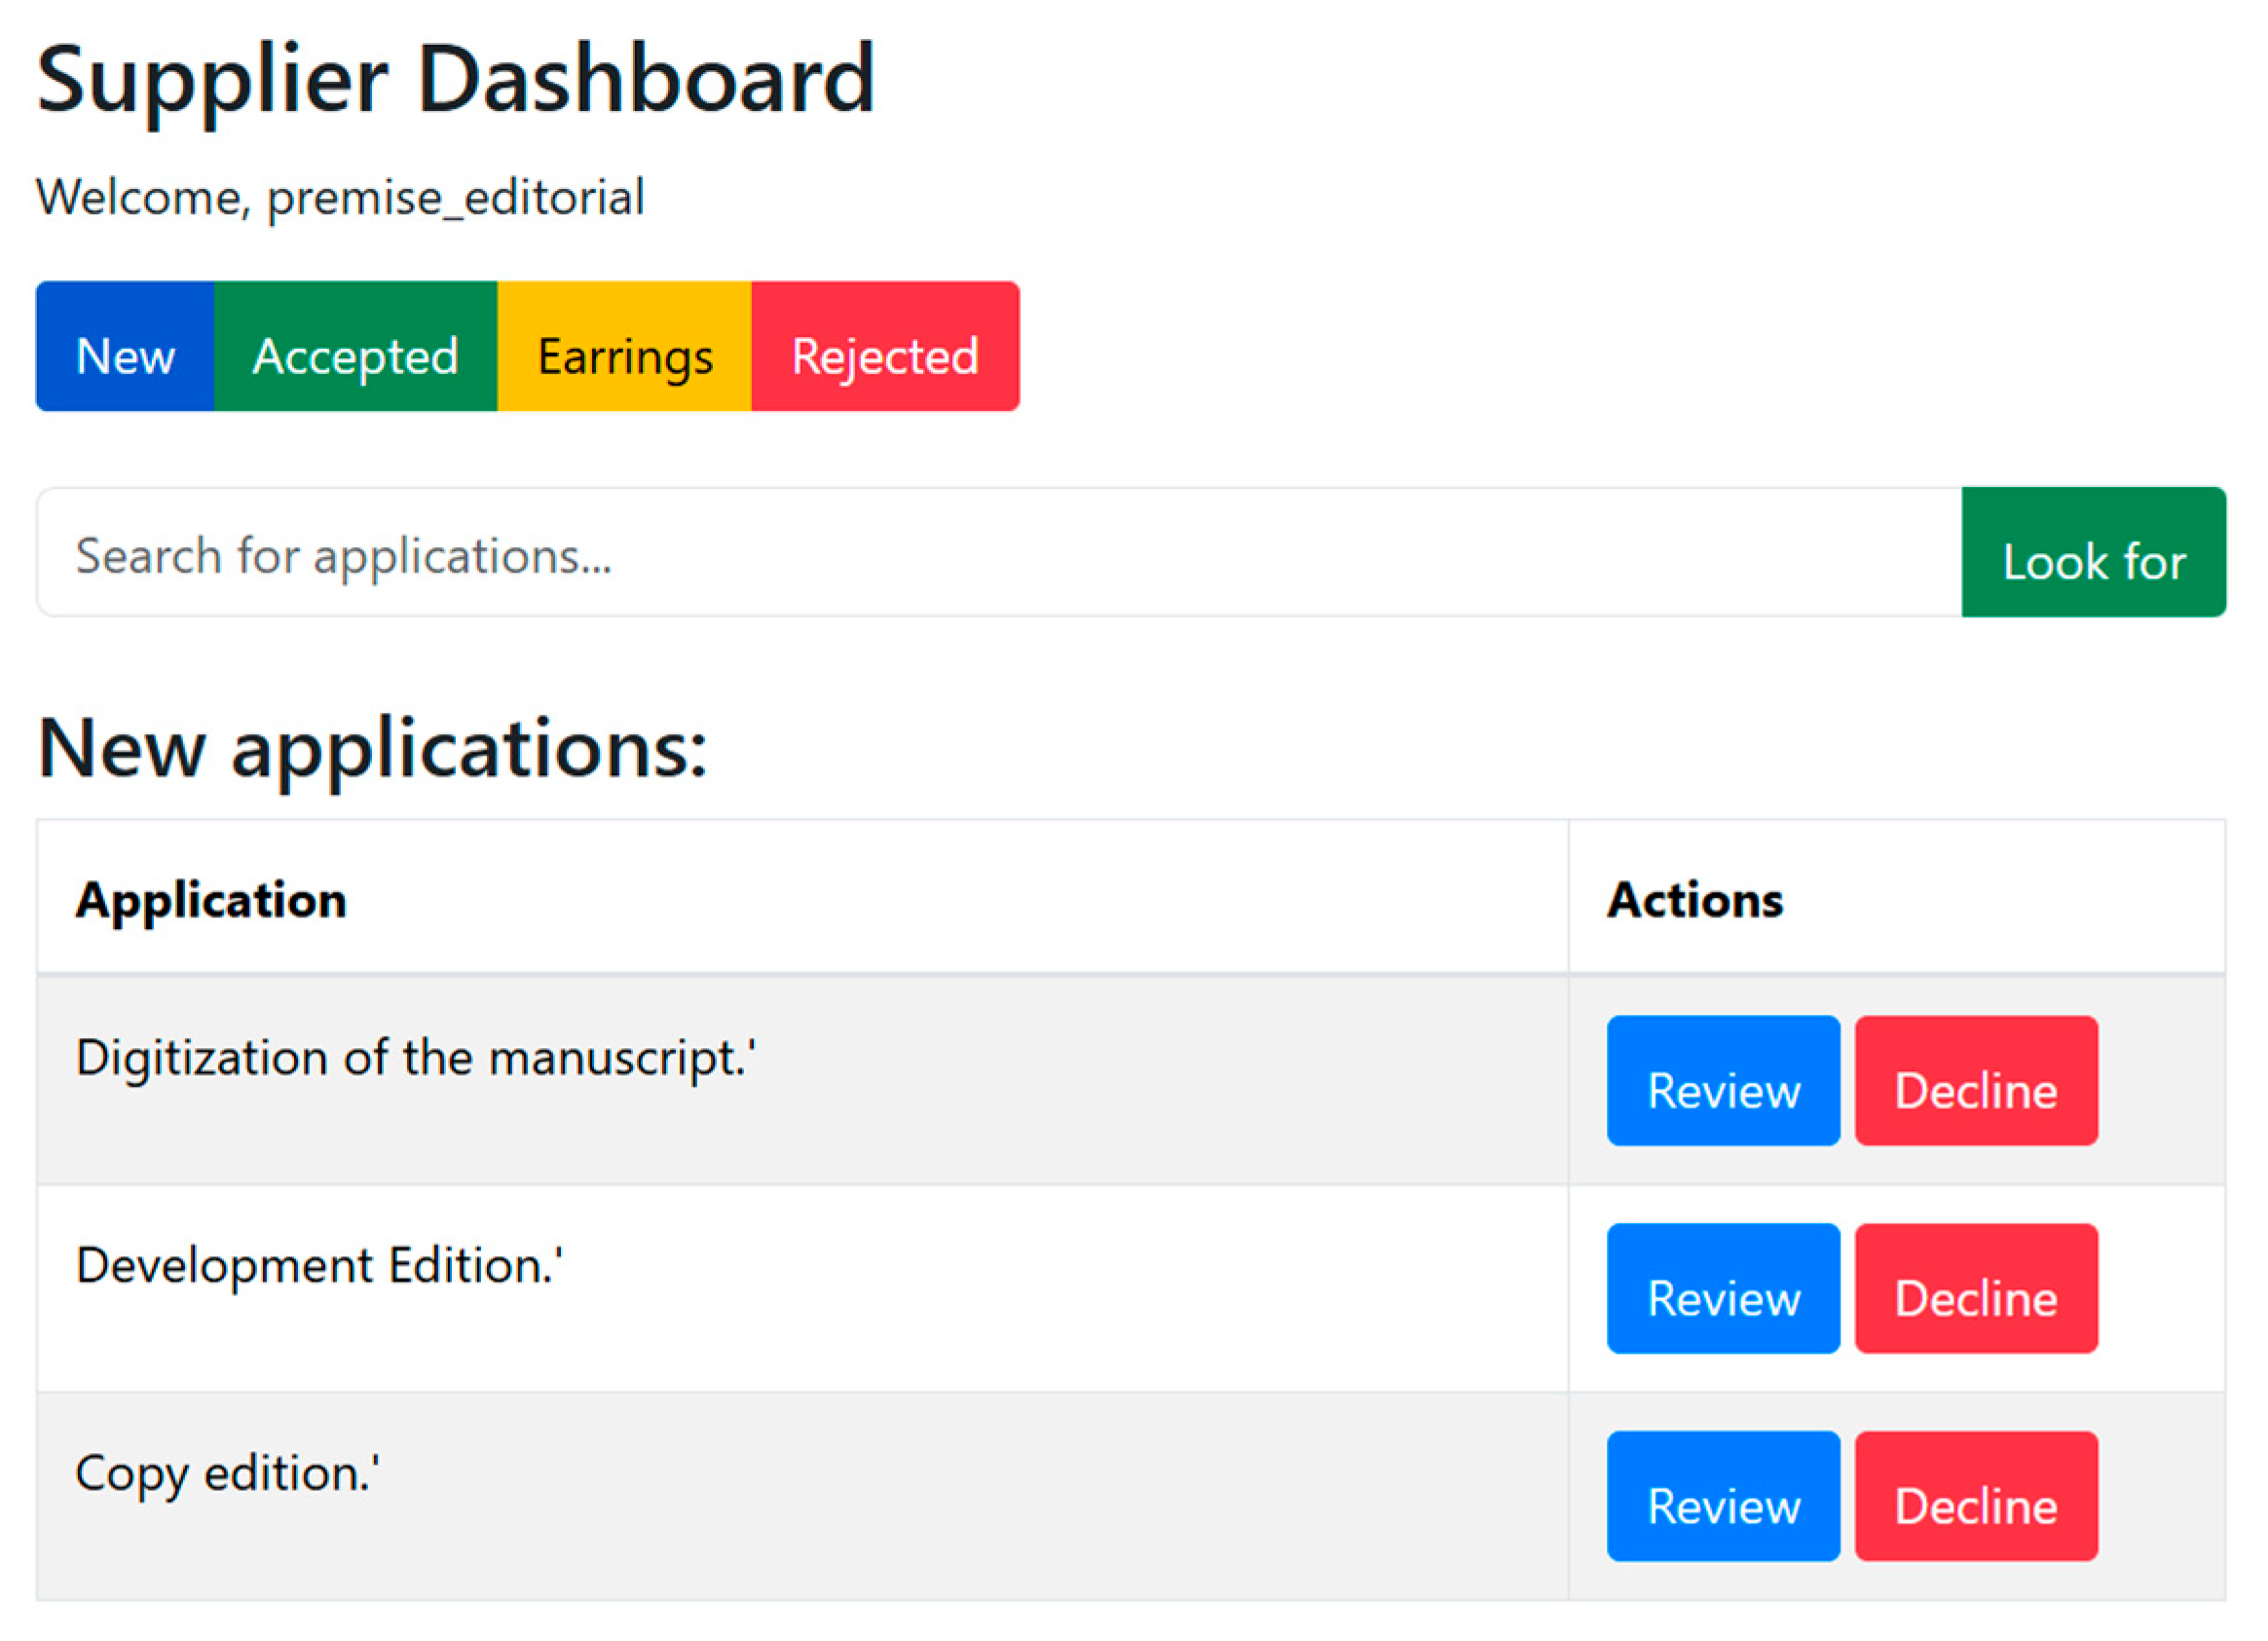
Figure 9 corresponds to the supplier “editorial_premise”. Because this partner’s filters are set to New, the centre panel titled “New applications” would list any fresh requests that match its codes. In this instance, the table is empty and shows the placeholder text “There are no new requests at this time”. Across the top, coloured buttons (New (blue), Accepted (green), Earnings (yellow), Rejected (red)) let the supplier switch views, while the search bar enables look-ups by request ID or keyword.
Figure 10 illustrates the supplier’s decision point once a task has been dispatched. At the right edge of the dashboard row, two colour-coded buttons convey the available actions. The blue button, labelled “View Brief”, opens a read-only modal that displays the full project description—so the partner can evaluate scope without risk of altering any data. Adjacent to it, the green button, “Make Offer”, triggers a concise form in which the supplier inputs a price quotation and earliest delivery date before clicking “Send Offer” to submit or closing the window to decline.
7.4. Designer Profile Registration
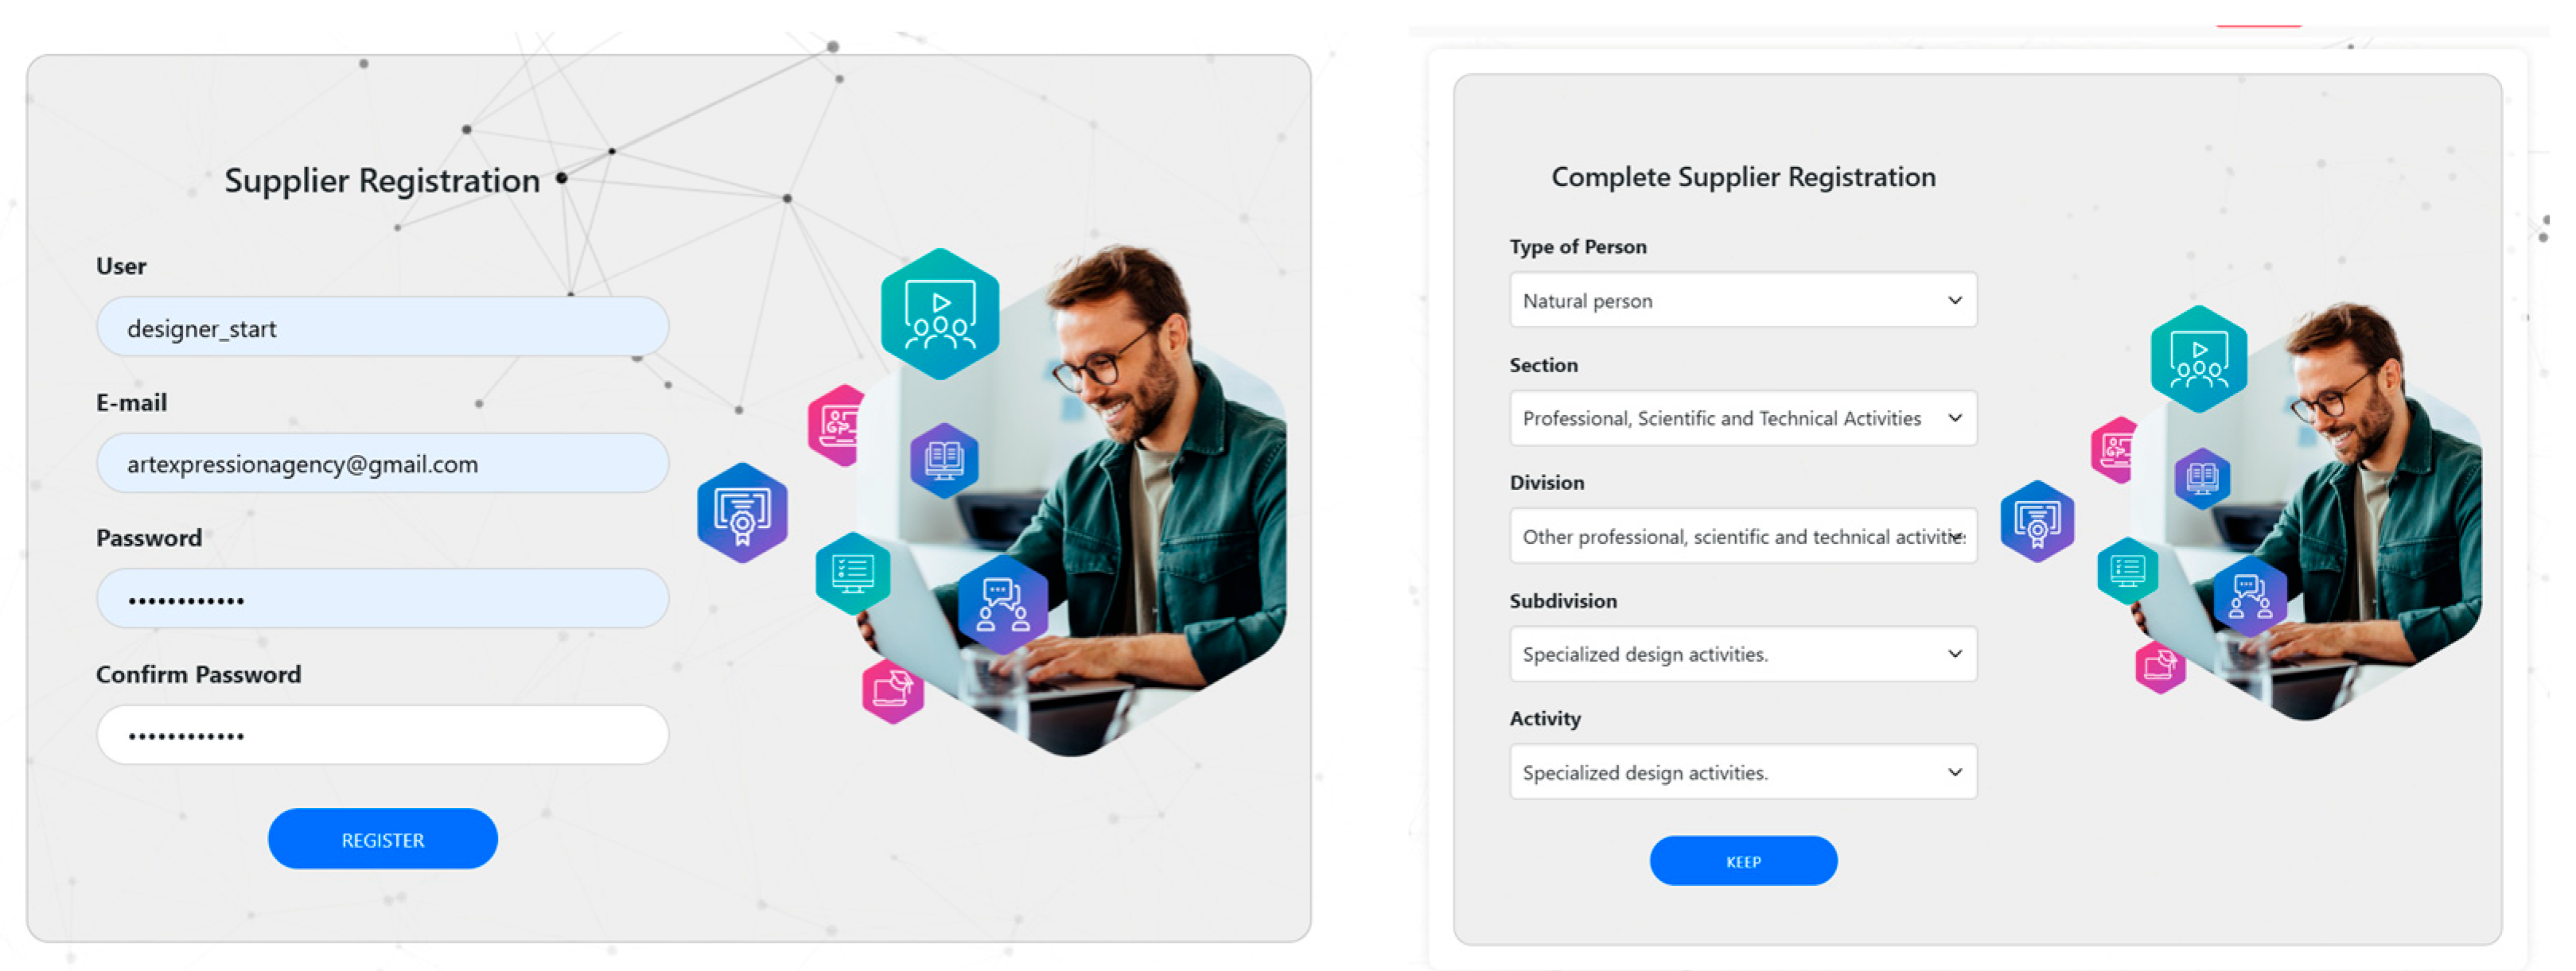
Figure 11 displays a registration form for a Designer Profile, categorized under Professional, Scientific, and Technical Activities. Below is a structured breakdown of the key details:
Type of Person: Natural Person (Individual, not a company).
Section: Professional, Scientific, and Technical Activities.
Classification (CIUU Codes)
Division: Other Professional, Scientific, and Technical Activities.
Subdivision: Specialized Design Activities.
Activity: Specialized Design Activities.
Purpose: This form is used to register a designer who provides specialized design services (e.g., graphic design, industrial design, fashion design, etc.). The CIUU code (International Standard Industrial Classification) helps categorize the exact nature of the professional activity for legal, tax, or administrative purposes.
7.5. Designer Supplier Dashboard
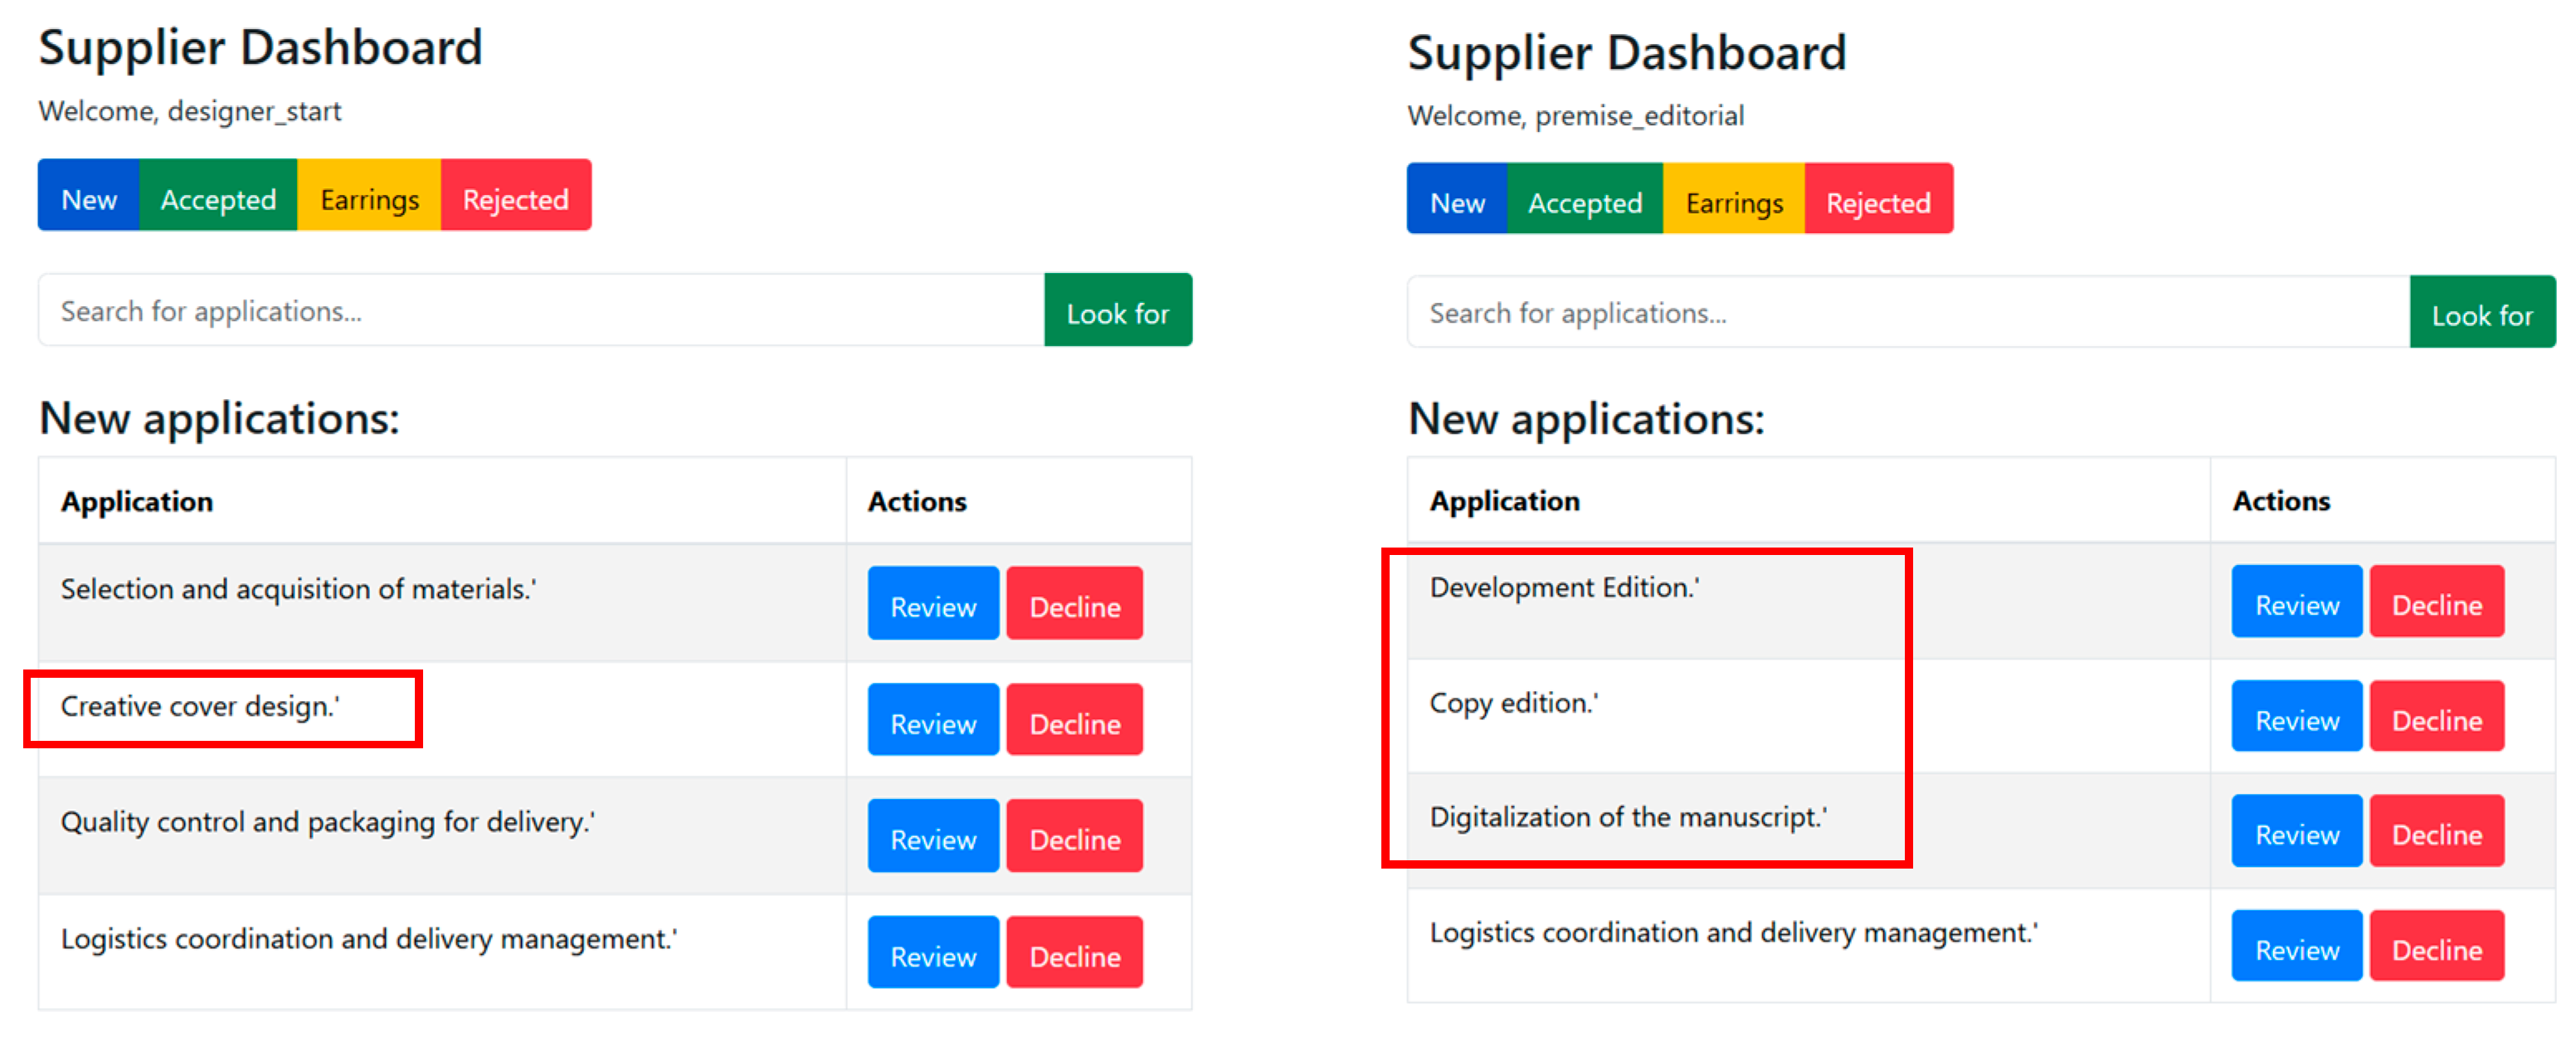
As shown in
Figure 12, the designer’s dashboard provides an organized overview of job opportunities tailored to their profile, featuring tabs for new, accepted, rejected, and earnings. The main section lists projects specifically aligned with their skills—such as cover design, illustrations, and text editing—each with options to
Review details or
Decline the offer. This intuitive interface allows designers to efficiently manage their workflow, ensuring they only receive relevant proposals while maintaining control over their projects and income.
7.6. Accepted Proposals
As shown in
Figure 13, the dashboards for “designer_start” and “premise_editorial” display accepted proposals after evaluation by the matching algorithm, which prioritizes small businesses and freelancers based on capability alignment, pricing, and timelines. Each dashboard lists approved projects—design or editorial work—and allows suppliers to review or decline tasks, promoting efficiency, inclusivity, and quality in the collaboration process.
7.7. Business Process Model (BPM)
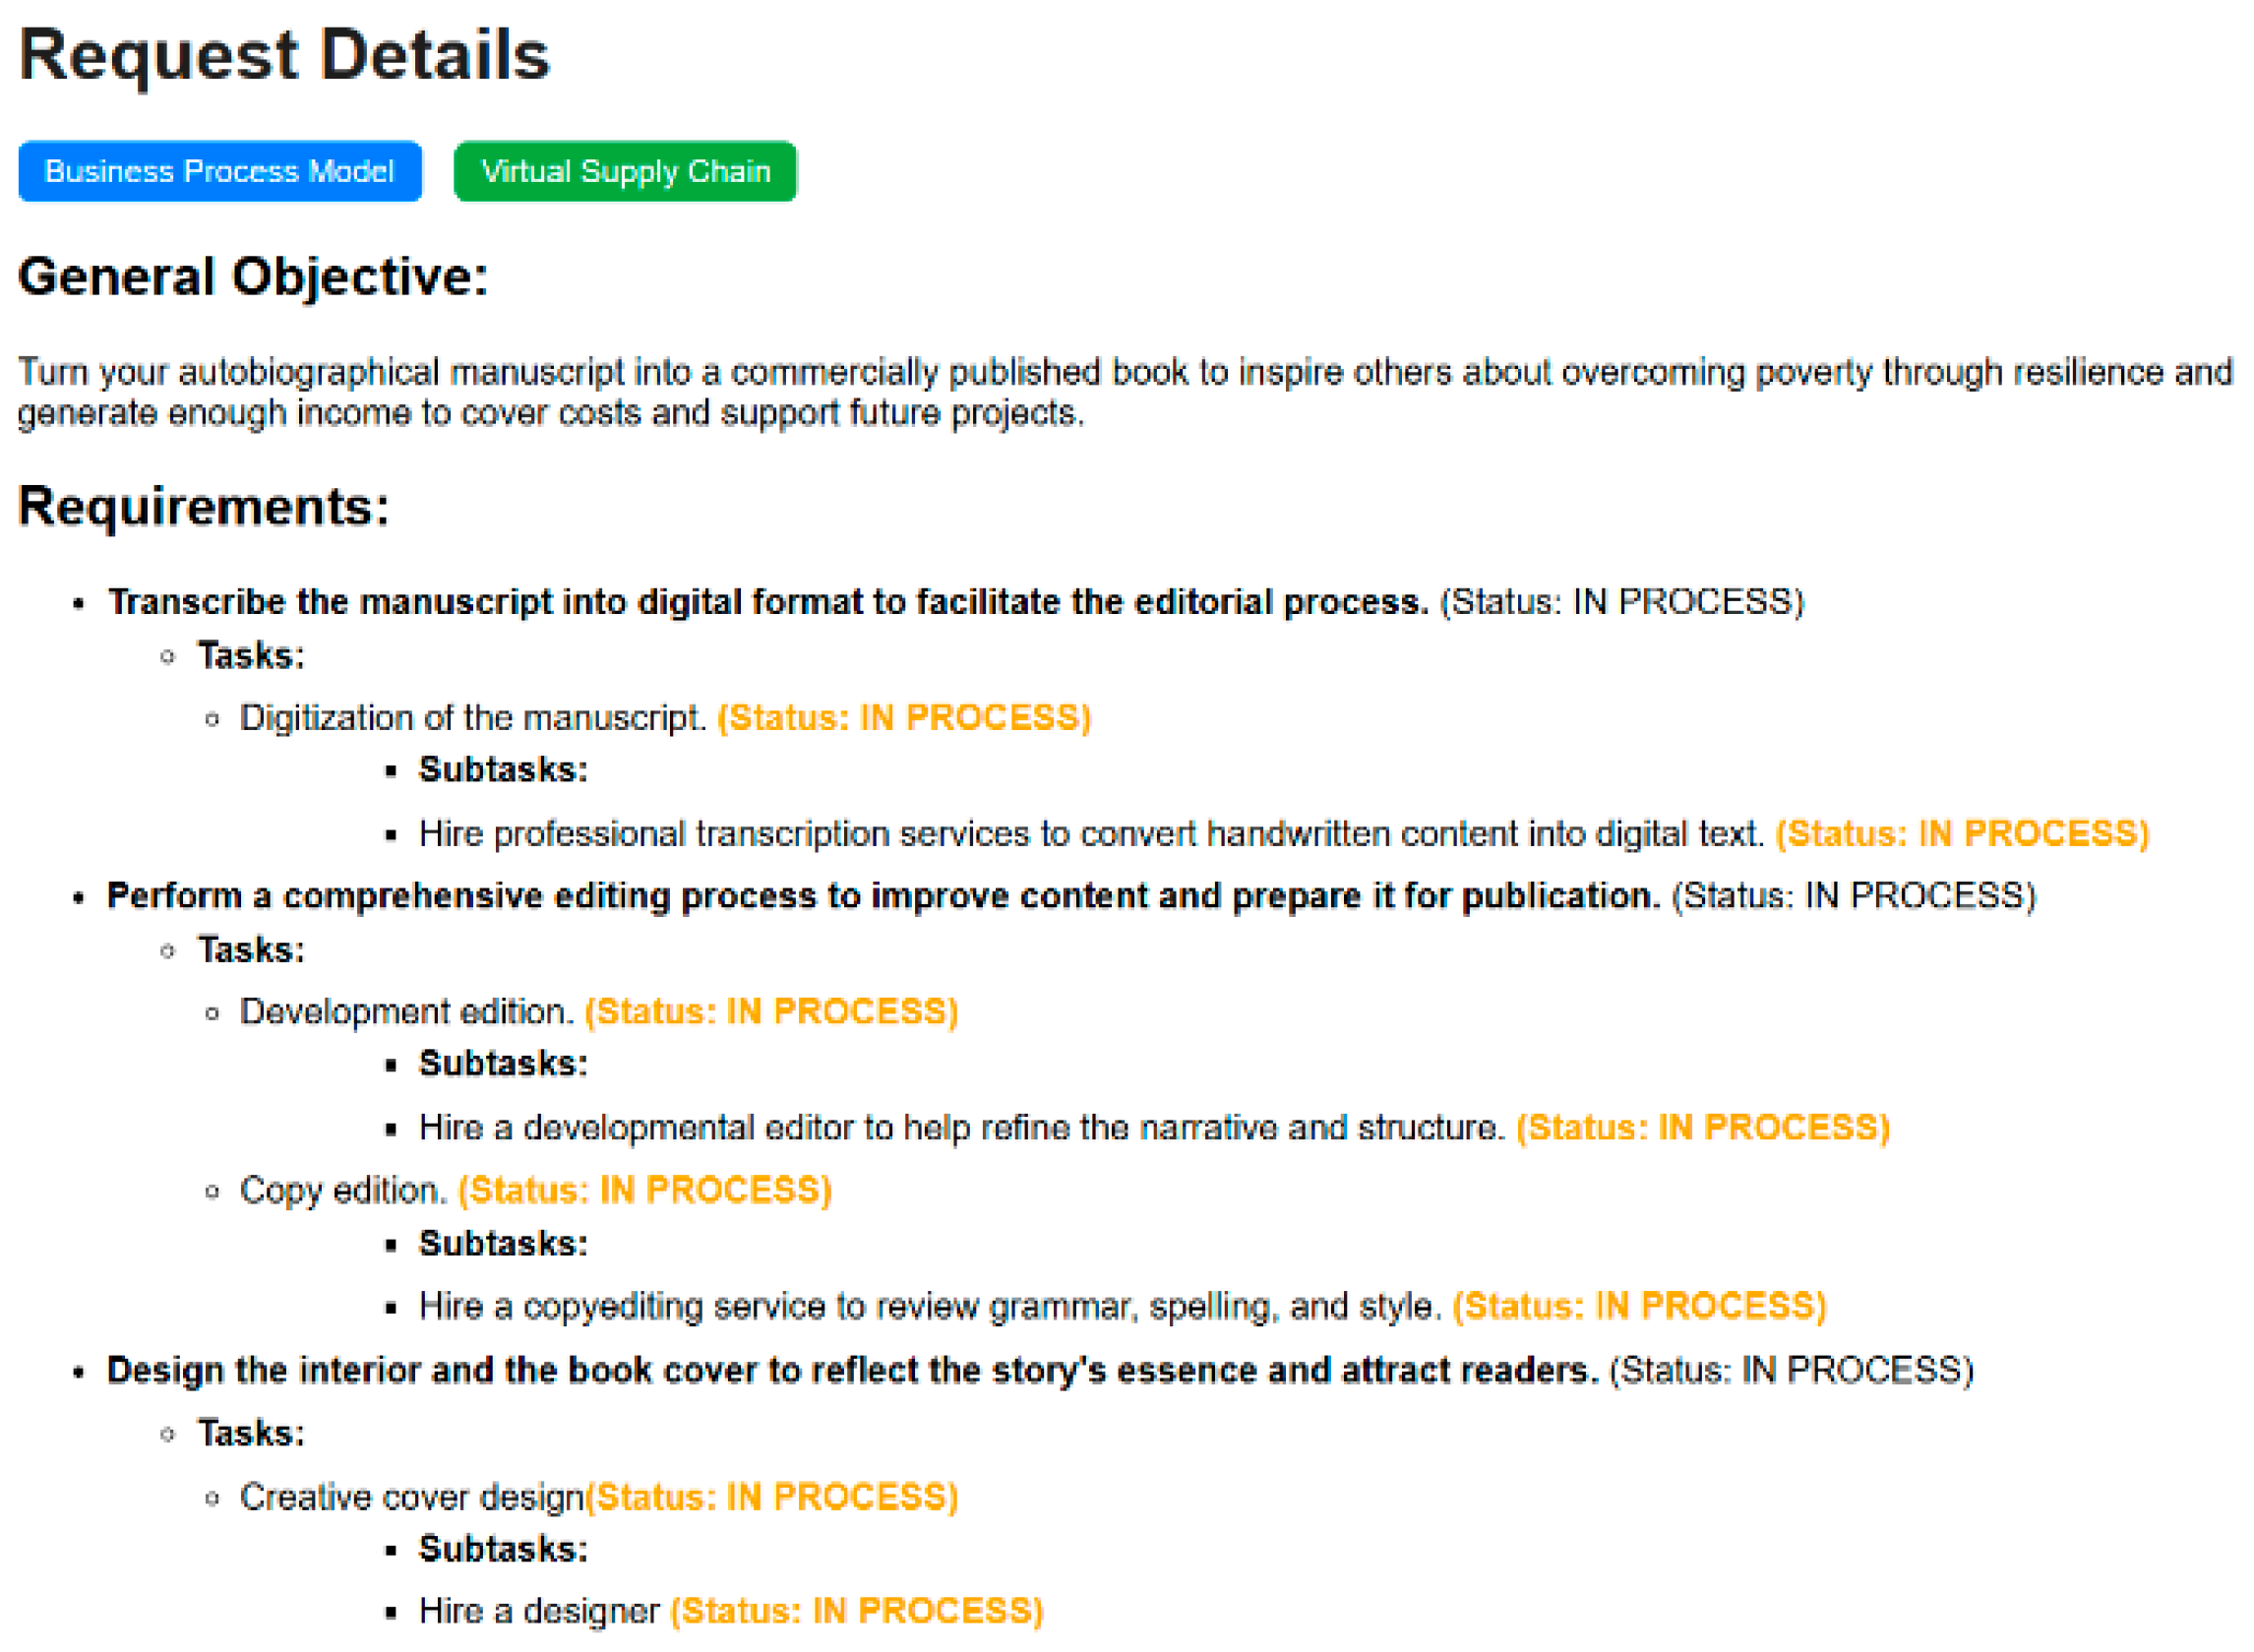
Figure 14 depicts the requirements status and details that become available once competitive bidding has concluded and each task has been awarded to the highest-ranked supplier. To the left of the screen, a dark-blue button labelled “Business Process Model” provides immediate access to the underlying Business-Process-Management diagram.
The
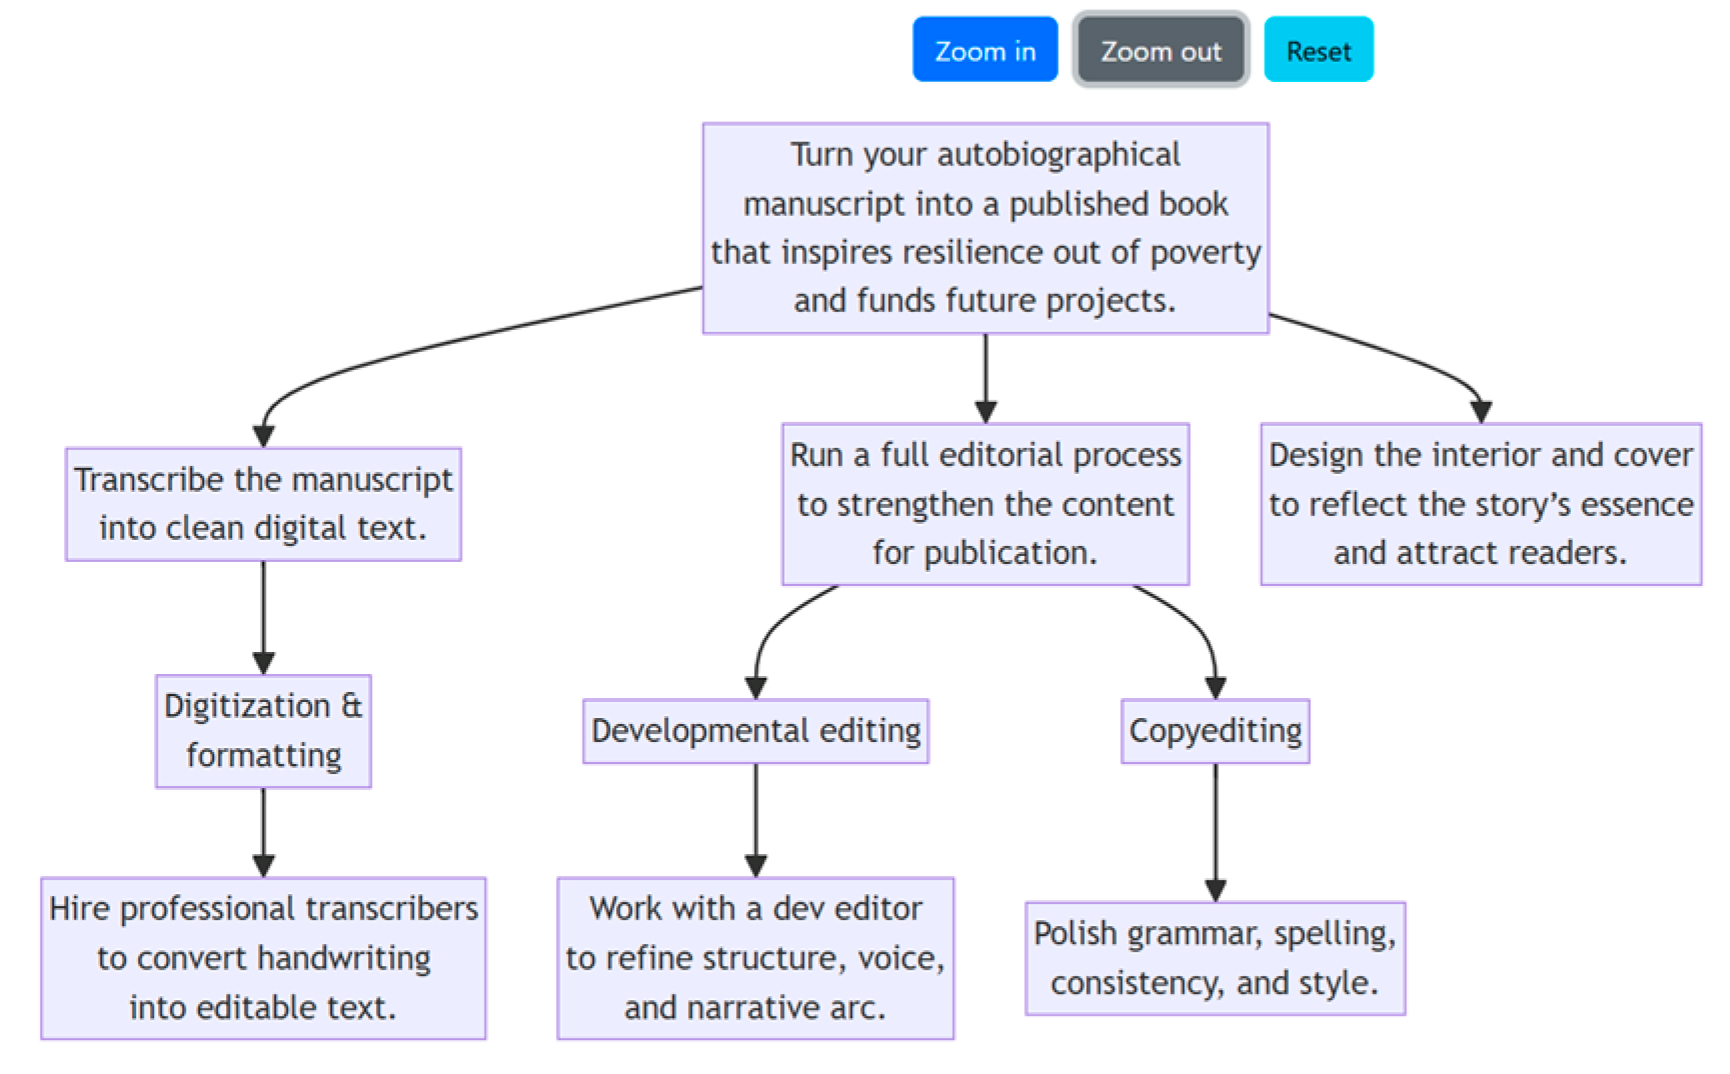
BPM shown in
Figure 15 offers a structured sequence of actions involved in turning an autobiographical manuscript into a professionally published book. Organized in a hierarchical format, the model reflects the logical progression from general objectives to specific tasks and subtasks, allowing for a clear understanding of how each component contributes to the overall editorial process. By mapping the relationships and dependencies between activities, the BPM facilitates both planning and analysis of the workflow, ensuring coherence and efficiency throughout each stage of development.
7.8. Virtual Supply Chain
The “Virtual Supply Chain Overview” (see
Figure 16) interface presents a structured summary of the key editorial tasks required to transform an autobiographical manuscript into a professionally published book. It includes a tabular layout displaying the assigned providers, offer prices, estimated delivery times, and the sequential development order for each task. The model highlights four main activities—manuscript digitization, developmental editing, copy editing, and creative cover design—each linked to specific suppliers such as
Premisa Editorial and
Designer Start.
8. Prototype Evaluation and Analysis
8.1. Evaluation Objectives
Several objectives were established for the prototype validation process, as outlined below:
- 1.
EO1 Performance Verification: Confirm that core services deliver responses fast enough to maintain a smooth, interactive user experience under routine traffic levels.
- 2.
EO2 Architectural Scalability: Demonstrate that the system can expand elastically as the volume of concurrent requests grows, while preserving user-perceived responsiveness.
- 3.
EO3 Resource-Use Efficiency: Establish that CPU, memory, and network resources are consumed proportionally to load, avoiding both over-provisioning and saturation.
- 4.
EO4 Accessibility and SEO: Validate that the prototype complies with current accessibility and SEO guidelines.
- 5.
EO5: Requirement and Partner-Selection Accuracy: The objective is to verify the accuracy of both requirement processing and partner selection.
8.2. Methodological Approach for Prototype Evaluation
Before the evaluation process was initiated, four well-established architectural assessment methods were compared to identify the one most suitable for the current development stage—an evolving prototype that operates end-to-end but does not yet encompass all business scenarios. The short list included ATAM, SAAM, ISO/IEC 25010 [
36] combined with off-the-shelf metrics, and the Goal–Question–Metric (GQM) approach. Each method was evaluated against five decision criteria: alignment with goals, suitability for an incomplete prototype, capacity to produce quantitative results, cost and effort required, and traceability from metric to business objective (see
Table 8).
To make the choice objective, each qualitative label was converted to a numeric weight (High = 3, Medium = 2, Low = 1) and summed across the five decision criteria. GQM attains the highest aggregate score (13/15), outperforming ATAM and SAAM (10) and ISO 25010 (9).
What the comparison tells us:
ATAM and SAAM are excellent for uncovering architectural trade-offs, but their workshop-heavy format assumes the whole system is already mapped out; that would slow us down right now.
ISO/IEC 25010 is recognized for offering a rich vocabulary of quality attributes; however, no built-in bridge is provided from those attributes to project-specific quantitative measures. As a result, measurements could be conducted “for measurement’s sake.”
In the GQM approach, a business-oriented goal is first established, followed by the formulation of a concrete question, and finally, the definition of the metric that answers it. Through this approach, the relevance of each data point is maintained, only the already implemented services are instrumented, and figures that can be clearly justified to stakeholders are obtained. Given the limited time-box and the fact that the prototype is functional but still incomplete, GQM is considered to offer the best balance of focus, effort, and explanatory power. Therefore, the following actions are planned:
8.3. Metrics, KPIs and Thresholds
The evaluation of the prototype was structured using the GQM approach. Each objective is associated with a specific evaluation question, a selected metric, and a defined threshold for success (See
Table 9):
EO1: The objective is to verify the performance of core services, specifically registration. The evaluation question asks whether the system responds promptly under nominal load. The selected metrics are the 95th percentile response time (P95 Response Time) and the Largest Contentful Paint (LCP), with a threshold of LCP ≤ 2.5 s according to Google Web Vitals [
37]. Additionally, the system should handle a peak of at least 5 requests per second and maintain an error rate of no more than 1%.
EO2: The objective is to validate the scalability of the batch selection algorithm. The evaluation question focuses on whether the batch algorithm maintains acceptable execution times as the number of providers increases. The selected metric is the batch processing time for daily consolidation, with a threshold of 10 min or less for 10,000 providers [
38].
EO3: The objective is to assess resource-use efficiency. The evaluation question asks if CPU and memory consumption are proportional to the load. The selected metrics are CPU and memory utilization during peak operations, with thresholds of CPU utilization at or below 60% and memory utilization at or below 70% [
39].
EO4: The objective is to validate that the prototype complies with current accessibility and SEO guidelines. The evaluation question asks if the prototype meets these standards. The selected metric is the accessibility and SEO score, with a threshold of at least 90% [
37].
EO5: The objective is to confirm that the system correctly processes user or partner requirements and accurately selects providers according to business rules and CIUUP categories. The metrics considered are: (i)
Requirement-Processing Accuracy—ratio of correctly processed requests to total requests (≥95% without logical or validation errors) [
40], and (ii)
Matching Accuracy—ratio of correct matches to expected matches in provider selection (≥90%) [
41].
These objectives and criteria ensure that the system is evaluated comprehensively for performance, scalability, efficiency, accuracy, and compliance with best practices.
Below, each validation performed is described based on
Table 9.
8.4. Verify the Performance of the Web Prototype—EO1
To answer the evaluation question,
“Does the system respond promptly under nominal load?”: Performance and scalability tests were conducted using the K6 performance testing application [
42], simulating up to 20 virtual users over a 1-min period. The test duration and user count were chosen because they closely reflect realistic usage patterns for the user registration process; typically, completing the registration form takes about 1 min per user under normal conditions. By simulating 20 users over a 1-min period, the test accurately represents a scenario where multiple users are registering concurrently, as might occur during peak onboarding times. This approach ensures that the performance evaluation is both practical and relevant, focusing on the actual user experience during registration. Maintaining this duration and user count provides a reasonable and representative assessment of system behavior under expected load.
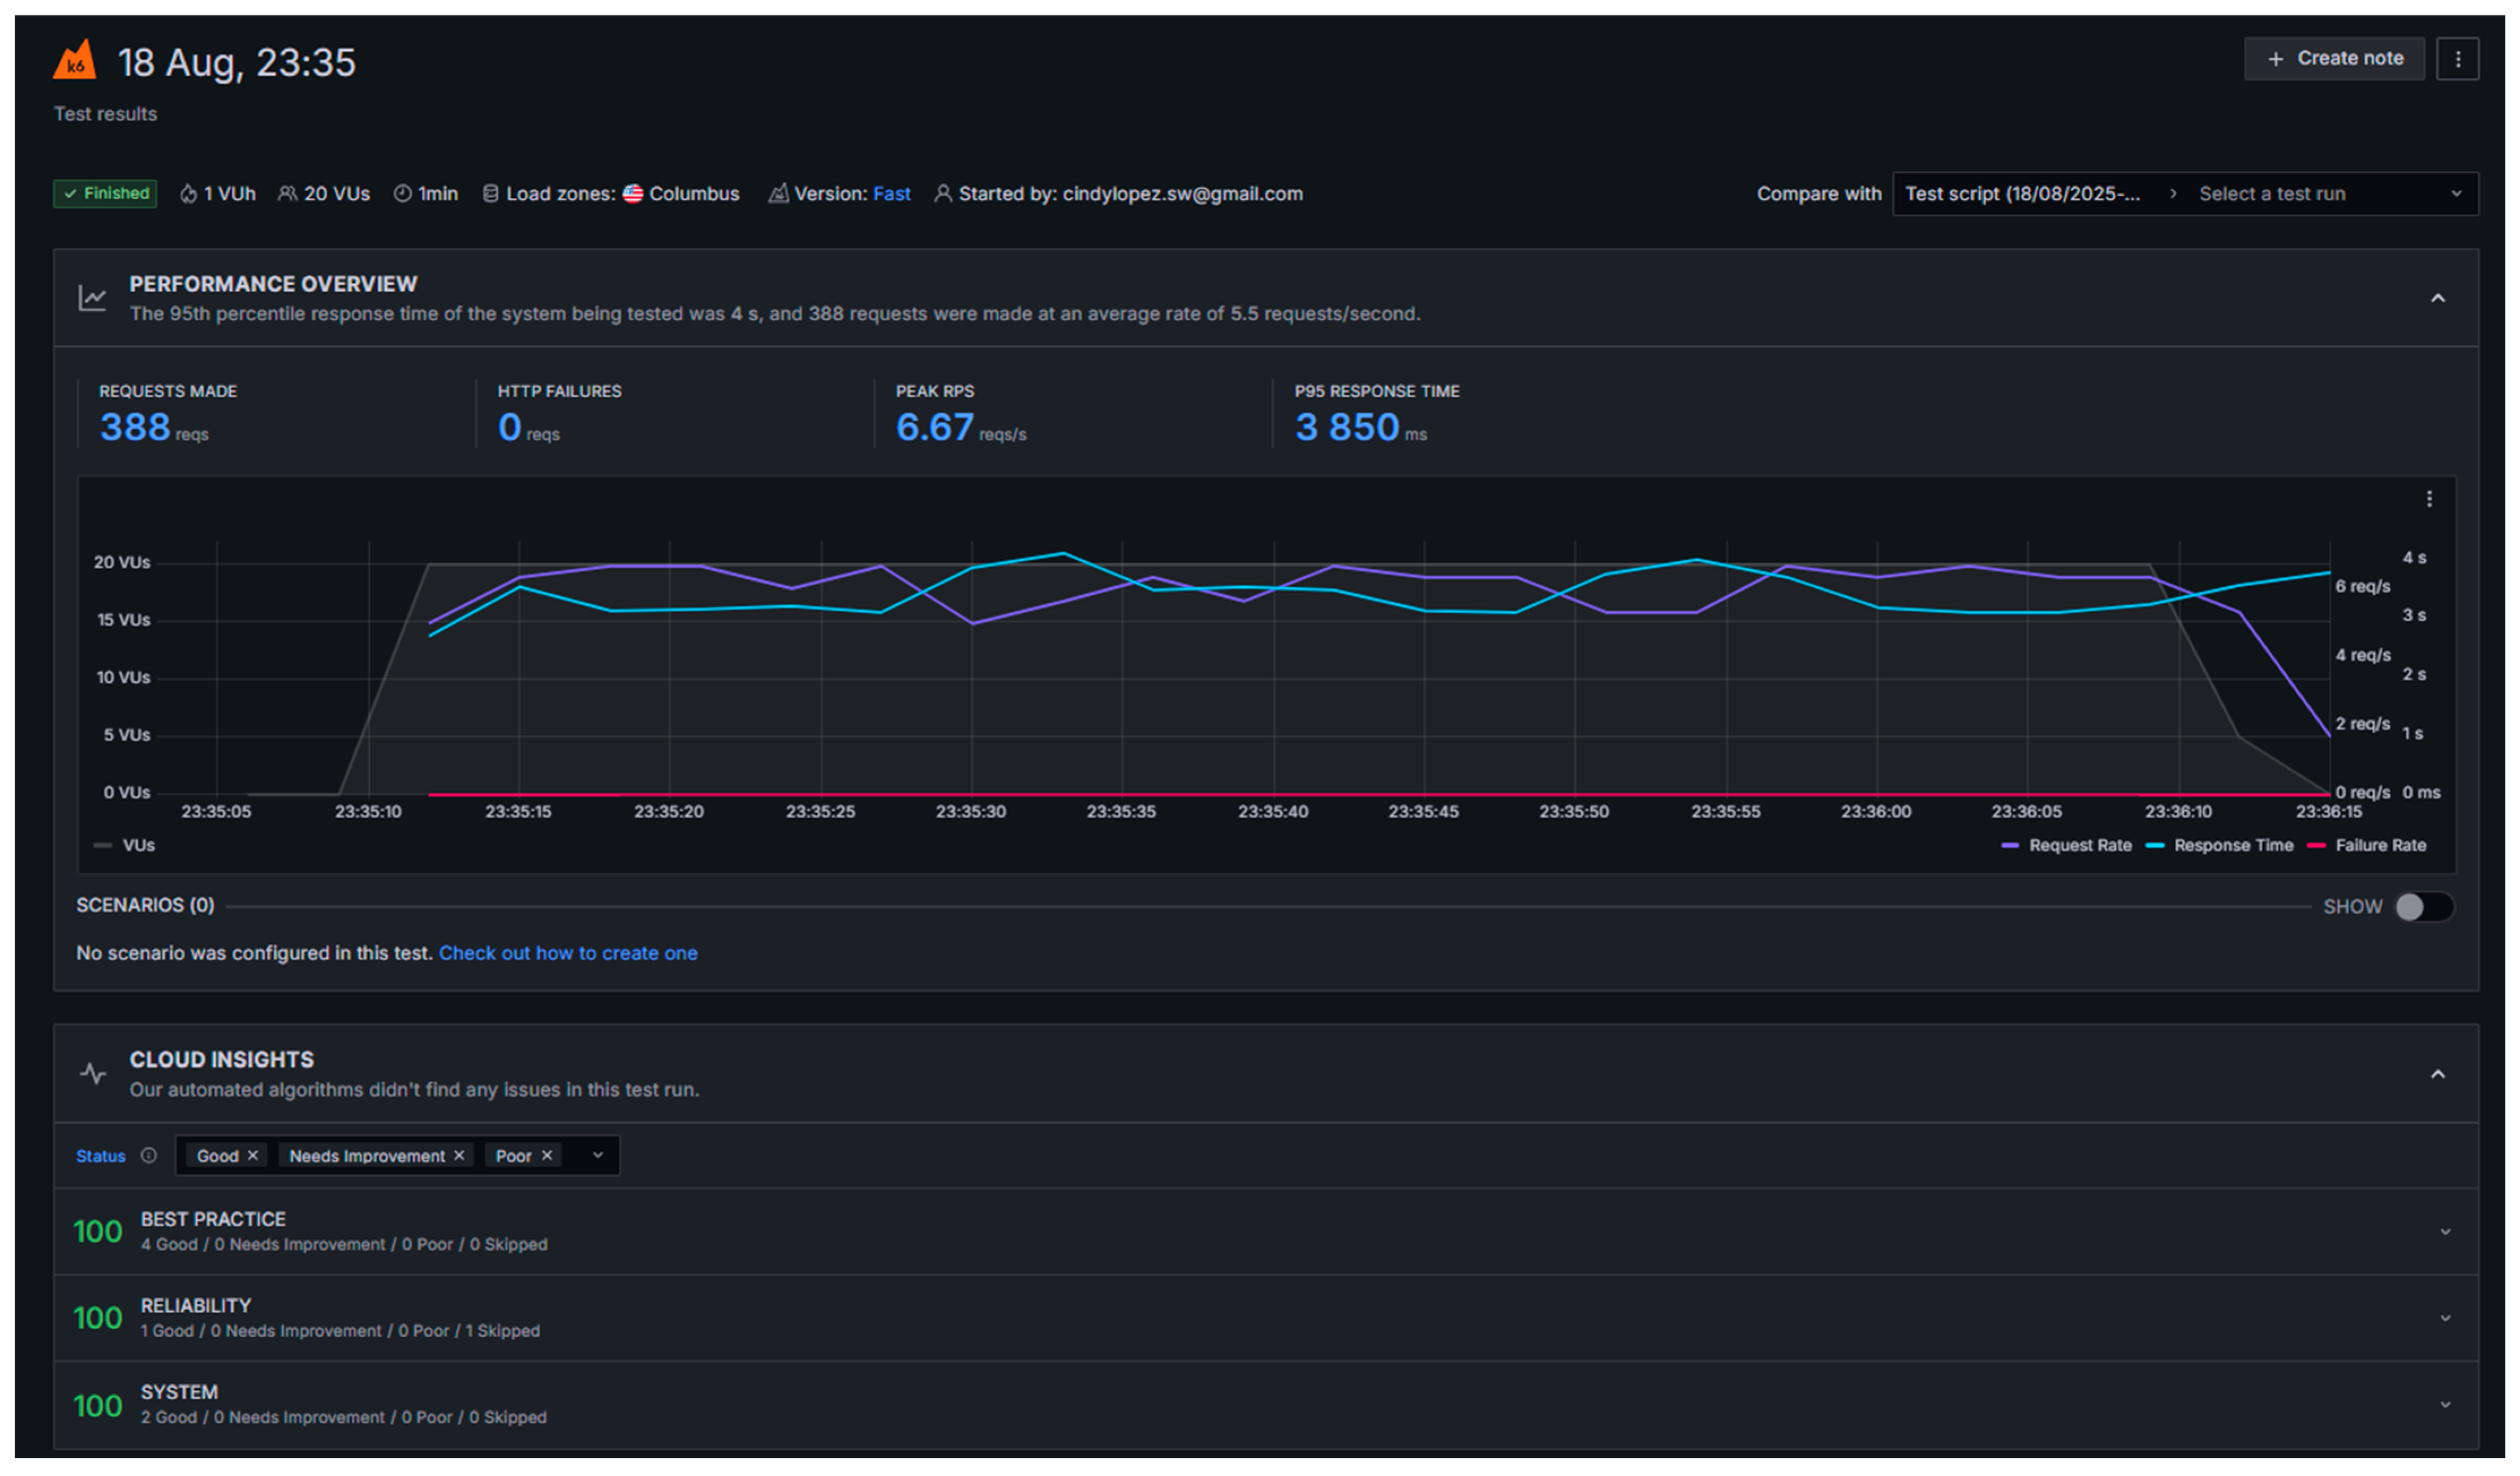
Throughout this test, zero errors were observed, which reflects a high level of system reliability. Additionally, the best practice and system metrics displayed in the test result graphs consistently reached 100, further supporting the robustness and stability of the prototype under the evaluated conditions (See
Figure 17).
It is also important to note that, as highlighted by Microsoft, response times in test and development environments are often slower than in production due to limited resources and non-optimized infrastructure, and should be interpreted accordingly [
43]. According to Google Web Vitals [
37], the industry-standard threshold for P95 response time is set at 2.5 s. In the prototype testing conducted with K6, a P95 response time ranging between 3850 and 4000 ms (approximately 4 s) was observed. While this is higher than the recommended standard, it is acceptable given that the prototype is running on a low-resource server intended for testing purposes (See
Table 10). For a production environment, allocating additional resources would be necessary to achieve the 2.5-s target (See
Figure 18).
8.5. Validate the Scalability of the Batch Selection Algorithm—EO2
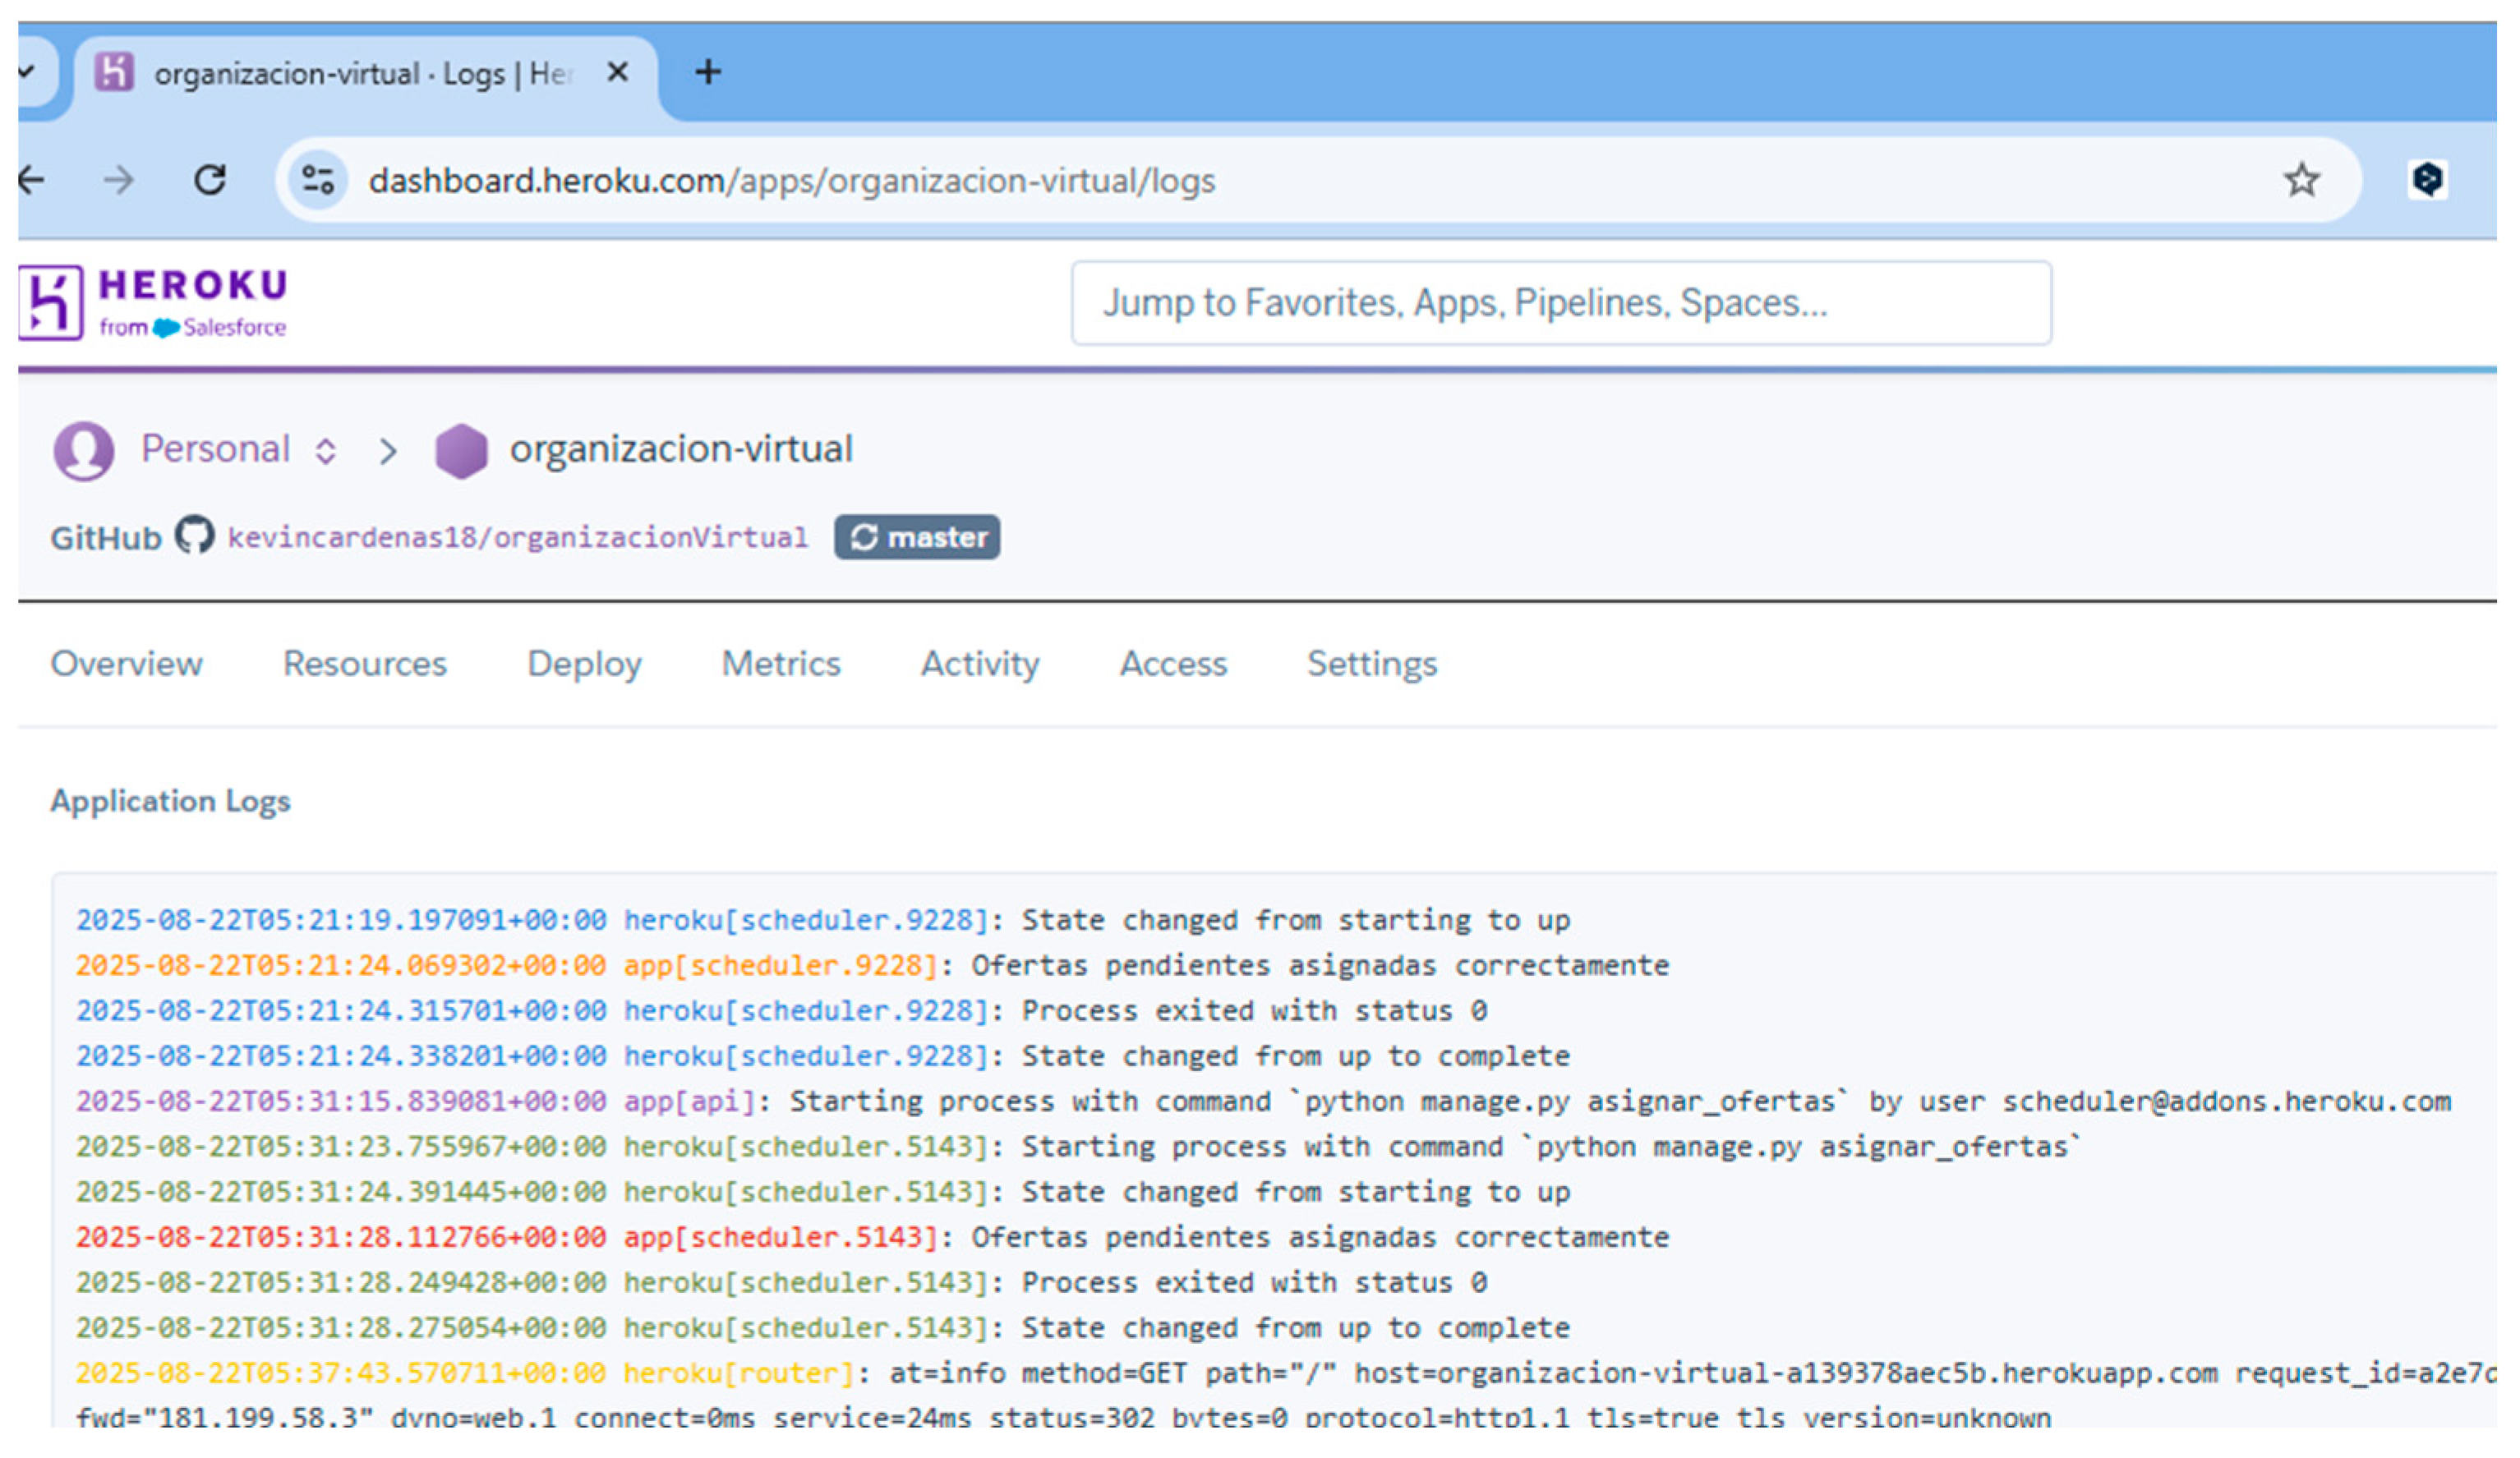
The initial analysis was based on Heroku logs that recorded the execution of the batch assignment process (See
Figure 19). Timestamps for the start and end of each batch process were obtained from the system logs, along with status codes indicating successful completion. Based on this information, the processing time for assigning offers to a limited number of providers was calculated, and the results were validated against the defined performance thresholds. To simulate the dispatch of offers to a substantially larger group of providers, Python 3.11.6 was used as the programming language. The simulation was executed with Python libraries such as
time, for measuring execution duration, and
random, for introducing small and realistic per-provider delays.
The simulation was designed to mimic the process of sending offers to 10,000 providers. For each provider, the code simulated a small processing delay to reflect real-world conditions. The loop iterated 10,000 times, each representing the sending of an offer to a single provider. The total time taken for the entire process was measured, and the success rate was calculated based on the number of successfully simulated sends. The simulation assumed that all sends were successful, as no errors were introduced in this scenario. The simulation showed that sending offers to 10,000 providers took approximately 3.79 s, with a success rate of 100%. This result demonstrates that the system, under simulated conditions, is capable of efficiently handling a large-scale batch assignment process within a short period of time (See
Table 11).
The results obtained from the simulation reveal a substantial performance margin when compared with the established threshold. While the expected threshold for processing 10,000 providers is ≤10 min [
28], simulation results derived from actual Heroku log data indicated that the batch assignment algorithm completed the task in approximately 3.8 s (See
Table 11). This result is orders of magnitude faster than the required limit, ensuring robust performance even as the number of providers increases.
8.6. Assess Resource-Use Efficiency—EO3
The resource-use efficiency of the prototype system was evaluated through the analysis of CPU utilization, memory consumption, throughput, and dyno load, as monitored via Heroku’s built-in tools. The assessment was conducted over a 24-h period, with the following thresholds established according to best practices [
39]: CPU utilization ≤ 60% and memory utilization ≤ 70% of the available quota.
The maximum observed memory usage was 117.5 MB, corresponding to 22.9% of the allocated 512 MB dyno quota. The average memory usage was 86.6 MB (16.9%), and the latest recorded value was 76.7 MB. These values are significantly below the 70% threshold, indicating efficient memory management and no risk of memory saturation under current operational conditions (See
Figure 20 and
Figure 21). CPU usage, as represented by the dyno load metric, remained at 0.00 throughout the monitoring period. This value is well below the established threshold of 60%, suggesting that the application is not CPU-bound and has ample processing headroom for additional load or concurrent operations.
No significant web traffic or throughput spikes were observed during the 24-h window. The system maintained stable operation without any indication of resource bottlenecks or performance degradation. All observed resource metrics (CPU, memory, and dyno load) are well within the recommended thresholds (See
Table 12). The system demonstrates efficient resource utilization and can handle the current workload with a substantial margin for increased demand.
8.7. Validate That the Prototype Complies with Current Accessibility and SEO Guidelines EO4
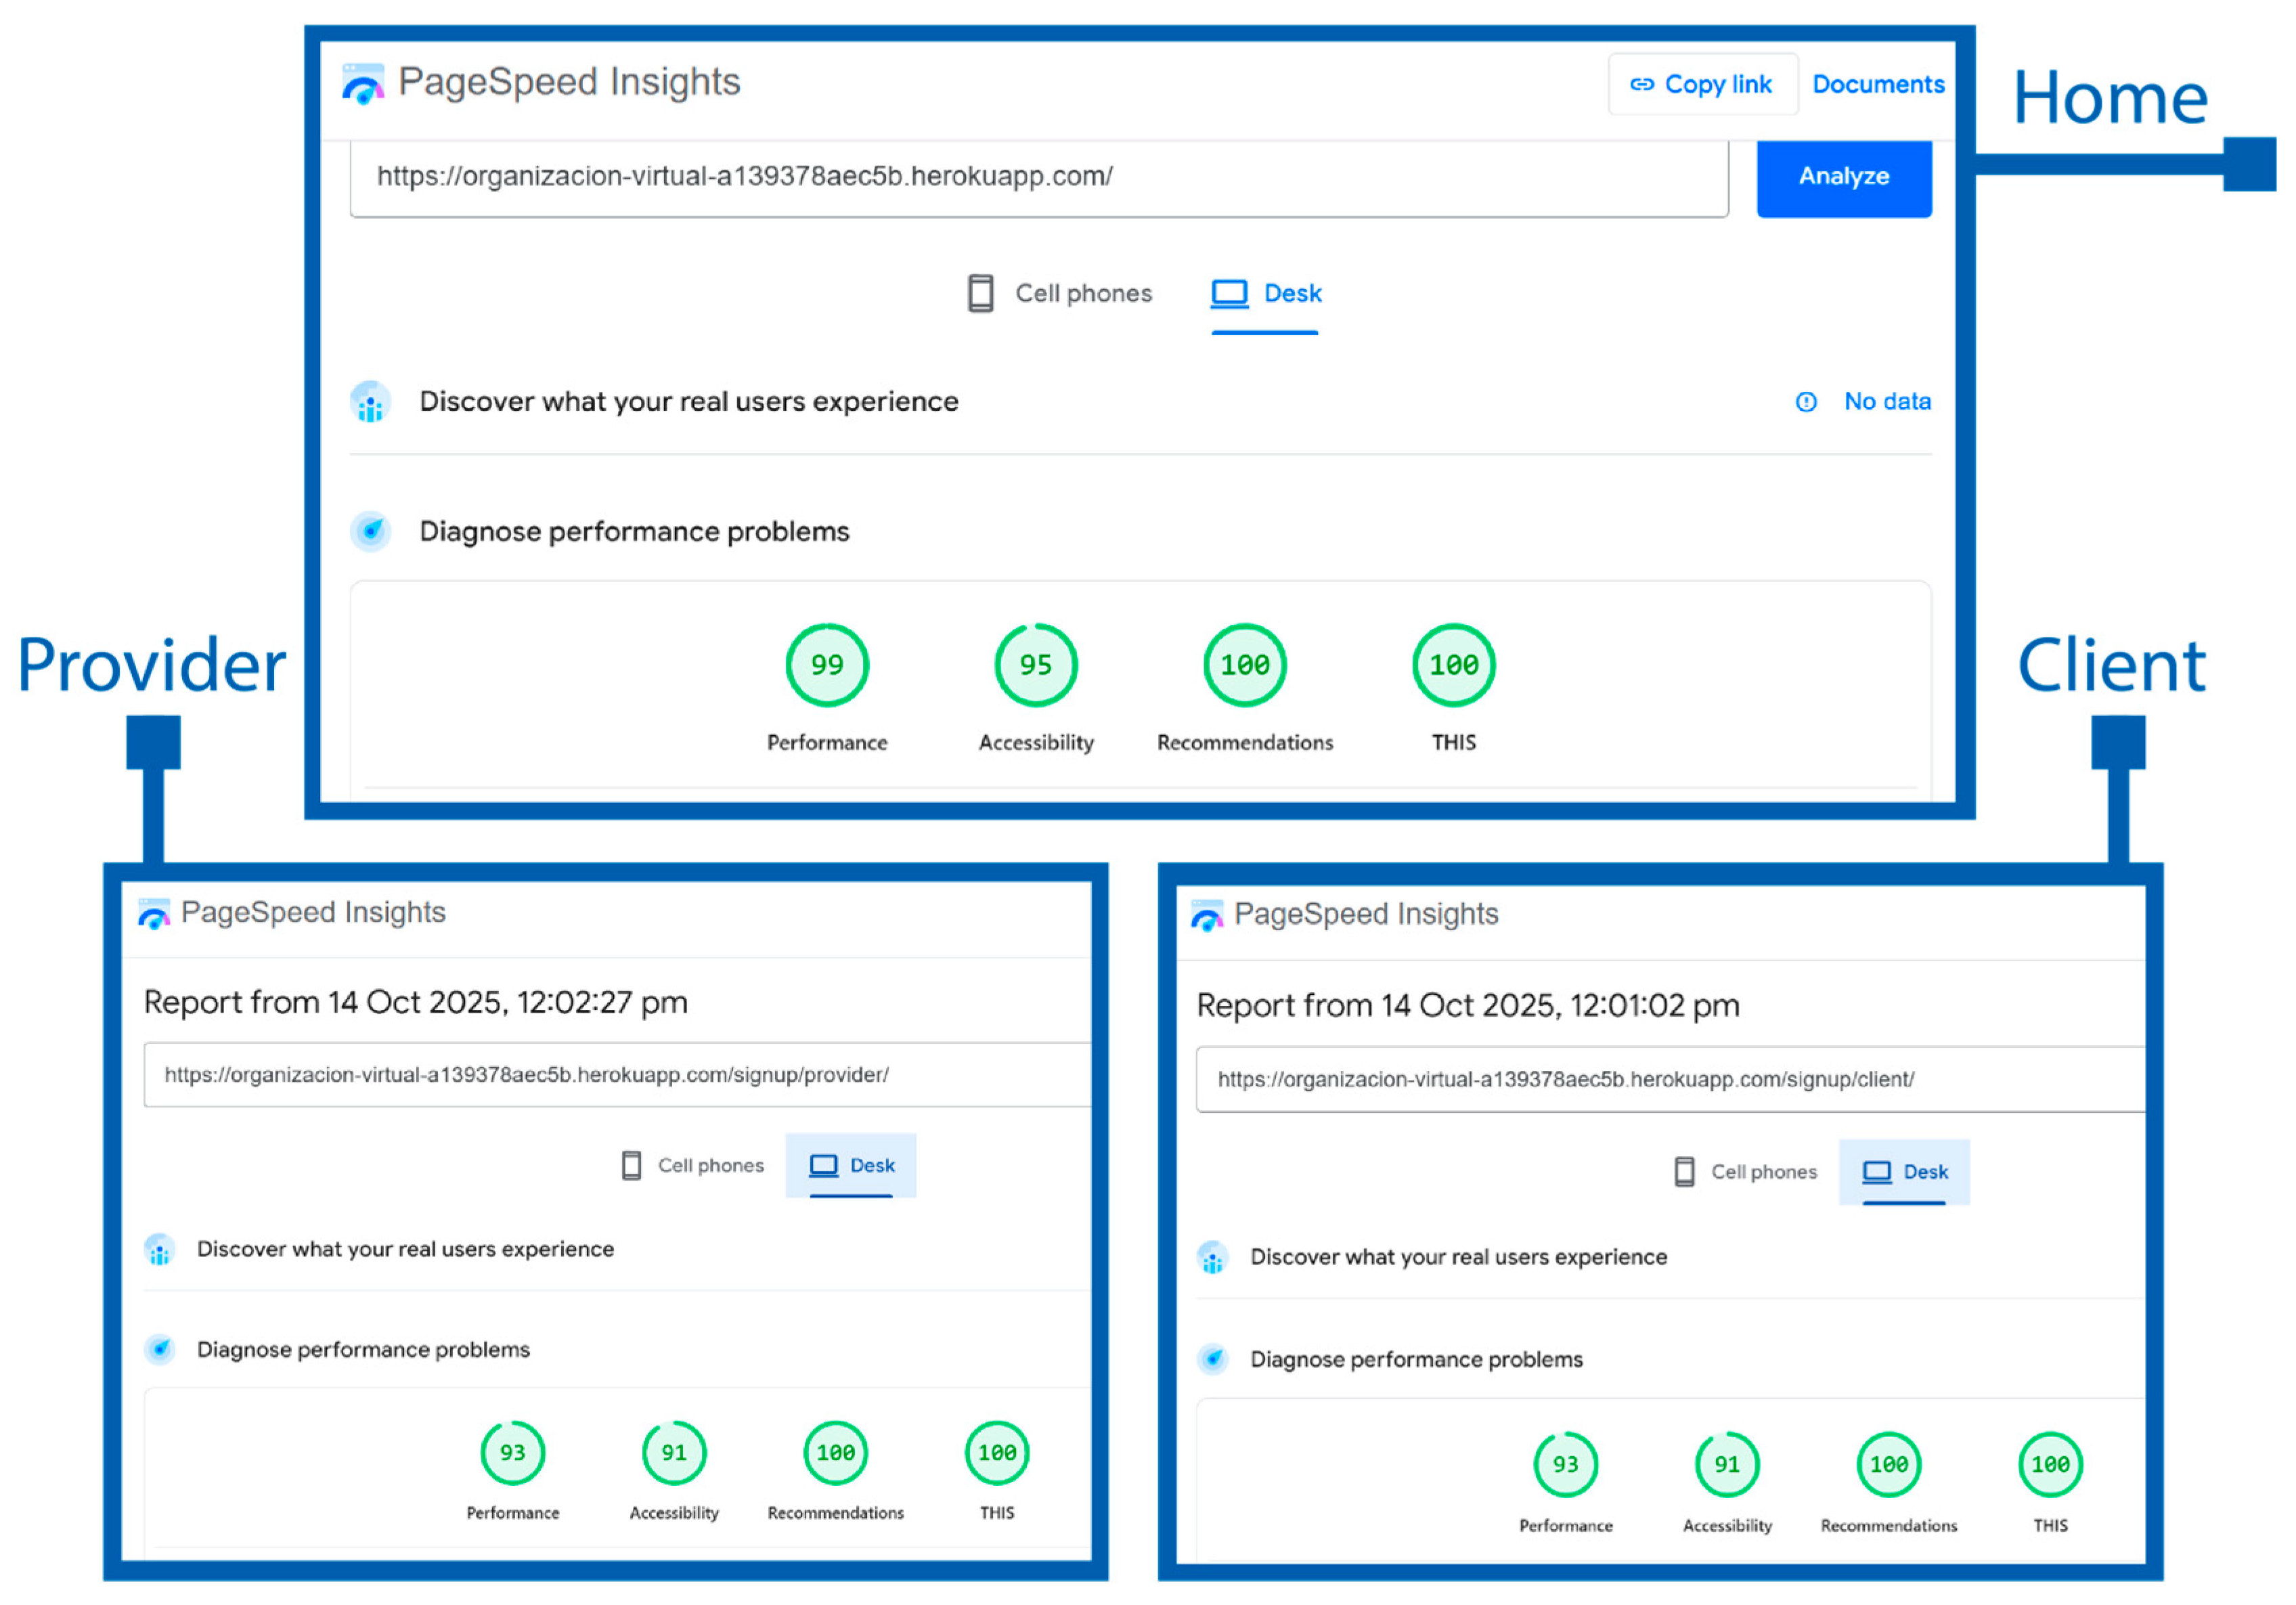
Accessibility and SEO tests were conducted using
Google PageSpeed Insights on the desktop versions of the main page, client registration page, and provider registration page. All accessibility scores exceeded the 90% threshold, with the main page scoring 95%, the client registration page 91%, and the provider registration page 91%. Similarly, SEO scores were above the 90% threshold for all tested pages, confirming that both accessibility and SEO requirements are met for these key sections of the platform (See
Figure 22 and
Table 13).
8.8. Verify the Accuracy of Requirement Processing and Partner Selection—EO5
To evaluate the accuracy of requirement processing, a total of 150 requirements were extracted from the database and analyzed by ten domain experts. Each requirement was reviewed to determine whether it had been correctly interpreted, validated, and finalized in accordance with the established business rules. During the process, it was confirmed that experts have the option to explicitly accept a requirement once they are 100% satisfied with its definition. Therefore, if inconsistencies remain undetected at this stage, they are attributed to unconscious client acceptance rather than a system fault. Since requirements can be redefined an unlimited number of times, the system logs were analyzed to identify cases in which requirements were repeatedly redefined but failed to reach final approval due to lack of user satisfaction. These cases were counted as failed requirements in the evaluation. The results indicated a requirement-processing accuracy of 95.33%, meaning that only a small fraction of requirements failed to converge to a satisfactory definition after multiple iterations. This value exceeds the acceptable threshold of 95%, confirming the robustness of the requirement validation mechanism (See
Table 14).
The accuracy of partner selection was assessed independently using the same set of 150 validated requirements. Each assignment was examined to confirm that the selected provider corresponded to the correct CIUUP category and fulfilled the established business criteria. The expert review identified 11 errors in total: 9 assignments failed during the initial batch process, and two were attributed to incorrect provider matching. This yielded a matching accuracy of 92.67%, surpassing the minimum acceptable threshold of 90%. To complement the quantitative analysis, a satisfaction survey was conducted among the ten domain experts. Nine experts reported being fully satisfied with the system’s overall performance, while one expert expressed partial satisfaction, noting that the selected providers did not fully meet expectations. This expert suggested that including more detailed provider data could enhance the precision of the matching process and improve requirement–provider alignment. If errors caused by incorrect CIIU classification are excluded, the matching accuracy increases to 98.67%. These results demonstrate that both the requirement-processing and partner-selection components perform reliably, with only minor improvements needed to refine provider data granularity and reduce redefinition loops.
9. Benchmarking Time Efficiency: Traditional vs. Autonomous Virtual Organization
To evaluate process efficiency in product customization, a benchmarking comparison was conducted between traditional organizations and an AVO. Benchmarking involves analyzing and comparing the average times required to complete key stages in the product customization process, specifically requirements gathering, waiting for supplier offers, and selecting the best supplier or partner. As part of this benchmarking process, surveys were conducted with administrators from ten different types of businesses (Manufacturing, Bookstore, Skincare, Construction, Healthcare, Education, Technology, Academic Research, Design & Photography, and Tourism). Each administrator participated in a practical exercise where they requested a customized product and recorded the time taken for each of the three key stages.
The results showed that, in traditional organizations, requirements gathering averaged 6.7 days, waiting for offers took 7.5 days, and selecting the best supplier required 6.5 days. In contrast, the AVO reduced requirements gathering to an average of 8.9 min, waiting for offers to 1 day (a parameter that can be configured in future versions), and supplier selection to 4.3 min (See
Table 15). Once all offers are received, the system automatically processes the information and selects the optimal supplier in just a few minutes. These findings demonstrate a significant reduction in process times with the AVO, enabling much more agile and efficient management of product customization requests compared to the traditional approach.
10. Comparative Analysis with Existing Architectures
This section analyzes six distinct architectural or framework proposals comparable to the AVOMA approach. The evaluation is organized according to five key criteria, highlighting where each work meets or fails to meet them (see
Table 16). These criteria are:
Self-Organization: This criterion evaluates the architecture’s ability to automate tasks and processes while enabling autonomous decision making. It evaluates the extent to which the system can dynamically adjust its operations without external intervention. This is crucial because a self-organizing architecture minimizes the need for manual supervision, reduces operational complexity, and promotes scalability. By empowering components to make localized decisions based on predefined rules or learned behaviors, the system can respond with greater agility to changes and disruptions.
Industry 4.0 Foundation: This criterion determines whether the architecture incorporates Industry 4.0 technologies, such as data mining, data analytics, AI, and machine learning algorithms, to learn and adapt to new conditions autonomously. The integration of these technologies optimizes processes and improves decision-making, allowing the VO to adjust to market requirements continuously.
Flexibility and Adaptability: This examines the capacity of the architecture to adapt to various types of products and to respond to changes in market conditions or project requirements. Flexibility is essential for product customization and for allowing the participation of partners of different sizes and locations, ensuring that the supply chain dynamically adjusts to new challenges without losing execution efficiency.
Smart Performance Evaluation: This evaluates whether the architecture includes metrics and tools to continuously monitor and measure the performance of the VO. Implementing KPIs and real-time monitoring systems provides precise information about system behavior, enabling proactive adjustments to improve efficiency, enhance quality, and ensure the competitiveness of all partners.
Inclusivity: This criterion focuses on favoring the intelligent selection of partners, prioritizing the integration of SMEs so that they can participate in large projects despite having lower competitive advantages. By prioritizing the inclusion of SMEs, the system’s diversity is strengthened, local capabilities are developed, and the innovation base is broadened.
RAMI 4.0 Alignment: This criterion assesses how well the architecture aligns with the RAMI 4.0 standards and principles. RAMI 4.0 provides a structured framework that ensures interoperability, consistency, and standardization across industrial systems. Alignment with RAMI 4.0 is vital because it facilitates seamless integration with existing Industry 4.0 ecosystems, ensures compliance with international standards, and promotes a common language for communication between different systems and stakeholders. This alignment enhances the architecture’s compatibility with other Industry 4.0 initiatives and technologies, making it more robust, future-proof, and widely applicable across various industrial contexts.
Self-Organization: Most reviewed works demonstrate self-organization capabilities, albeit through different approaches. Priego-Roche et al. [
5] and Soleimani et al. [
10] frameworks emphasize self-organization by fostering organizational alliances and collaboration through structured methodological approaches. Specifically, Priego-Roche’s framework [
5] enables organizations to autonomously form dynamic, trust-based partnerships by leveraging predefined collaboration protocols and shared objectives. Both approaches support self-organization, resource sharing, and adaptive coordination, minimizing external control while enhancing collective intelligence and flexibility. The Decentralized Autonomous Organizations (DAO)-based approaches [
15,
17,
20] achieve self-organization through decentralized mechanisms, such as smart contracts and voting processes; however, they depend heavily on blockchain technology, which increases costs and may limit accessibility.
Industry 4.0: The integration of Industry 4.0 technologies is noticeably limited in the reviewed works. Priego-Roche’s framework [
5] was developed before many key Industry 4.0 technologies (such as IoT, AI, or additive manufacturing) became mainstream, and therefore does not explicitly mention them. Similarly, Soleimani’ et al. [
10] do not incorporate Industry 4.0 technologies, while the DAO-based architectures [
15,
17,
20] focus more on blockchain solutions rather than a comprehensive integration of Industry 4.0 advances. Furthermore, none of the proposals explicitly deliver a digital supply chain (DSC) to the client, detailing the logistics of personalized products. This omission makes applying these frameworks in real-world, diversified scenarios challenging.
Flexibility & adaptability: Regarding flexibility and adaptability, some proposals as [
4,
18] allow dynamic configurations in partner selection and process adjustments; however, they lack truly flexible self-configuration mechanisms. While the DAO architectures offer some adaptability through smart contracts [
15,
17,
20], and the GVBE framework permits partner reconfiguration [
22], none of the analyzed works include a DSC as part of their results. Instead, they primarily propose frameworks focused on the product lifecycle, which limits their practical application in delivering personalized and adaptable solutions.
Smart Performance Evaluation: In terms of performance evaluation, most works rely on traditional metrics and fail to offer a holistic or 360-degree approach. Priego-Roche et al. [
5] propose a framework that focuses on internal process outcomes, using structured methodologies to evaluate performance based on predefined organizational requirements and goals. However, it does not incorporate external data sources or advanced analytics. Soleimani et al. [
10] emphasize performance evaluation through collaborative metrics, focusing on the alignment of partner contributions and shared objectives, but their paper lacks real-time monitoring and predictive capabilities. On the other hand, Web3-based DAO [
17] leverage blockchain technology and smart contracts to automate performance tracking and decision-making processes. These approaches integrate decentralized mechanisms, such as voting and incentive systems, but are limited by their dependency on blockchain, which increases costs and restricts accessibility. None of the analyzed works fully integrates internal process outcomes with external data sources (e.g., social media, market trends, or general web information) for a comprehensive evaluation, nor do they incorporate real-time monitoring or predictive analytics to enhance decision-making processes.
Inclusivity (Prioritizing Small Partners): Currently, none of the analyzed works explicitly address social inclusivity or prioritize disadvantaged partners, such as small enterprises or individual entrepreneurs, in their frameworks. DAO architectures, for instance, implement mechanisms like token systems and decentralized voting to ensure equitable participation among stakeholders. However, these mechanisms are primarily designed to distribute decision-making power proportionally to token ownership, which often favors larger or more resourceful participants. While these systems promote transparency and decentralization, they lack explicit policies or weighted mechanisms that prioritize small partners, leaving a significant gap in fostering inclusivity and fair partner selection. This limitation highlights the need for frameworks that actively support the integration of smaller entities, ensuring diversity, innovation, and equitable opportunities within collaborative networks.
RAMI 4.0 Alignment: The AVOMA architecture is directly aligned with the RAMI 4.0 model across its three axes: hierarchy levels, life cycle and value stream, and layers. Regarding hierarchy levels, AVOMA spans from Field/Control Device to Connected World, integrating physical and digital resources within a collaborative partner network. In terms of the life cycle and value stream, its four Adaptive Cycles (AC1–AC4) cover the complete process of specification, integration, execution, and operational continuity for Autonomous Virtual Organizations (AVOs). Each Adaptive Cycle corresponds explicitly to specific layers of RAMI 4.0, ensuring structural coherence and interoperability. AC1. Preparation of VO Specifications, aligns with the Business and Functional layers, where customer requirements are captured and structured, business policies are defined, and workflows are established under quality-of-service constraints. AC2. Digital Supply Chain Creation, relates to the Integration and Information layers, decomposing requirements into tasks, performing capability matching, and orchestrating partners through interoperable connectors. AC3. Customer Satisfaction and Quality Control, corresponds to the Functional, Information, and Asset layers, monitoring SLA compliance, assessing execution quality, and integrating customer feedback for continuous improvement. Finally, AC4. Observation and Operational Continuity, operates transversally across all layers, ensuring system stability, resilience, and fault prevention through proactive monitoring and risk management. Although the current prototype did not include fault-tolerance metrics, as these belong to AC4, the complete architecture contemplates their future integration. This alignment guarantees full traceability between processes, data, and resources, distinguishing AVOMA from other Industry 4.0 frameworks, such as DAO-based systems or FAVO 4.0, which incorporate advanced technologies but fail to clearly map their components to the structured layers of RAMI 4.0. By establishing this explicit mapping, AVOMA offers a standardized, interoperable, and inclusive framework that supports empirical performance evaluation (EO1–EO5) and reinforces the integration of AVOs within the broader Industry 4.0 ecosystem.
11. Conclusions and Future Works
The AVOMA architecture was conceived as a flexible and scalable solution grounded in the principles of ACODAT and RAMI 4.0, enabling Virtual Organizations (VOs) to operate intelligently, autonomously, and inclusively. By leveraging accessible Industry 4.0 technologies, it extends advanced digital capabilities to small enterprises and independent professionals, promoting fairer and more sustainable participation in digital ecosystems.
The system is organized into four Autonomous Cycles—AC1 (Preparation of Specifications), AC2 (Creation of the Digital Supply Chain), AC3 (Customer Satisfaction and Quality Control), and AC4 (Observation and Operational Continuity)—which together ensure a coherent, traceable process from requirement definition to post-operation monitoring.
A prototype implementing AC1 and AC2 was developed and evaluated using the Goal–Question–Metric (GQM) methodology. The performance test (EO1) showed a 95th-percentile response time of 4 s, slightly above the ideal threshold of 2.5 s but acceptable under a low-resource testing environment. The scalability test (EO2) confirmed that the batch assignment algorithm processed 10,000 provider offers in just 3.79 s—orders of magnitude faster than the 10-min benchmark—demonstrating exceptional scalability. Resource monitoring (EO3) revealed low CPU (0%) and memory utilization (17%), indicating efficient resource use and substantial processing headroom. Accessibility and SEO validation (EO4) achieved scores above 90% on all pages, confirming compliance with international web standards.
Most notably, the evaluation of requirement processing and partner selection (EO5) achieved a requirement-processing accuracy of 95.33% and a matching accuracy of 92.67%, both surpassing their respective thresholds. Feedback from ten domain experts—representing both clients and providers—confirmed high satisfaction with the system’s reliability and usability, though one expert noted that more detailed provider data could further improve selection precision.
A benchmarking study comparing traditional organizations and the autonomous virtual organization demonstrated a dramatic reduction in process times: requirements gathering decreased from 6.7 days to 8.9 min, offer collection from 7.5 days to 1 day, and partner selection from 6.5 days to 4.3 min. These results confirm substantial gains in agility, efficiency, and accuracy in managing product customization and partner collaboration.
Nevertheless, some limitations should be acknowledged. The prototype and case study were validated within a controlled environment and a specific domain (an editorial consortium), which limits generalization to other industrial sectors. However, this limitation was mitigated through complementary expert validation: ten professionals with relevant experience independently assessed the system’s usability, accuracy, and reliability, providing valuable feedback that reinforced the robustness of the evaluation. Further empirical testing across diverse sectors will be necessary to confirm scalability and adaptability. Additionally, the integration of AC3 and AC4 remains pending, restricting a complete assessment of sustainability, resilience, and security metrics. Data heterogeneity and the absence of real-time operational scenarios also constrained the scope of performance testing. Finally, the analysis of the practical potential and commercial viability of the proposed solution will require future work. This work focused primarily on the architectural design and technological feasibility of the AVOMA model. However, AVOMA’s conceptual design supports self-sustaining mechanisms, allowing for its future integration into service- or subscription-based business models, which already increases its practical implementation.
Despite these advances, challenges remain related to cultural and organizational adaptation, as well as varying legal and regulatory frameworks that affect cross-border collaboration. Particularly, future works, which will continue with the implementation of the remaining cycles, such as cycles AC3 (Customer Satisfaction and Quality Control) and AC4 (Observation and Operational Continuity), should incorporate real-time feedback, and security and compliance mechanisms (e.g., blockchain-based audit trails, ISO 27001 alignment [
44], and NIST 800-53 mapping). Additionally, AC2 could be improved in future work with more efficient partner selection mechanisms, such as using optimization algorithms. All of the above will enhance the autonomy, adaptability, and resilience of the AVOMA architecture, as well as its inclusivity, continuous learning, sustainability, usability, and security. These additions will consolidate AVOMA as a robust, user-centered, and empirically validated architecture for managing AVOs within the Industry 4.0 ecosystem.
Although the economic dimension and commercialization readiness were beyond the scope of this study, the proposed architecture was conceived with the potential for self-sustainability. The modular and service-oriented design of the AVOMA platform facilitates future adaptation into cost-sharing or subscription-based models that could ensure its long-term operational viability. Future work will explore these economic aspects in greater depth, evaluating potential business models and cost–benefit scenarios to support real-world deployment and adoption by SMEs.
