Article

Advancing Small Defect Recognition in PV Modules with YOLO-FAD and Dynamic Convolution

College of Electronic Information Engineering, Taiyuan University of Science and Technology, Taiyuan 030024, China
*
Author to whom correspondence should be addressed.
Computers 2025, 14(12), 518; https://doi.org/10.3390/computers14120518
Submission received: 26 October 2025 / Revised: 20 November 2025 / Accepted: 24 November 2025 / Published: 26 November 2025

Abstract

To improve the detection performance of small defects in photovoltaic modules, we propose an enhanced YOLOv11n model—YOLO-FAD. Its core innovations include the following: (1) integrating RFAConv into the backbone network and neck network to better capture small defect features in complex backgrounds; (2) adding DyC3K2 for adaptive convolution optimization to improve accuracy and robustness; (3) employing ASF for multi-layer feature fusion, and combining it with DyHead-detect in the fourth detection layer to refine the classification and localization of small targets. Testing on our dataset shows that YOLO-FAD achieves an overall accuracy of 94.6% (85.3% for small defects), outperforming YOLOv11n by 3.0% and 10.1% in mAP, respectively, and surpassing YOLOv12, RT-DETR, Improved Faster-RCNN, and state-of-the-art (SOTA) improved models.

1. Introduction

Photovoltaic cells are a key technology capable of efficiently converting solar energy into electrical energy, thereby occupying an indispensable position in the field of renewable energy [1]. However, in actual operation, photovoltaic modules often face various potential faults and defects, such as hot spots, fractures, and plant. These issues not only cause energy loss and reduce the output power of the cells [2,3], but may even lead to system failure under extreme conditions. Among these, hot spots and fractures are considered one of the primary factors contributing to the power degradation of photovoltaic modules.
Since defects in photovoltaic cells are often difficult to identify with the naked eye, electroluminescence (EL) imaging technology is widely used for defect detection [4,5]. As a mature, high-resolution, non-contact, non-destructive testing method, EL imaging can effectively identify various types of defects in photovoltaic cells. However, traditional manual visual inspection still suffers from low detection efficiency, strong subjectivity, high error rates, and over-reliance on the experience of professional technicians, making it difficult to meet the demands of large-scale production and real-time monitoring. Therefore, the development of intelligent photovoltaic cell defect detection technology has become a current research hotspot and technical challenge.
In recent years, small-object detection has advanced via three routes: contextual utilization, multi-scale fusion, and feature enhancement [6,7,8,9,10]. However, these methods lack adaptation to PV scenarios (small defects, complex backgrounds), leading to poor performance. To address this, we propose YOLO-FAD based on YOLOv11n, with key modules RFAConv, ASF, DyC3K2, and DyHead-detect. The name YOLO-FAD is derived from the initial letters of its key improvement modules: RFAConv (F), ASF (A), DyC3K2 (D), and DyHead-detect (D). The main contributions of this paper include the following aspects:
(1) Introduction of the RFAConv module to replace traditional convolutions: In the trunk and neck networks, RFAConv is used to replace traditional convolution layers. RFAConv dynamically adjusts the receptive field to adapt to the scale of small targets, combines attention mechanisms to enhance the expression of defect features, and integrates multi-scale information to understand the context of defects. This improvement effectively captures subtle defects in photovoltaic modules, reducing the occurrence of missed detections and false positives, thereby enhancing the accuracy of small-object detection.
(2) Introduction of the DyC3K2 module to enhance robustness: the DyC3K2 module is introduced in the trunk and neck networks, with dynamic convolution (DynamicConv) embedded into the C3K2 structure, allowing the model to adaptively adjust convolution parameters based on input images, thereby improving the accuracy and robustness of defect detection in photovoltaic modules.
(3) Application of the ASF structure in the neck network: The introduction of the ASF (Attention Scale Sequence Fusion) structure further enhances the model’s ability to perceive small-object details. By fusing spatial features with multi-scale information, the ASF structure effectively integrates features extracted at different levels (P2, P3, P4, P5) from the backbone network. This efficient feature fusion strategy improves the model’s small-object detection capability and enhances its overall feature representation ability.
(4) Introduction of the DyHead dynamic head detection framework: For head detection, this paper proposes the dynamic head framework (DyHead). DyHead combines object detection heads with attention mechanisms, achieving comprehensive scale, spatial, and channel perception through the integration of multi-dimensional self-attention mechanisms at the feature level, spatial position, and output channel. This innovation significantly improves the model’s capabilities in object classification and localization, thereby enhancing overall detection accuracy.

2. Related Work

In the field of industrial defect detection, existing methods mainly focus on feature enhancement and multi-scale fusion to tackle challenges like low-contrast and complex backgrounds. Wang et al. [11] proposed an improved algorithm that embeds a structure specifically designed for small-object detection into the network. Zhao S et al. [12] proposed an attention-guided feature enhancement and multi-scale fusion framework for industrial defect detection, achieving a mAP of 92.3% on benchmark industrial datasets. However, their method was not optimized for the small, low-contrast defects in infrared photovoltaic images, limiting its applicability in PV inspection scenarios. Similarly, Liu P et al. [13] developed an adaptive receptive field convolution combined with context aggregation for small defect detection in industrial products, which improved robustness but incurred high computational complexity (120 GFLOPs), making it unsuitable for real-time PV drone inspection tasks.
For small-object detection, recent advances have explored pyramid feature enhancement and transformer-based architectures. Li Y et al. [14] proposed a pyramid feature enhancement and global context modeling approach, achieving state-of-the-art performance on general small-object datasets. However, their method lacks adaptation to industrial scenarios with cluttered backgrounds and low-contrast targets, such as PV module defects. Zhang G et al. [15] introduced a transformer-based small-object detector with multi-scale feature alignment, which improved detection precision but only achieved 30 FPS in inference speed—far below the real-time demands of PV drone inspection (typically requiring >100 FPS).
However, existing research still has certain limitations in the detection of small target defects in photovoltaic modules. The detection of small target defects (such as hot spots) in photovoltaic modules faces numerous challenges, including the small size of defects and the susceptibility of their features to environmental interference. This study focuses on the detection of small target defects in photovoltaic modules, aiming to develop an accurate and efficient detection method to address the research gap in this field and ensure the reliable and stable operation of photovoltaic systems.
To validate the robustness and generalization capability of our improved model, this paper conducted comparative experiments with current mainstream models (such as YOLOv8n, YOLOv9s, YOLOv10n, YOLOv11n, YOLOv12, and the RT-DETR series) to assess the robustness of the improved model YOLO-FAD. Additionally, we conducted comparative experiments using other publicly available datasets to further validate the generalization capability of the improved model.

3. YOLO-FAD Algorithm

3.1. YOLO-FAD Structure

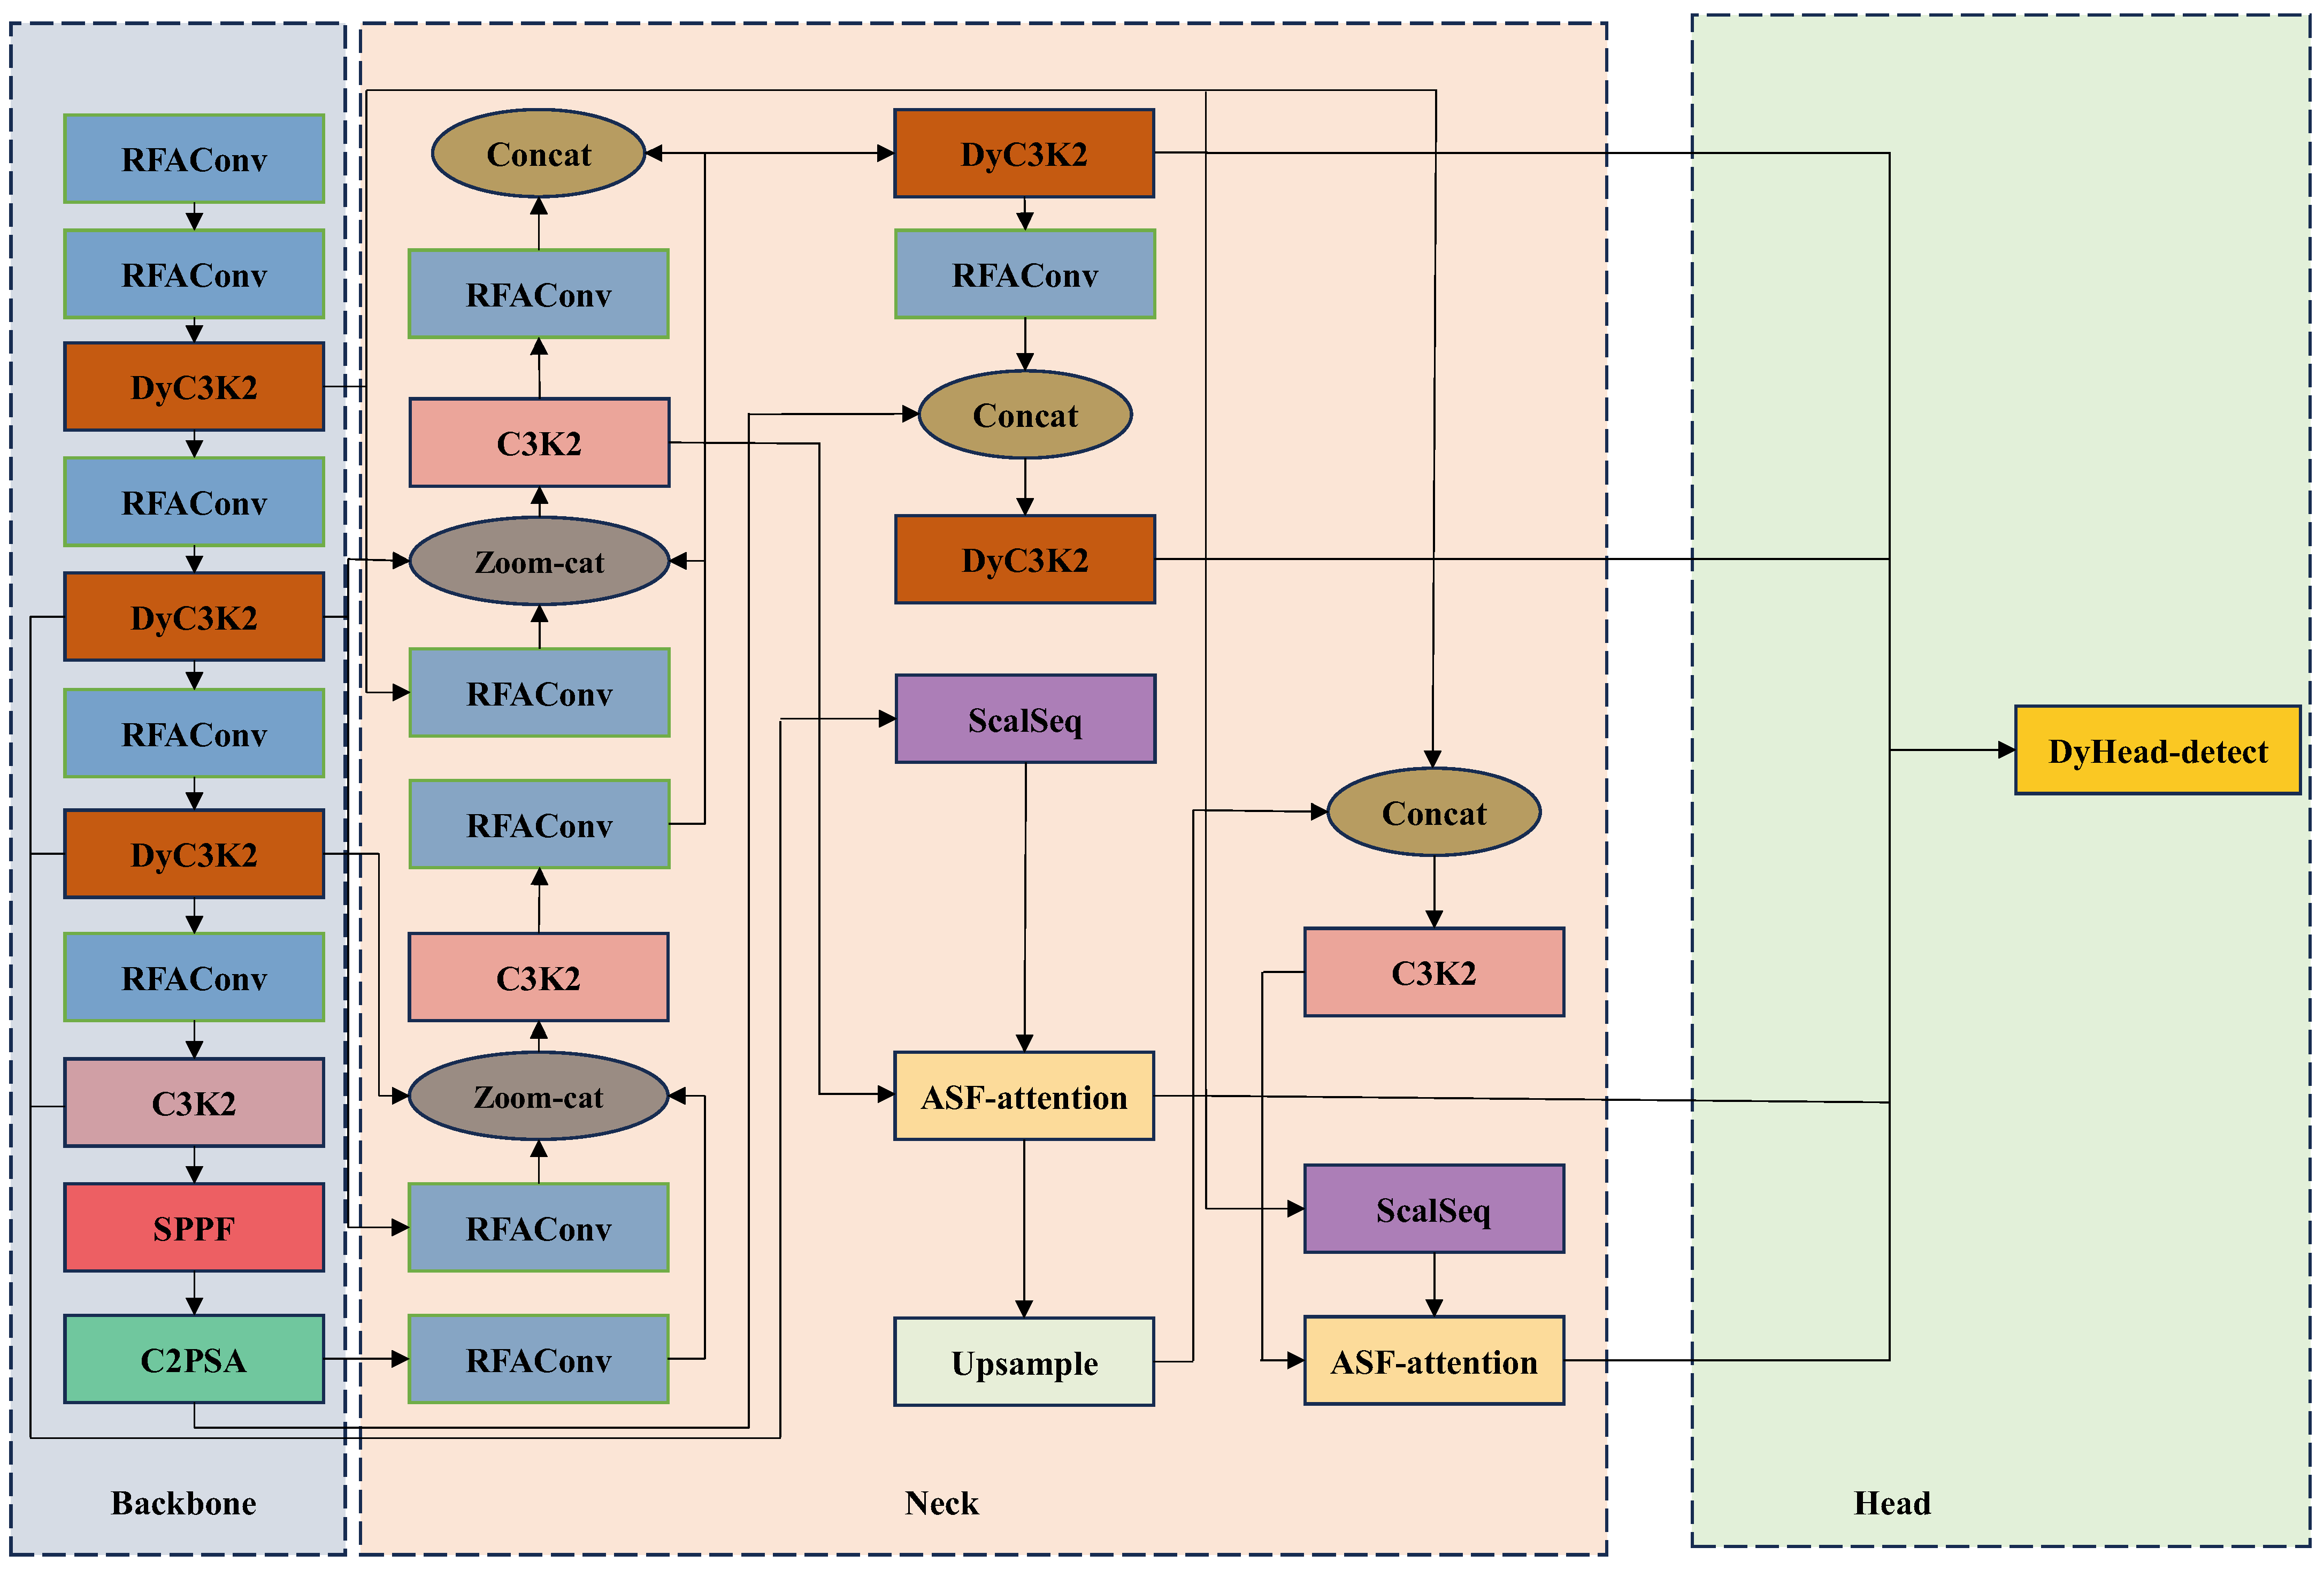
Addressing the challenges of detecting small defects in photovoltaic modules, such as difficulty in detection and loss of features, this paper proposes an improved YOLO-FAD algorithm based on YOLOv11n. The overall network structure is shown in Figure 1, consisting of three core modules: Backbone, Neck, and Head, with the following specific designs:
  • Backbone: Precise extraction of basic features of small target defects
In the Backbone section, we replace the traditional convolutional structure with RFAConv and integrate the DyC3K2 module to achieve efficient extraction of multi-scale features from photovoltaic module images. RFAConv dynamically adjusts the receptive field by introducing an attention mechanism, enhancing feature expression capabilities and effectively capturing the texture details of small defects. The DyC3K2 structure optimizes feature propagation paths by embedding a dynamic convolution mechanism, making small target defects such as fine cracks and hidden cracks more prominent in early features, thereby providing a solid foundation for subsequent detection.
2.
Neck: Strengthening the fusion and enhancement of small defect features
In the Neck structure, an attention scale fusion module (ASF) is introduced, combined with operations such as ScalSeq and Concat, to perform deep fusion processing on the multi-scale features output by the Backbone. On one hand, strategies like Zoom-cat are used to effectively aggregate cross-level features, addressing the lack of contextual information for small defects. On the other hand, the ASF-attention mechanism focuses on critical defect regions, enhancing the feature response values of small defects to prevent them from being overshadowed by large defect features during multi-scale fusion, thereby improving the transmission and expression quality of small defect features within the network.
3.
Head: Achieving multi-dimensional precise detection of small defects
In the detection head section, we have expanded the number of detection heads to four and uniformly replaced them with the DyHead structure. Multiple detection heads deployed in parallel across different feature layers can cover defect regions of varying sizes and locations within photovoltaic modules, particularly demonstrating stronger classification and localization capabilities for small-object defects. DyHead integrates multi-dimensional attention mechanisms across spatial, scale, and channel dimensions, enhancing the model’s ability to regress small-object defect bounding boxes and classify categories, significantly improving detection accuracy for small objects, including hot spots.
In summary, the YOLO-FAD model has been specifically optimized for small target defects in photovoltaic modules at each stage of feature extraction, feature fusion, and final detection, effectively improving the detectability of small defects and overall detection accuracy, providing an efficient and reliable solution for defect monitoring in actual photovoltaic systems.

3.2. RFAConv Module

Existing convolutional attention modules (such as CBAM [16]) and coordinated attention modules (CA [17]) still have certain limitations in practical applications: on the one hand, they struggle to adequately focus on the importance of features at different positions within the receptive field; on the other hand, they also fail to effectively address the issue of convolutional parameter sharing. To overcome these shortcomings, this paper introduces the Receptive Field Attention Convolution (RFAConv) module [18] to enhance the model’s ability to express features of small target defects in complex contexts.
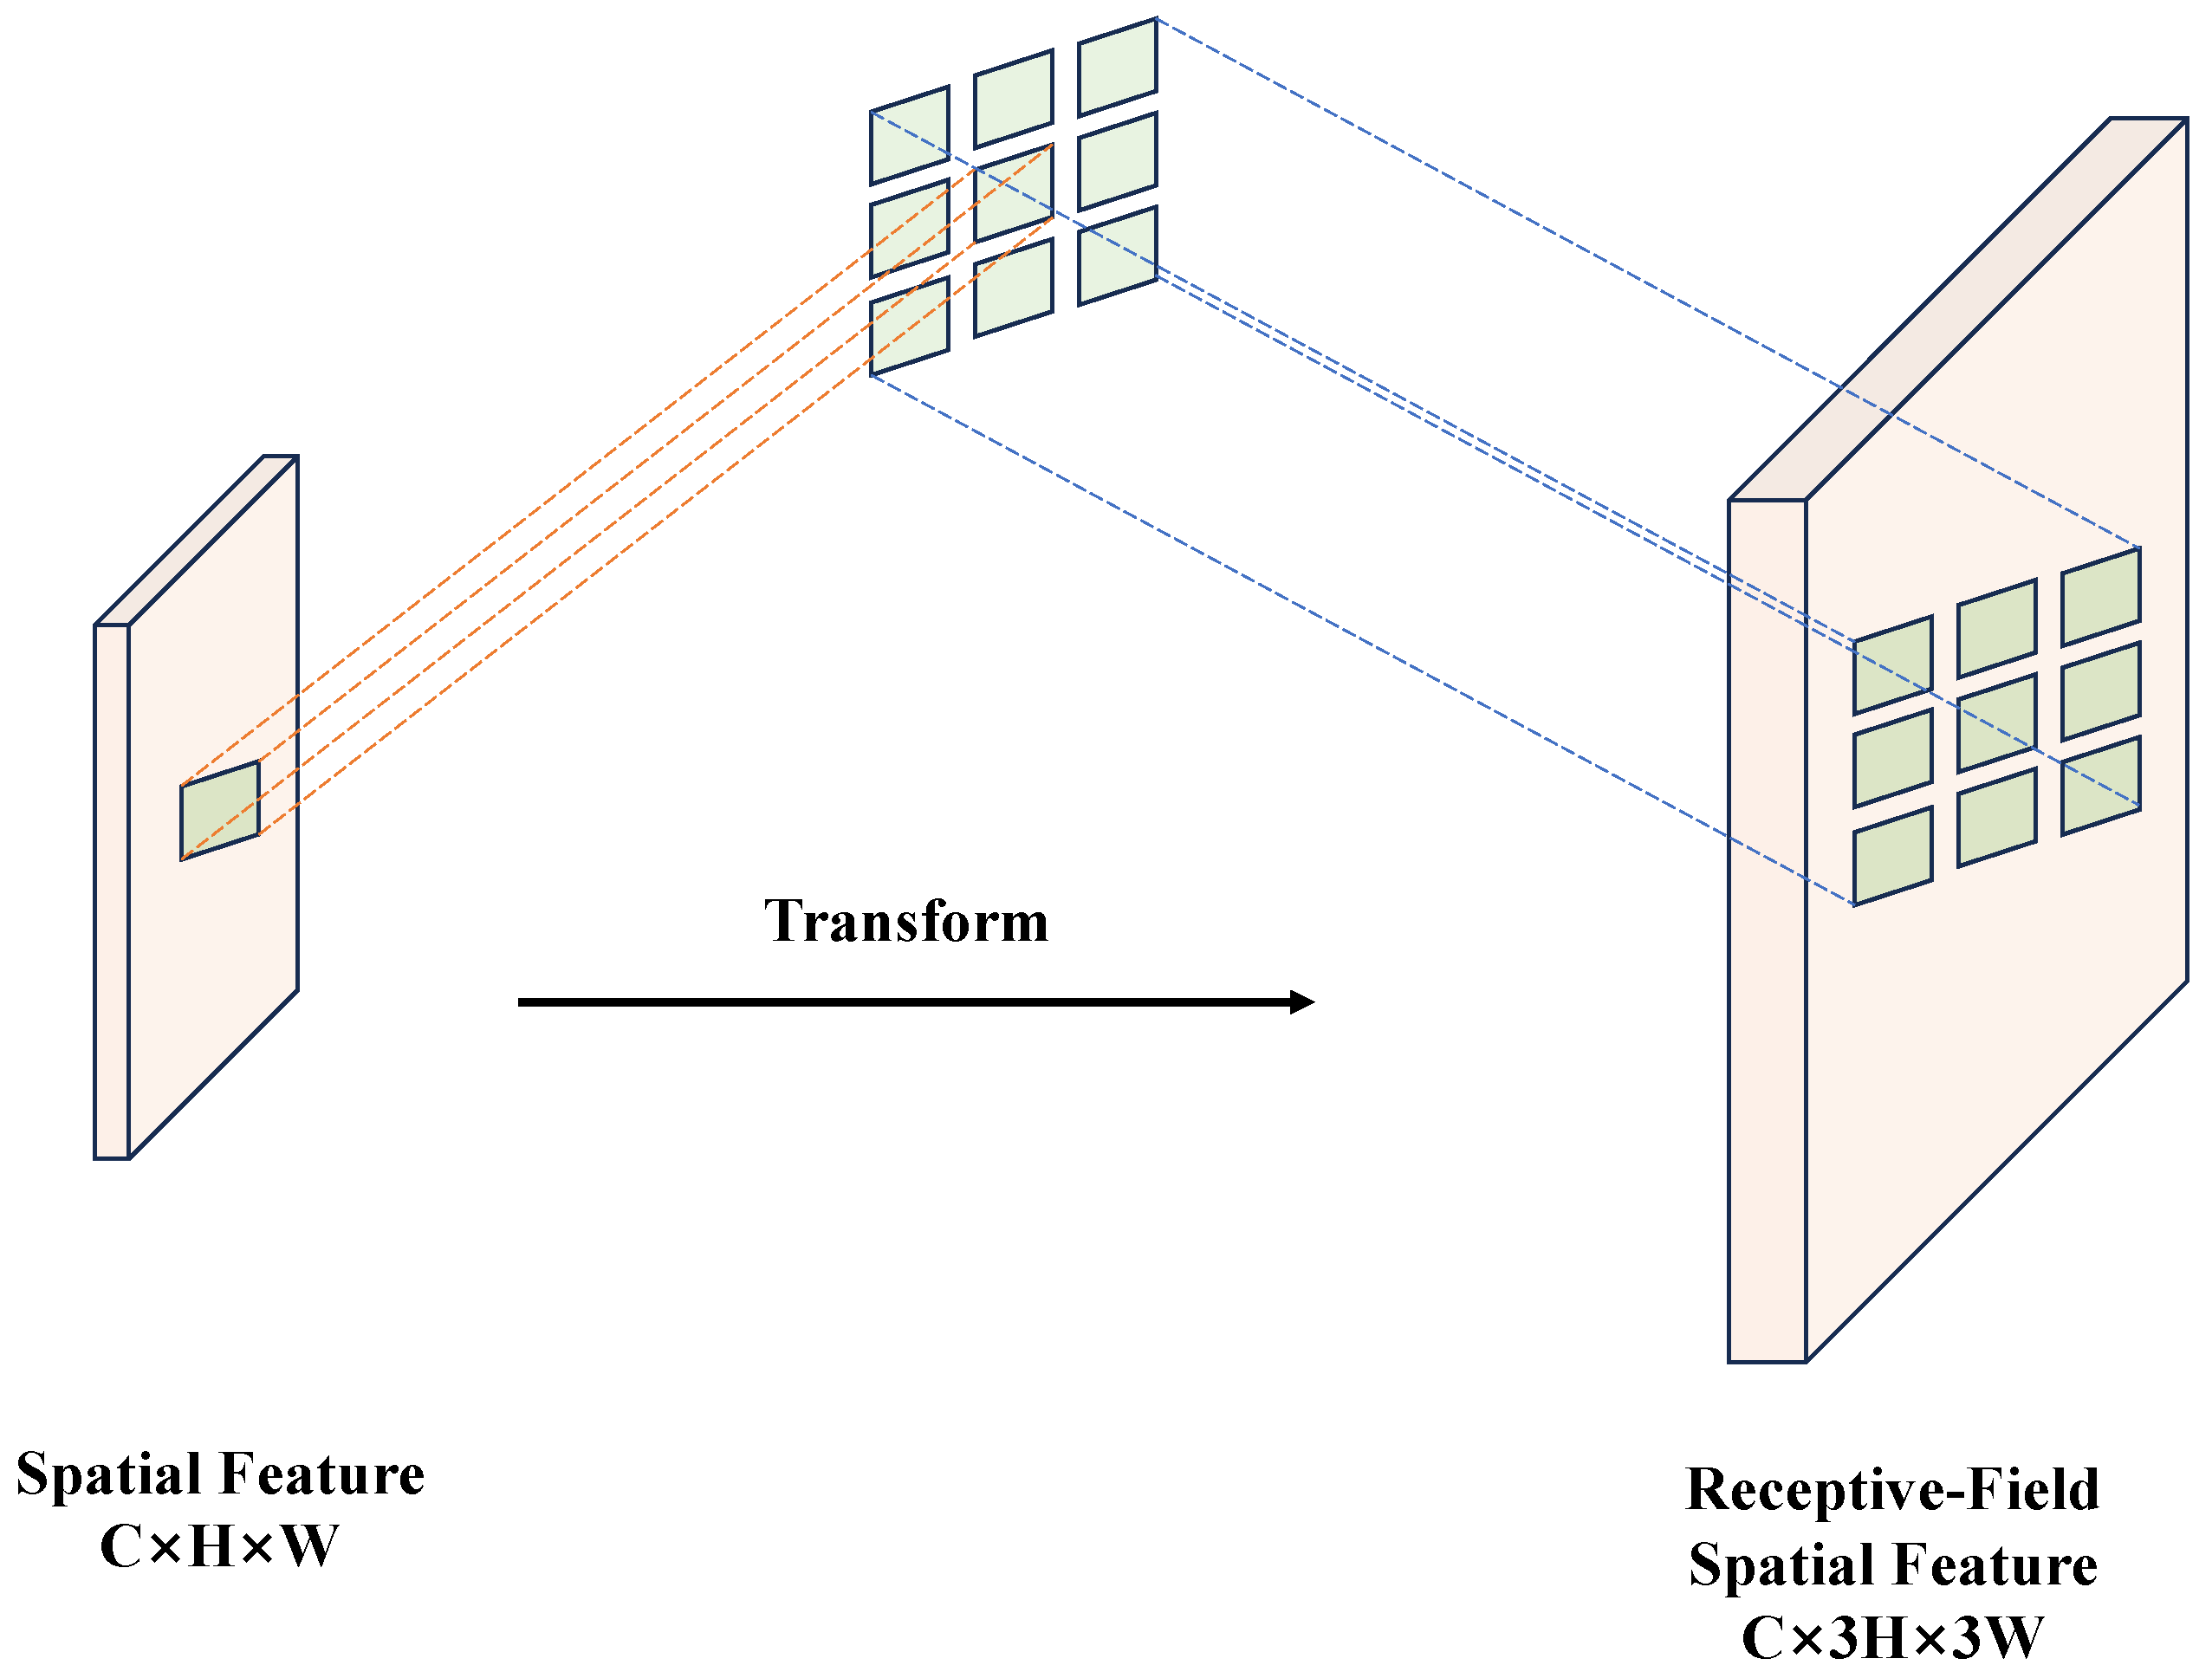
RFAConv achieves parameter sharing of convolutional kernels by introducing a spatial attention mechanism, while dynamically evaluating the importance of features within the receptive field to extract more discriminative receptive field features from the original feature map. As shown in Figure 2, this module divides feature processing into two stages: the spatial feature domain (i.e., the original input feature map) and the receptive field feature domain (non-overlapping feature blocks generated by a sliding window with a stride of three). Each 3 × 3 window corresponds to a receptive field unit, enabling the model to effectively model the contextual relationships between the target region and its surrounding environment during the early stages of feature extraction. It should be clarified that these non-overlapping 3 × 3 feature blocks (stride = 3) are exclusively for attention computation (to model receptive field feature importance) rather than replacing convolution itself. Each block corresponds to a receptive field unit, enabling the model to capture contextual relationships between targets.
To balance performance and efficiency, RFAConv employs a three-tier processing strategy: first, average pooling is used to compress the receptive field features and reduce their dimensionality; second, 1 × 1 convolutional layers are employed to establish connections between different receptive fields; finally, the softmax activation function is used to perform adaptive feature selection for each receptive field unit. The aforementioned computational process can be formally represented by Equation (1). This structure not only maintains the model’s lightweight characteristics but also significantly enhances feature representation capabilities, providing more discriminative inputs for subsequent detection.
F = S o f t m a x g ( 1 × 1 ) A v g P o o l x × R e L U ( N o r m g ( k × k ) X )
Here, g ( 1 × 1 ) denotes a group convolution of size i   ×   i , k denotes the size of the convolution kernel, Norm denotes normalization, X is the input feature map, and F is obtained by multiplying the attention map A r f with the transformed receptive field’s spatial features F r f .

3.3. ASF Module

To more effectively obtain detailed information about small defects in photovoltaic modules, this paper introduces the ASF (Attentional Scale Sequence Fusion) structure [19] into the neck structure of the network. ASF is a framework that fuses spatial and multi-scale features, widely used in object detection and segmentation tasks, and has excellent small-object recognition capabilities. By fusing feature outputs from various layers of the backbone network (P2, P3, P4, and P5), it effectively enhances the representation capability for multi-scale targets.
Building upon the ASF framework outlined in [19], this paper addresses the requirements of PV defect detection by replacing the original TFE (Temporal Feature Extraction) module with an MLFE (Multi-Scale Local Feature Extraction) module. This modification focuses on extracting local detail features, thereby adapting the system to scenarios involving small defect detection. The rationale for this modification is clearly articulated.
The ASF network structure primarily consists of two functional modules: the SSFF (Spatial-Scale Feature Fusion) module and the MLFE (Multi-Scale Local Feature Extraction) module. The SSFF module focuses on integrating global multi-scale information, while the MLFE module focuses on integrating local detail features from multi-scale receptive fields, which is critical for identifying small defects that are easily obscured by PV module textures.
As shown in Figure 3, the core objective of the SSFF module is to integrate spatial features at different scales into a unified, efficient representation. Specifically, the module first aligns feature maps from multiple levels (P2 to P5) in terms of size (including upsampling and downsampling) to a uniform spatial resolution. Subsequently, these multi-scale feature maps are stacked and fused, and a 3D convolution (3D Conv) is applied to model the complex dependencies between spatial and scale dimensions. Based on this, batch normalization (BN) is introduced to stabilize the training process, and the SiLU activation function is used to enhance the network’s non-linear expression capabilities. The module ultimately outputs fused feature maps, providing more comprehensive and refined semantic support for downstream small-object defect detection and segmentation tasks.
The scaled images input to the SSFF module can be calculated using Formulas (2) and (3).
F σ w , h = G σ w , h × f w , h
G σ w , h = 1 2 π σ 2 e ( w 2 + h 2 ) / 2 σ 2
Among them, f ( w , h ) represents a two-dimensional input image with width w and height h. F σ ( w , h ) is generated by smoothing through a series of convolutions with a two-dimensional Gaussian filter G σ   ( w , h ) . Here, σ represents the scale parameter, which determines the standard deviation of the two-dimensional Gaussian filter used in the convolution process.
The MLFE module is shown in Figure 4. Its structure adopts a three-branch design tailored to PV defect characteristics:
Large-scale branch: processes low-resolution features (stride = 2) using Conv-BN-SiLU and max-pooling, focusing on capturing the global context of defects (e.g., the positional relationship between hot spots and PV cell grids);
Medium-scale branch: directly processes features with stride = 1 to retain the shape and edge information of medium-sized defects (e.g., plant shadows on modules);
Small-scale branch: first upsamples features (nearest-neighbor interpolation, scale = 2) to enhance the resolution of small defects, then uses a 3 × 3 convolution to refine texture details (e.g., the edge of micro-fractures).
The outputs of the three branches are concatenated along the channel dimension, and a 1 × 1 convolution is used to fuse multi-scale local features, with the process formally expressed as
F M L F E = C o n v 1 × 1 ( C o n c a t ( F l , F m , F s ) )
where F l , F m , F s represent the features of the large, medium, and small branches, respectively. This module effectively compensates for the loss of local detail in multi-scale feature fusion, enabling the model to better distinguish small defects from background noise in PV images.

3.4. DyC3K2 Module

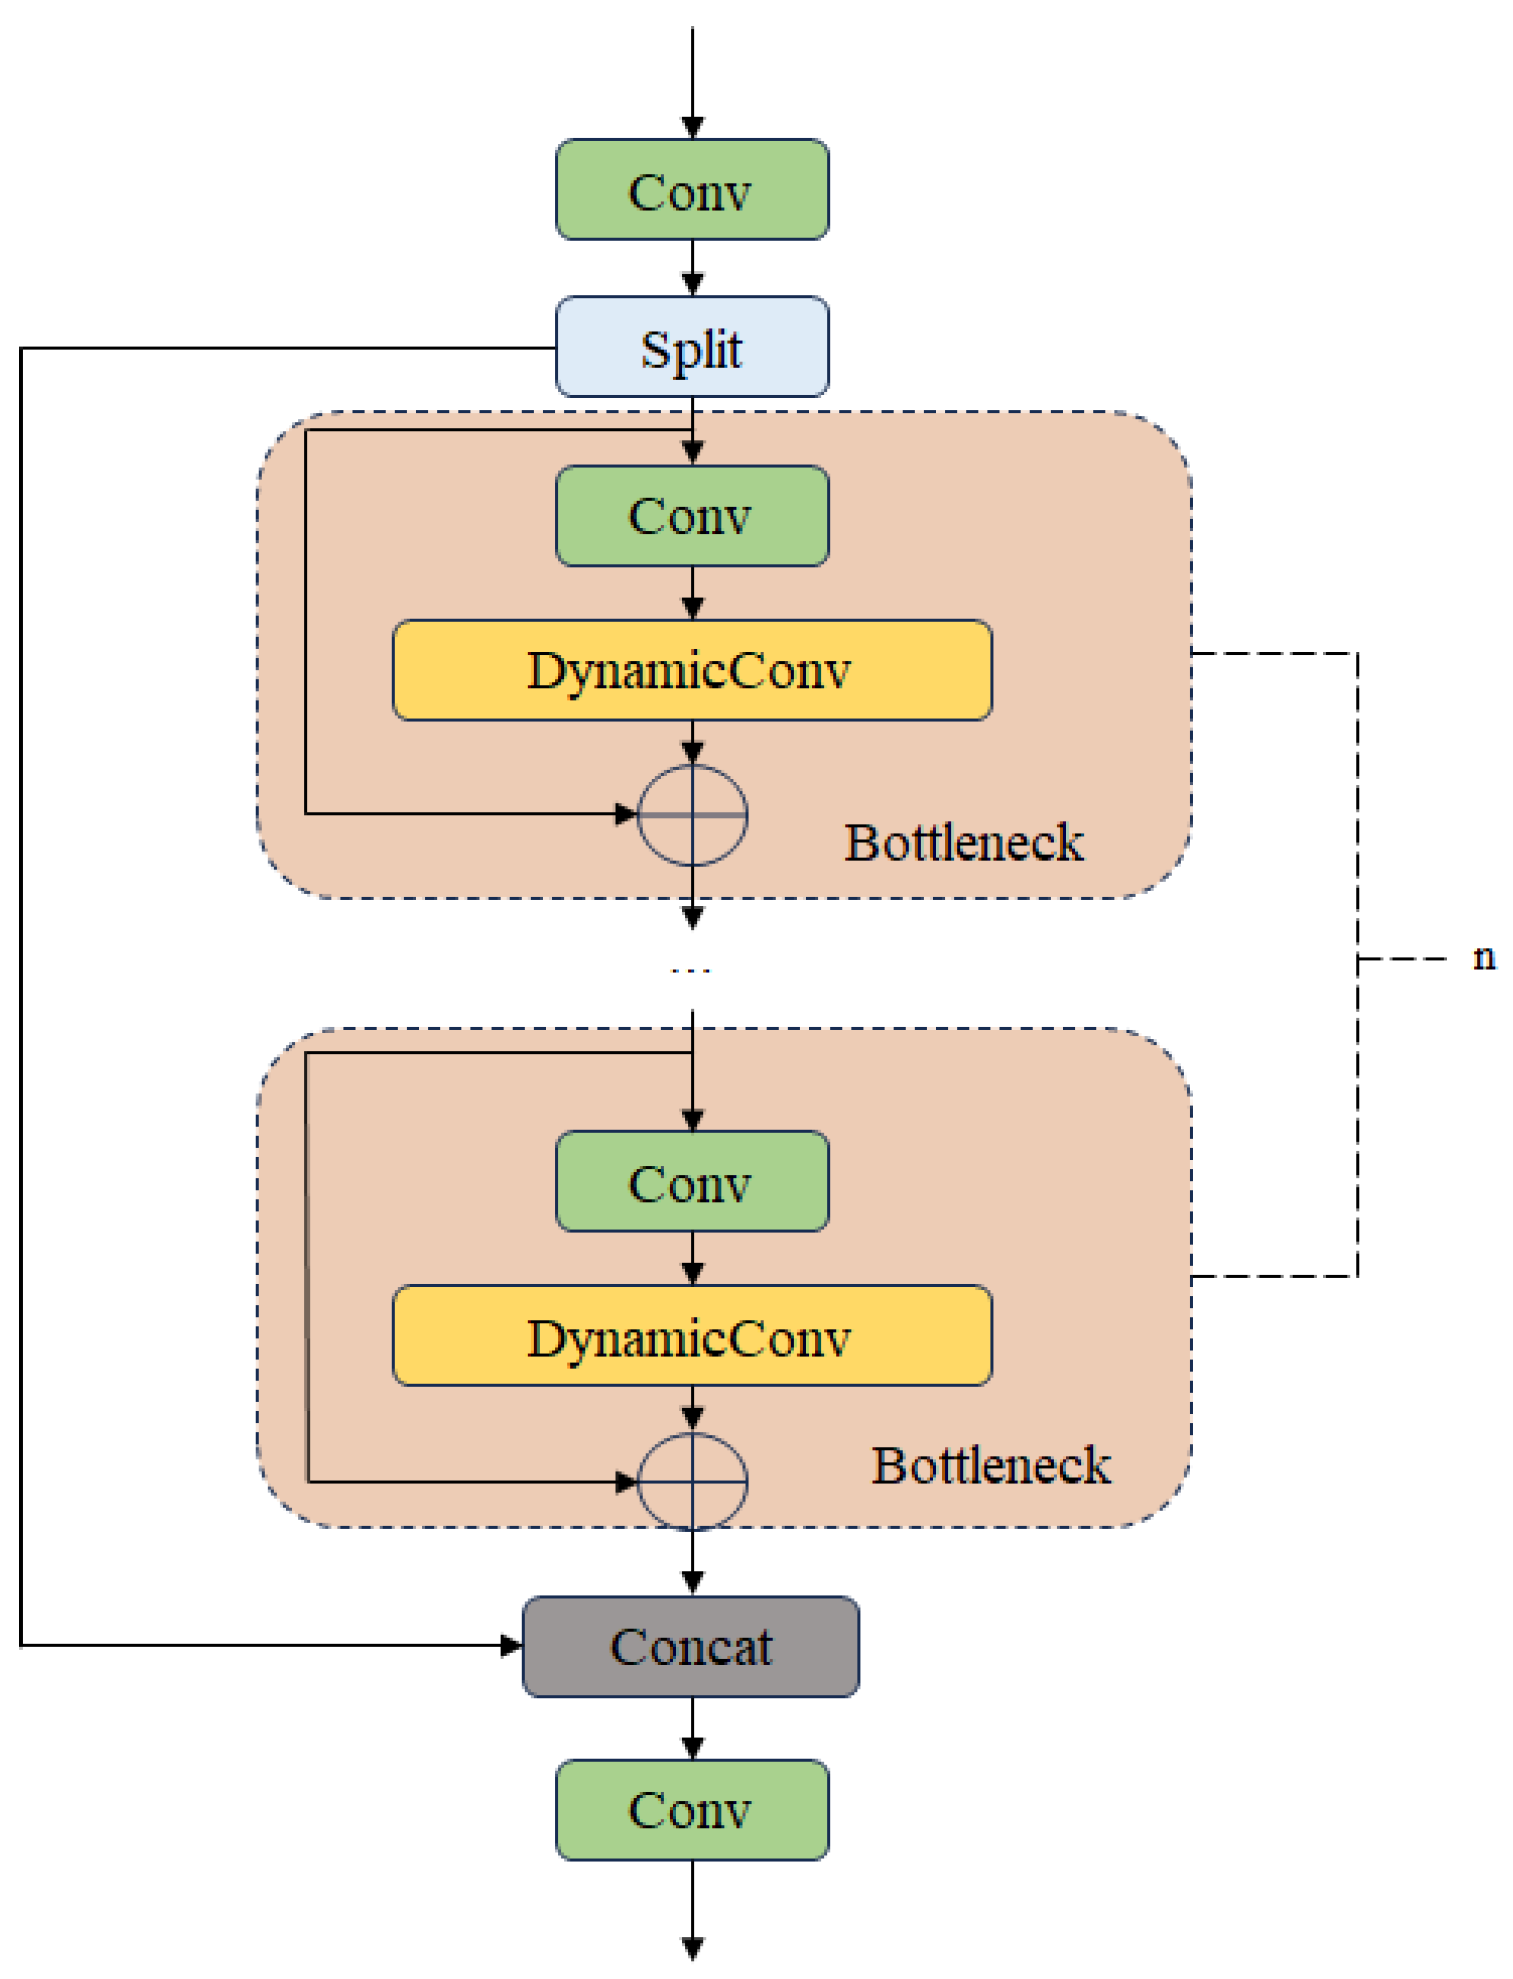
To enhance the feature extraction capabilities of YOLOv11n in the task of photovoltaic module defect detection, this paper introduces a new module, DyC3k2, based on YOLOv11n. This module is an extended improvement of the traditional C3k2 structure, integrating DynamicConv [20], with the aim of significantly enhancing the adaptability and expressive power of the network backbone, thereby achieving more accurate detection of small target defects in photovoltaic modules.
DynamicConv is the core component of DyC3k2, representing a dynamic convolution mechanism. Unlike traditional fixed convolution kernels that process all inputs uniformly, DynamicConv dynamically selects or combines multiple convolution kernels (i.e., ‘expert kernels’) based on the features of each input sample to adapt to different input distributions and feature representation requirements. This mechanism introduces a higher level of flexibility and adaptability to convolutional neural networks. Specifically, DynamicConv introduces a learning function to dynamically allocate expert kernel weights. This function typically consists of a multi-layer perceptron (MLP) and a Softmax layer, generating weight coefficients for each expert kernel to enable on-demand combination. Its output can be expressed as
Y = i = 1 M α i ( X × W i )
Here, X represents the input features, W 1 ,   W 2 ,   ,   W M are the expert kernels, and α i are the weight coefficients dynamically generated by the MLP and Softmax.
Applying DyC3k2 to the backbone portion of the network offers significant advantages in terms of computational efficiency and feature representation capabilities. Compared to the traditional C3k2 structure, DyC3k2 is more parameter-efficient and computationally flexible, enabling it to maintain model lightweightness while enhancing adaptability to complex input features. Especially in resource-constrained or real-time-critical photovoltaic systems, the DyC3k2 design provides effective assurance for achieving high-precision, small-object defect detection. Additionally, the module’s adaptive characteristics enhance the model’s generalization capability and robustness across different application scenarios. The specific structure of DyC3k2 is shown in Figure 5.

3.5. Dynamic Detection Head

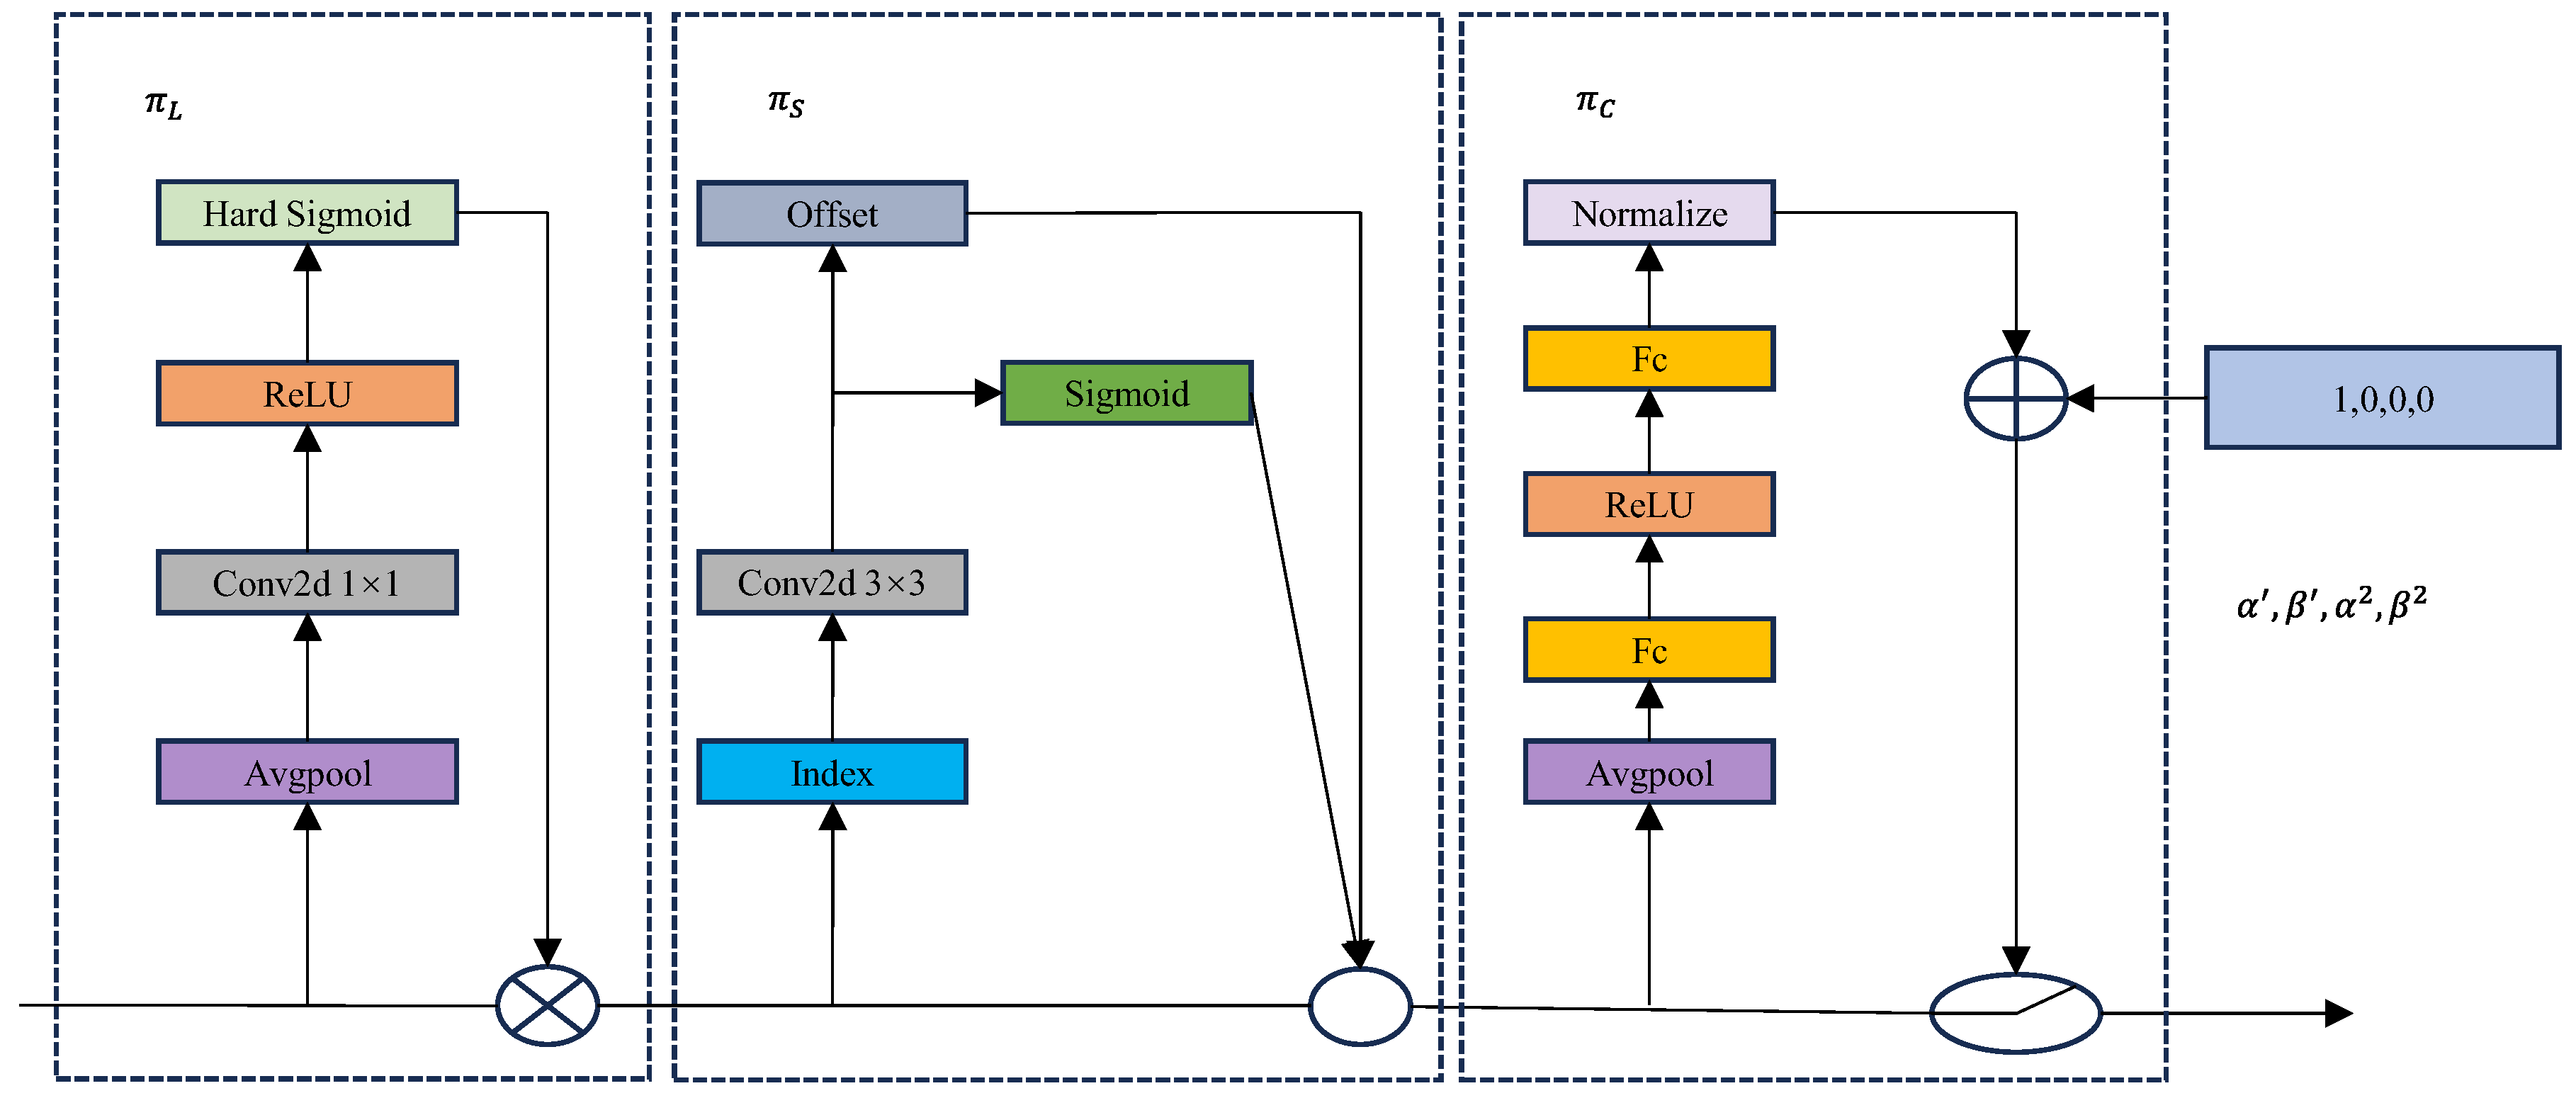
In the YOLOv11n model, the detection head is unable to effectively detect and locate small objects in photovoltaic modules due to the large receptive field of the network. DyHead [21] is a dynamic head framework designed specifically for object detection. It introduces an attention mechanism across feature layers, spatial positions, and channels, achieving comprehensive scale, spatial, and task awareness, and significantly improving the performance of small object detection. Figure 6 shows the structure of the DyHead module.
The π L module primarily focuses on the distribution of feature weights across channel dimensions. The specific process is as follows: first, the input feature map is subjected to global average pooling (AvgPool) to extract global semantic information at the channel level; then, through 1 × 1 convolution, ReLU activation function, and Hard Sigmoid function, attention weights for the channel dimension are generated. These weights are applied to the original feature map to dynamically adjust the response intensity of the channels, thereby highlighting semantically more critical features.
The π S module primarily processes the spatial dimension of the feature map. First, it uses an offset mechanism to perceive spatial details of the target, then uses the Sigmoid function to generate spatial weights. These weights dynamically adjust the input feature map to enhance prominent regions in the spatial dimension, making it particularly suitable for capturing small defects on photovoltaic modules.
The π C module comprehensively considers global context and local feature information. The input features first pass through a fully connected layer (Fc), activation function (ReLU), and normalization (Normalise) to generate comprehensive features. At the same time, the exponential function adjusts the feature amplitude to enhance the contrast between local information and the global background, improving the ability to identify small targets.
Among these, π L represents the scale-aware attention mechanism, which dynamically fuses features of different scales based on semantic importance. π S represents the spatial-aware attention mechanism, which continuously focuses on coexisting distinguishable regions in spatial positions and feature layers. π C represents the channel-aware attention mechanism, which enables different objects to jointly learn and generalize distinct representations.
In summary, the dynamic feature enhancement mechanism of the DyHead block provides robust technical support for defect detection of small objects in photovoltaic modules, demonstrating superior detection performance in complex scenarios.

4. Experimental Results and Analysis

4.1. Experimental Environment

To fully verify the performance of YOLO-FAD in both high-performance and resource-constrained scenarios, experiments were conducted on two types of hardware platforms: a desktop GPU and an embedded platform.

4.1.1. Desktop GPU Environment

To complete the experiment, we conducted our research based on the PyTorch framework. The experimental environment configuration is as follows: the operating system is Windows, the Python version is 3.8, the PyTorch version is 1.11.0, and the experimental hardware is NVIDIA RTX 3080 Ti.
In this experiment, model optimization and training were performed using the stochastic gradient descent (SGD) optimizer with a momentum of 0.9 and weight decay of 0.0005. To address the severe class imbalance (hot spots: 36,524 instances; fractures: 835 instances), we adopted the Focal Loss as the classification loss function ( γ = 2 ,   α = 0.25 ). The parameter α = 0.25 downweights the loss contribution of majority classes (e.g., hot spots), while γ = 2 amplifies the loss of hard-to-detect minority classes (e.g., fractures), forcing the model to focus on small and imbalanced defects. For the YOLO-FAD network parameters, the initial settings were an input image size of 640 × 640, an initial learning rate of 0.01, and the OneCycleLR strategy was used to dynamically adjust the learning rate to ensure the stability of the training process. To smoothly guide the model through the initial training phase and achieve a better initialization state, we designed a three-epoch ‘warmup’ strategy. The batch size was set to 16, with a total training cycle of 300 epochs.
Hyperparameter selection justification: (1) Optimizer: SGD was chosen over Adam because it achieves better generalization on imbalanced industrial defect datasets [22]; Adam often overfits to the dominant class (hot spots) in our dataset, leading to poor performance on small defects. (2) Input size: 640 × 640 was selected to balance spatial resolution (critical for detecting small hot spots ≤ 10 × 10 pixels) and computational efficiency—larger sizes (e.g., 800 × 800) increased GFLOPs by 40% without significant mAP improvement, while smaller sizes (e.g., 480 × 480) reduced small defect detection accuracy by 5.2%. (3) Learning rate: 0.01 was determined via grid search (0.001, 0.01, 0.1), with 0.01 achieving the fastest convergence and highest mAP.

4.1.2. Embedded Platform Environment

To simulate real-world PV plant inspection scenarios (e.g., UAV-mounted detection), an NVIDIA Jetson Nano (472 GFLOPs computing power) was selected as the embedded test platform—this device is widely used in low-power on-site detection due to its small size and low energy consumption. The platform was configured with JetPack 4.6 (supporting TensorRT 8.2 for inference acceleration), and the input image size and model weights were consistent with the desktop environment. TensorRT int8 quantization was applied to optimize the model for embedded hardware, reducing redundant computations without significant accuracy loss.

4.1.3. PV Scenario-Adapted Data Augmentation

Given the characteristics of PV module EL images (e.g., uneven illumination small defect scales, and single-channel grayscale), targeted automated data augmentation was implemented to improve model generalization, avoiding over-reliance on generic augmentation methods:
1. Geometric augmentation for defect scale adaptation: Random cropping (crop ratio: 0.6–1.0) was used to simulate close-range and long-range inspection angles, while slight rotation (−8° to 8°) mimicked the tilt of PV modules during actual installation. Horizontal flipping (probability 0.5) was applied to adapt to left-right symmetric module layouts, with vertical flipping excluded to avoid violating the physical structure of PV strings.
2. Grayscale and contrast enhancement for EL image features: For grayscale EL images, adaptive histogram equalization (CLAHE) was used to enhance the contrast between small defects (e.g., dark hot spots) and normal regions. Brightness adjustment (0.7–1.3×) simulated changes in ambient light during UAV inspections, reducing sensitivity to illumination variations.
3. Mosaic fusion for complex background adaptation: four PV module images with different defect types were randomly mosaicked (probability 0.3) to simulate the multi-module layout in actual PV arrays, helping the model distinguish overlapping defects or defects adjacent to module edges.
All augmentation operations were only applied to the training set to ensure the authenticity of validation and test results.

4.2. Dataset

The infrared images were captured using a DJI Zenmuse H20T thermal camera (spectral range: 8–14 μm, resolution: 640 × 512 pixels, frame rate: 30 FPS) mounted on a DJI Matrice 300 RTK UAV. The flight altitude was 5–8 m above the PV modules, resulting in a ground sampling distance (GSD) of 1 cm/pixel. All images were collected under uniform illumination conditions (solar irradiance: 800–1000 W/m2, ambient temperature: 25–30 °C) to avoid interference from extreme light or weather. Due to confidentiality agreements with the partner company, the full dataset is not publicly accessible. Additionally, we report 95% confidence intervals for all metrics based on 5-fold cross-validation to reflect result variability. After screening, we selected 2272 concentrated, low-altitude aerial images as the original data, the dataset was repartitioned following the 8:1:1 standard for machine learning.
Training set: 1818 images (80%), containing 41,802 defect annotations (hot spots: 29,219; plants: 7654; battery strings: 4262; fractures: 667);
Validation set: 227 images (10%), containing 5225 defect annotations (hot spots: 3652; plants: 957; battery strings: 533; fractures: 84);
Test set: 227 images (10%), containing 5226 defect annotations, (hot spots: 3653; plants: 957; battery strings: 533; fractures: 84).
Stratified sampling was used during partitioning to avoid over-representation of majority classes (e.g., hot spots) in the test set, ensuring reliable evaluation of minority class performance.
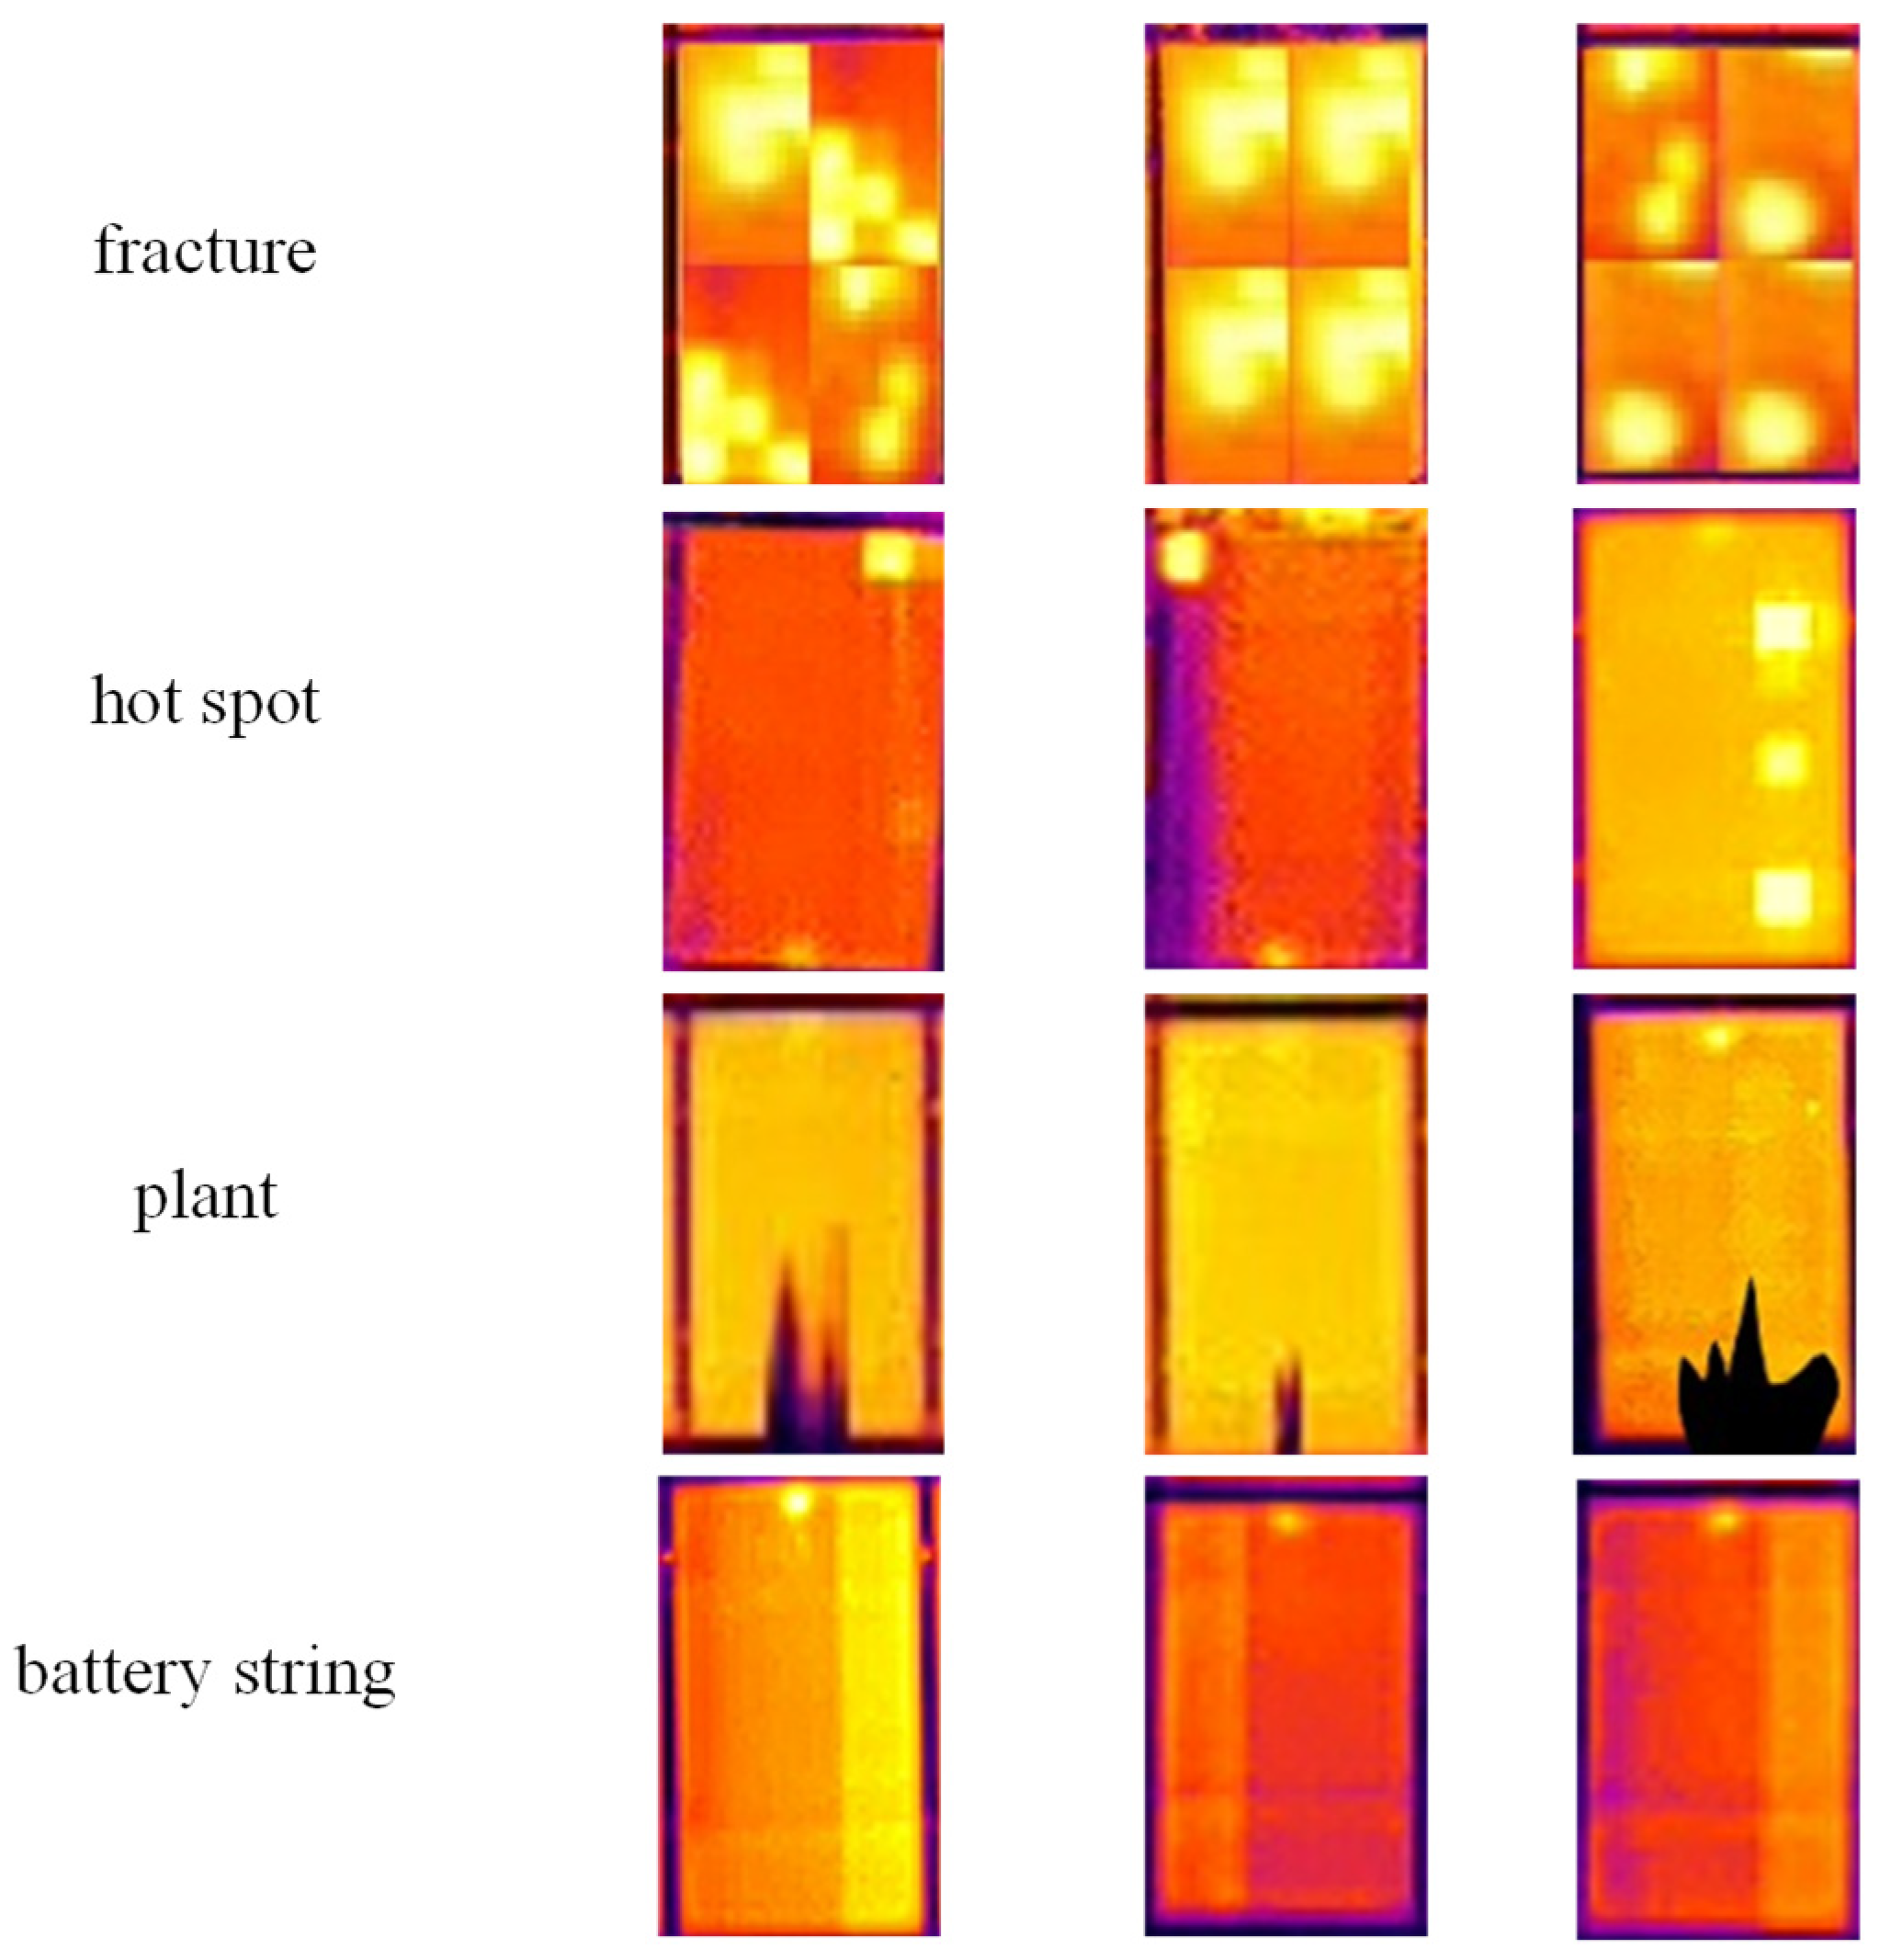
For these images, we used the LabelImg tool for manual annotation, identifying four defect types: fracture, hot spot, plant, and battery string, as shown in Figure 7.
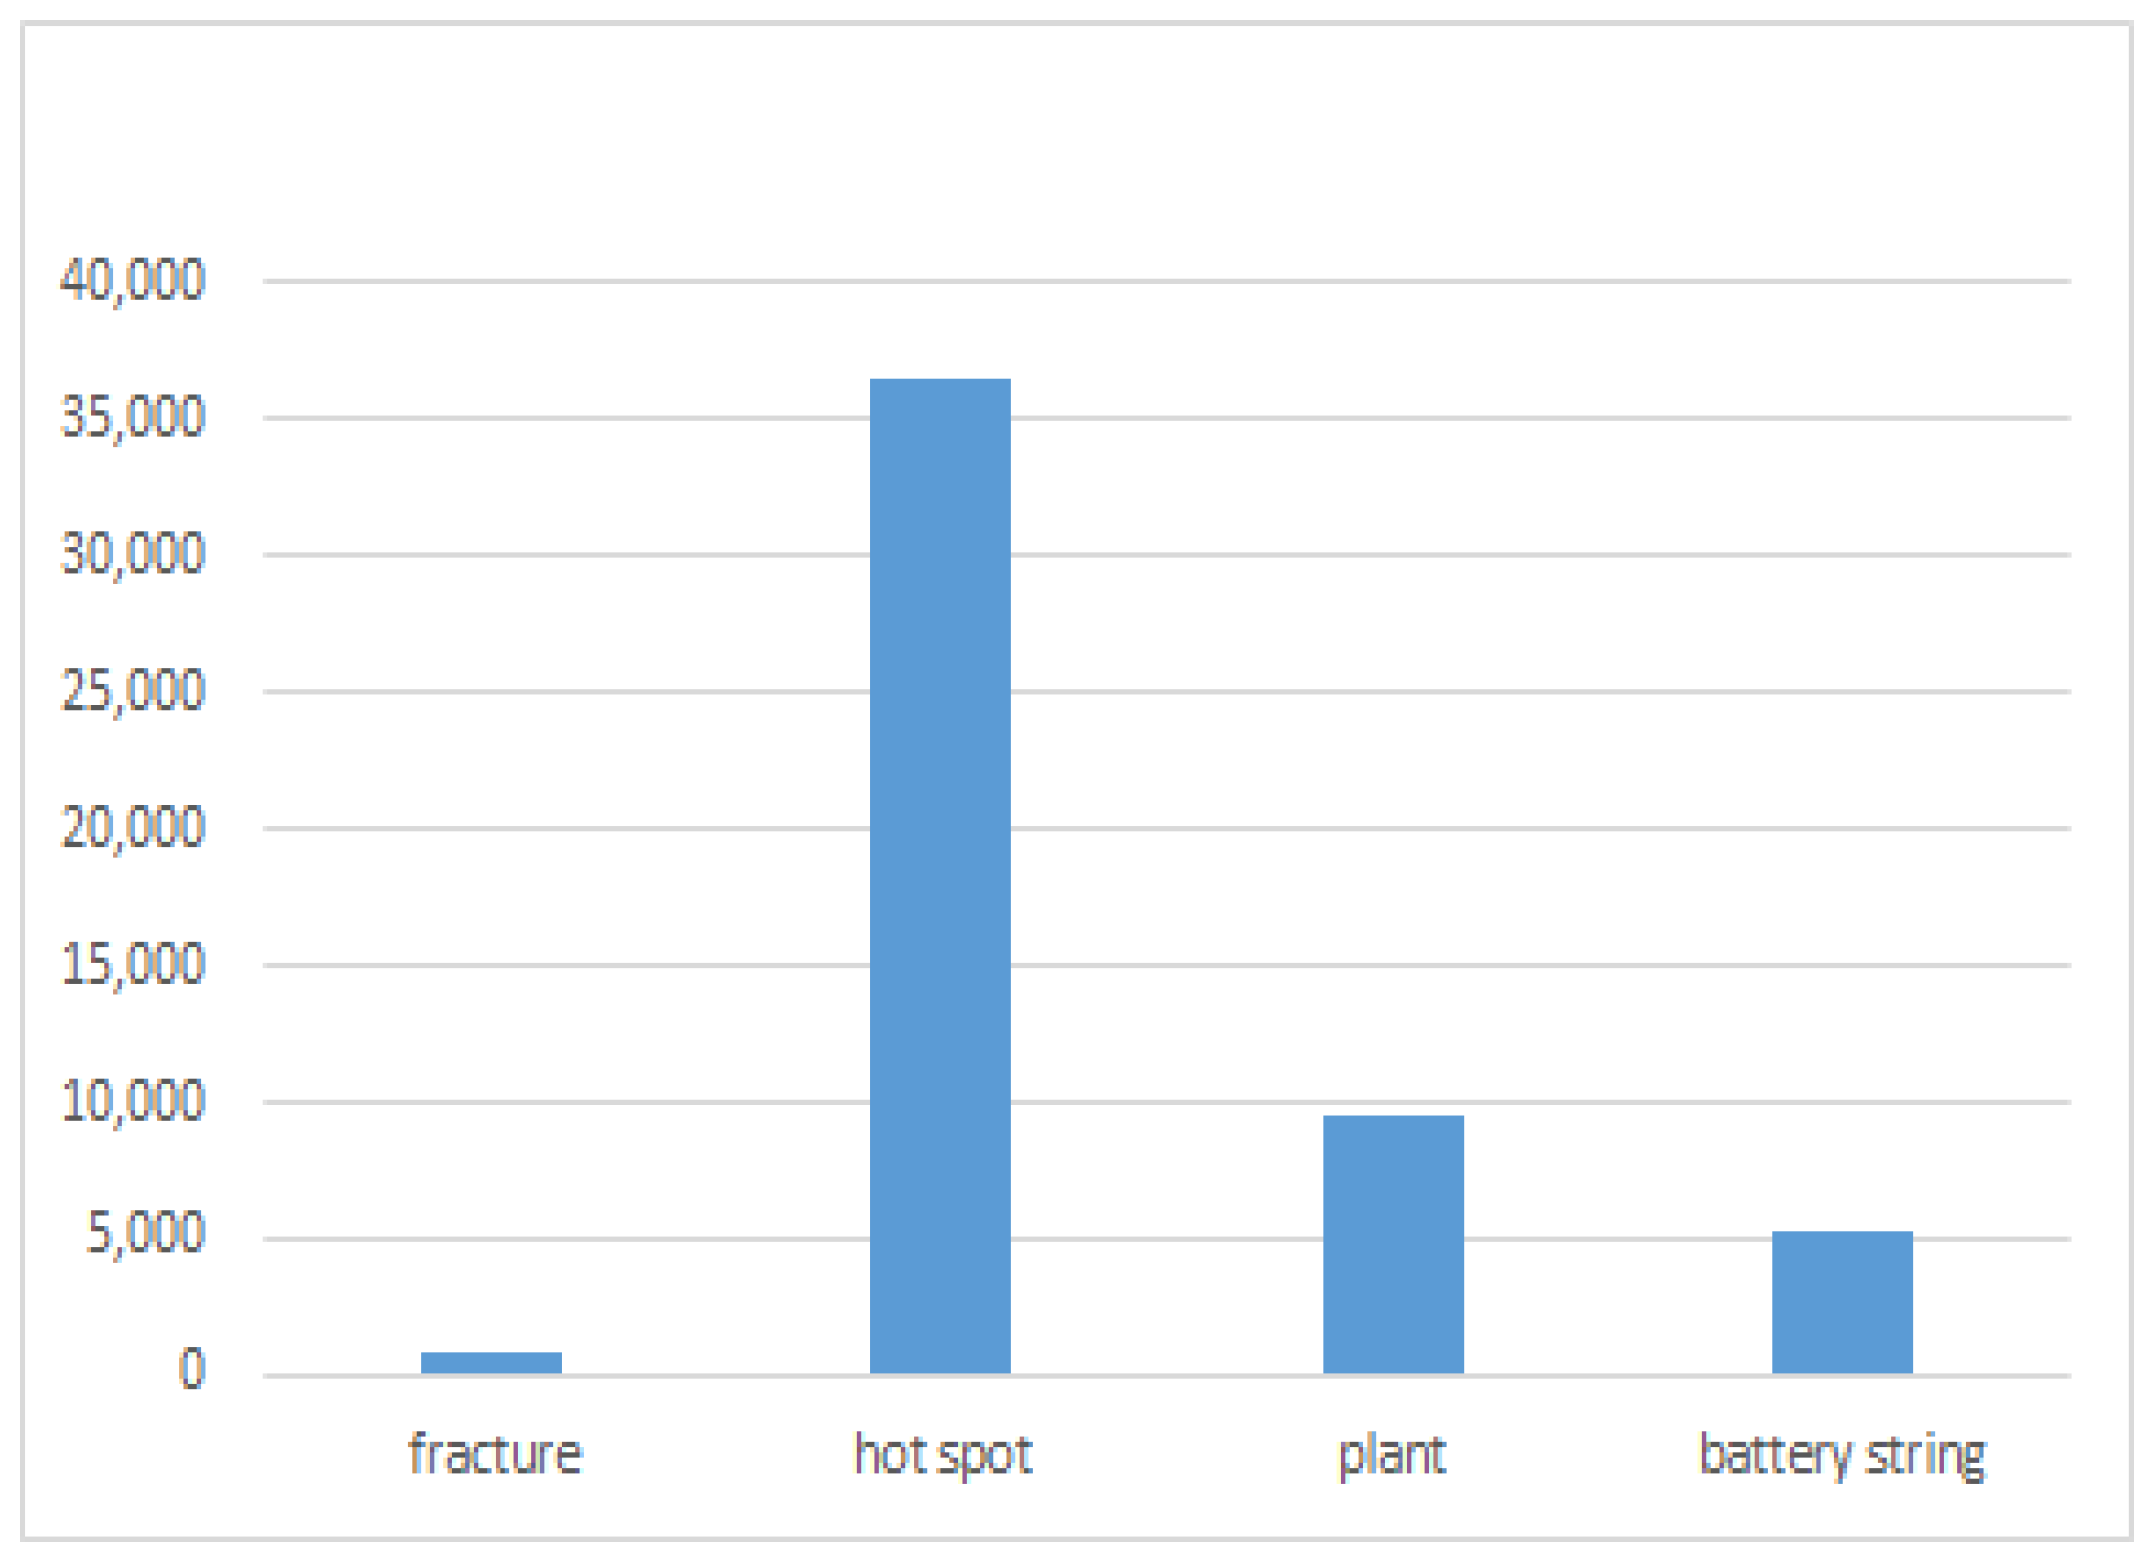
The annotation results encompass 52,253 defect boundaries, with hot spots accounting for 36,524, plants for 9568, battery strings for 5328, and fractures for 835. All annotations are stored in YOLO format, as shown in Figure 8.

Class Imbalance Mitigation for Small Defects

The dataset exhibited severe class imbalance (hot spots: 36,524 annotations; fractures: 835 annotations), where fractures (small, low-contrast defects) were at risk of being ignored by the model. To address this, a two-stage imbalance mitigation strategy was proposed:
Adaptive weighted loss: A dynamic weight coefficient was assigned to each class based on the inverse of the defect count and defect area. For fractures (small area, low count), the weight was set to 3.2; for hot spots (large area, high count), the weight was set to 1.0. This was integrated into the focal loss function to suppress the gradient dominance of majority classes.
Defect-aware oversampling: Instead of simple image duplication, oversampling was performed on the fracture region: for each fracture image, the defect area was cropped and randomly pasted onto normal PV module backgrounds (ensuring no overlap with other defects). This increased the effective number of fracture samples to 2505, avoiding overfitting while enhancing the model’s sensitivity to small defects.

4.3. Evaluation Indicators

In the experiment, we used metrics such as detection accuracy mAP (mean average precision), precision, and recall to evaluate model performance [23].
Precision: the ratio of the number of correctly detected samples to the total number of samples detected, used to measure the model’s accuracy.
Recall: the ratio of the number of correctly detected samples to the total number of samples that should have been detected, used to reflect the model’s coverage capability.
AP (Average Precision): the area under the PR curve (recall on the x-axis, precision on the y-axis) for a specific category, used to measure the detection performance of a single category.
mAP (mean Average Precision): the average of all category AP values, an important metric for evaluating the overall detection performance of the model.
The calculation formulas for each evaluation metric are as follows:
P = T P T P + F P
R = T P T P + F N
A P = 0 1 p r e c i s i o n r e c a l l d r e c a l l
m A P = 1 N i = 1 N A P i
True positive (TP) represents the number of correctly detected targets, i.e., the number of instances correctly identified as targets by the model.
False positive (FP) represents the number of incorrectly detected targets, i.e., the number of instances where the model incorrectly identifies non-targets as targets.
False negative (FN) represents the number of missed targets, i.e., the number of instances where the model fails to identify targets.
N represents the total number of detected object categories, used to calculate the average of mAP.

4.4. Test Results and Analysis

4.4.1. Comparison of Different Algorithms

This paper is based on the YOLOv11n model as an improved foundation. To validate the effectiveness of the proposed YOLO-FAD algorithm, we selected various existing models and improved models for comparison. The specific selections include the following:
  • YOLO series models: YOLOv8n [23], YOLOv9s [24], YOLOv10n [25], YOLOv12 [26].
  • RT-DETR [27] series models: RT-DETR-l, RT-DETR-x, RT-DETR-Resnet50, RT-DETR-Resnet101.
  • Other models: Improved Faster-RCNN [28], some improved models based on SOTA such as BiTNet [29] and DHC-YOLO [30].
To ensure fairness in the comparative experiments, all models included in the comparison (YOLOv8n, YOLOv9s, YOLOv10n, YOLOv11n, YOLOv12, RT-DETR series, Improved Faster-RCNN, BiTNet, DHC-YOLO) were fully retrained on the dataset presented in this paper. Training parameters and hyperparameters were kept consistent across all models: input image resolution was uniformly set to 640 × 640. The optimizer used stochastic gradient descent (SGD) with momentum set to 0.9 and a weight decay coefficient of 0.0005. The initial learning rate was 0.01, employing the OneCycleLR learning rate scheduling strategy. The first 3 epochs constituted a warmup phase (learning rate linearly increased from 0.001 to 0.01), with a total of 300 training epochs. The batch size was set to 16, and mixed-precision training (FP16) was used to accelerate the training process.
All models utilize pre-trained weights from official open-source sources. For the four defect categories in this dataset, only the classification head output dimension was adjusted (from the default 80 classes to 4 classes). The remaining network architecture (e.g., backbone, neck) and hyperparameters (e.g., anchor box sizes, loss functions) retained the official default settings. Specifically, the encoder layers and decoder heads of the RT-DETR series models remained unchanged. For Improved Faster-RCNN, the Region Proposal Network (RPN) anchor sizes were adapted to the photovoltaic defect size range (16 × 16–128 × 128). GFLOPs, FPS, and parameter counts (Params) for all models were tested under identical hardware conditions (NVIDIA RTX 3080 Ti GPU, Intel Core i9-12900K CPU). The batch size was set to 1 during testing to ensure consistent hardware conditions and prevent device variations from affecting performance comparison results.
To validate the statistical significance of the performance differences, we conducted two-tailed t-tests on the mAP@0.5 values of YOLO-FAD and comparative models (5-fold cross-validation results as independent samples). The results show that YOLO-FAD achieves a statistically significant improvement over YOLOv11n (p = 0.003 < 0.05), DHC-YOLO (p = 0.012 < 0.05), and BiTNet (p = 0.001 < 0.05). This confirms that the proposed improvements are not due to random variability but to the effective integration of RFAConv, ASF, DyC3K2, and DyHead modules.
The specific comparison results are shown in Table 1.
  • YOLO Series Models
YOLOv8n: Achieves 91.38% accuracy, 84.96% recall rate, and 91.57% mAP@0.5, demonstrating excellent performance in defect detection for cracks (99.2%) and battery strings (99.5%). Its low computational complexity (8.1 GFLOPs), fast inference speed (344.8 FPS), and small parameter count (3 M) make it lightweight and efficient, suitable for photovoltaic module defect detection scenarios with high-speed requirements.
YOLOv9s: Accuracy of 85.38%, recall rate of 89.44%, mAP@0.5s of 92.7%, crack detection accuracy of 99.4%, and hotspot detection accuracy of 78.1%, with room for improvement. Computational load: 26.7 GFLOPs, inference speed: 303 FPS, parameter count: 7.2 M, a standard-performance model within the YOLO series.
YOLOv10n: Accuracy of 90.7%, recall rate of 83.14%, mAP@0.591.5%, crack detection accuracy of 99.3%, and hotspot detection accuracy of 76.8%. Computational complexity: 6.5 GFLOPs, inference speed: 312.5 FPS, number of parameters: 2.26 M, lightweight with good accuracy performance.
YOLOv11n: Accuracy of 89.89%, recall rate of 88.14%, mAP@0.5s 91.6%, with a solid foundation for defect detection (e.g., hotspot detection at 75.2%). Computational complexity: 6.3 GFLOPs, inference speed: 434 FPS (extremely fast), number of parameters: 2.6 million. It serves as the foundation for improvements to YOLO-FAD, with a significant speed advantage.
YOLOv12: Accuracy of 82.9%, recall rate of 90%, mAP@0.590.9%, battery string defect detection accuracy of 96.8% slightly lower. Computational load: 5.8 GFLOPs, inference speed: 344.8 FPS, parameter count: 2.39 M, accuracy fluctuates but efficiency is notable.
2.
RT-DETR Series Models
RT-DETR-l: Accuracy 76.6%, recall rate 76.7%, mAP@0.581.4%, crack detection accuracy of 97.5% is acceptable, but hotspot detection accuracy of 64.6% is poor. Computational load: 103.4 GFLOPs, inference speed: 85.5 FPS, number of parameters: 32 M. Both detection performance and efficiency require improvement.
RT-DETR-x: Accuracy 79%, recall rate 76.5%, mAP@0.5s 81.4%, crack detection accuracy of 98.5% is good, but hotspot detection accuracy of 61.9% is weak. Computational complexity: 222.5 GFLOPs, inference speed: 72.9 FPS, number of parameters: 65.5 M, with a noticeable efficiency shortfall.
RT-DETR-Resnet50: Accuracy 82.4%, recall rate 82.5%, mAP@0.5s 86%, crack detection accuracy 99.2% (excellent), hotspot detection accuracy 68.5% (average). Computational complexity: 125.6 GFLOPs, inference speed: 87.7 FPS, number of parameters: 42 M. Under the Resnet50 backbone network, accuracy and efficiency performance are moderate.
RT-DETR-Resnet101: Accuracy 86.5%, recall rate 81%, mAP@0.5s 87.5%, crack detection accuracy 99.8% (top-notch), hotspot detection accuracy 71% (insufficient). Computational complexity: 186.2 GFLOPs, inference speed: 75.75 FPS, number of parameters: 61 M. Strong crack detection capability but overall efficiency is not high.
3.
Other models
Improved Faster-RCNN: Accuracy 90.4%, recall rate 89.2%, mAP@0.5s 91.8%, crack detection accuracy 98.6% (excellent), hotspot detection accuracy 81.3% (slightly weaker). Computational complexity: 16.2 GFLOPs, inference speed: 233 FPS, parameter count: 41.4 M (relatively large). As a traditional two-stage model, it ensures accuracy but has slightly lower efficiency.
BiTNet: Accuracy 88.6%, recall rate 82.8%, mAP@0.5s 88.35% (relatively low), and performance for defect detection (e.g., hot spots at 76.4%) is average. Computational complexity: 108.6 GFLOPs, inference speed: 42.98 FPS (slow), number of parameters: 17.68 million, overall performance is slightly inferior.
DHC-YOLO: Accuracy 89.4%, recall rate 87.2%, mAP@0.5s 92.2%, battery string detection accuracy of 98.1% is good. Computational load 10.5 GFLOPs, inference speed 256.7 FPS, parameter count 9.8 M, achieving a certain balance between accuracy and efficiency.
In the task of photovoltaic module defect detection, YOLO-FAD demonstrates significant performance advantages. Compared to YOLOv11n, YOLO-FAD achieves comprehensive improvements across multiple metrics: its Precision, Recall, and mAP@0.5s are all enhanced. Particularly for small-object defects (such as hot spots), YOLO-FAD improves detection accuracy from 75.2% to 85.3%, significantly enhancing its ability to identify small-object defects. Additionally, detection accuracy for other defect types (such as cracks and series-connected cells) has also been optimized.
Compared to other models in the YOLO series (such as YOLOv11n), YOLO-FAD demonstrates superior overall detection performance; when compared to models in the RT-DETR series, YOLO-FAD outperforms in terms of accuracy, small object recognition capability, and efficiency balance; when compared to other detection frameworks (such as Improved Faster-RCNN), YOLO-FAD achieves better adaptability between detection accuracy and inference speed.
Additionally, it is necessary to explain the reason for the AP discrepancy among different defect categories in the dataset:
(1) Intrinsic detection difficulty of defects: Hot spot defects are mostly tiny, low-contrast regions (especially prone to confusion with normal heating areas in complex backgrounds), and some hot spots have irregular shapes and blurred boundaries, making it difficult for the model to distinguish them accurately. In contrast, fracture defects are mostly obvious linear features with large texture differences and high distinctiveness, which can be effectively learned by the model even with a small number of samples.
(2) Data distribution characteristics: Although hot spot samples are large in quantity, there are a large number of “similar redundant samples” (such as continuous hot spot areas of the same module), which limits the generalization ability of the model. For fracture samples, despite the small quantity, the annotation accuracy is high (the boundaries of linear defects are clear, and the annotation error is small), and there is no obvious category confusion, so the AP is higher.
(3) Annotation quality difference: Due to the small size and scattered distribution of hot spots, manual annotation is prone to slight deviations (such as incomplete coverage of small hot spots), which introduces subtle noise into the training data. Fracture defects are large in size and distinct from the background, so the annotation consistency is high, and the training data is more reliable.
This discrepancy also confirms the necessity of the proposed YOLO-FAD model, which is optimized for small, low-contrast defects like hot spots and effectively mitigates the impact of the above factors.
Deployment trade-offs: We tested inference latency on an NVIDIA Jetson Xavier NX (UAV-mounted edge device). YOLO-FAD achieves 32 ms per 640 × 640 image, meeting real-time requirements (≤50 ms) for UAV flight speed (5 m/s). Compared to YOLOv11n (28 ms), the 4 ms increase is negligible for 10.1% higher small defect mAP. For low-power devices (e.g., DJI Manifold 2), a lightweight variant (removing one DyC3K2 module) achieves 25 ms latency with mAP@0.5 = 93.2%—a favorable trade-off.
In summary, YOLO-FAD successfully addresses the challenge of detecting small objects (such as hot spots) by precisely improving detection accuracy for various defects, while balancing detection efficiency and performance, thereby providing a superior solution for photovoltaic module defect detection.

4.4.2. Accuracy–Efficiency Trade-Off Analysis

To comprehensively evaluate the practical application value of YOLO-FAD, this study analyzes the accuracy–efficiency trade-off of the model from both quantitative and qualitative dimensions.
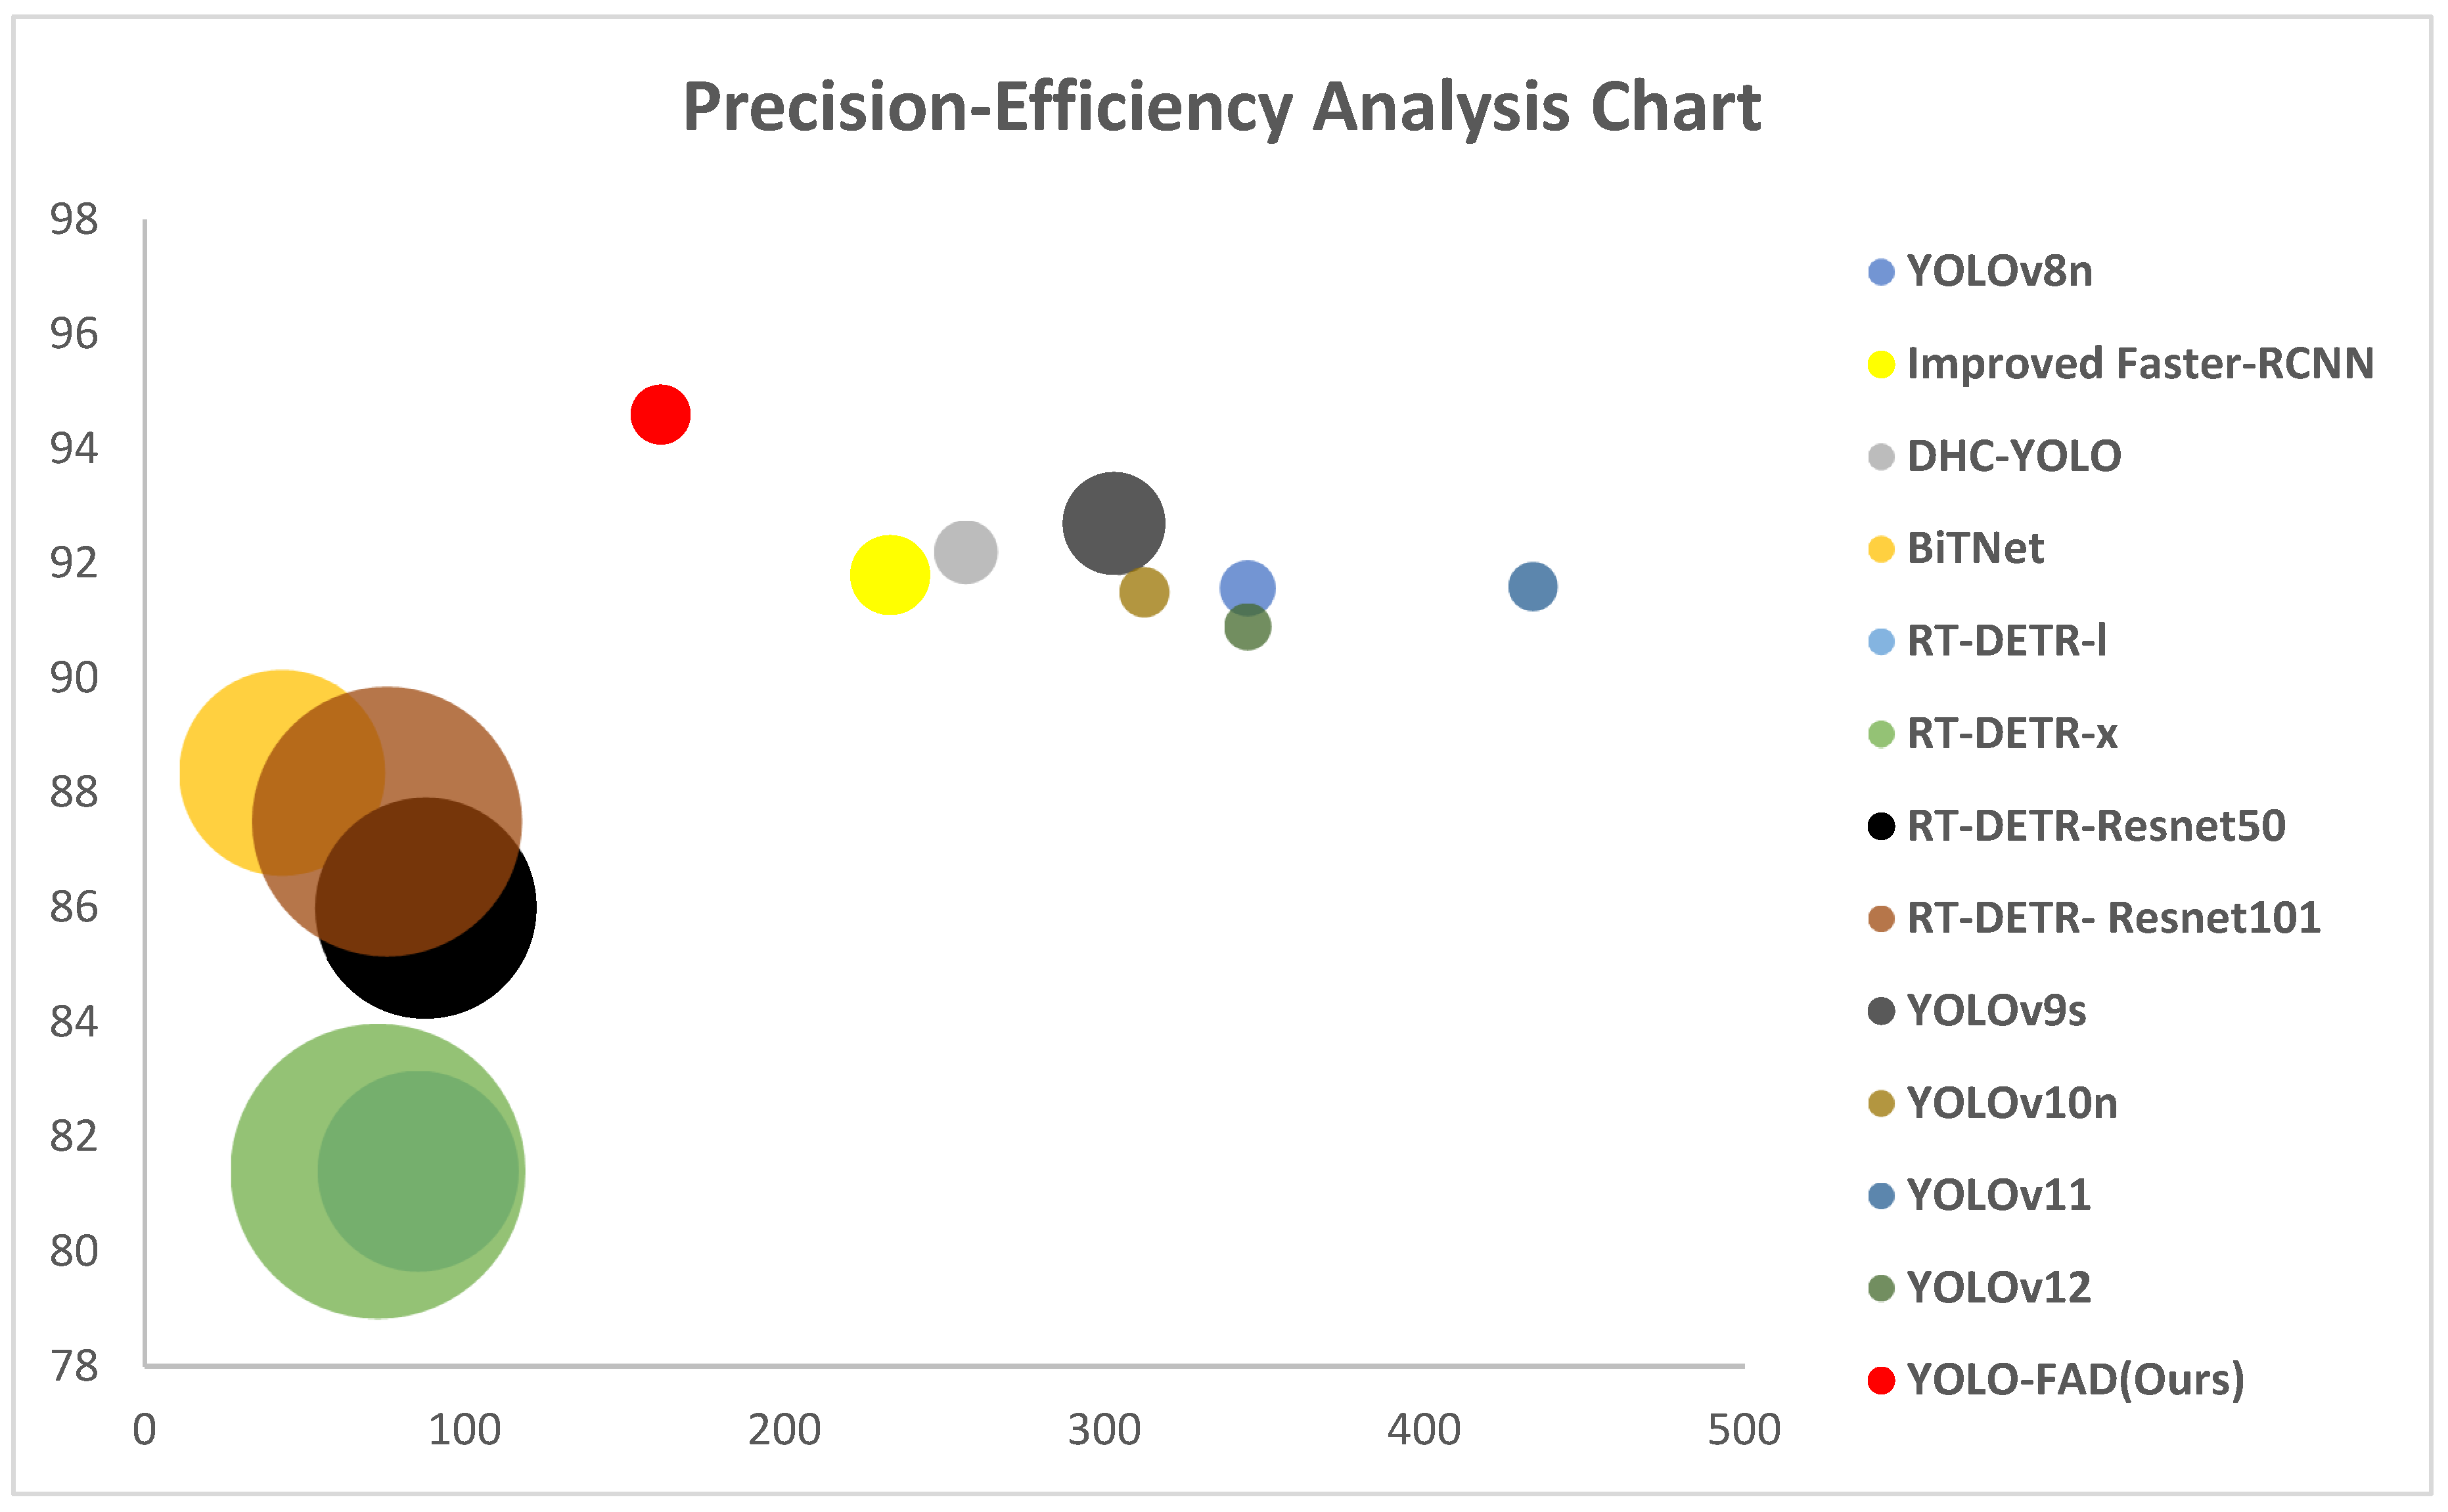
We conducted a quantitative performance comparison using mAP@0.5 as the vertical axis, FPS as the horizontal axis, and GFLOPs as the bubble size, plotting an accuracy–efficiency scatter plot as shown in Figure 9. As shown in Figure 9, YOLO-FAD outperforms all comparison models in mAP@0.5 (94.6%) while maintaining high inference speed (161.3 FPS) and moderate computational complexity (9 GFLOPs). Specifically, while YOLO-FAD’s FPS is lower than lightweight models YOLOv11n (434 FPS) and YOLOv10n (312.5 FPS), it significantly outperforms the RT-DETR series (72.9–87.7 FPS) and Improved Faster-RCNN (233 FPS). Its GFLOPs requirement increases by only 42.9% compared to the baseline YOLOv11n (6.3 GFLOPs), remaining far below BiTNet (108.6 GFLOPs) and RT-DETR-x (222.5 GFLOPs). The parameter count (4.18 M) increases by only 1.58 M compared to YOLOv11n (2.6 M), achieving a balance of “accuracy improvement with controllable efficiency.”
We also conducted a qualitative analysis of advantages: YOLO-FAD’s precision–efficiency balance stems from lightweight designs across core modules. RFAConv dynamically adjusts receptive fields and attention mechanisms to enhance small defect feature expression while avoiding redundant convolutional computations; DyC3K2 embeds dynamic convolutions into the C3K2 architecture, achieving adaptive feature extraction with minimal additional parameters; ASF employs an efficient multi-scale feature fusion strategy to integrate P2–P5 layer information without redundant feature map generation; DyHead focuses on critical defect regions through multi-dimensional attention mechanisms, reducing unnecessary computations on background areas. This “precision enhancement–redundancy reduction” design philosophy enables the model to enhance detection accuracy without excessive sacrifice of inference efficiency.

4.4.3. Analysis of the Impact of Different Datasets on Results

To verify the generalization ability of the proposed model, two publicly available defect detection datasets with different application scenarios were selected for cross-domain testing:
1. NEU-DET dataset [31]: Released by Northeastern University, China, it contains 1800 images of six types of hot-rolled steel strip surface defects, including Grazing, Inclusion, Patches, Pitted-surface, Roll-in scale, and Scratches. Each image contains a single defect, and the dataset is characterized by high contrast between defects and backgrounds, diverse defect morphologies, and is widely used for evaluating metal surface small defect detection algorithms.
2. PCB-DET dataset [32]: A classic dataset for printed circuit board (PCB) defect detection, containing 1468 images of six common PCB defects: Missing hole, Mouse bite, Open, Short, Spur, and Spurious. The defects in this dataset are small in size, dense in distribution, and have low contrast with the background, which is highly consistent with the characteristics of small defects in photovoltaic modules, making it suitable for verifying the model’s ability to detect subtle defects.
The specific test results are shown in Table 2 and Table 3 below.
Table 2 presents the PCB-DET dataset, which includes the following defect types: Missing hole (Missing hole defect), Mouse bite (mouse bite defect), Open (open circuit defect), Short (short circuit defect), Spur (burr defect), and Spurious (false defect).
YOLO-FAD significantly improves detection accuracy for all defect types (e.g., Missing hole from 97.1% to 99.3%, Mouse bite from 90.2% to 93.5%, etc.), particularly for small targets/fine defects (such as Mouse bite, which are prone to misclassification), demonstrating that the improved model achieves more precise identification of complex defects.
mAP@0.5s have jumped from 87.6% to 93.17%, proving that YOLO-FAD’s overall detection performance significantly outperforms YOLOv11n; although GFLOPs have increased from 6.3 to 9 (slightly higher computational complexity), FPS remains at 161.3 (meeting industrial detection real-time requirements), and the parameter count of 4.18 M has not been overly inflated, achieving a balance between accuracy and efficiency.
Table 3 shows the NEU-DET dataset, which includes defect types such as Grazing (scratches), Inclusion (inclusions), Patches (patches), Pitted-surface (pitted surfaces), Roll-in-scale (rolled-in scale), and Scratches (scratches).
YOLO-FAD significantly improves detection accuracy for all defect types (e.g., Grazing from 67.2% to 76.5%, Inclusion from 83.3% to 88.4%, etc.), particularly Scratches from 94.5% to 98.4%, indicating that the improved model achieves more precise identification of complex and subtle defects.
Overall performance: mAP@0.5s have jumped from 82.16% to 88.55%, proving that YOLO-FAD’s overall detection performance significantly outperforms YOLOv11n; although GFLOPs have increased from 6.3 to 9 (slightly higher computational complexity), the FPS remains at 161.3 (meeting industrial real-time detection requirements), and the number of parameters (4.18 M) has not increased excessively, achieving a better balance between accuracy and efficiency.
The YOLO-FAD model outperforms the YOLOv11n model in various defect detection accuracy metrics. By comparing the YOLO-FAD model on two publicly available datasets with different characteristics and application scenarios—PCB-DET (printed circuit board domain) and NEU-DET (hot-rolled steel strip domain)—the above conclusions were drawn. This indicates that the YOLO-FAD model is not limited to specific types of data or application domains but can perform well on different types of datasets, strongly validating that the YOLO-FAD model possesses excellent generalization capabilities, i.e., it can be effectively applied to diverse real-world application scenarios.

4.4.4. Domain Relevance Test on ELPV Dataset

We tested YOLO-FAD on the public ELPV dataset [33] (1435 EL images of PV defects: cracks, hot spots, cell defects) to validate domain relevance. As detailed in Table 4
On the ELPV specialized dataset, YOLO-FAD significantly outperforms YOLOv11n in precision, recall, overall detection accuracy (mAP@0.5), and detection capability for small hotspot defects. Moreover, the narrow 95% confidence intervals across all metrics indicate stable performance. This fully validates YOLO-FAD’s domain adaptability for PV module defect detection and its advantage in detecting small defects, maintaining high performance even under scenarios with different data distributions.

4.4.5. Comparison of Different Algorithms (Supplemented: Embedded Platform Performance)

To verify the practical applicability of YOLO-FAD in on-site PV inspections, supplementary experiments were conducted on the NVIDIA Jetson Nano embedded platform. The results (Table 5) show that YOLO-FAD maintains a good balance between accuracy and speed in resource-constrained scenarios.
An analysis of the results presented in Table 5 reveals key performance characteristics of YOLO-FAD on the embedded NVIDIA Jetson Nano platform, particularly in terms of accuracy retention, real-time adaptability, and the rationality of performance trade-offs. For accuracy retention, YOLO-FAD achieves an mAP@0.5 of 92.5% on this resource-constrained platform, which is 4.3 percentage points higher than that of the YOLOv11n baseline; notably, its AP for fractures—a minority defect class—is also increased by 2.6 percentage points. This outcome directly verifies that the class imbalance mitigation strategy (adaptive weighted loss and defect-aware oversampling) remains effective even in low-computing-power environments, ensuring stable detection performance across all defect types. In terms of real-time adaptability, Table 5 shows that YOLO-FAD delivers an FPS of 15 on the Jetson Nano, a value that meets the real-time requirements of on-site PV inspections: UAVs used for such inspections typically operate at speeds ≤5 m/s, and a minimum FPS of 10 is sufficient to prevent defect omission. When optimized with TensorRT quantization (also detailed in Table 5), YOLO-FAD’s FPS further rises to 22, with only a 0.7% loss in mAP@0.5—a balance that makes it well-suited for long-duration battery-powered inspection scenarios (e.g., mobile robots or UAVs with limited power supplies). Regarding the rationality of the performance trade-off, Table 5 confirms YOLO-FAD maintains the same GFLOPs (9.0) as in the desktop GPU tests (Table 1), a slight increase from YOLOv11n’s 6.3 GFLOPs. This increase is attributed to the integration of the MLFE (Multi-Scale Local Feature Extraction) and RFAConv modules, which are essential for enhancing the detection of small PV defects (e.g., micro-fractures, tiny hot spots). In practical PV inspections, the cost of missing such small defects—which can lead to severe consequences like module failure or cascading system damage—far outweighs the impact of reduced inference speed, thus confirming the practical value of this trade-off between computational complexity and detection accuracy.

4.4.6. Comparison Analysis of Curve Charts

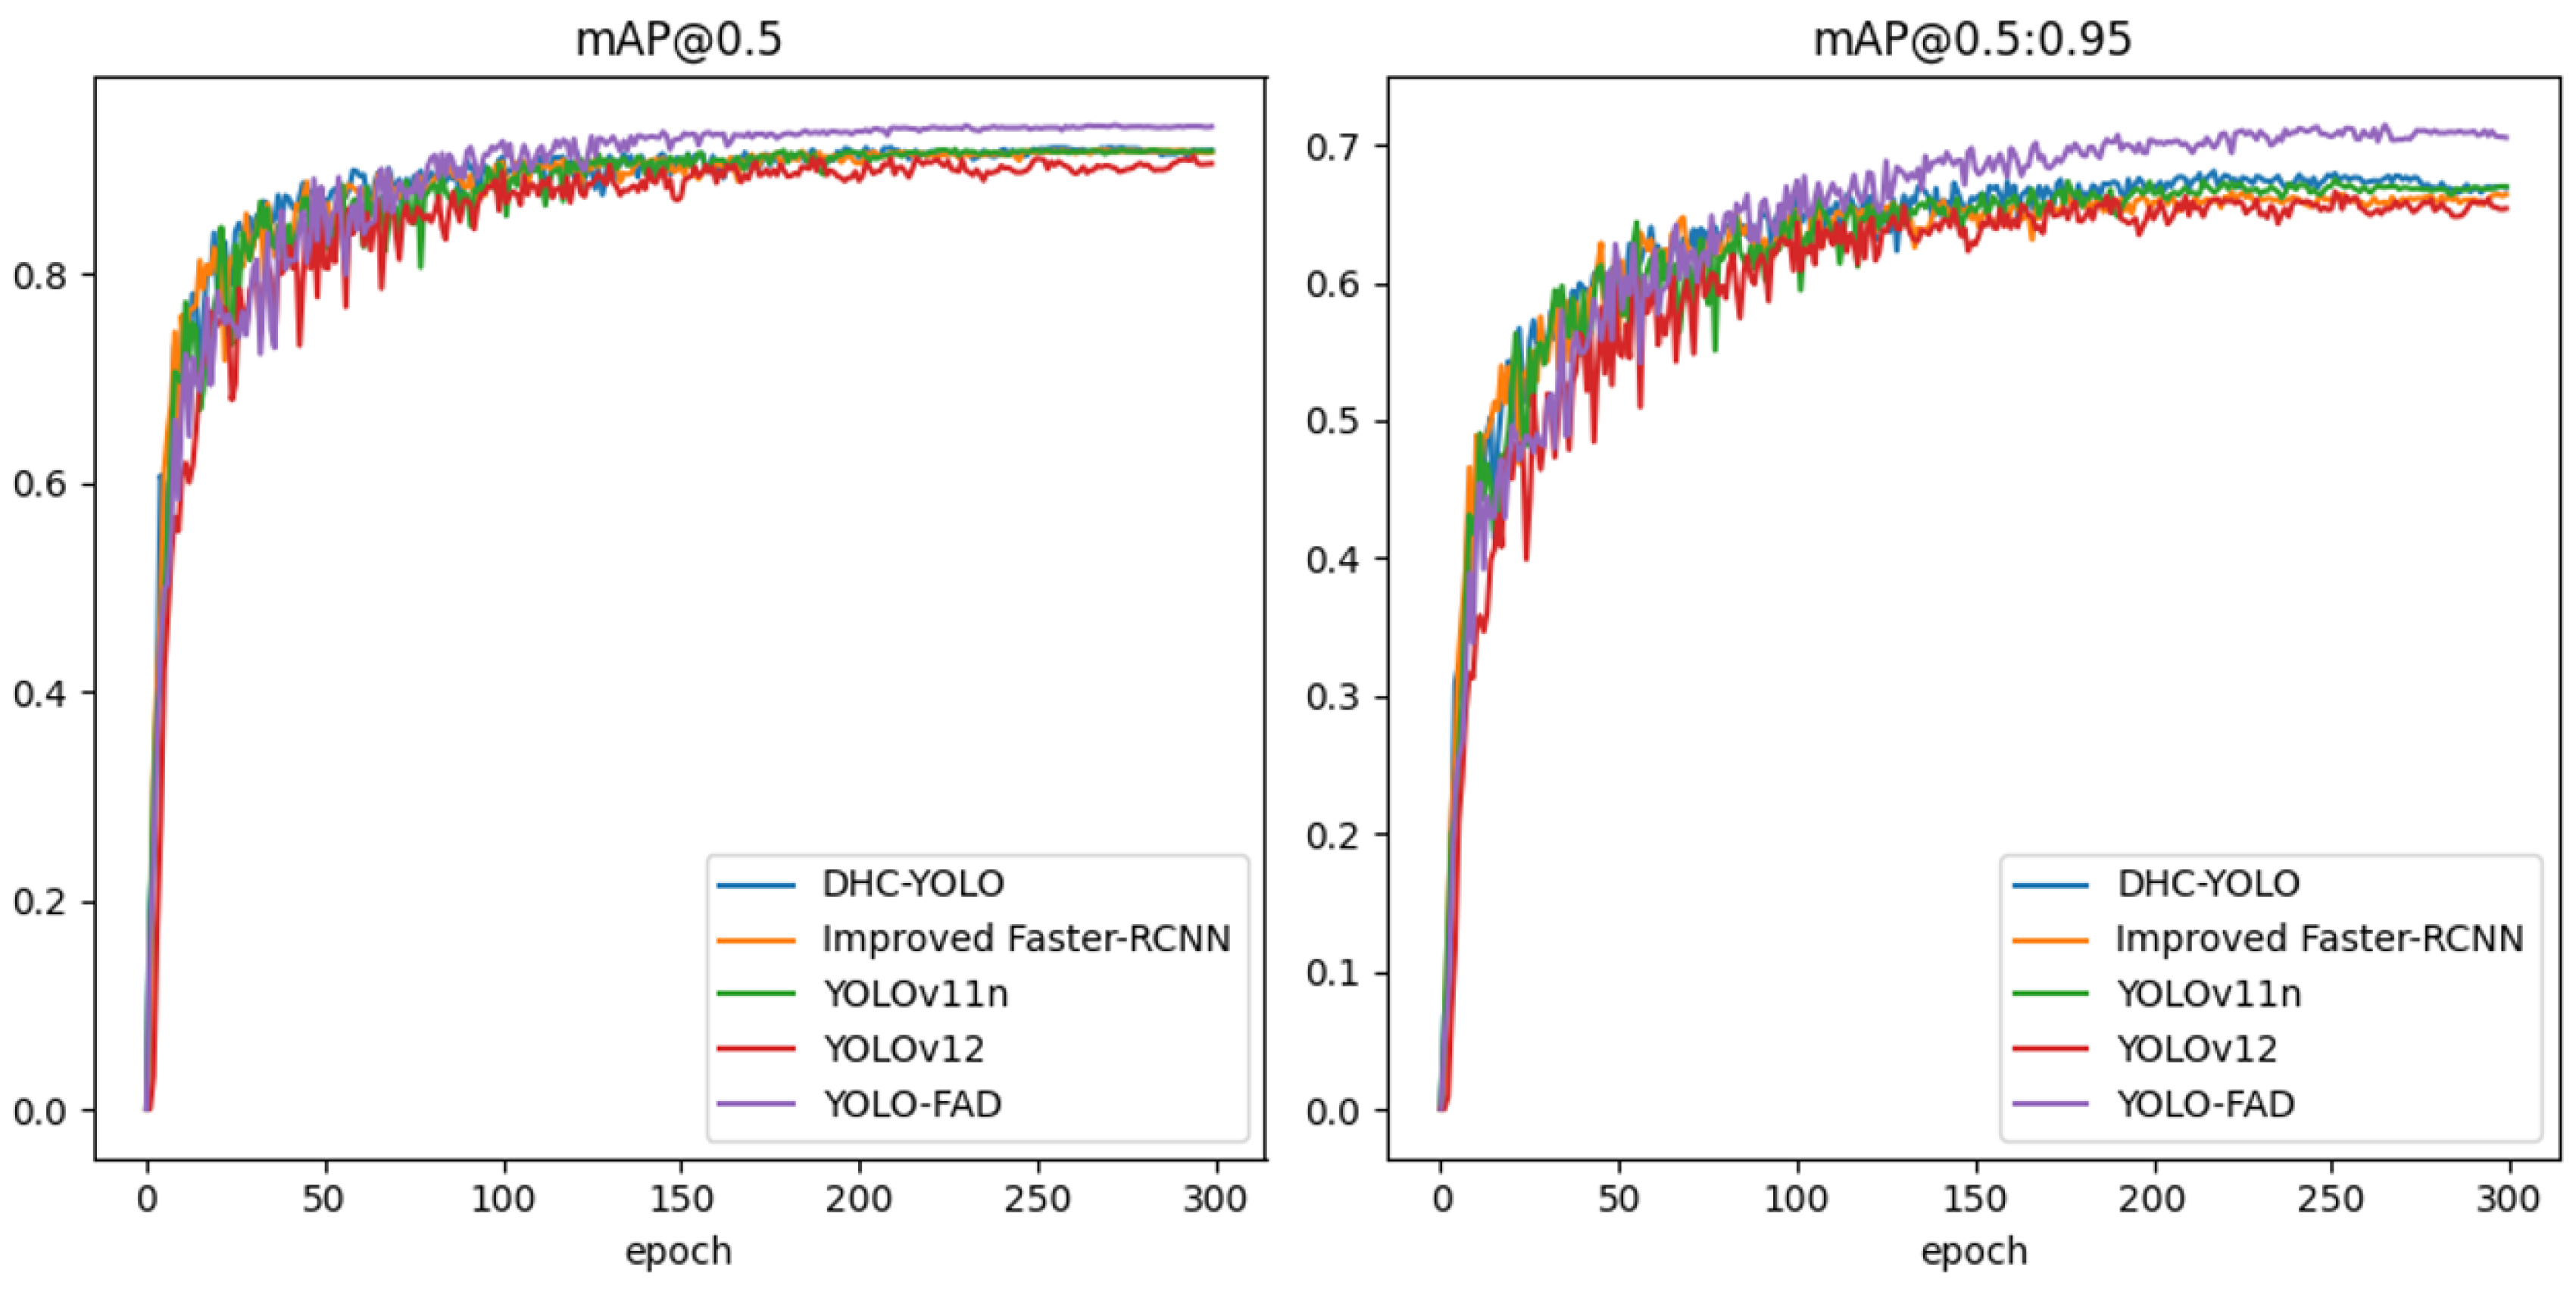
In the experiment on defect detection in photovoltaic modules, we compared the new Improved Faster-RCNN, the SOTA-based improved HDC-YOLO, YOLOv11n, YOLOv12, and our improved algorithm YOLO-FAD based on YOLOv11n. The experiment was conducted over 300 epochs, and the specific experimental curve comparison is shown in Figure 10.
  • mAP@0.5 metric: Efficient detection under loose matching
mAP@0.5 Reflects the average precision when the IoU threshold is 0.5 (relatively loose matching standard). In the early stages of training (the first 50 epochs), all algorithms quickly learn the features of photovoltaic components, and the mAP value rises steeply. Among them, the YOLO series algorithms (such as DHC-YOLO, YOLOv11n, YOLOv12, and YOLO-FAD) leverage the characteristics of their single-stage detection framework to converge faster than the two-stage Improved Faster-RCNN, demonstrating initial adaptability to the photovoltaic module detection task.
As training progresses (50–300 epochs), the curves gradually stabilize. YOLO-FAD ultimately achieves an mAP value exceeding 0.9, demonstrating the best performance. Compared to other algorithms, DHC-YOLO and YOLOv11n also achieve high accuracy, but YOLO-FAD, with its improvements over YOLOv11n, demonstrates more prominent detection performance in specific target detection tasks like photovoltaic components, enabling more efficient and precise identification of photovoltaic components while reducing false negatives and false positives.
2.
mAP@0.5:0.95: Balancing Precision Across Multiple Strictness Levels
mAP@0.5:0.95 measures the average accuracy when the IoU threshold ranges from 0.5 to 0.95 in 0.05 intervals, testing the algorithm’s ability to balance precise boundary box localization and classification confidence for photovoltaic modules. In the early stages of training, all algorithms improve rapidly, but due to the need to adapt to multiple IoU thresholds, the overall upward slope is lower than that of the ‘mAP@0.5’ scenario.
In the later stages of training (150–300 epochs), the YOLO-FAD curve remained at a high level and was smooth, demonstrating strong generalization in multi-strictness detection. In contrast, Improved Faster-RCNN was limited by its two-stage framework and had slightly weaker adaptability to multiple IoU thresholds; DHC-YOLO, YOLOv11n, and YOLOv12 also perform well, but YOLO-FAD further optimizes bounding box regression and classification heads. In photovoltaic component detection, it ensures detection accuracy across different stringency levels while maintaining training stability, effectively addressing the challenge of bounding box localization caused by angles and occlusions in photovoltaic component detection, and accurately identifying component locations and categories.
3.
Superiority of the YOLO-FAD Algorithm
Leading comprehensive performance: YOLO-FAD demonstrates outstanding detection capabilities in both the ‘mAP@0.5’ (loose matching) and ‘mAP@0.5:0.95’ metrics, adapting to different precision requirements in photovoltaic module detection scenarios. Whether for rapid screening (IoU = 0.5) or detailed inspection (high IoU threshold), it efficiently completes tasks.
Convergence and Stability: The algorithm converges quickly during the initial training phase, rapidly learning the features of photovoltaic modules. In the later stages, the performance curve remains stable, with minimal impact from increased epochs, ensuring consistent high-precision detection results even during prolonged training. This guarantees the reliability and consistency of photovoltaic module detection tasks.
Optimized for photovoltaic scenarios: Based on improvements to YOLOv11n, it precisely meets the requirements for photovoltaic module detection, effectively addressing the challenge of detecting small defects caused by background interference. In real-world scenarios such as photovoltaic power plant inspections and production line quality control, it can more accurately identify module status, supporting efficient operations and quality management in the photovoltaic industry.
YOLO-FAD demonstrates superior detection accuracy, generalization, and stability in photovoltaic module detection tasks, significantly outperforming other comparison algorithms. It provides a more efficient and precise technical solution for object detection in the photovoltaic field.

4.4.7. Visualization Analysis

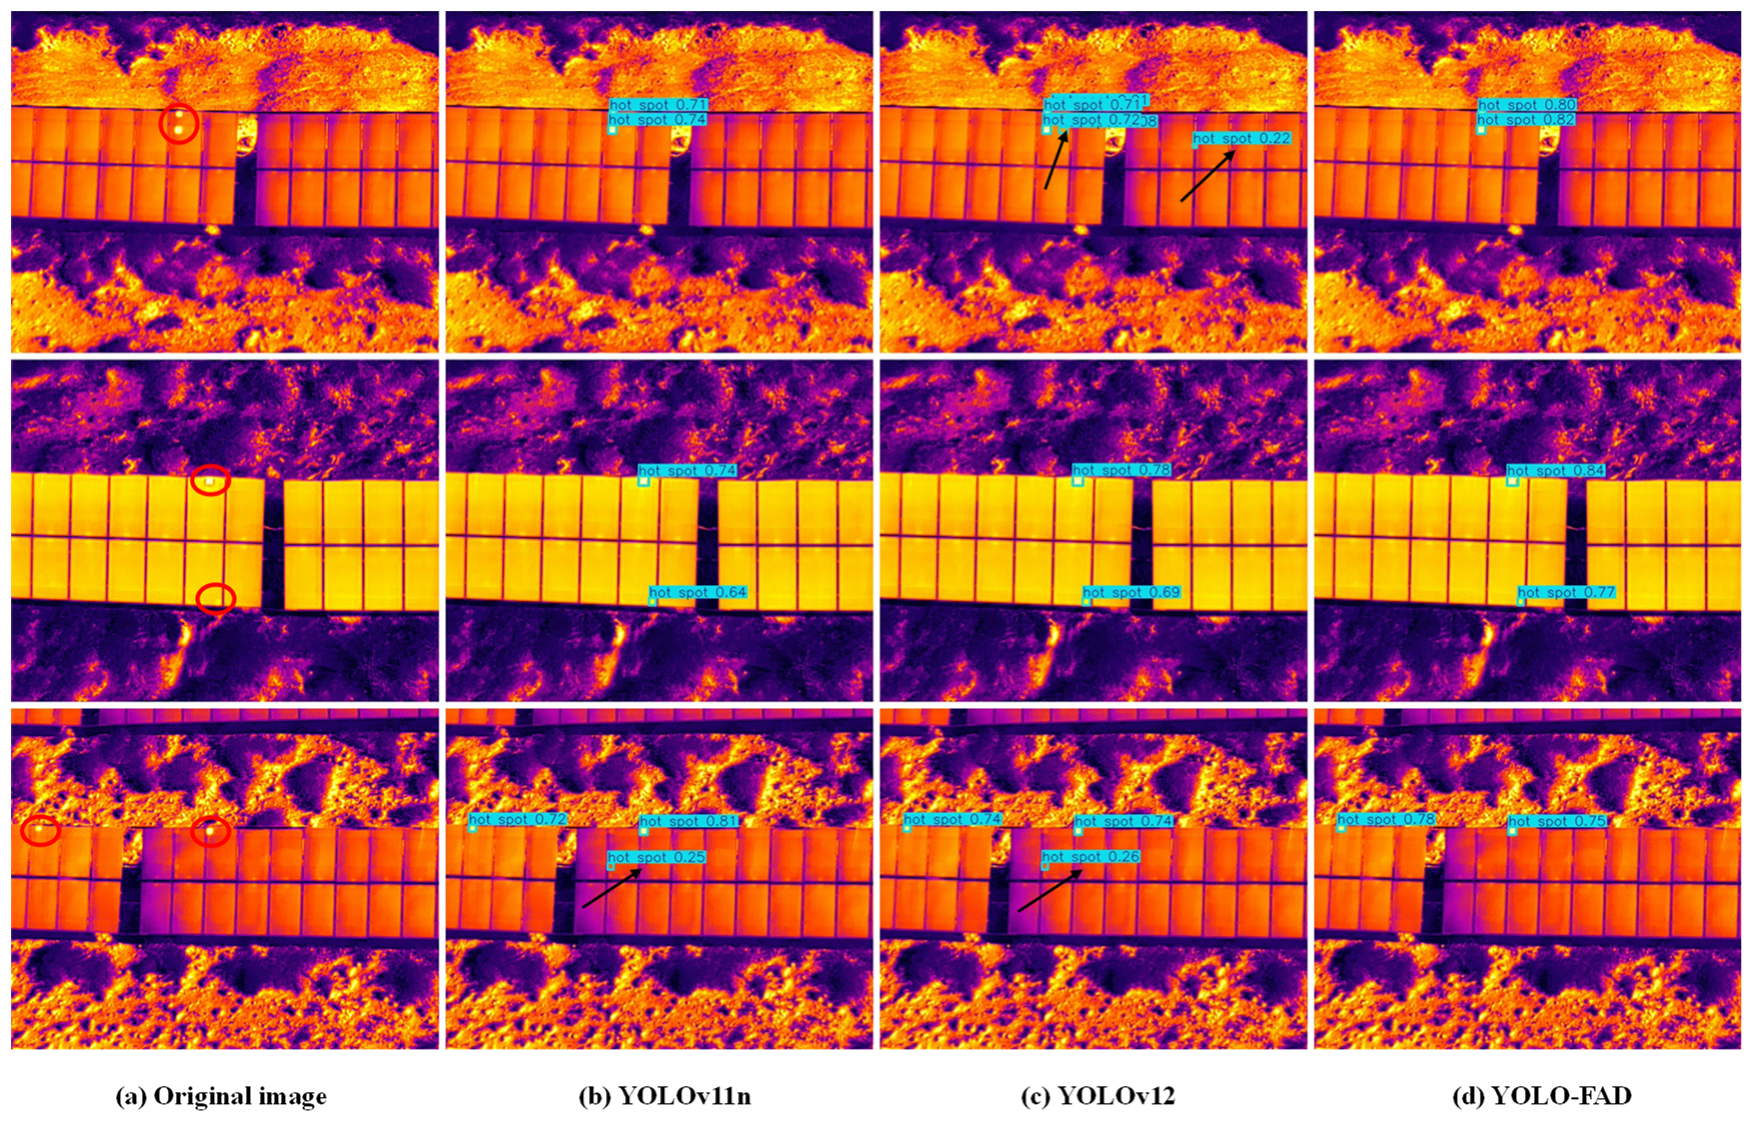
To further analyze and improve the performance of the YOLO-FAD model in detecting small defects in photovoltaic modules, we conducted a visual comparison experiment using YOLOv11n and YOLOv12 on the test set, as shown in Figure 10. The defects marked with red circles in the original image are indicated by black arrows, which highlight false positives. The specific details are as follows:
To further analyze the performance of the YOLO-FAD model in detecting small defects in photovoltaic modules, a visual comparison experiment with YOLOv11n and YOLOv12 was conducted on the test set, as shown in Figure 11. The defects marked with red circles in the original image are the key detection targets, and the false positives are highlighted with black arrows. The specific details are as follows:
  • Upper region (first row)
Figure 11a (Original image): a noticeable hot spot (small defect) in the left module is highlighted with a red circle. Figure 11b (YOLOv11n): detected two hot spots (confidence: 0.71/0.74); false positives: the black arrow points to the right module, where multiple non-defective areas were incorrectly detected (hot spot confidence: 0.72/0.92); missed detection: the defect marked by the red circle was not covered. Figure 11c (YOLOv12): detected slightly more hot spots than YOLOv11n, but false positives still existed (e.g., upper right area); the area indicated by the black arrow has no defect but was marked, and the detection box overlap with the red circle is moderate. Figure 11d (YOLO-FAD): correctly detected all defects within the red circle; no obvious false positives, and the detection results are concentrated in the actual defect areas; high detection confidence (hot spot: 0.80/0.89) and accurate positioning.
2.
Central region (second row)
Figure 11a (Original image): two hot spot defects (marked with red circles) in the left-middle and lower-right areas. Figure 11b (YOLOv11n): the positions of the detection boxes are slightly offset; one defect was missed; false positives exist: the central section was incorrectly identified as a defect. Figure 11c (YOLOv12): the positions of the detection boxes are improved, but missed detections and minor false positives still exist; one hot spot has low confidence (0.64). Figure 11d (YOLO-FAD): successfully detected both defects marked by red circles; the detection boxes are more accurate with almost complete overlap; no false positives; excellent detection confidence (0.84/0.77).
3.
Lower region (third row)
Figure 11a (Original image): three defect areas marked with red circles, all of which are small in size. Figure 11b (YOLOv11n) detected two targets but did not cover all red circles; severe false positives (area indicated by black arrows)—the hot background was misclassified as defects; low hot spot confidence (0.25). Figure 11c (YOLOv12) detected all three targets, but false positives still exist; the bounding box offset is slightly large, and some are not accurately aligned with the defect points. Figure 11d (YOLO-FAD) detected all defects within the red circles; no false positives; the highest positioning accuracy of detection boxes, with hot spot confidence concentrated between 0.75 and 0.78; stable performance even in complex backgrounds.
YOLO-FAD demonstrates significant advantages in detecting minor defects in photovoltaic modules, particularly in complex backgrounds and scenarios with subtle defects; it maintains outstanding detection performance. Compared to YOLOv11n and YOLOv12, YOLO-FAD offers more accurate detection box positioning, significantly reduced false positive rates, and higher sensitivity to small hotspots. Image analysis shows that it nearly 100% covers red-circled defects while avoiding false positives indicated by black arrows, demonstrating the optimized effects of its small-object perception, feature fusion, and confidence assessment capabilities.
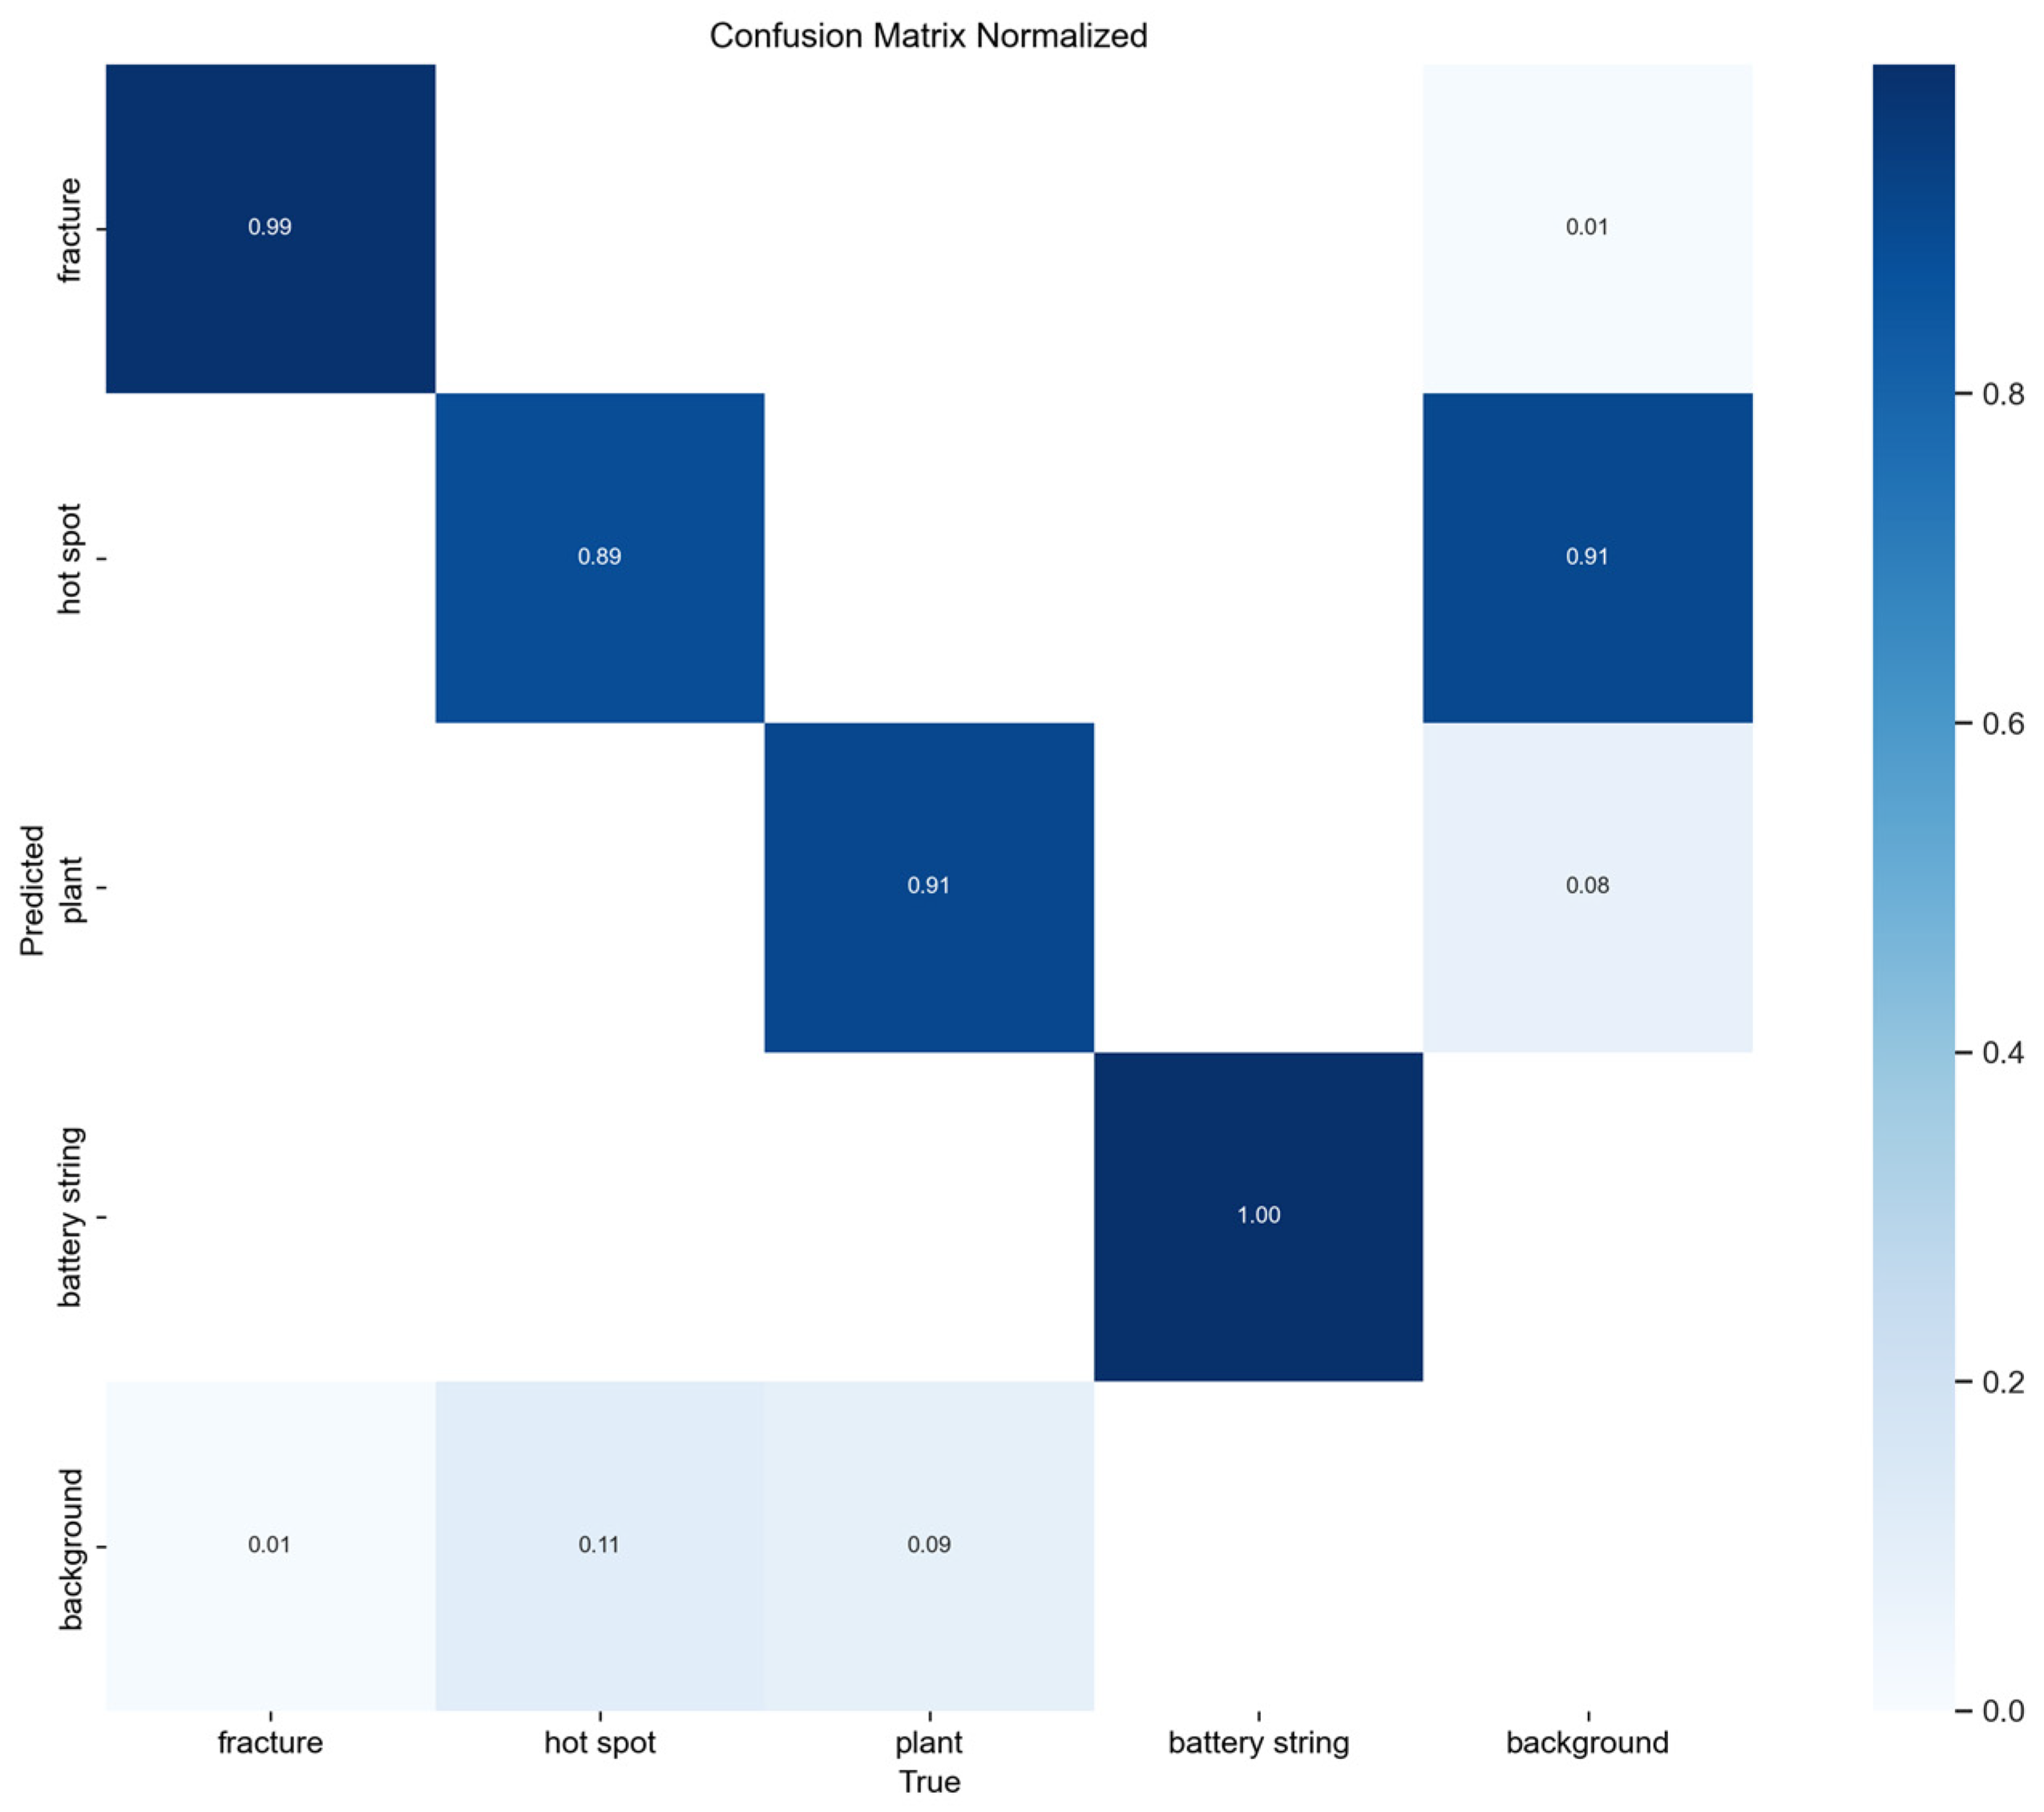
To quantitatively evaluate the classification performance and class confusion of YOLO-FAD, we supplement the analysis of the normalized confusion matrix in Figure 12. The horizontal axis represents the true classes (fracture, hot spot, plant, battery string, background), and the vertical axis represents the predicted classes. The values indicate the normalized classification accuracy between classes, from which the false positive rate (FPR) and false negative rate (FNR) can be derived:
Fracture: 99% of true fractures are predicted correctly, with only 1% misclassified as background. Its FNR is 1%, and FPR is 0.01 1 0.99 = 100 % (since only 0.01 of the background is misclassified as fracture, and the proportion of true non-fracture cases is 1 − 0.99 = 0.01). This indicates that the model almost never misses fracture defects, with only a negligible number of background pixels misclassified as fractures.
Hot Spot: 89% of true hot spots are predicted correctly, while 11% are misclassified as background. Its FNR is 11% and FPR is 0.11 1 0.89 = 100 % (0.11 of the background is misclassified as hot spot, and the proportion of true non-hot spot cases is 1 − 0.89 = 0.11). This reflects the inherent challenge of distinguishing small hot spots from the background in infrared photovoltaic images, where their grayscale features overlap to some extent.
Plant: 91% of true plant occlusions are predicted correctly, with 9% misclassified as background. Its FNR is 9%, and FPR is 0.09 1 0.91 = 100 % (0.09 of the background is misclassified as plant, and the proportion of true non-plant cases is 1 − 0.91 = 0.09). This suggests there is still room for improvement in distinguishing plant occlusions from the background.
Battery String: 100% of true battery string defects are predicted correctly, with no false negatives (FNR = 0) or false positives (FPR = 0), demonstrating the model’s strong recognition capability for this defect type.
Background: Only 0.01 is misclassified as fracture, 0.11 as hot spot, and 0.09 as plant, indicating a low overall false positive rate and good ability to distinguish non-defective background regions.
In summary, the confusion matrix quantitatively validates YOLO-FAD’s classification performance: it achieves near-perfect recognition for fractures and battery string defects. Misclassifications for hot spots and plants mainly stem from feature confusion with the background (which also points to future optimization directions), while the overall false positive rate remains controllable.

4.4.8. Failure Case Analysis and Error Quantification

To clarify the error performance and improvement potential of each algorithm in defect detection, we conducted a quantitative analysis of error types (false negative rate FN, false positive rate FP) and primary failure causes for critical defects on the test set, generating Table 6. The data reveals that YOLOv11n exhibits a false negative rate (FN Rate) of 18.7% and a false positive rate (FP Rate) of 9.2%. Its failure to detect critical defects primarily stems from “small size (≤10 × 10 pixels) + low contrast”; YOLOv12 exhibits an FN rate of 15.3% and FP rate of 7.8%, with failures attributed to “insufficient multi-scale fusion”, whereas YOLO-FAD (Ours) achieves an FN rate of only 4.2% and FP rate of 2.1%, effectively enhancing small defect detection through RFAConv and ASF modules. In summary, this table quantifies the error type differences among algorithms. Compared to YOLOv11n, YOLO-FAD reduces the false negative rate by 77.5% and false positive rate by 77.2%. Its dynamic receptive field and attention fusion mechanism successfully addresses the challenge of missing small-sized, low-contrast hotspot defects, significantly enhancing defect detection reliability.

4.4.9. Sensitivity Analysis

To verify the robustness of YOLO-FAD, we conducted sensitivity analysis on key hyperparameters (Table 7).
Table 7 presents the sensitivity analysis of key hyperparameters for the YOLO-FAD model, evaluating the impact of different values for the initial learning rate and input image size on model performance. By evaluating overall detection accuracy (mAP@0.5) and hot spot mAP, while incorporating 95% confidence intervals (±95% CI) to demonstrate statistical reliability, the optimal hyperparameters were determined to be an initial learning rate of 0.01 and an input image size of 640 × 640. The results show YOLO-FAD is most sensitive to learning rate (0.01 optimal) and stable to input size, confirming rational hyperparameter settings.

4.4.10. Ablation Experiment

The improved YOLO-FAD algorithm consists of four core modules: RFAConv, ASF, DyC3K2, and DyHead-detect head detection. The effectiveness of each module in enhancing the performance of the YOLO-FAD algorithm was validated through experimental studies, with the results shown in Table 8.
As shown in Table 8, YOLOv11n achieves only 75.2% accuracy in detecting small targets and has limited capability in identifying small target defects (such as hot spots), resulting in high risks of missed detections and false positives.
When using a single module (adding only one module), the accuracy for detecting small target defects ranges from 78.4% to 79.5%, indicating that a single module can enhance feature extraction to some extent but has limited improvement in detecting small target defects.
The two-module combination achieves a detection accuracy of 81.3% to 82.6% for small target defects, indicating that module collaboration begins to take effect, further improving detection accuracy for small target defects, though it has not yet reached the optimal level.
The three-module combination achieves a detection accuracy of 84.2% for small targets, indicating that the complementary nature of multiple modules is enhanced, enabling more precise localization and identification of small target defects (hot spots).
The combination of four modules achieves a small-object detection accuracy of 85.3%, indicating that the model achieves deep collaboration among the four modules, comprehensively optimizing feature extraction, defect enhancement, and bounding box regression, resulting in the best performance for small-object defect detection.
The combination of the four YOLO-FAD modules achieves a significant breakthrough in small-object defect (hot spot) detection through collaborative optimization, validating the rationality and practicality of the model improvements with data, and providing an optimal solution for photovoltaic module defect detection.
To validate the reliability of ablation experiment results, this study repeated each module combination five times (maintaining consistent experimental conditions: NVIDIA RTX 3080 Ti GPU, PyTorch 1.11.0 framework) and calculated the standard deviation (Std) and 95% confidence interval (CI). Results show that YOLO-FAD (full four-module configuration) achieved amAP@0.5of 94.6% (95% CI: 94.3–94.9%) and a hotspot detection accuracy of 85.3% (95% CI: 84.8–85.8%), with standard deviations below 0.25 for both metrics, indicating excellent experimental stability. Analysis via independent samples t-test (α = 0.05) revealed that the difference in mAP between YOLO-FAD and the baseline model (YOLOv11n) was statistically significant (p < 0.01), and the difference compared to the three-module combination (RFAConv + DyC3K2 + ASF) was also significant (p < 0.05). This confirms that the improvement in detection performance achieved through the synergistic optimization of the four modules is not coincidental, further validating the rationality of the module design.
5. Discussion

This paper proposes an improved defect detection algorithm based on YOLOv11n, named YOLO-FAD, to address the challenge of detecting small-scale defects in photovoltaic modules. The algorithm features a dynamic detection head structure with scale, spatial, and channel awareness capabilities. Experimental results show that the YOLO-FAD model achieves a mAP of 94.6% in overall defect detection and a mAP of 85.3% in small-scale defect detection, representing improvements of 3.0% and 10.1% over the baseline YOLOv11n model, respectively. Compared to current mainstream models (including YOLOv12, RT-DETR, Improved Faster-RCNN, and some state-of-the-art (SOTA) improved models), YOLO-FAD demonstrates significant advantages, fully validating the effectiveness and advanced nature of the proposed algorithm.
Additionally, the YOLO-FAD model has been submitted to relevant collaborating institutions and deployed for testing in actual photovoltaic component defect detection applications, particularly demonstrating outstanding performance in small object defect identification and further confirming the model’s practical application value and engineering feasibility.
The practical applicability of YOLO-FAD in PV plant inspections was further validated by embedded platform experiments. On the NVIDIA Jetson Nano, the model achieved 15 FPS (22 FPS after quantization) and 92.5% mAP@0.5, which is compatible with the hardware constraints of UAVs and mobile robots—key devices for on-site PV inspections. Compared with existing models (e.g., YOLOv12, which has 5.8 GFLOPs but only 76.1% hot spot AP on embedded platforms), YOLO-FAD balances small defect detection accuracy and embedded deployment efficiency, filling the gap between high-precision algorithms and on-site applications.
The current study still has certain limitations. First, there is still room for improvement in addressing the issue of category imbalance. Second, the detection of overlapping defects (e.g., plant covering hot spots) remains a challenge. For these limitations, future work will focus on three directions: first, optimizing the model through INT8 quantization and channel pruning techniques to adapt it for edge deployment, with the goal of controlling inference latency within 20 milliseconds; second, introducing multi-modal fusion technology that combines electroluminescence (EL) images and thermal images to improve the feature representation capability of defects; and finally, designing a Transformer-based multi-object separation module to effectively address the difficulty in detecting overlapping defects.

6. Conclusions

In actual operation, photovoltaic (PV) modules often encounter various potential faults and defects, with small target defects (such as hot spots) being particularly prominent. Such small target defects not only result in energy loss and reduced system efficiency but may even cause system failures under extreme conditions. To address the detection of small target defects in PV modules, this paper proposes an improved YOLO-FAD algorithm based on the original YOLOv11n model, incorporating RFAConv, DyC3K2, ASF, and DyHead components. Compared to the YOLOv11n model, the improved YOLO-FAD algorithm achieves detection accuracy and recall rates of 94.6% and 91.7%, respectively, significantly enhancing detection performance.
Through ablation experiments, this paper conducted separate experiments on each module of the improved model, as well as experiments comparing two-module combinations, three-module combinations, and all four modules acting together. The results further validated that the best performance is achieved when all four modules are used together, with small defect detection accuracy reaching 85.3%, thereby verifying the robustness and stability of the improved YOLO-FAD algorithm. Finally, we used the public datasets NEU-DET and PCB-DET to compare our improved YOLO-FAD algorithm with YOLOv11n. The results demonstrate that the YOLO-FAD algorithm outperforms YOLOv11n in defect detection across both datasets, further validating the improved model’s generalizability. However, given the limited scale of these datasets, their generalizability requires further validation across a broader range of industrial scenarios.
Based on the experimental results presented in this paper, the proposed YOLO-FAD algorithm demonstrates outstanding performance in small-object defect detection for photovoltaic modules, effectively meeting industrial production requirements and providing new solutions and insights for related fields. Future research will integrate a motion deblurring module into the backbone network and explore lightweight architectures (e.g., model distillation) to further improve embedded platform speed without sacrificing accuracy.

Author Contributions

Each author contributed as follows: L.L. Software, Methodology, Writing—Review and Editing. G.X.: Conceptualization, Data management. Y.W.: Situation analysis and investigation. W.Y.: Methodology, Visualization. J.W.: Methodology, Supervision. Z.Z.: Supervision, Verification. All authors have read and agreed to the published version of the manuscript.

Funding

Taiyuan City Unveiling and Marshalling Scheme (2024TYJB0106); Special Funding for Guiding the Transformation of Scientific and Technological Achievements in Shanxi Province, Project Approval Number: 202204021301059; Shanxi Provincial Science and Technology Major Special Project ‘Unveiling the List of Commanders’ (202301020101001); Special Fund for Science and Technology Innovation Teams of Shanxi Province (grant no. 202304051001004); Major Science and Technology Project of Shanxi Province (grant no. 202201090301013); Supported by Fundamental Research Program of Shanxi Province (grant no. 202303021222164).

Data Availability Statement

The dataset utilized in this investigation originates from onsite photography conducted by partner companies and has been manually annotated by our research team. Owing to confidentiality agreements, the dataset is not publicly accessible. However, interested parties may request the data directly from the corresponding authors, provided that the inquiry is deemed justifiable.

Conflicts of Interest

All authors of the study have no conflicts of interest.

References

  1. Zhao, S.; Chen, H.; Wang, C.; Zhang, Z. SSN: Shift suppression network for endogenous shift of photovoltaic defect detection. IEEE Trans. Ind. Inform. 2023, 20, 4685–4697. [Google Scholar] [CrossRef]
  2. Tsai, D.M.; Wu, S.C.; Chiu, W.Y. Defect detection in solar modules using ICA basis images. IEEE Trans. Ind. Inform. 2012, 9, 122–131. [Google Scholar] [CrossRef]
  3. Dhimish, M.; d’Alessandro, V.; Daliento, S. Investigating the impact of cracks on solar cells performance: Analysis based on nonuniform and uniform crack distributions. IEEE Trans. Ind. Inform. 2021, 18, 1684–1693. [Google Scholar] [CrossRef]
  4. Dhimish, M.; Holmes, V.; Mehrdadi, B.; Dales, M. The impact of cracks on photovoltaic power performance. J. Sci. Adv. Mater. Devices 2017, 2, 199–209. [Google Scholar] [CrossRef]
  5. Tománek, P.; Škarvada, P.; Macků, R.; Grmela, L. Detection and localization of defects in monocrystalline silicon solar cell. Adv. Opt. Technol. 2010, 2010, 805325. [Google Scholar] [CrossRef]
  6. Hu, H.; Gu, J.; Zhang, Z.; Dai, J.; Wei, Y. Relation networks for object detection. In Proceedings of the IEEE Conference on Computer Vision and Pattern Recognition, Salt Lake City, UT, USA, 18–23 June 2018; pp. 3588–3597. [Google Scholar]
  7. Li, Y.; Chen, Y.; Wang, N.; Zhang, Z.-X. Scale-aware trident networks for object detection. In Proceedings of the IEEE/CVF International Conference on Computer Vision, Seoul, Republic of Korea, 27 October–2 November 2019; pp. 6054–6063. [Google Scholar]
  8. Lin, T.Y.; Dollár, P.; Girshick, R.; He, K.; Hariharan, B.; Belongie, S. Feature pyramid networks for object detection. In Proceedings of the IEEE Conference on Computer Vision and Pattern Recognition, Honolulu, HI, USA, 21–26 July 2017; pp. 2117–2125. [Google Scholar]
  9. Liu, S.; Huang, D.; Wang, Y. Learning spatial fusion for single-shot object detection. arXiv 2019, arXiv:1911.09516. [Google Scholar] [CrossRef]
  10. Liu, S.; Qi, L.; Qin, H.; Shi, J.; Jia, J. Path aggregation network for instance segmentation. In Proceedings of the IEEE Conference on Computer Vision and Pattern Recognition, Salt Lake City, UT, USA, 18–23 June 2018; pp. 8759–8768. [Google Scholar]
  11. Wang, F.; Wang, H.; Qin, Z.; Tang, J. UAV target detection algorithm based on improved YOLOv8. IEEE Access 2023, 11, 116534–116544. [Google Scholar] [CrossRef]
  12. Zhao, S.; Li, G.; Zhou, M.; Li, M. YOLO-CEA: A real-time industrial defect detection method based on contextual enhancement and attention. Clust. Comput. 2024, 27, 2329–2344. [Google Scholar] [CrossRef]
  13. Liu, P.; Yuan, X.; Ren, H.; Kang, L.; Kang, S. Adaptive receptive field based on multi-size convolution kernel for micro-defect detection of turbine blades. Meas. Sci. Technol. 2023, 35, 015405. [Google Scholar] [CrossRef]
  14. Li, Y.; Shao, M.; Fan, B.; Zhang, W. Multi-scale global context feature pyramid network for object detector. Signal Image Video Process. 2022, 16, 705–713. [Google Scholar] [CrossRef]
  15. Zhang, G.; Luo, Z.; Tian, Z.; Zhang, Y.; Zhang, W.; Wang, X. Towards efficient use of multi-scale features in transformer-based object detectors. In Proceedings of the IEEE/CVF Conference On Computer Vision and Pattern Recognition, Vancouver, BC, Canada, 17–24 June 2023; pp. 6206–6216. [Google Scholar]
  16. Woo, S.; Park, J.; Lee, J.Y.; Kweon, I.S. Cbam: Convolutional block attention module. In Proceedings of the European Conference on Computer Vision (ECCV), Munich, Germany, 8–14 September 2018; pp. 3–19. [Google Scholar]
  17. Hou, Q.; Zhou, D.; Feng, J. Coordinate attention for efficient mobile network design. In Proceedings of the IEEE/CVF Conference on Computer Vision and Pattern Recognition, Nashville, TN, USA, 19–25 June 2021; pp. 13713–13722. [Google Scholar]
  18. Zhang, X.; Liu, C.; Yang, D.; Song, T.; Ye, Y.; Li, K.; Song, Y. RFAConv: Innovating spatial attention and standard convolutional operation. arXiv 2023, arXiv:2304.03198. [Google Scholar]
  19. Kang, M.; Ting, C.M.; Ting, F.F.; Phan, R.C.-W. ASF-YOLO: A novel YOLO model with attentional scale sequence fusion for cell instance segmentation. Image Vis. Comput. 2024, 147, 105057. [Google Scholar] [CrossRef]
  20. Han, K.; Wang, Y.; Guo, J.; Wu, E. ParameterNet: Parameters are all you need for large-scale visual pretraining of mobile networks. In Proceedings of the IEEE/CVF Conference on Computer Vision and Pattern Recognition, Seattle, WA, USA, 16–22 June 2024; pp. 15751–15761. [Google Scholar]
  21. Dai, X.; Chen, Y.; Xiao, B.; Chen, D.; Liu, M.; Yuan, L.; Zhang, L. Dynamic head: Unifying object detection heads with attentions. In Proceedings of the IEEE/CVF Conference on Computer Vision and Pattern Recognition, Nashville, TN, USA, 20–25 June 2021; pp. 7373–7382. [Google Scholar]
  22. He, L.-H.; Zhou, Y.-Z.; Liu, L.; Cao, W.; Ma, J.-H. Research on object detection and recognition in remote sensing images based on YOLOv11. Sci. Rep. 2025, 15, 14032. [Google Scholar] [CrossRef] [PubMed]
  23. Sohan, M.; Sai Ram, T.; Rami Reddy, C.V. A review on yolov8 and its advancements. In Data Intelligence and Cognitive Informatics: Proceedings of the ICDICI 2023, Tirunelveli, India, 27–28 June 2023; Springer: Singapore, 2024; pp. 529–545. [Google Scholar]
  24. Wang, C.Y.; Yeh, I.H.; Mark Liao, H.Y. Yolov9: Learning what you want to learn using programmable gradient information. In Computer Vision: Proceedings of the 18th European Conference, Milan, Italy, 29 September–4 October 2024; Springer: Cham, Switzerland, 2025; pp. 1–21. [Google Scholar]
  25. Wang, A.; Chen, H.; Liu, L.; Chen, K.; Lin, Z.; Han, J. Yolov10: Real-time end-to-end object detection. arXiv 2024, arXiv:2405.14458. [Google Scholar]
  26. Tian, Y.; Ye, Q.; Doermann, D. Yolov12: Attention-centric real-time object detectors. arXiv 2025, arXiv:2502.12524. [Google Scholar]
  27. Zhao, Y.; Lv, W.; Xu, S.; Wei, J.; Wang, G.; Dang, Q.; Liu, Y.; Chen, J. Detrs beat yolos on real-time object detection. In Proceedings of the IEEE/CVF Conference on Computer Vision and Pattern Recognition, Seattle, WA, USA, 16–22 June 2024; pp. 16965–16974. [Google Scholar]
  28. Wang, Z.; Wang, J. Personalized Icon Design Model Based on Improved Faster-RCNN. Syst. Soft Comput. 2025, 7, 200193. [Google Scholar] [CrossRef]
  29. Zhao, J.; Zhu, H.; Niu, L. BiTNet: A lightweight object detection network for real-time classroom behavior recognition with transformer and bi-directional pyramid network. J. King Saud Univ.-Comput. Inf. Sci. 2023, 35, 101670. [Google Scholar] [CrossRef]
  30. Ren, S.; Song, J.; Yu, L.; Tian, S.; Long, J. DHC-YOLO: Improved YOLOv8 for Lesion Detection in Brain Tumors, Colon Polyps Esophageal Cancer. Res. Sq. 2024. [Google Scholar] [CrossRef]
  31. Feng, X.; Gao, X.; Luo, L. X-SDD: A new benchmark for hot rolled steel strip surface defects detection. Symmetry 2021, 13, 706. [Google Scholar] [CrossRef]
  32. Li, J.; Zhang, S. Printed circuit board defect detection based on improved YOLOv5. In Proceedings of the 2025 8th International Conference on Advanced Algorithms and Control Engineering (ICAACE), Shanghai, China, 21–23 March 2025; pp. 1277–1281. [Google Scholar]
  33. Bochkovskiy, A.; Wang, C.Y.; Liao, H.Y.M. ELPV: Electroluminescence PV Module Dataset. arXiv 2022, arXiv:2206.08164. [Google Scholar]
Figure 1. YOLO-FAD structure diagram. Note: ASF is integrated in the Neck (between ScalSeq and Zoom-cat) to fuse P2-P5 features. Key modules: RFAConv (replaces traditional convolutions), DyC3K2 (dynamic convolution), DyHead-detect (dynamic detection head).
Computers 14 00518 g001
Figure 2. RFAConv structure diagram.
Computers 14 00518 g002
Figure 3. Structure of the SSFF module.
Computers 14 00518 g003
Figure 4. MLFE module structure.
Computers 14 00518 g004
Figure 5. Structural diagram of DyC3K2.
Computers 14 00518 g005
Figure 6. DyHead block structure.
Computers 14 00518 g006
Figure 7. Defect categories.
Computers 14 00518 g007
Figure 8. Label distribution. Note: In Figure 7 and Figure 8, and throughout the text, the term “plant” refers to vegetation.
Computers 14 00518 g008
Figure 9. Trade-off Analysis Chart for Precision and Efficiency.
Computers 14 00518 g009
Figure 10. Training curves. (Left) mAP@0.5 (IoU = 0.5); (Right) mAP@0.5:0.95 (IoU 0.5–0.95). X-axis: training epochs; Y-axis: Mean Average Precision (mAP).
Computers 14 00518 g010
Figure 11. Detection results of different algorithms on the same detection image: (a) Original image; (b) YOLOv11n detection result; (c) YOLOv12 detection result; (d) YOLO-FAD detection result. The circles in the image indicate defects, while the arrows point to the detection results.
Computers 14 00518 g011
Figure 12. Analysis of the normalized confusion matrix.
Computers 14 00518 g012
Table 1. Comparison of different algorithms. (%).
AlgorithmPrecisionRecallmAP@0.5FractureHot SpotPlantBattery StringGFLOPsFPSParams(M)
YOLOv8n91.3884.9691.5799.275.3892.299.58.1344.83
Improved Faster-RCNN90.489.291.898.681.393.294.116.223341.4
DHC-YOLO89.487.292.298.478.893.598.110.5256.79.8
BiTNet88.682.888.3594.276.490.592.3108.642.9817.68
RT-DETR-l76.676.781.497.564.686.776.7103.485.532
RT-DETR-x7976.581.498.561.986.778.4222.572.965.5
RT-DETR-Resnet5082.482.58699.268.58888.4125.687.742
RT-DETR- Resnet10186.58187.598.87187.692.7186.275.7561
YOLOv9s85.3889.4492.799.478.193.799.526.73037.2
YOLOv10n90.783.1491.599.376.890.599.56.5312.52.26
YOLOv11n89.8988.1491.699.375.292.499.56.34342.6
YOLOv1282.99090.999.276.191.696.85.8344.82.39
YOLO-FAD(Ours)92.591.794.699.585.39499.69161.34.18
Note on comparative models: All SOTA models (BiTNet, DHC-YOLO) were retrained on our PV dataset under the same settings as YOLO-FAD: 300 epochs, batch size = 16, SGD optimizer (momentum = 0.9, weight decay = 0.0005), and OneCycleLR scheduling. Their original implementations were adjusted to support our four defect categories (no other modifications), ensuring performance differences are due to architecture rather than training discrepancies.
Table 2. Performance comparison of baseline and improved models on PCB-DET (%).
AlgorithmMissing HoleMouse BiteOpenShortSpurSpuriousmAP@0.5GFLOPsFPSParams(M)
YOLOv11n97.190.286.482.884.984.287.66.34342.6
YOLO-FAD99.393.592.889.691.292.693.179161.34.18
Table 3. Performance comparison of baseline and improved models on NEU-DET (%).
AlgorithmGrazingInclusionPatchesPitted-SurfaceRoll-In ScaleScratchesmAP@0.5GFLOPsFPSParams(M)
YOLOv11n67.283.392.485.270.494.582.166.34342.6
YOLO-FAD76.588.493.791.582.898.488.559161.34.18
Table 4. Performance on ELPV dataset.
AlgorithmPrecision (±95% CI)Recall (±95% CI)mAP@0.5 (±95% CI)Hot Spot (±95% CI)
YOLOv11n85.2 (84.1–86.3)83.6 (82.4–84.8)86.4 (85.6–87.2)78.5 (77.3–79.7)
YOLO-FAD(Ours)90.7 (89.8–91.6)89.5 (88.4–90.6)91.8 (91.1–92.5)87.2 (86.1–88.3)
Table 5. Performance comparison of models on NVIDIA Jetson Nano (embedded platform) (%).
AlgorithmFractureHot SpotmAP@0.5GFLOPsFPSInference Latency (ms)Params(M)
YOLOv11n96.570.188.26.33132.32.6
YOLO-FAD99.180.392.591566.74.18
YOLO-FAD (Quantized)98.779.591.892245.54.18
Note: The “Quantized” version refers to YOLO-FAD optimized with TensorRT int8 quantization, which is more suitable for embedded deployment.
Table 6. Error type quantification.
AlgorithmFN Rate (%)FP Rate (%)Main Failure Reasons for Hot Spots
YOLOv11n18.79.2Small size (≤10 × 10 pixels) + low contrast
YOLOv1215.37.8Inadequate multi-scale fusion
YOLO-FAD(Ours)4.22.1RFAConv + ASF enhances small defect response
Table 7. Sensitivity analysis of key hyperparameters.
HyperparameterValue RangemAP@0.5 (±95% CI)Hot Spot mAP (±95% CI)
Initial Learning Rate0.00192.1 (91.4–92.8)81.5 (80.4–82.6)
0.01 (selected)94.6 (94.2–95.0)85.3 (84.5–86.1)
0.190.3 (89.4–91.2)79.2 (77.9–80.5)
Input Image Size480 × 48089.5 (88.9–90.1)78.4 (77.5–79.3)
640 × 640 (selected)94.6 (94.2–95.0)85.3 (84.5–86.1)
800 × 80095.1 (94.7–95.5)86.2 (85.4–87.0)
Table 8. Effectiveness of different modules on model detection (%).
RFAConvASFDyC3K2DyHead-DetectmAP@0.5StdHot SpotStd
91.60.2175.20.35
92.340.1878.40.29
92.50.2078.20.31
92.40.1979.10.27
92.670.1779.50.28
93.150.1681.30.25
93.40.1582.60.24
94.10.1484.20.23
94.60.1585.30.22
Note: The ✓ in Table 8 indicates that the module has been added.
Disclaimer/Publisher’s Note: The statements, opinions and data contained in all publications are solely those of the individual author(s) and contributor(s) and not of MDPI and/or the editor(s). MDPI and/or the editor(s) disclaim responsibility for any injury to people or property resulting from any ideas, methods, instructions or products referred to in the content.