Abstract
Currently, the increasing number of Internet of Things devices makes spectrum resource shortage prominent. Spectrum sensing technology can effectively solve this problem by conducting real-time monitoring of the spectrum. However, in practical applications, it is difficult to obtain a large number of labeled samples, which leads to the neural network model not being fully trained and affects the performance. Moreover, the existing few-shot methods focus on capturing spatial features, ignoring the representation forms of features at different scales, thus reducing the diversity of features. To address the above issues, this paper proposes a few-shot spectrum sensing method based on multi-scale global feature. To enhance the feature diversity, this method employs a multi-scale feature extractor to extract features at multiple scales. This improves the model’s ability to distinguish signals and avoids overfitting of the network. In addition, to make full use of the frequency features at different scales, a learnable weight feature reinforcer is constructed to enhance the frequency features. The simulation results show that, when SNR is under 0∼10 dB, the recognition accuracy of the network under different task modes all reaches above 81%, which is better than the existing methods. It realizes the accurate spectrum sensing under the few-shot conditions.
1. Introduction
1.1. Background
With the explosive growth of emerging applications such as the Internet of Things (IoT) and unmanned aerial vehicle (UAV) communication, the density of devices and users in wireless communication systems has increased sharply. Figure 1 is a schematic diagram of spectrum resource application in the context of the IoT. It can be seen from the figure that various devices such as intelligent transportation systems and UAVs operate simultaneously to achieve effective information transmission across industries. During the transmission process, on the one hand, due to the inherent scarcity of wireless spectrum resources, the sharing of overlapping frequency bands by multiple systems or users, and the non-ideal characteristics of transmitting and receiving devices, such as frequency offset, phase noise, and nonlinear distortion, mutual interference between devices occurs frequently. On the other hand, the competition for spectrum resources among various devices and users has intensified, leading to prominent interference issues. This not only causes spectrum congestion but also results in significant uncertainty in frequency band occupancy, ultimately leading to an increasing shortage of radio spectrum resources. To cope with this challenge, Cognitive Radio (CR) technology has emerged, which allows primary and secondary users to share spectrum resources [1]. As one of the key technologies of CR, Spectrum Sensing (SS) provides important support for spectrum resource reuse by monitoring the spectrum usage in real-time [2].
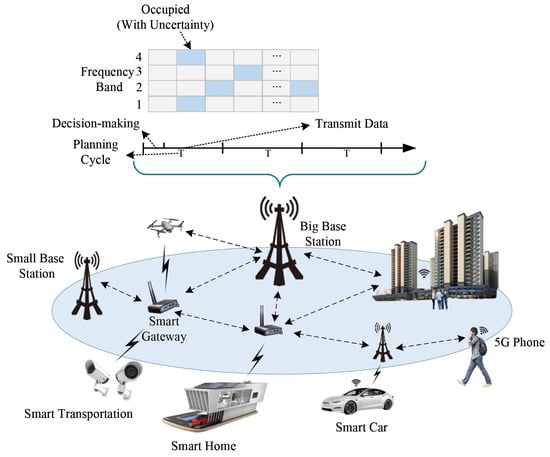
Figure 1.
Schematic diagram of spectrum resource application in the context of the IoT.
Traditional spectrum sensing methods include Energy Detector (ED) [3], Cyclostationary Feature Detector (CFD) [4], and Matched Filtering Detector (MFD) [5]. The ED determines whether the spectrum is occupied or not by measuring the energy of the received signal, which has the advantages of simple implementation and high detection capability of independent non-correlated signals. The CFD makes use of the periodicity of the signal for spectrum sensing, and performs well in dealing with periodic signals. The MFD identifies the signals by comparing them with the known signal templates. The above traditional methods have good detection results, but there are still the following problems: (1) Weak perception of signals in complex noise environments, prone to false judgement; (2) Poor effect on non-periodic signals, requiring longer perception time, affecting the perception efficiency; (3) Unable to effectively perceive complex electromagnetic environments, such as the IoT.
Deep Learning (DL) has been widely used in IoT due to its powerful feature extraction capability and nonlinear expressiveness [6]. Existing DL methods mainly include convolutional neural networks [7], recurrent neural networks [8], attention mechanisms [9], etc. These methods have achieved significant results in IoT communication fields, such as spectrum sensing [10] and modulation mode identification [11]. Under normal circumstances, traditional neural network methods require a large number of labeled samples to make the network model have good generalization ability and robustness. However, with the rapid development of communication technology, the electromagnetic signals in the wireless space are evolving towards diversification and advancement, which triggers the problems such as difficulty in sample acquisition and high labor cost for annotation. As a result, the network model cannot be trained adequately, which seriously affects the performance of spectrum sensing.
Few-shot Learning (FSL) [12] aims to enable the model to quickly adapt to new tasks on a limited dataset, so as to improve the generalization ability and learning efficiency in the face of new tasks, which can effectively cope with the problem of spectrum sensing of wireless signal spectrum in multiple scenarios under the condition of scarce data sample size. Nowadays, the most effective method to implement FSL is Meta-learning [13], which can be broadly classified into three categories: optimization [14], migration [15], and metric [16] based methods. Among them, metric learning is widely used in many fields due to its simple structure and efficient processing, mainly including matching network [17,18] prototypical network [19,20] and relation network [21,22]. The relation network has become a hotspot in current research owing to its unique ability to capture nonlinear relationships and good generalization performance.
1.2. Related Work
In recent years, regarding the issues of spectrum sensing and signal recognition in few-shot scenarios, research teams have conducted extensive studies focusing on directions such as metric learning optimization and feature enhancement. This section analyzes existing relevant methods from multi-scale feature utilization capability and frequency-domain feature enhancement design to clarify the progress and shortcomings of each method in these two core technologies.
Lim et al. [23] proposed an SSL-ProtoNet network architecture, which integrates self-supervised learning and knowledge distillation into the prototype network and achieves optimization through three stages. In the pre-training stage, augmented tasks with unlabeled samples are used, and discriminative features are learned via contrastive learning. In the fine-tuning stage, pre-trained parameters serve as initial weights, and dual losses are fused to prevent overfitting. In the self-distillation stage, a well-trained “teacher model” guides the training of a “student model” through soft labels to improve generalization ability. However, SSL-ProtoNet relies solely on single-scale features for self-supervised clustering and lacks a multi-scale feature extraction mechanism, making it unable to capture complementary features of wireless signals at different scales. Additionally, this method focuses entirely on the self-supervised optimization of spatial features and ignores the frequency-domain properties of wireless signals. When facing scenarios where frequency domains of multi-transmitter signals overlap, it is difficult to distinguish each transmitter component in mixed signals.
Feng et al. [24] proposed a Global Information Embedding Network, designing a dedicated global feature extraction module for few-shot learning tasks. The core of GIEN lies in the Global Information Embedding (GIE) module, which performs frequency-domain modulation on the extracted local features using learnable real-valued frequency filters, embedding the global frequency distribution information of signals into local features. This represents a valuable attempt in the dimension of frequency-domain feature enhancement and partially compensates for the insufficient global feature modeling capability of CNNs. Nevertheless, this method only designs a global information embedding mechanism for single-scale features and fails to consider the multi-scale characteristics of wireless signals. In the Internet of Things, the frequency distribution of signals from different transmitters varies significantly, and features of signals from the same transmitter at different scales are complementary. The single-scale design cannot fully extract these multi-scale features.
Zhang et al. [25] constructed a semi-supervised few-shot framework for wireless signal recognition, combining a Deep Residual Shrinkage Network (DRSN) with a semi-supervised strategy to form a technical process of “noisy feature extraction, semi-supervised fusion and few-shot classification”. The DRSN uses a soft threshold function to suppress noise and learn discriminative features, while the modular semi-supervised method fuses labeled and unlabeled data via MixMatch to improve classification performance under few-shot conditions. However, this method relies on fixed layers of the deep residual network for feature extraction and lacks a dedicated multi-scale parallel extraction structure, making it unable to actively capture key information of signals at different scales. Meanwhile, it only focuses on noise suppression of time-domain signals and does not design an enhancement mechanism for multi-scale frequency-domain features of signals. mere time-domain noise suppression cannot distinguish the frequency-domain features of different transmitters, resulting in limited feature discrimination ability.
Hao et al. [26] proposed a meta-learning-based Multi-Frequency Multiplier ResNet method for few-shot automatic modulation classification tasks. The method designs ResNet branches with different sampling rates to extract low-frequency coarse-grained features and high-frequency fine-grained features of signals respectively. Moreover, it integrates multi-frequency features through a feature fusion module, ensuring feature integrity while reducing computational complexity. Compared with traditional meta-learning methods, its accuracy is improved by approximately 5% to 7%. However, M-MFOR still has prominent limitations. In terms of frequency-domain feature enhancement, its multi-frequency feature extraction only focuses on the frequency decomposition of time-domain signals and does not design a dedicated enhancement module for the global distribution of frequency-domain features. Thus, it cannot enhance key frequency-domain features and suppress noise interference through weight optimization.
When calculating sample similarity, traditional metric learning methods usually directly use global features or simply averaged features, without considering the local semantic differences of sample features. In the time-frequency diagrams of wireless signals, feature regions of different transmitters may have positional differences. Direct matching of global features will reduce the accuracy of similarity calculation. To solve this problem, Hao et al. [27] proposed the Semantic Alignment Metric Learning method, which achieves accurate alignment of local semantic features through a “collection-selection” strategy. In few-shot image classification, SAML first calculates the distances between all region pairs to construct a relation matrix for “semantic feature collection”, then adjusts the matrix weights for “semantic feature selection”, and finally outputs sample similarity scores via a multi-layer perceptron, increasing the accuracy of the 5-way 1-shot task to over 80%. However, in terms of multi-scale feature utilization, SAML’s local region decomposition relies on fixed-size feature blocks, making it unable to extract and fuse features of different granularities in parallel. In terms of frequency-domain feature enhancement, it does not process frequency-domain features and only focuses on the semantic alignment of spatial local features, leading to limited performance. Table 1 combs and presents relevant methods from multi-scale feature utilization capability and frequency-domain feature enhancement capability. Table 2 describes the core variables of the method proposed in this paper.

Table 1.
Few-Shot Signal Recognition Methods: Multi-Scale and Frequency-Domain Capabilities.
Table 2.
Core variables for the Re_MGFE method.
Based on the above analysis, although existing few-shot signal recognition methods have made progress in improving feature discriminability, adapting to distribution shifts, and semantic alignment, they still have three problems in the IoT multi-transmitter spectrum sensing scenario: insufficient utilization of multi-scale features, lack of frequency-domain feature enhancement design, and insufficient coordination between multi-scale and frequency-domain features.
To address the above-mentioned problems, this paper proposes a few-shot spectrum sensing method using multi-scale global features. This method utilizes a multi-scale feature extractor and a learnable weight feature enhancer to extract multi-scale global features of signals. The multi-scale feature extractor employs average pooling operations with different rates to extract multi-scale features of signals. On this basis, the learnable weight feature enhancer optimizes the weights of features at different scales in the frequency domain, completes the enhancement of signal features, and thereby achieves the goals of enhancing signal discriminability and improving sensing performance. The main contributions can be summarized as follows:
- (1)
- In this paper, a relation network framework based on multi-scale feature enhancement is proposed. By constructing a multi-scale feature extraction module and a frequency-domain feature enhancement module, this framework enables the acquisition of global features at multiple scales, and improves the network’s ability to distinguish wireless signals.
- (2)
- For multi-scale features, a frequency-domain feature enhancement module is constructed, which extracts global features at different scales. It optimizes the representation capability of global features of the network by using multiple learnable parameters to weigh the features at different scales.
- (3)
- Under the research background of spectrum sensing in the IoT, multiple sets of comparative experiments were carried out by changing different training sample sizes, verifying the effectiveness of this model. It achieved accurate spectrum sensing of multiple radiation sources under the few-shot condition, providing a practical and feasible new idea for solving the problem of scarce spectrum resources in the IoT.
2. Problem Formulation
2.1. Signal Model
In the electromagnetic space, wireless signals are composed of various categories such as communication signals, interference signals, and noise signals, exhibiting complex characteristics such as temporal diversity and spatial variation. According to the characteristics of wireless signals, the expression of the wireless signal at time t is shown in Equation (1).
in the Equation (1), represents the transmission signal of the n-th radiation source at time t; represents the channel coefficient of the n-th radiation source at time t; represents various noise and interference signals at time t.
In this work, suppose there are M different wireless radiation sources in a certain area, which are respectively marked as . The operating frequencies of each radiation source show obvious dynamic changes over time, and the frequency points occupied by each radiation source at the same moment are different. However, due to the increase in the number of radiation source terminals, the distinguish ability of the frequency points occupied by different radiation sources at the same moment is relatively small. Owing to the superposition effect of each radiation source signals in the time-domain space, at the receiving end, there may be composite signals generated by any combination of these M radiation sources, thus forming possible situations. Figure 2 shows the time-frequency diagrams of the perception signals under different conditions. These time-frequency diagrams are all composed of the mixed signals emitted by different types of radiation sources. It can be seen from the figure that the combinations of signals present different forms in the time-frequency domain, and the forms after the mapping transformation also vary. Moreover, there will be interweaving and overlapping situations in some frequency bands. Therefore, identifying the main frequency distribution of signals from different radiation sources is crucial for the spectrum sensing of the electromagnetic environment.
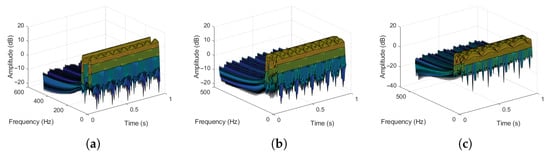
Figure 2.
Time-frequency diagrams of perception signals under different conditions. (a) Mixed by Radar signals, Broadcast signals, and Bluetooth signals. (b) Mixed by WIFI signals, 5G signals, Broadcast signals, Zigbee signals, Bluetooth signals, and Radar signals. (c) Mixed by radar signals, Broadcast signals, Bluetooth signals, Zigbee signals, GPS signals, Satellite signals, WIFI signals, and 5G signals.
2.2. Definition of FSL Task
In the actual application scenarios of the IoT, the complex electromagnetic environment poses great challenges to the acquisition of samples, resulting in a very limited number of obtainable samples. To address this issue, this paper constructs a few-shot learning model based on a multi-task mechanism. The multi-task mechanism aims to randomly select tasks from the labeled signals for training, and then learn a model suitable for this task. This model can quickly adapt to new tasks with a small number of samples and accurately identify unknown radiation sources.
Multi-radiation source spectrum sensing aims to determine the working states of different radiation sources in the spectrum and identify them. Suppose there are M radiation sources in the current electromagnetic space, and there are working modes. Randomly select N categories from them, and randomly select K samples for each category, that is N-way K-shot, to construct a meta-task, which serves as the model support set , represents the i-th sample, and represents the corresponding label. Randomly select C samples from the remaining samples of , categories as the query set, which is used to train the performance of the model on new tasks and for the rapid adaptation of the model. The support set includes a training set and a test set, and the query set also includes a training set and a test set.
3. Network Architecture
To cope with multi-radiation source spectrum sensing under few-shot conditions, this paper constructs a relation network based on Multi-scale Global Feature Embedding (Re_MGFE) network framework. The overall design of the Re_MGFE network framework is shown in Figure 3. The framework mainly consists of three modules: Multi-scale Feature Extraction (MFE) module, Frequency-domain Feature Enhancement (FFE) module, and Similarity-based Metric (SM) module. The MFE module improves the model’s ability to extract local multi-scale features of the signal by performing multi-scale feature extraction; the FFE module enhances the desired signal features and weakens the unnecessary components by weighting different scale features using multiple learnable parameters; and the SM module achieves perceptual classification by calculating the relation scores among the samples in the query set.
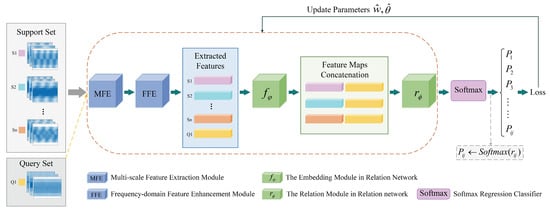
Figure 3.
Overall framework of Re_MGFE.
3.1. Multi-Scale Feature Extraction Module
In the multi-radiation source spectrum sensing scenario, due to the different emission frequencies of each radiation source, the signals captured at the receiving end are distributed over different frequency bands, and the local features of each signal present a complex and variable form. To enhance the feature representation of the signals, this module innovatively introduces a multi-scale feature extractor, which aims to perform multi-scale feature extraction operations on the signals so as to capture the information at several different scales, and the network structure diagram of this module is given in Figure 4. Parallel Subnet 1–4 are four groups of parallel processing subnets, which realize the parallel extraction of multi-scale features through convolution kernels of different sizes and average pooling of 1/2, 1/4, 1/8 multiples respectively; the Batchnorm layer is used for batch normalization of features after convolution to accelerate the convergence of model training; the ReLu Conv layer introduces nonlinearity through the ReLU activation function, enhancing the model’s ability to capture the nonlinear features of signals.
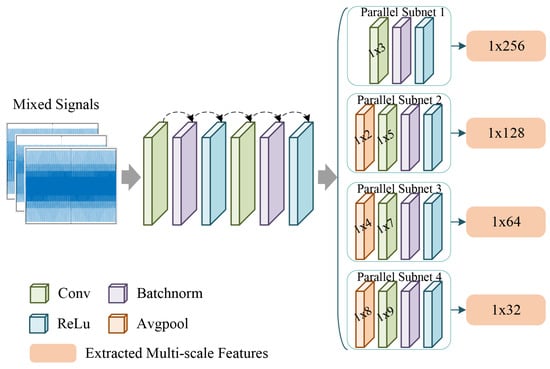
Figure 4.
Framework of multi-scale feature extraction module.
In order to better adapt to the complexity and diversity of the task of multi-radiation source spectrum sensing, the module firstly uses the depth-separable convolution to separate the input data by channel at multiple different scales. This approach enables the effective capture of the signal’s key features at different scales. To improve the overall processing efficiency of the model, the module performs parallel processing on features through parallel subnet 1∼4, and the pooling operation with different multiplicity is applied to enhance the nonlinear expressiveness of the data processing. At the same time, the richness of the feature expression is improved, and the computational flow is shown in the following Equations (2)–(5):
where, is the four groups of channels, is the convolution operation, w is the weight of the convolution layer, each layer has different weights. represents 1/2, 1/4, 1/8 times the average pooling operation, respectively, is the extracted multi-scale features. From the above equation, it can be seen that are subjected to different convolutional operations and different multiples of average pooling operations, through the above operations, different scale features of the input data can be captured to increase the diversity of feature extraction, the main parameters of the module are shown in Table 3.
Table 3.
Main parameters of MFE module.
3.2. Frequency-Domain Feature Enhancement Module
There are significant differences in the signal types, modulation methods, working modes of different radiation sources, as well as the electromagnetic environments they are in. These differences make the frequency spectrums of various radiation sources show remarkable distinctions in aspects such as the central frequency, bandwidth, and morphological characteristics. These differences not only affect the signal propagation characteristics and detection difficulty, but also provide an essential basis for the identification and classification of radiation sources. However, in practical applications, due to the constraints of computational resources and the requirements of real-time, the data length is often limited, which to a certain extent affects the accuracy of spectrum analysis and the effectiveness of signal processing. Under such conditions, to effectively improve the network’s expressiveness of the frequency features of the radiation source, this section enhances the multi-scale frequency domain features of the radiation source signal, and introduces a Learnable Weight Feature Reinforcer (LWFR) to highlight the key representations of the signal and suppress the irrelevant noise. The frequency feature enhancement module is shown in Figure 5. The FFT component is used to convert multi-scale time-domain features into frequency-domain features, while the IDFT component maps the weighted and optimized frequency-domain features back to the time domain.
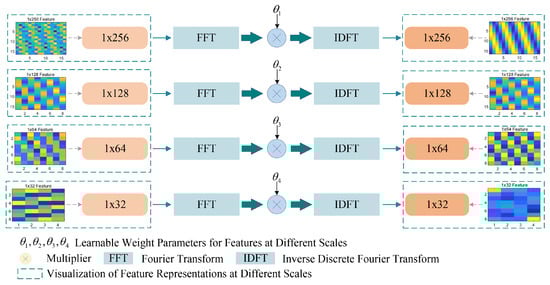
Figure 5.
Framework of frequency-domain feature enhancement module.
In Figure 5, the FFE module performs Fourier transform (FFT) processing on the features of the time series signal at multiple scales in parallel, to obtain the frequency domain features of the signal at different scales. Subsequently, the features at each scale are respectively multiplied by different learnable parameters, which can effectively screen the features, retain the key components needed, and ignore irrelevant information. Finally, the Inverse Discrete Fourier Transform (IDFT) is adopted to transform the adjusted features back to the original spatial domain, thereby obtaining the enhanced feature map. The specific operation process is shown in the following Equations (6)–(8).
in the equation, represents the transformed frequency-domain features, u is the discrete serial number in the time domain, k is the discrete serial number in the frequency domain, and D is the length of the sequence.
in the equation, is the enhanced frequency-domain feature, denotes retaining the real part of thefeature, and represents the learnable weight parameters for features at different scales, ⊙ is the Hadamard product.
in the equation, represents the time-domain feature after adjustment and enhancement.
The FFE module adjusts and enhances the features at different scales in the frequency domain, providing a more abundant and comprehensive feature representation. Consequently, it effectively improves the performance of the model when dealing with the spectrum sensing tasks of multiple radiation sources.
3.3. Similarity-Based Metric
Under a meta-task, for the multi-scale global features extracted from the support set and the query set by the MFE and FFE modules, this paper constructs a relation network for similarity measurement, which consists of an embedding module and a relation module . The embedding module maps the extracted multi-scale global features to an embedding space. In this space, after combining the feature maps of the query samples and the support set, they are input into the relation module for similarity comparison, and the relation scores between each pair of features are calculated. Finally, a score matrix is generated, which reflects the most likely class in the support set that the query samples belong to. Based on this score matrix, it can be determined which radiation sources the current signal is generated by Equation (9) is the calculation formula for the relation scores.
in the equation, i represents the number of query samples, j represents the samples in the support set, () and () are the feature maps of the support set and query set generated by the embedding module , is a kind of calculation symbol. is the relation module, and is the relation score between two samples.
For sample i in the query set, the similarity score of the corresponding support-set samples is used. The prediction is normalized into a probability distribution over classes through the Softmax function, as shown in Equation (10):
in the Equation, represents the probability that the i-th sample in the query set belongs to the j-th category in the support set, and n is the number of samples in the support set. For each sample in the query set, the support- set category with the highest probability is selected as its classification result, and the cross-entropy loss is used to optimize the model parameters. The Algorithm 1 outlines the procedure of the Training and Inference, the 5th row describes the operations of the Multi-scale Feature Extraction module, and the 6th row describes the operations of the Frequency-domain Feature Enhancement module and the 7th and 8th rows describe the operations of the Similarity-based Metric module.
| Algorithm 1 Few-shot Spectrum Sensing Training and Inference Algorithm Based on Re_MGFE |
| Training Input: /*Mixed signal, obtained by Formula (1) and normalized*/ Training Output: Re_MGFE_net /*Optimized network model*/ |
|
| Inference Input: /*Mixed signal, obtained by Formula (1) and completely different from the samples in */ Inference Output: /*Prediction result for */ |
|
4. Simulation Verification and Analysis
Given the difficulty of obtaining samples in a complex electromagnetic environment, this paper uses a relatively small-scale dataset. This dataset contains 8 different types of signals. Due to the superposition effect of different signals in space, there will be possible situations. According to the real world environment, we randomly selected 144 classes from all possible combinations as the few-shot training set. The test set is randomly selected from the remaining data that is not included in the training set.
In this paper, we adopt the idea of meta-learning multi-task, which aims to improve the network’s adaptability and generalisation to new tasks. The training and test sets are divided into multiple tasks, each consisting of a support set and a query set. The support set contains N classes and each class includes K samples, denoted as N-way K-shot. The query set has the same classes as the support set and is used to evaluate the network’s adaptability to that task.
In the experiment, the SNR ranges from −10∼16 dB with an interval of 2 dB. This paper uses the Adam algorithm for parameter iteration. The initial learning rate is set to 0.001, and a dynamic adjustment mechanism is adopted. After every 100 training epochs, the learning rate will decay to 0.8 times its original value. If the learning rate drops below , the training will terminate. The entire training process will go through 50,000 epochs to ensure the model can fully learn and converge, the the experimental parameter settings are shown in Table 4.
Table 4.
Experimental parameter settings.
4.1. Performance Comparison and Verification in Different Task Modes
In this section, a total of six task modes, namely 5-way 5-shot, 5-way 1-shot, 7-way 5-shot, 7-way 1-shot, 11-way 5-shot and 11-way 1-shot, are selected for comparative analyses, aiming to validate the recognition performance of the Re_MGFE method proposed in this paper under different task modes.
As can be seen from Figure 6, under the same SNR, the recognition accuracy of the 5-way task mode is higher than that of the other four task modes; under the same conditions of category and SNR, the recognition accuracy of the 5-shot task mode is slightly higher than that of the 1-shot. with the increase of SNR, the accuracy of all the task modes are in an increasing trend and gradually close to each other. When SNR ≥ 2 dB, the recognition accuracy of all task modes are greater than 80%, which indicates that the method in this paper has better recognition performance in different task modes.
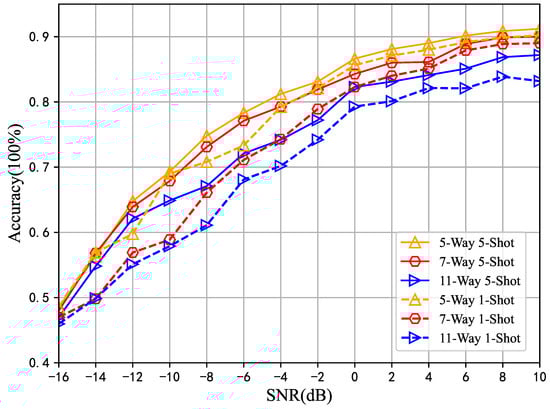
Figure 6.
Comparison of Re_MGFE recognition performance in different task modes.
4.2. Comparative Validation of LWFR Performance in FFE Module
In order to validate the effectiveness of LWFR, two different feature reinforcers, GIE [24] and GFI [28], are chosen to replace LWFR respectively for comparative analysis in two task modes: 5-way 5-shot and 5-way 1-shot. In particular, the GIE uses a learnable real-valued filter to modulate the frequency components to provide attentional information to the feature extractor, while the GFI module utilizes a learnable complex-valued global filter to enhance the frequency domain information. Compared to the above two feature reinforcer, LWFR maximizes the use of recognizable features at multiple scales by weighting features at different scales with the help of multiple learnable parameters. Figure 7 shows the comparison of the recognition performance of different feature reinforcer in the two task modes.
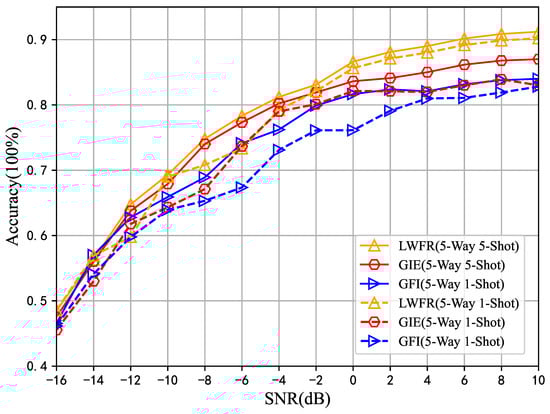
Figure 7.
Comparison of recognition performance of different feature reinforcers.
As seen in Figure 7, the recognition accuracy of all three feature extractors is significantly improved as the SNR increases. When the SNR is under −16∼10 dB, the average recognition accuracies of LWFR under the two task modes reach 78.03% and 76.41%, respectively, which are about 2.81% to 5.85% higher than the other two methods, and the experimental results show that the LWFR proposed in this paper outperforms the GIE and the GFI, and has a higher recognition capability. It is proved that using multiple learnable parameters to weight the features of different scales can effectively retain the useful components in the signal, so that the frequency features are fully utilized, and thus achieve the accurate recognition of the radiation source.
4.3. Comparative Validation of Recognition Performance of Different Networks
Figure 8 and Figure 9 give the comparison of the recognition accuray of Re_GMFE proposed with SSL-ProtoNet [23], GIEN [24], SSwsrNet [25], M-MFOR [26], and SAML [27] for four task modes with SNR ranging from −16 dB to 10 dB, 5-way, 11-way, etc., respectively.
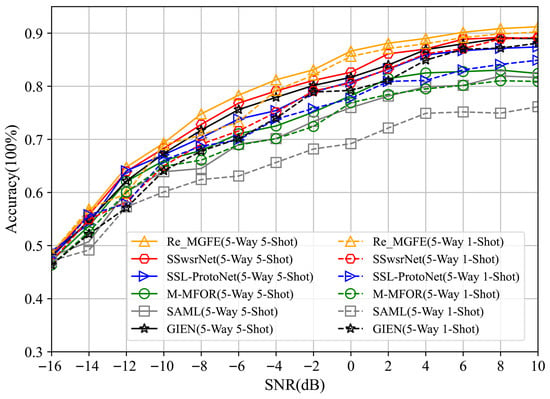
Figure 8.
Comparison of accuracy of different networks under 5-way conditions.
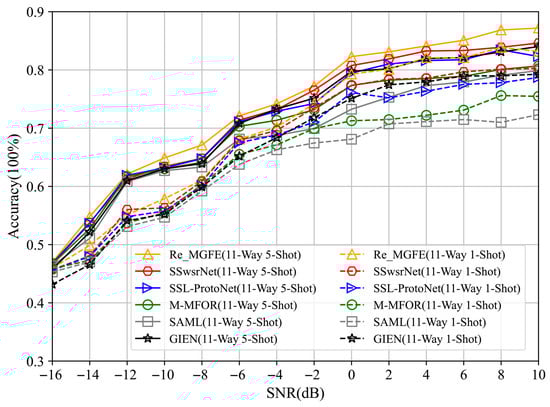
Figure 9.
Comparison of accuracy of different networks under 11-way conditions.
As can be seen in Figure 8, in the five-classification case, the recognition accuracy of all six networks steadily increase as the SNR rises. In the 5-way 5-shot condition, the average recognition accuracy of the Re_GMFE network is higher than that of the other networks by 1.68%, 2.58%, 3.46%, 6.17%, and 8.19%, respectively; in the 5-way 1-shot condition, the average recognition accuracy of the Re_GMFE network is higher than that of the other networks by 2.45%, 3.69%, 4.41%, 6.51%, and 11.01%. Particularly in low signal-to-noise ratio environments with an SNR ranging from −16 dB to −8 dB, the performance advantage of Re_GMFE is more prominent. Its average accuracy is 3% to 5% higher than that of single-scale or local feature optimization networks such as GIEN and SAML. This phenomenon fully demonstrates that its multi-scale frequency-domain feature enhancement design can still accurately capture the key frequency-domain information of signals under strong noise interference, thereby avoiding the interference of noise on feature extraction.
As can be seen from Figure 9, the recognition accuracy of all networks also shows an increasing trend in the eleven-classification case. In the 11-way 5-shot condition, the average recognition accuracy of the Re_GMFE network is higher than that of the other networks by 1.36%, 2.27%, 2.14%, 3.65%, and 5.29%, respectively; and in the 11-way 1-shot condition, the average recognition accuracy of the Re_GMFE network is higher than that of the other networks by 1.48%, 2.93%, 2.84%, 4.91%, and 6.54%, respectively. Notably, in the 1-shot task where samples are even scarcer, the accuracy improvement of Re_GMFE over comparative networks is more significant. Specifically, it outperforms SAML by 6.54%. This result demonstrates that by capturing global features covering different scales of the signal, the problem of insufficient feature representation caused by limited data in few-shot scenarios can be effectively addressed, thereby enhancing the network’s generalized recognition capability for complex signals.
Table 5 gives the average recognition accuracy of six networks such as Re_GMFE under different task modes with SNR ranging from 0 to 10 dB. From Table 5, it can be seen that the Re_GMFE network has good recognition ability under the above four task modes.
Table 5.
Comparison of the average recognition accuracy of different networks under 0–10 dB.
In order to comprehensively assess the network performance, Table 6 analyzes the complexity of models such as Re_MGFE in terms of four dimensions: the number of network parameters, the amount of computation for a single sample, the training time and the inference duration. The comparison shows that the Re_MGFE method adopts a more concise network design pattern, which makes its network overhead significantly lower than SSSwsrNet, GIEN, SSL-ProtoNet and M-MFOR, and slightly higher than SAML. After considering the recognition accuracy and reasoning efficiency, the results prove that the Re_MGFE method has a more superior comprehensive performance.
Table 6.
Comparison of complexity of different networks.
4.4. Comparative Verification of Signal Discrimination Ability
In order to evaluate the network performance more objectively, the F1-score is used as a measurement criterion to give the scores of the network on different signal recognition abilities; in addition, the simulation results of the four network models on a variety of signal discrimination abilities are given by using confusion diagrams. Table 7 and Table 8 demonstrate the case settings for different classification cases. Figure 10 and Figure 11 give histograms of the F1-scores of the five networks for the five and eleven classifications under SNR = 0 dB, respectively.
Table 7.
Situations of cases under five-class classification.
Table 8.
Situations of cases under eleven-class classification.
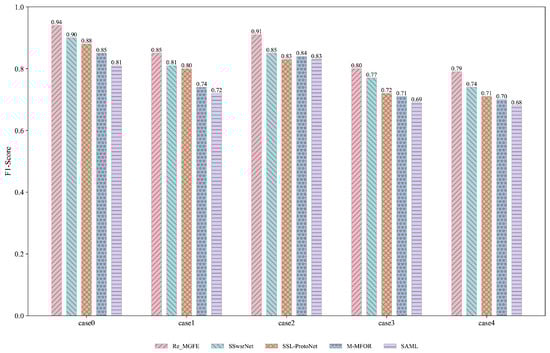
Figure 10.
F1-score comparison plot (5way-SNR = 0 dB).
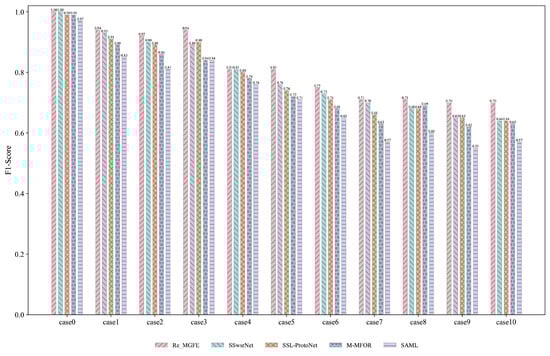
Figure 11.
F1-score comparison plot (11way-SNR = 0 dB).
As can be seen from Figure 10, the three networks Re_MGFE, SSSwsrNet, and SSL-ProtoNet have significantly higher F1-score values than the other two networks for the Case 0 and Case 2. For the classification of Case 3 and Case 4, the F1-score values of the above five network frameworks are lower than 0.8. This is because in the dataset used in this paper, the Case 3 and Case 4 consist of a variety of indistinguishable signals, which makes it more difficult to achieve accurate differentiation with a limited number of training samples.
As can be seen from Figure 11, in the eleven classification cases, the F1-score values of the three networks Re_MGFE, SSSwsrNet, and SSL-ProtoNet are generally higher than the other two networks in the Case 0, Case 1, Case 2, and Case 3. However, in the remaining classification tasks, the F1-score values of the five network frameworks not only declined overall, but also fluctuated significantly. This is mainly due to the fact that the signals in the rest of the classification tasks have complex compositions, which are difficult to be effectively differentiated, thus leading to an increase in the difficulty of classification.
A comparison of the confusion matrices for the five cases in the 5-way 5-shot condition is given in Figure 12. As can be seen from the figure, the Re_GMFE network can alleviate the problem of signal confusion in case3 and case4 compared to the other three networks.
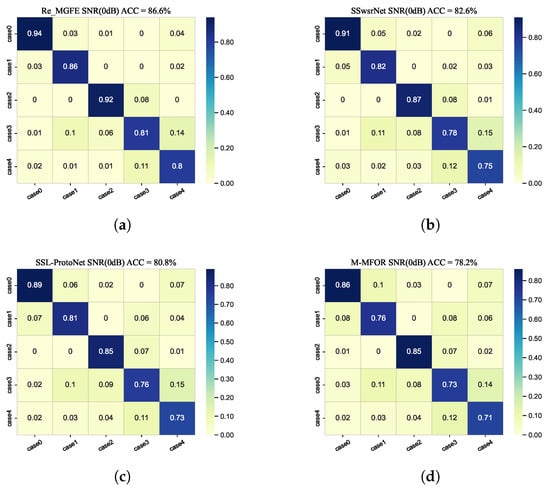
Figure 12.
Confusion matrix plot (5way-SNR = 0 dB). (a) Re_MGFE, (b) SSwsrNet, (c) SSL-ProtoNet, (d) M-MFOR.
Figure 13 gives a comparison of the confusion matrices of the four networks, Re_GMFE, SSwsrNet, SSL-ProtoNet, and M-MFOR, for 11 cases in the 11-way 5-shot condition at 0 dB. As can be seen from the figure, the Re_GMFE network has a greater improvement in perceptual recognition compared to the other three networks in this condition.
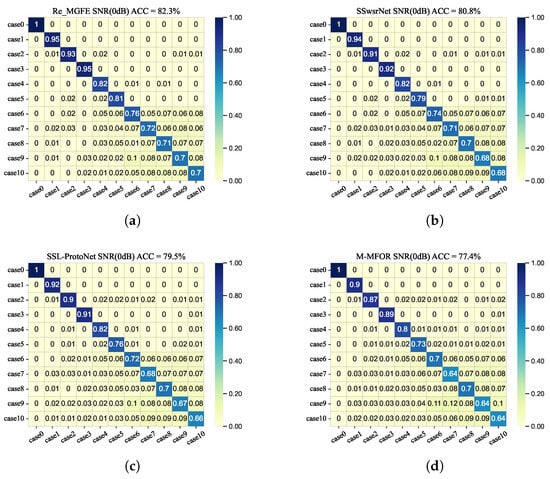
Figure 13.
Confusion matrix plot (11way-SNR = 0 dB). (a) Re_MGFE, (b) SSwsrNet, (c) SSL-ProtoNet, (d) M-MFOR.
5. Conclusions
In this paper, a multi-scale global feature embedding spectrum sensing method based on relation network is proposed. First, the method constructs a multi-scale feature extractor to capture local features of signals at different scales; then, it performs Fourier transform on the multi-scale features to mine frequency-domain information; finally, it fuses the multi-scale frequency-domain features to achieve the collaborative extraction of global and local features. This design effectively enhances the diversity and comprehensiveness of feature extraction, thereby avoiding the problem that insufficient feature extraction impairs the network’s signal recognition capability. Meanwhile, by combining a multi-task mode with an optimization strategy for weighting parameters of features at different scales, the model’s adaptability to complex scenarios is further improved. Comparative analysis of the network’s recognition performance shows that when the signal-to-noise ratio ranges from 0 dB to 10 dB, the proposed Re_MGFE network achieves a recognition accuracy of over 81% under different task modes, outperforming existing methods. This proves that the proposed method can effectively improve the network’s feature extraction capability under small-sample conditions and significantly enhance the network’s ability to distinguish signals across different task modes. In future research, we will improve the model’s generalization ability for different application scenarios by enhancing sample expansion methods for multi-scenario and multi-type signals, further increasing the method’s practicality in few-shot scenarios.
Author Contributions
Validation, J.R. and L.T.; Formal analysis, J.W. (Jiayi Wang); Writing—original draft, F.Z.; Writing—review & editing, J.W. (JianWang); Supervision, J.W. (Jiayi Wang) and S.L.; Project administration, P.Z. All authors have read and agreed to the published version of the manuscript.
Funding
This research was funded by the Fundamental Scientific Research Projects for Higher Education Institutions of Liaoning Provincial Department of Education (No. LJ212510144028), Shenyang Science and Technology Program (No. 23-503-6-16) and the National Natural Science Foundation of China (No. 61971291).
Data Availability Statement
The original contributions presented in this study are included in the article. Further inquiries can be directed to the corresponding authors.
Conflicts of Interest
The authors declare no conflicts of interest.
References
- Muzaffar, M.U.; Sharqi, R. A review of spectrum sensing in modern cognitive radio networks. Telecommun. Syst. 2024, 85, 347–363. [Google Scholar] [CrossRef]
- Xing, H.; Qin, H.; Luo, S.; Dai, P.; Xu, L.; Cheng, X. Spectrum sensing in cognitive radio: A deep learning based model. Trans. Emerg. Telecommun. Technol. 2021, 33, e4388. [Google Scholar] [CrossRef]
- Chaturvedi, A.; Prasad, K.D.V.; Gowda, D.; De, T.; Tanguturi, R.C.; Ashreetha, B. A Novel method of Improving spectrum sensing management system for CR-IoT networks. In Proceedings of the 2023 4th International Conference for Emerging Technology (INCET), Belgaum, India, 26–28 May 2023. [Google Scholar]
- Abood, M.H.; Abdullah, H.N. Efficient Cyclostationary Spectrum Sensing Using Low Complexity FFT Algorithms. Iraqi J. Inf. Commun. Technol. 2024, 7, 35–46. [Google Scholar] [CrossRef]
- Kononov, A.A.; Ka, M.-H. Rapid Adaptive Matched Filter for Detecting Radar Targets with Unknown Velocity. IEEE Access 2024, 12, 25411–25428. [Google Scholar] [CrossRef]
- Rui, L.; Ding, X.; Wu, S.; Wu, Q.; Shao, Y. Signal processing collaborated with deep learning: An interpretable FIRNet for industrial intelligent diagnosis. Mech. Syst. Signal Process. 2024, 212, 111314. [Google Scholar] [CrossRef]
- Wang, J.; Wu, S.; Zhang, H.; Yuan, B.; Dai, C.; Pal, N.R. Universal Approximation Abilities of a Modular Differentiable Neural Network. IEEE Trans. Neural Netw. Learn. Syst. 2024, 36, 5586–5600. [Google Scholar] [CrossRef] [PubMed]
- Gao, T.; Gong, X.; Zhang, K.; Lin, F.; Wang, J.; Huang, T.; Zurada, J.M. A recalling-enhanced recurrent neural network: Conjugate gradient learning algorithm and its convergence analysis. Inf. Sci. 2020, 519, 273–288. [Google Scholar] [CrossRef]
- Niu, Z.; Zhong, G.; Yu, H. A review on the attention mechanism of deep learning. Neurocomputing 2021, 452, 48–62. [Google Scholar] [CrossRef]
- Wang, Y.; Feng, Y.; Zhou, F.; Chen, X.; Wang, J.; Zhang, P. A Sparse Feature-Based Mixed Signal Frequencies Detecting for Unmanned Aerial Vehicle Communications. Drones 2025, 9, 34. [Google Scholar] [CrossRef]
- Zhou, F.; Wang, J.; Zhang, L.; Wang, Y.; Chen, X.; Zhang, P. CFGAN: A Conditional Filter Generative Adversarial Network for Signal Modulation Mode Recognition. Electronics 2024, 14, 12. [Google Scholar] [CrossRef]
- Song, Y.; Wang, T.; Cai, P.; Mondal, S.K.; Sahoo, J.P. A comprehensive survey of few-shot learning: Evolution, applications, challenges, and opportunities. ACM Comput. Surv. 2023, 55, 1–40. [Google Scholar] [CrossRef]
- Gharoun, H.; Momenifar, F.; Chen, F.; Gandomi, A.H. Meta-learning approaches for few-shot learning: A survey of recent advances. ACM Comput. Surv. 2024, 56, 1–41. [Google Scholar] [CrossRef]
- Kulkarni, U.; M, M.S.; Hallyal, R.; Sulibhavi, P.; G, S.V.; Guggari, S.; Shanbhag, A.R. Optimisation of deep neural network model using Reptile meta learning approach. Cogn. Comput. Syst. 2023, 7, e12096. [Google Scholar] [CrossRef]
- Sun, Q.; Liu, Y.; Chua, T.-S.; Schiele, B. Meta-transfer learning for few-shot learning. In Proceedings of the IEEE/CVF Conference on Computer Vision and Pattern Recognition, Long Beach, CA, USA, 15–20 June 2019; pp. 403–412. [Google Scholar]
- Li, X.; Yang, X.; Ma, Z.; Xue, J.-H. Deep metric learning for few-shot image classification: A review of recent developments. Pattern Recognit. 2023, 138, 109381. [Google Scholar] [CrossRef]
- Feng, C.; Cao, Z.; Xiao, Y.; Fang, Z.; Zhou, J.T. Multi-spectral template matching based object detection in a few-shot learning manner. Inf. Sci. 2023, 624, 20–36. [Google Scholar] [CrossRef]
- Kunchakuri, N.; Kamuni, N.; Dodda, S.; Chintala, S. Meta-Learning for Efficient Cross-Domain Sentiment Categorization: Leveraging Small Training Datasets for Enhanced Classifier Performance. In Proceedings of the 2024 Second International Conference Computational and Characterization Techniques in Engineering & Sciences (IC3TES), Lucknow, India, 15–16 November 2024. [Google Scholar]
- Zhang, J.; Cui, L.; Wang, W.; Patnaik, L.M. Extended Prototypical Network for Few-Shot Learning. In AI Methods and Applications in 3D Technologies, Proceedings of the World Conference on Intelligent and 3D Technologies, Shanghai, China, 26–28 May 2023; Springer Nature: Singapore, 2023. [Google Scholar]
- Jiang, W.; Huang, K.; Geng, J.; Deng, X. Multi-scale metric learning for few-shot learning. IEEE Trans. Circuits Syst. Video Technol. 2020, 31, 1091–1102. [Google Scholar] [CrossRef]
- Zheng, W.; Liu, X.; Yin, L. Research on image classification method based on improved multi-scale relational network. PeerJ Comput. Sci. 2021, 7, E613. [Google Scholar] [CrossRef] [PubMed]
- Mishra, A.; Singh, U.P.; Singh, K.P. A lightweight relation network for few-shots classification of hyperspectral images. Neural Comput. Appl. 2023, 35, 11417–11430. [Google Scholar] [CrossRef]
- Lim, J.Y.; Lim, K.M.; Lee, C.P.; Tan, Y.X. SSL-ProtoNet: Self-supervised Learning Prototypical Networks for few-shot learning. Expert Syst. Appl. 2024, 238, 122173. [Google Scholar] [CrossRef]
- Feng, R.; Ji, H.; Zhu, Z.; Wang, L. Global information embedding network for few-shot learning. IEEE Signal Process. Lett. 2024, 31, 501–505. [Google Scholar] [CrossRef]
- Zhang, H.; Zhou, F.; Wu, Q.; Al-Dhahir, N. SSwsrNet: A Semi-Supervised Few-shot Learning Framework for Wireless Signal Recognition. IEEE Trans. Commun. 2024, 72, 5823–5836. [Google Scholar] [CrossRef]
- Hao, X.; Feng, Z.; Yang, S.; Wang, M.; Jiao, L. Automatic modulation classification via meta-learning. IEEE Internet Things J. 2023, 10, 12276–12292. [Google Scholar] [CrossRef]
- Hao, F.; He, F.; Cheng, J.; Wang, L.; Cao, J.; Tao, D. Collect and select: Semantic alignment metric learning for few-shot learning. In Proceedings of the IEEE/CVF International Conference on Computer Vision, Seoul, Republic of Korea, 27 October–2 November 2019; pp. 8460–8469. [Google Scholar]
- Rao, Y.; Zhao, W.; Zhu, Z.; Lu, J.; Zhou, J. Global filter networks for image classification. Adv. Neural Inf. Process. Syst. 2021, 34, 980–993. [Google Scholar]
Disclaimer/Publisher’s Note: The statements, opinions and data contained in all publications are solely those of the individual author(s) and contributor(s) and not of MDPI and/or the editor(s). MDPI and/or the editor(s) disclaim responsibility for any injury to people or property resulting from any ideas, methods, instructions or products referred to in the content. |
© 2025 by the authors. Licensee MDPI, Basel, Switzerland. This article is an open access article distributed under the terms and conditions of the Creative Commons Attribution (CC BY) license (https://creativecommons.org/licenses/by/4.0/).