1. Introduction
Modern sports are rapidly evolving through the integration of digital technologies that enhance performance analysis, training methods, and real-time feedback systems. While traditional approaches relied heavily on empirical knowledge and manual coaching, today’s sports environment is being fundamentally transformed by innovations such as the Internet of Things (IoT) and Artificial Intelligence (AI).
Together, these technologies offer unprecedented capabilities for real-time monitoring, analysis, and optimization of athletic performance [
1,
2,
3].
The IoT encompasses embedded systems, sensors, RFID (Radio-Frequency Identification) tags, and wireless communication devices that enable seamless data acquisition and automated responses across a variety of domains, including healthcare, smart homes, and increasingly, sports [
4,
5,
6]. In the sports context, IoT allows continuous monitoring of physiological and biomechanical metrics using wearable technologies such as WBANs (Wireless Body Area Networks) [
7], enabling proactive injury prevention and performance optimization. These networks collect data on heart rate, motion, blood pressure, and more, allowing coaches and medical staff to gain critical insights in real time [
8]. The effectiveness of these systems is further amplified through next-generation communication technologies such as 5G, which ensures low-latency data transmission and broad connectivity [
9].
IoT applications in basketball have taken multiple forms, ranging from player health monitoring and training analysis to real-time game event tracking and spectator engagement. Devices embedded in jerseys, shoes, or even attached to backboards allow for precise tracking of metrics such as jump height, shooting angle, and heart rate during training and gameplay [
10]. Some systems integrate RFID chips and wireless sensor networks to detect player positions, ball trajectories, and even environmental variables such as court temperature and humidity [
11]. These IoT-enhanced capabilities support smarter coaching decisions, reduce the risk of overtraining, and enable personalized development plans for athletes.
By leveraging Artificial Intelligence (AI), the system can efficiently process the massive influx of data generated by IoT devices, enabling more informed and timely decision-making. AI algorithms can detect hidden patterns, predict injuries, analyze game strategies, and provide automated feedback to players and coaches [
12]. In basketball, computer vision systems powered by AI models like CNNs (Convolutional Neural Networks) and YOLO (You Only Look Once) are used to detect player movements, track ball trajectories, and recognize scoring events in real time. Combined with IoT, AI allows for a proactive approach to training, where interventions can be made before injuries occur or performance deteriorates [
13].
Effectively integrating such systems into real-world basketball environments presents several challenges. Most existing systems are either too expensive, require invasive infrastructure changes, or fail to operate reliably in dynamic, outdoor environments. Additionally, many systems focus primarily on player biometrics or positioning but lack a robust mechanism for accurate, real-time score detection. There is a clear need for a compact, low-cost, and infrastructure-independent system capable of identifying successful scoring events under various lighting and gameplay conditions.
This paper presents a novel vision-based score detection architecture for smart IoT basketball systems. At its core is a compact, Raspberry Pi-based edge device equipped with a high-resolution camera and a lightweight convolutional neural network (YOLOv8n). Due to the low illumination conditions (60–300 lux) and varying ball velocities across different shot types, baseline motion-based methods such as frame differencing or static region-of-interest tracking were not applied in this study. These approaches proved unreliable under the impaired visibility conditions, where motion blur, occlusions, and noise significantly affected the visibility and consistency of the ball trajectory.
Execution speed and throughput were not only measured on Raspberry Pi with and without Hailo-8L acceleration but also measured and compared across various hardware platforms like Jetson Nano, Jetson Orin Nano, and a standard PC with GPU acceleration. Mounted above the backboard, the system captures the hoop region and tracks ball movement with high precision. By applying Kalman filtering and geometric analysis, it confirms successful scores only when the ball exhibits downward motion through the hoop across multiple frames. The processed data is transmitted via Wi-Fi to a remote dashboard interface, forming part of the broader KošKo platform. This approach builds upon previous research efforts [
14] that demonstrated the viability of vision-based detection systems in basketball and highlighted the importance of balancing hardware complexity and cost-efficiency. Prior studies revealed that a pre-trained model trained in diverse indoor and outdoor scenes offered better generalization than fine-tuned models specialized for constrained environments [
15]. Furthermore, future iterations of the KošKo system are envisioned to integrate player recognition and shot-type classification based on spatial positioning, opening pathways for personalized analytics and strategic insights. By advancing this foundation, our system offers an affordable, scalable, and non-invasive solution for intelligent basketball analytics, enhancing training, gameplay monitoring, and user engagement.
2. Related Work
Object recognition and tracking represent core challenges in computer vision, both of which have seen remarkable advancements in recent years due to the rise in deep learning (DL) and convolutional neural networks (CNNs). Traditional object classification approaches relied heavily on hand-crafted feature extraction, making them highly dependent on expert-designed representations, thereby increasing complexity and computational costs [
16]. The emergence of deep learning has revolutionized this process by enabling models to automatically learn hierarchical feature representations from raw image data, improving accuracy and robustness in recognition tasks [
17]. This transformation has been particularly significant in applications such as medical image classification, where deep networks have been employed to detect diseases like skin cancer, as well as in environmental monitoring, where high-resolution imagery has been used for disaster assessment, including floods and wildfires [
18]. In the domain of object detection, deep neural network (DNN)-based models such as SSD (Single Shot MultiBox Detector) and Faster R-CNN (Region-Based Convolutional Neural Network) have demonstrated superior performance, while the YOLO architecture has gained popularity for its real-time detection capabilities, including applications in animal tracking and behavioral analysis [
19,
20].
The impact of deep learning extends beyond static object detection, significantly influencing visual object tracking. AlexNet’s breakthrough in 2012 marked a turning point, leading to the rapid development of deep tracking models [
21]. The primary advantage of deep learning in tracking lies in its ability to extract rich, multi-scale features, enabling robust and adaptive representations of target objects. Unlike traditional tracking pipelines that rely on separate feature extraction and classification stages, end-to-end deep tracking frameworks integrate these processes, learning a dynamic target model directly from sequential video frames. This approach aligns with recent advances in semantic and dynamic SLAM (Simultaneous Localization and Mapping) systems, such as MaskFusion which combines instance-aware segmentation with real-time object tracking, these frameworks leverage both appearance and motion cues for robust tracking in dynamic environments [
22]. Several deep tracking algorithms, such as HCF (Hierarchical Correlation Filter), MDNet (Multi-Domain Network), and SiamFC (Fully Convolutional Siamese Network), have demonstrated improvements by leveraging deep feature representations, correlation filters, and Siamese networks, enhancing tracking performance in complex scenarios [
23,
24]. Additionally, architectural advancements, including residual networks and attention mechanisms, have further refined object tracking by improving feature expressiveness and model focus. More recently, the introduction of Transformer architecture has provided a novel approach to tracking, fully leveraging temporal dependencies to enhance dynamic target representation [
25]. Despite these developments, challenges remain in balancing computational demands, model interpretability, and generalization. Techniques such as model compression, network pruning, and semi-supervised learning have emerged as promising solutions to optimize efficiency while maintaining accuracy [
26]. Continued advancements in deep learning are expected to further enhance the robustness, adaptability, and real-world applicability of object tracking models.
The YOLO (You Only Look Once) framework has established itself as a leading real-time object detection algorithm, consistently achieving a balance between speed and accuracy across its iterations. Since its introduction in 2016, YOLO has undergone significant enhancements, evolving from YOLOv1 to YOLOv8, with each version introducing architectural refinements aimed at improving detection performance [
27]. Key advancements include the adoption of anchor boxes in YOLOv2, multi-scale feature extraction in YOLOv3, and extensive optimizations in YOLOv4 and beyond, such as the integration of CSPDarknet backbones and improved loss functions [
28]. More recent iterations, including YOLOv5’s PyTorch 1.8 based implementation, YOLOv7’s efficiency-driven design, and YOLOv8’s anchor-free approach with decoupled detection heads, have further refined both accuracy and computational efficiency [
29,
30,
31]. Alongside the YOLO family, alternative models such as PP-YOLO, YOLOX, and YOLO-NAS have introduced variations addressing specific challenges, including improved small object detection and the use of neural architecture search (NAS) [
32,
33,
34]. PP-YOLO is an optimized version of YOLO built on the PaddlePaddle framework to improve speed and accuracy, YOLOX enhances performance by using decoupled heads and anchor-free detection, while YOLO-NAS applies neural architecture search to automatically refine the model for better efficiency and precision. Additionally, the integration of transformer-based architecture has expanded YOLO’s application beyond traditional object detection, demonstrating potential in vision tasks requiring deeper contextual understanding [
35]. Despite these advancements, the trade-off between accuracy and computational efficiency remains a critical area of research, driving the development of hybrid architectures and optimization techniques aimed at enhancing real-time detection capabilities while maintaining robustness across diverse environments [
36].
The deployment of CNNs on edge computing hardware, particularly Raspberry Pi devices, has enabled real-time artificial intelligence (AI) applications across various domains, including security, assistive technologies, and animal behavior monitoring [
37]. The lightweight architecture and low power consumption of Raspberry Pi, often complemented by accelerators such as Intel Neural Compute Stick 2 (NCS2), facilitate the execution of deep learning models despite limited computational resources [
38]. Studies have demonstrated the feasibility of deploying YOLO-based object detection for pet behavior analysis, household object localization for the elderly, and security monitoring using IoT-integrated CNNs [
39]. Benchmark analyses indicate that while Raspberry Pi-based solutions offer cost-effective and portable AI deployment, their performance is influenced by factors such as model selection, hardware optimization, and inference workload balancing. For instance, YOLOv3-Tiny has been shown to provide a favorable trade-off between speed and accuracy on Raspberry Pi, outperforming full-scale YOLO models in frame rate while maintaining adequate detection precision. Furthermore, integrating cloud-based processing, such as Google Vertex AI and AWS (Amazon Web Services), enhances the capabilities of CNNs on edge devices, enabling complex tasks like weapon detection with high accuracy [
40,
41]. The integration of DenseNet and CNN architectures with mobile edge computing has significantly enhanced real-time lung cancer diagnosis by enabling efficient processing and classification of CT scans directly at the data source, reducing latency and computational overhead in medical imaging applications [
41]. Nevertheless, challenges remain in optimizing inference speed, memory efficiency, and energy consumption. Research into hardware acceleration, quantization techniques, and hybrid edge-cloud architectures continues to be essential for maximizing the effectiveness of CNNs in real-time edge computing applications [
42].
The application of deep learning in basketball analytics has significantly advanced automated game analysis, with CNN-based methods enabling precise ball tracking and score detection. By integrating Faster R-CNN and Kalman filtering, researchers have enhanced target detection and motion tracking precision, reducing the error between real and tracked trajectories to below 3% [
43]. Beyond tracking, score detection has been addressed through real-time YOLO-based hoop localization combined with frame-difference motion analysis, achieving high detection accuracy in automated scoring systems [
44]. These methods have been deployed in intelligent basketball courts, providing real-time performance evaluation and assisting in player training [
45]. While current models exhibit strong results, future improvements will focus on expanding datasets, refining multi-player occlusion handling, and integrating wearable sensors for enhanced biomechanical analysis. These advancements will further bridge the gap between AI-driven analytics and practical sports performance assessment, enhancing both training methodologies and game evaluation. Refs. [
3,
4,
5] approaches.
3. Design Methodology
This section may be divided by subheadings. It should provide a concise and precise description of the experimental results, their interpretation, as well as the experimental conclusions that can be drawn.
3.1. System Architecture
The basketball score detection module is an integral element of a broader smart IoT vision system designed to enhance court-based analytics. This module utilizes a single overhead camera positioned just above and behind the backboard, which captures the hoop area from a consistent angle. Housed within a protective casing that also contains a compact Raspberry Pi-based processor, the setup ensures system durability and minimizes additional hardware costs (see
Figure 1). Notably, this compact configuration eliminates the need for modifying court infrastructure.
The architecture of the basketball score detection device is illustrated in
Figure 2. At the core of the system is a Raspberry Pi 5, which serves as the primary control and processing unit. A high-resolution camera, capable of capturing images at 1640 × 1232 pixels, is directly connected to the Pi and positioned to monitor the basketball hoop area. This camera feeds image data into the Pi’s buffer and enables timely and efficient frame acquisition. To meet the demands of real-time image analysis, the Raspberry Pi offloads complex processing tasks to an external hardware accelerator via PCIe (Peripheral Component Interconnect Express) communication. This accelerator handles computationally intensive operations such as object detection, score recognition, and event classification.
Once image data is processed, the system transmits the relevant results, formatted as structured JSON (JavaScript Object Notation) packets, over Wi-Fi to a remote server for further integration into analytics dashboards or coaching tools. This communication module ensures that the system remains lightweight and minimally invasive to the court environment, as no wired infrastructure is required. The modularity and compactness of this design make it highly adaptable for deployment in both indoor and outdoor basketball courts. It is an essential part of a broader, low-cost, scalable IoT-based basketball analytics platform.
The software for the image acquisition and score detection device was developed in Python 3.8. It has been chosen for its availability of open-source libraries that support image processing and machine learning tasks. Notably, the system integrates NumPy for efficient numerical computations and OpenCV for real-time computer vision applications, including image acquisition, preprocessing, and feature extraction.
The chosen platform, the Raspberry Pi 5, operates on the Raspbian OS, a Debian-based Linux distribution specifically optimized for Raspberry Pi hardware. This operating system provides a stable and lightweight environment with full support for Python and its scientific computing ecosystem. The Linux foundation of Raspbian enables for the use of shell scripts, system services, and cron jobs (Linux-based mechanisms for automating and managing tasks) to automate software execution, logging, and periodic updates, all of which are required for autonomous operation in score detection.
To improve the software’s efficiency and adaptability, a modular code design was used. It allows for the simple incorporation of additional functionalities like object detection, optical character recognition (OCR), and cloud-based data synchronization. The system is capable of on-device inference with pre-trained models suited for edge computing. The result is real-time score detection and context-aware caption synthesis without requiring constant cloud access. The setup also balances computing demands with power efficiency.
3.2. IoT-Based Score Monitoring System
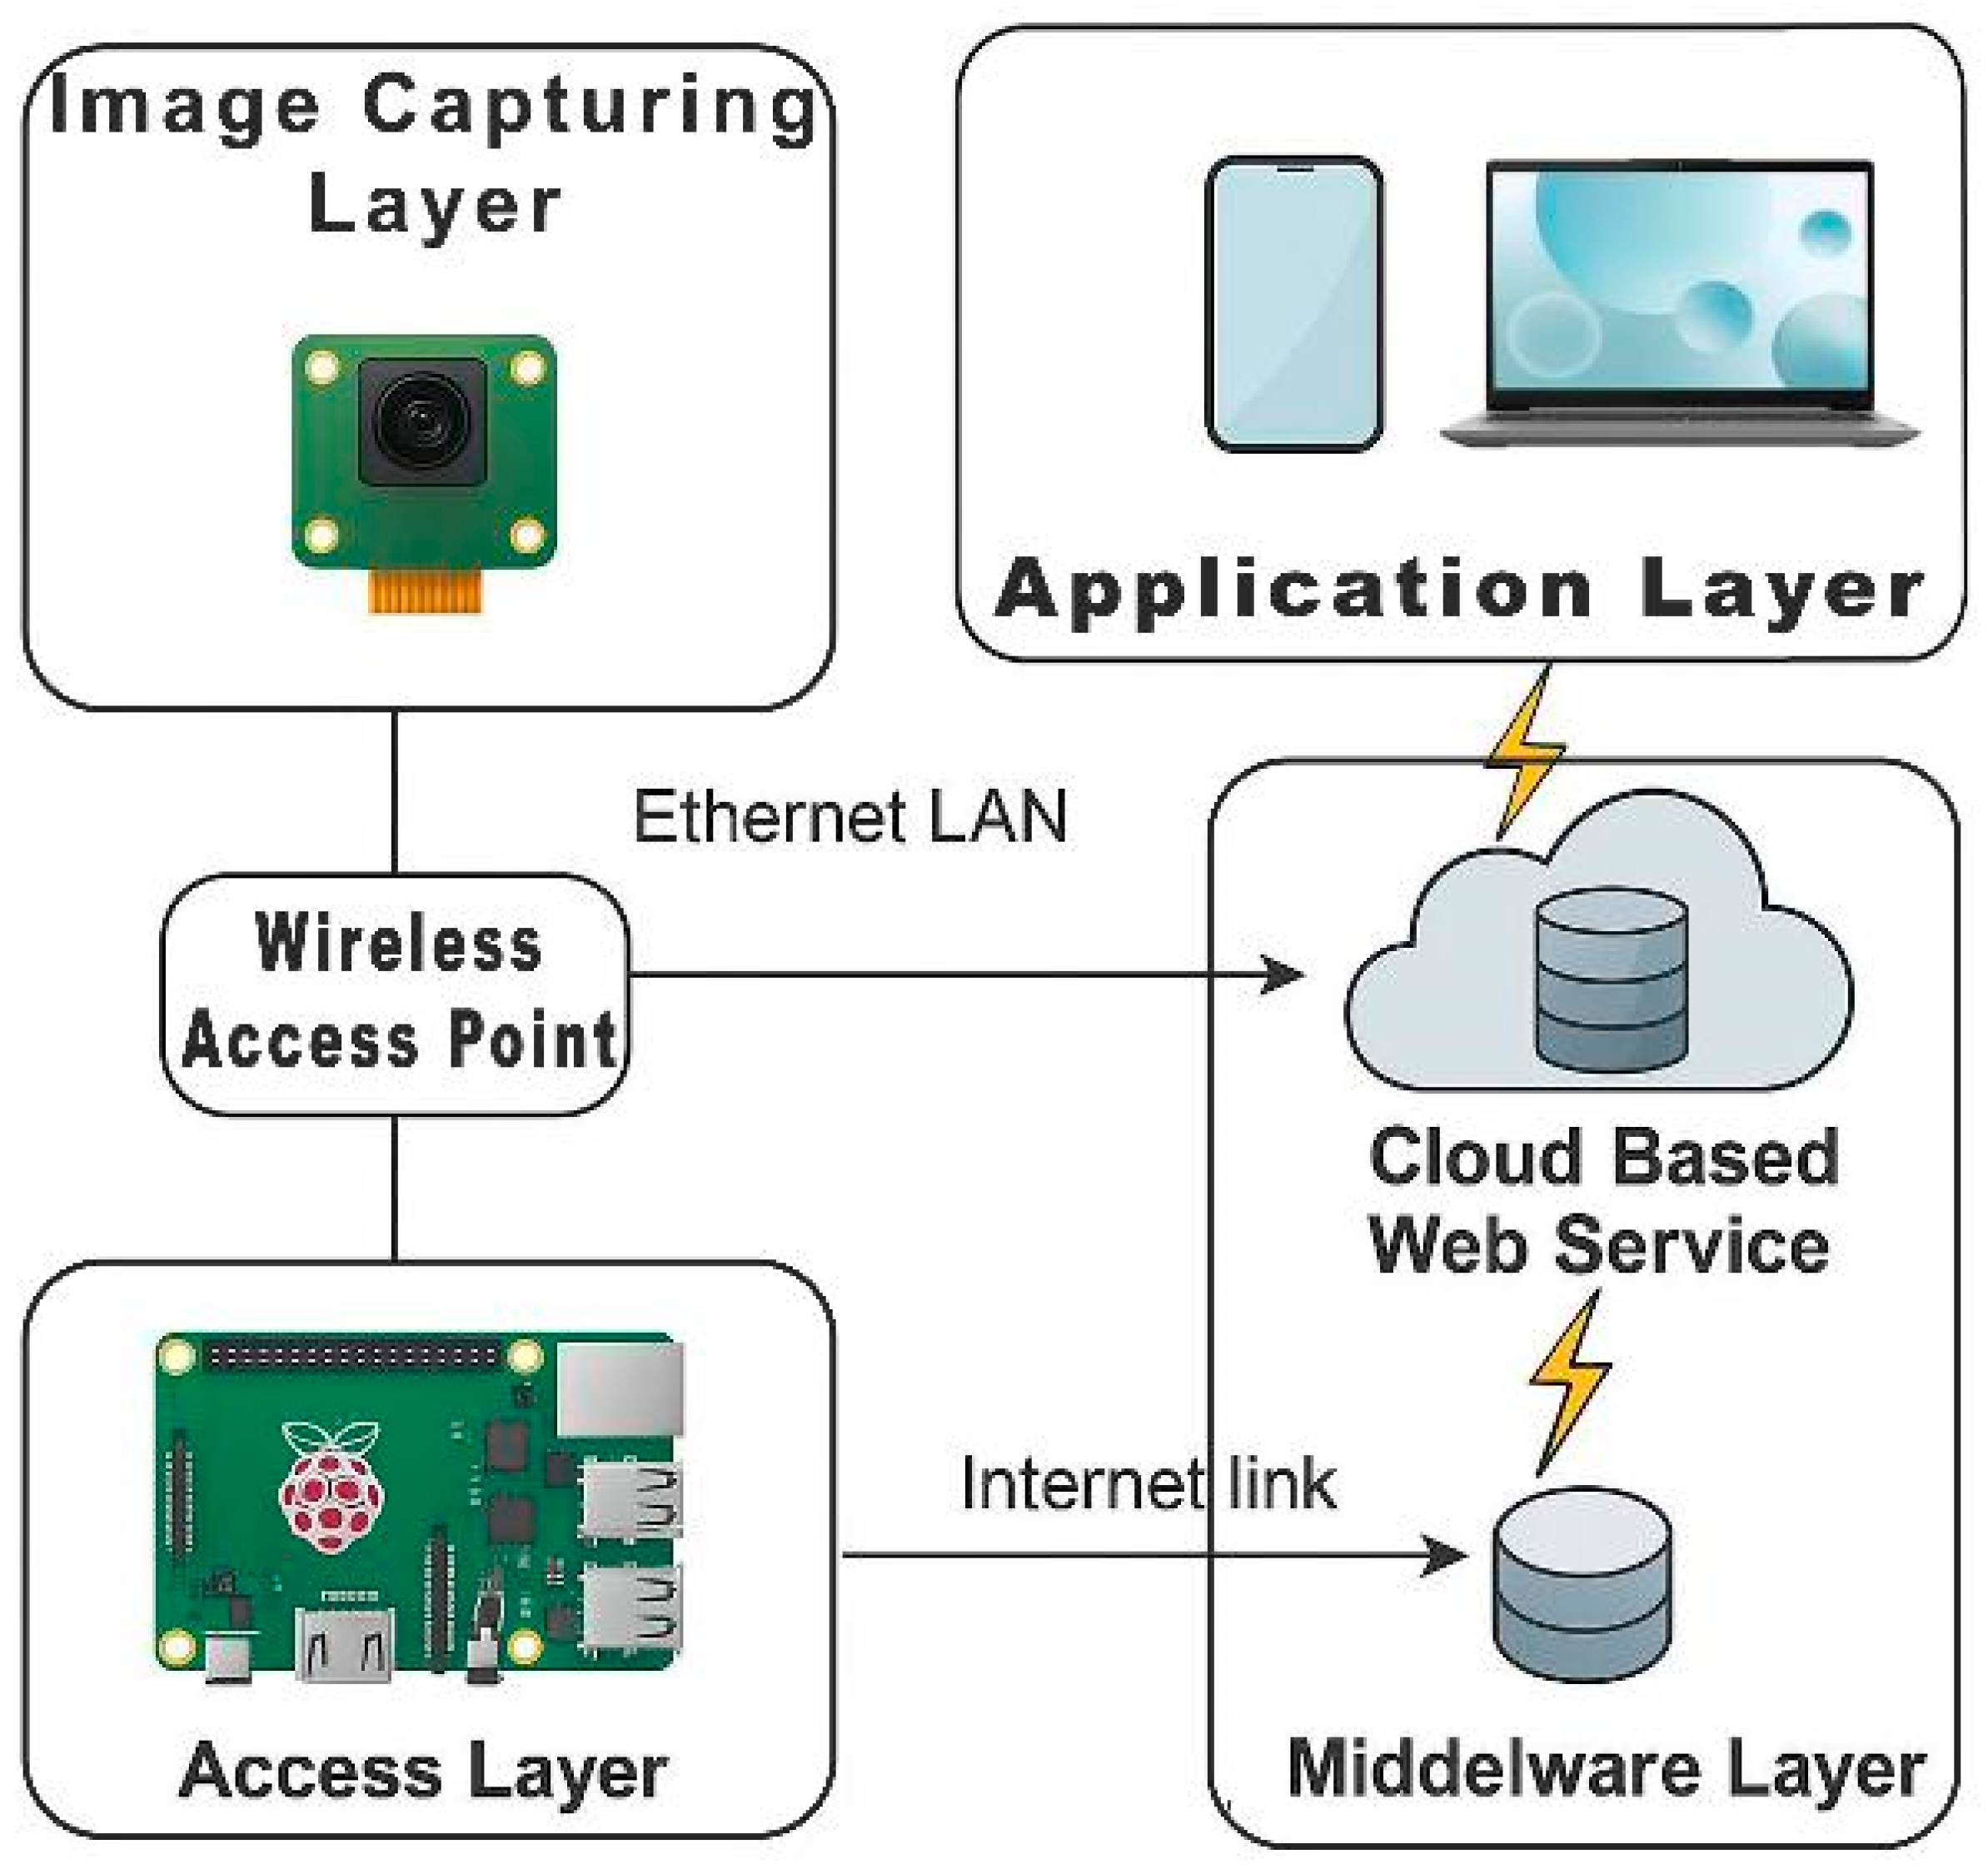
Figure 2 shows the structure of a smart IoT basketball vision system designed for enhancing court-based analytics. The system is organized into layers:
3.2.1. Image Capturing Layer and Access Layer
This layer serves as the data source. A camera communicates with a Raspberry Pi via the CSI (Camera Serial Interface) and continuously streams image data of the basketball hoop and court in real time. In this configuration, the Raspberry Pi functions as an edge device that locally manages the camera, performs basic preprocessing, and prepares data for further processing by a hardware accelerator. This component represents the “entry point” of the system since it captures real-world data and converts it into an appropriate digital format. The system’s access layer consists of end nodes, or cameras, where pictures are registered, processed by a microprocessor, and then sent to a cloud application for displaying, processing and analysis.
3.2.2. Network Layer
A wireless access point enables the device to connect to the internet via a Wi-Fi network. Data transmission occurs at this layer, using the HTTP protocol for REST API (Representational State Transfer—Application Programming Interface) communication in our case. This layer facilitates interaction between the local IoT device and remote servers and serves as a bridge between the physical world and the digital infrastructure.
3.2.3. Middleware Layer
This software layer receives requests from the device, performs authentication and data validation, and forwards them to the cloud. It consists of a backend server that handles real-time data processing, caching, buffering, and logging. The middleware is critical since it ensures the scalability and security of the system. It also standardizes communication between the device and the cloud.
3.2.4. Application Layer
On the dashboard interface, the user can view the number of successful hits recorded over a defined period. This layer serves as the primary contact point between the system and the end user. The results obtained here can be accessed online by professionals and other users of the system.
The web-based leaderboard interface of the “KošKo” IoT basketball score detection system is designed to provide real-time feedback and ranking data for all devices deployed across different institutions, including schools and public spaces. The page is localized in Serbian but can be adapted for multilingual deployment.
The leaderboard is organized into several columns that display the device name, city, institution name, institution type, and sponsoring organization. One of the features of the interface is the dynamic filtering menu at the top, which allows users to sort results by institution type, city, municipality, and period (e.g., today, this week, etc.). The system presents rankings based on activity, such as the number of successful basketball shots detected by the system, i.e., each individual score detecting device.
Each entry in the table is accompanied by icons for viewing device-specific statistics and current score counts. This leaderboard demonstrates the integration of IoT data with user-centric web applications, and provides transparent performance and game tracking, and motivation for broader user engagement. The interface supports scalability and can be easily extended to visualize metrics such as shot accuracy, participation rates, or time-based performance trends.
3.3. Vision-Driven Basketball Scoring System
The proposed methodology for basketball score detection is structured to ensure efficient and accurate recognition of scoring events in real-time conditions. The system combines image acquisition, preprocessing, deep learning-based object detection, tracking, and trajectory analysis in a modular pipeline optimized for embedded edge devices (
Figure 3). Each stage is intentionally designed to support the next, forming a consistent narrative of data flow and transformation from raw input to final analytics.
3.3.1. System Initialization and Preprocessing Pipeline
The process begins with a Raspberry Pi-based edge device connected to a high-resolution RGB (Red, Green, Blue) camera (1640 × 1232 px). Positioned above the backboard, the camera captures video frames of the hoop area at a fixed angle. During system initialization, the camera is calibrated, system constants are defined (e.g., hoop position, size thresholds), and the hardware accelerator is activated for inference tasks. Images are streamed directly into the system buffer for further processing.
Before entering the deep learning model, each captured frame undergoes a structured preprocessing routine aimed at standardizing the input and ensuring compatibility with the hardware accelerator. Since the system utilizes the HAILO-8L AI accelerator, which operates on images with three 8-bit RGB channels in a 640 × 640 resolution, the raw frames, originally at 1640 × 1232 pixels, are resized accordingly. This resizing is typically performed using bilinear interpolation, which provides a balance between computational speed and visual quality. In comparative evaluations, bilinear (INTER_LINEAR) and bicubic (INTER_CUBIC) interpolation were both tested, with bicubic showing superior detail preservation due to its use of a 4 × 4-pixel neighborhood, albeit at greater computational cost. Nearest neighbor interpolation was avoided, as it tended to degrade image quality and negatively impact model accuracy.
Raspberry Pi cameras may output frames in RGBA (Red, Green, Blue, Alpha) format, necessitating the removal of the alpha channel for compatibility with the Hailo platform. Once resized and reformatted, each image is normalized to enhance numerical stability. These preprocessing operations are not only critical for maintaining input consistency but also serve to optimize inference throughput. In fact, some setups employed preprocessed inputs resized and normalized before deployment to further reduce CPU overhead.
Deploying models on the HAILO-8L introduces additional constraints. Unlike traditional CPU or GPU pipelines, the HAILO ecosystem requires models to be exported in ONNX (Open Neural Network Exchange) format and processed using the Hailo Model Zoo and TAPPAS SDK. These tools handle quantization to INT8 precision and compile the model into a binary tailored for the Hailo-8L chip. Due to strict operator and layer compatibility, it is often necessary to adapt model architectures or retrain them entirely. Furthermore, performance benchmarking and firmware flashing are part of the deployment cycle, with fewer debugging tools available compared to standard platforms. These challenges make preprocessing not just a formatting step, but an integral part of preparing the model for robust real-time inference.
In Jetson Nano-based configurations used for benchmarking, inference was conducted using both baseline PyTorch and the TensorRT-optimized pipeline. TensorRT, a high-performance framework developed by NVIDIA, significantly accelerated inference through precision calibration, operator fusion, and GPU acceleration. The combined impact of optimized preprocessing, quantized weights, and hardware-specific tuning illustrates the necessity of aligning data preparation with the underlying inference architecture to maximize frames per second (FPS) and system responsiveness.
3.3.2. Ball Detection Using YOLO-Based CNN
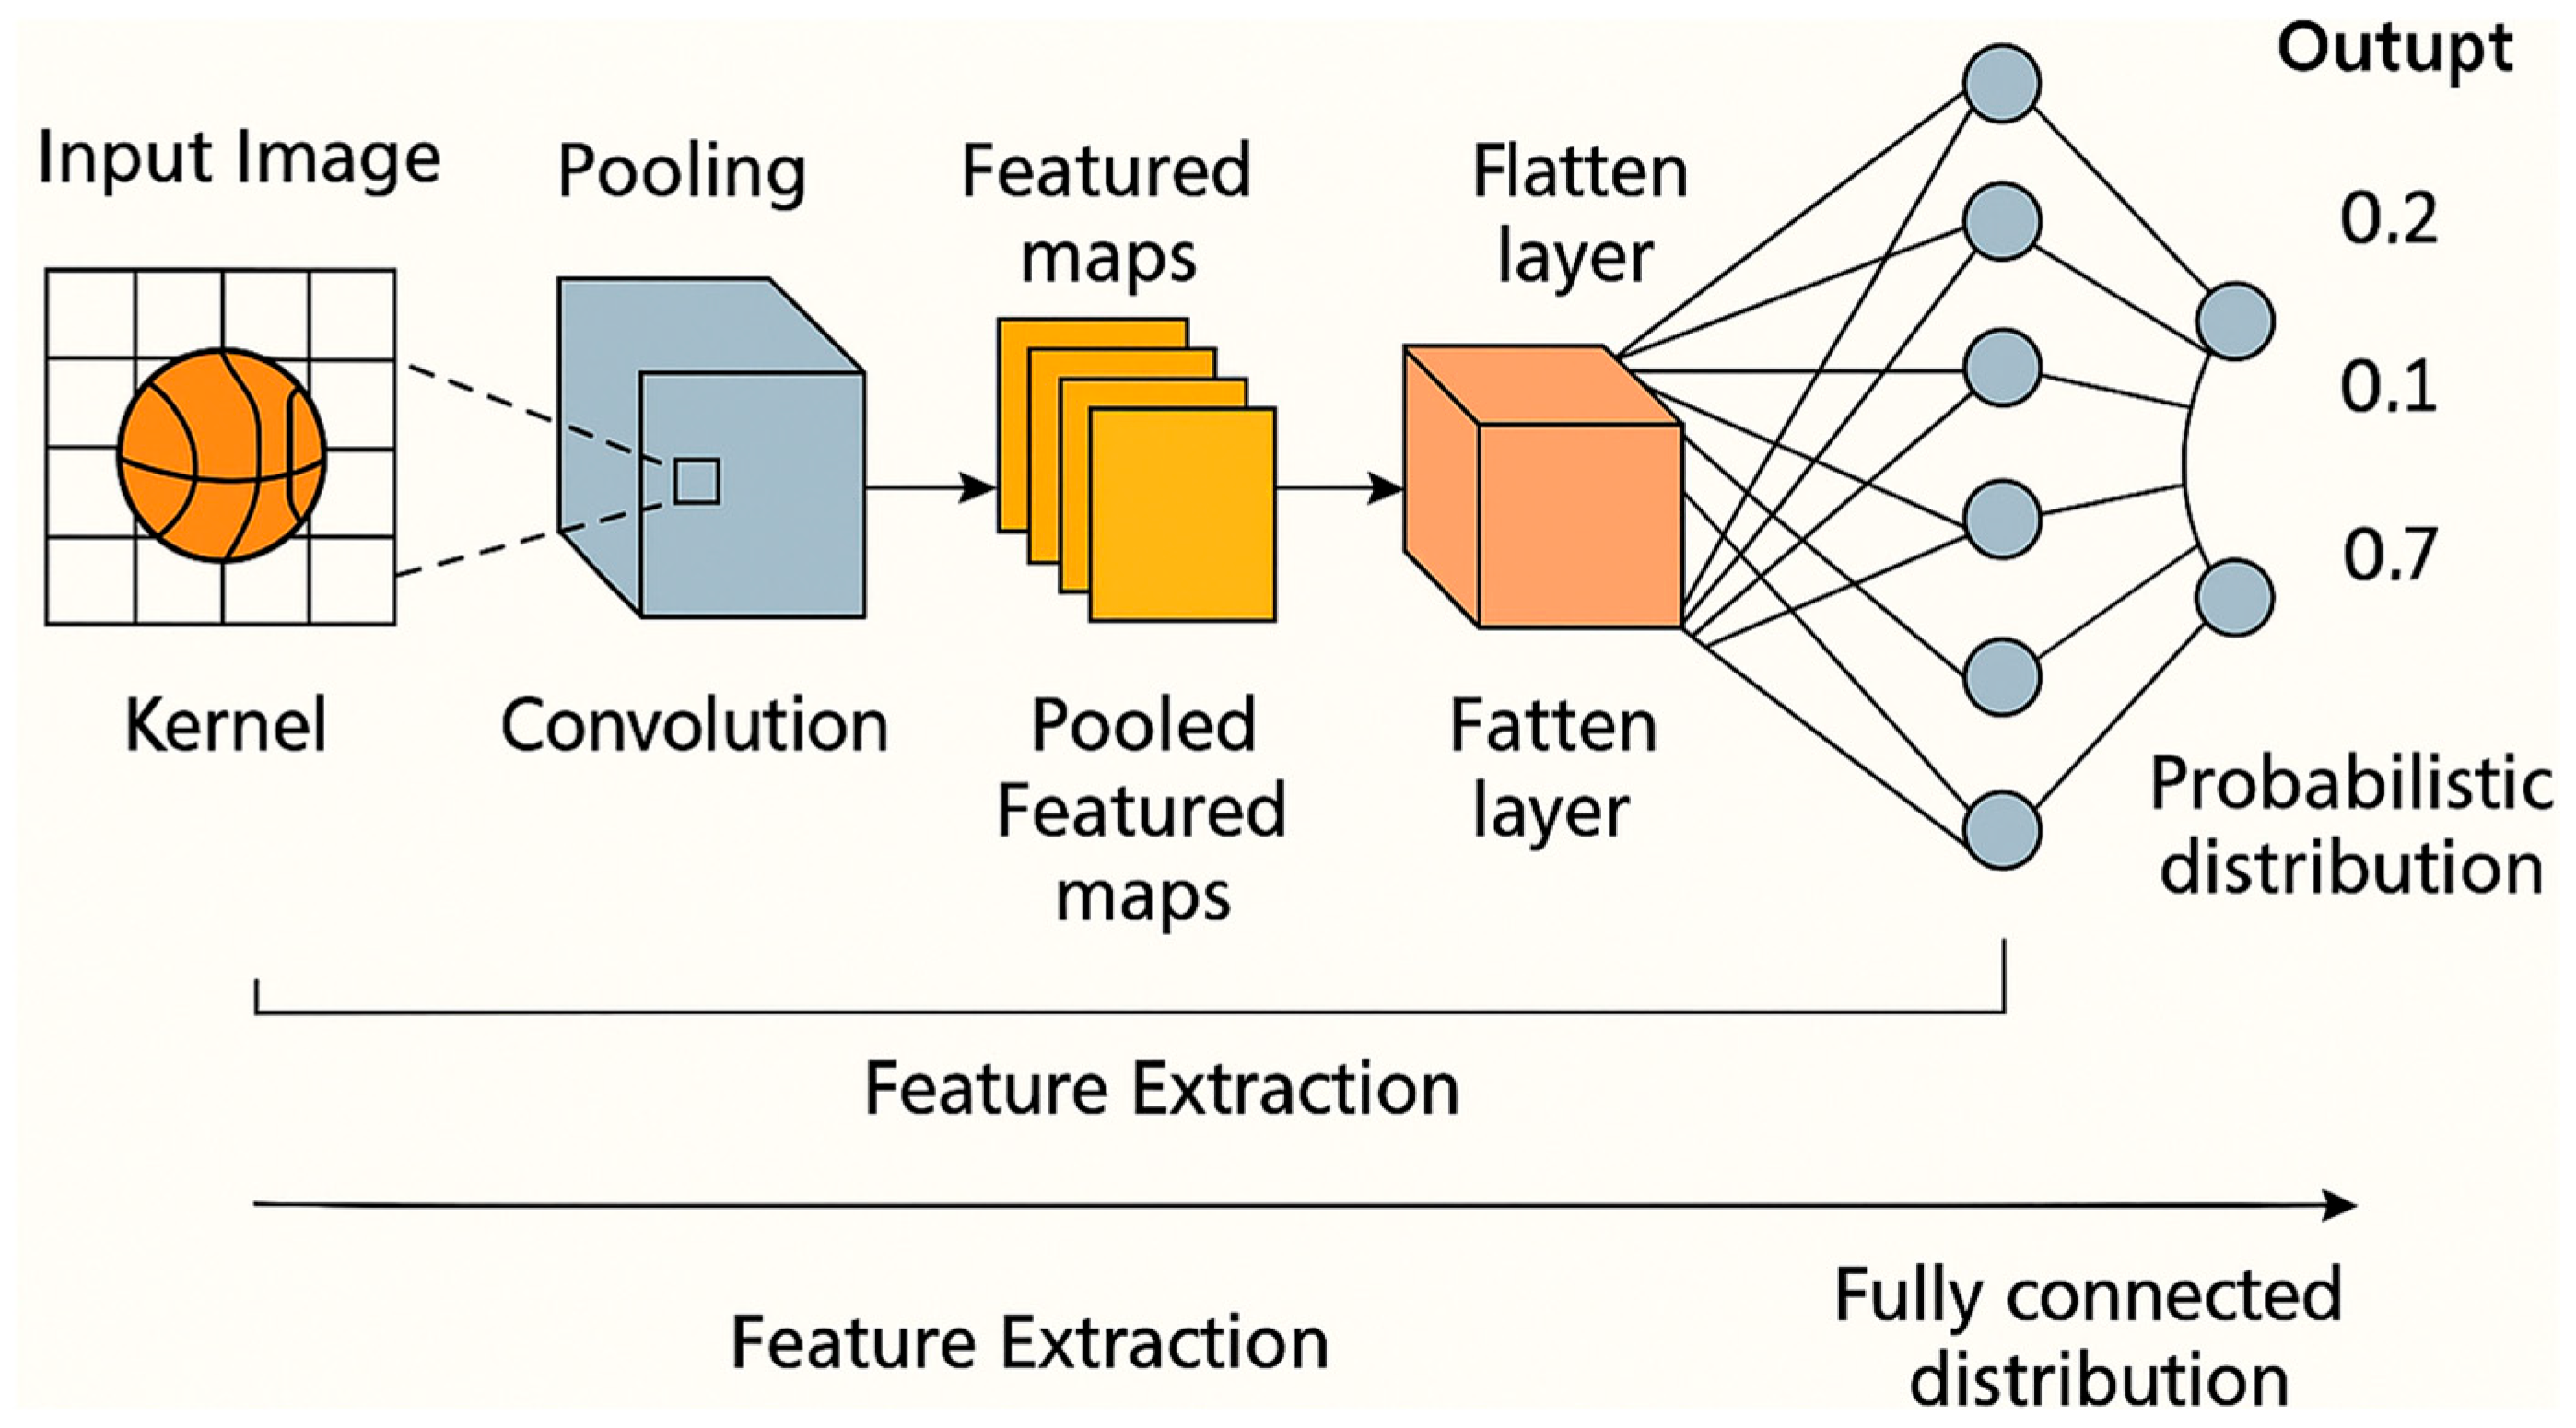
The core of the detection module is a lightweight CNN based on the YOLOv8n (You Only Look Once) object detection architecture (
Figure 4). Optimized for edge deployment, the model consists of six convolutional layers and can perform real-time inference with low latency. The Hailo-specific deployment adds an additional layer of complexity, as described earlier, necessitating ONNX conversion, INT8 quantization, and binary compilation. Despite these requirements, once deployed, the YOLOv8n model enables high-throughput and accurate basketball detection. It outputs bounding boxes with class confidence scores, allowing reliable identification of basketball instances in diverse lighting and motion conditions. Datasets used for training and evaluation of the CNN were collected from primary and secondary school courts, as well as various public courts in Niš, Serbia.
The dataset comprises 80,000 frames stored in JPEG format, divided into 70% for training, 20% for validation, and 10% for testing. The model was trained for 120 epochs using the Adam optimizer with a cosine learning rate schedule. The initial learning rate (lr0) was set to 0.001, the final learning rate factor (lrf) to 0.0001, and the momentum to 0.937. The batch size was set to 20. Training, validation and testing data included a mix of indoor and outdoor scenes to ensure generalization. The model was initially trained on a broad dataset and then evaluated against fine-tuned alternatives, demonstrating that a diverse initial training set yielded superior adaptability across dynamic environments.
3.3.3. Region-Based Validation and Trajectory Estimation
Hoop detection is executed during the initial setup or periodically, using classic computer vision algorithms such as the Hough Circle Transform or contour analysis. The purpose is to localize the static position of the hoop and define a Region of Interest (ROI) for focused ball detection and tracking. This minimizes false detections and reduces unnecessary processing outside the scoring zone.
The hoop detection process was fully automated, eliminating the need for any manual initiation or verification. Upon startup, the RimDetector, the autonomous hoop detection module developed by the authors, locates the rim by analyzing the incoming video frames. During the initial 20 frames, it captures and averages the rim’s geometric parameters—center, radius, and orientation angle—using contour-based ellipse fitting within the HSV color space. Once initialization is complete, the detector locks onto the averaged rim position and reuses these parameters for all subsequent frames. Within the main processing loop, rim detection is automatically re-triggered every 1000 frames, or whenever the rim has not yet been locked, thereby ensuring continuous and reliable operation without human intervention.
Detected objects are passed through a validation filter to eliminate false positives based on size and shape heuristics. Bounding box dimensions are compared against empirical thresholds derived from real-world ball measurements. Only candidates within the expected size range proceed to the tracking phase. The system assigns a unique identifier to each detected ball using a tracking-by-detection approach. Kalman filtering is applied to smooth the trajectory and estimate motion vectors. This module maintains temporal continuity of each ball, enabling robust handling of occlusions and motion blur.
3.3.4. Score Event Detection
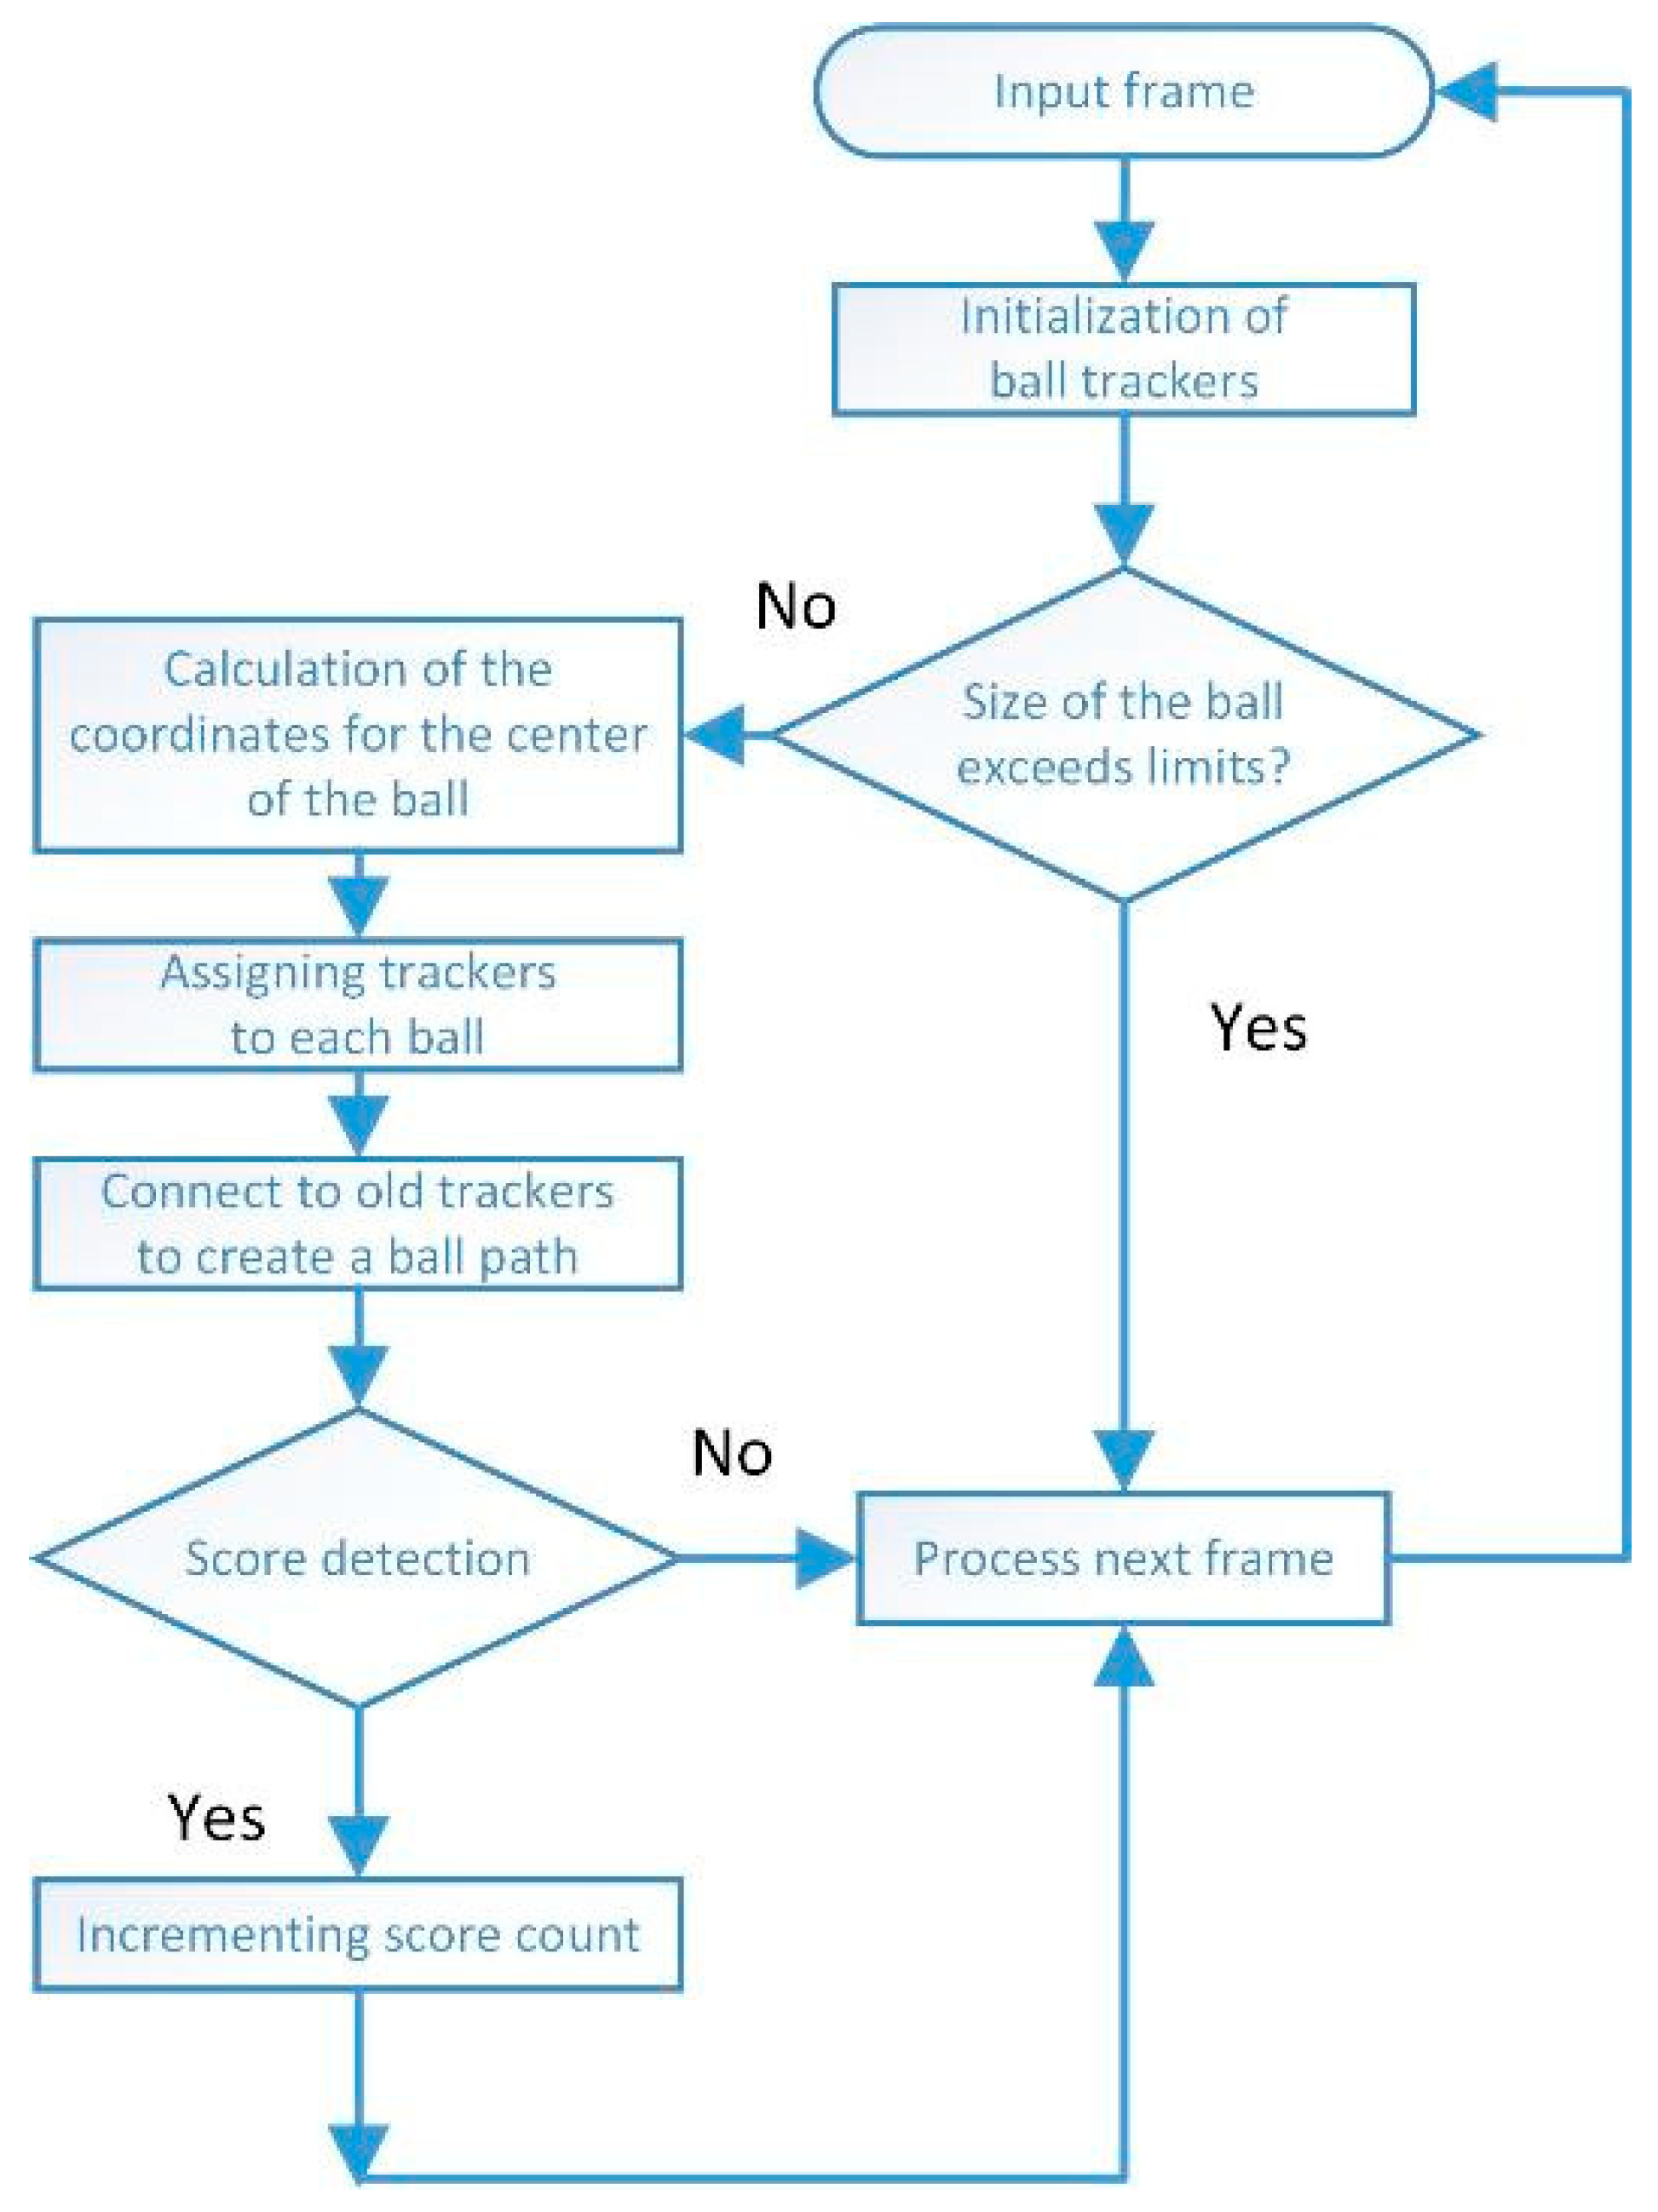
The detection of a valid basketball score is accomplished by analyzing the spatial and temporal behavior of the tracked ball in relation to the pre-defined scoring zone around the hoop. The system continuously monitors the trajectory of each tracked object to determine whether the ball has entered the hoop region. A scoring event is confirmed only if multiple consecutive frames indicate the ball’s center is located within the scoring zone and the motion vector suggests a downward trajectory, consistent with the physical behavior of a successful shot. This method significantly minimizes the risk of false positives caused by erratic ball movement or incidental occlusion. The intersection check between the predicted ball path and the hoop’s location is crucial for precise event registration. Once validated, the event is logged and used to increment the internal score counter, which reflects the real-time status of gameplay (
Figure 5).
Once a score is detected, structured JSON data is generated and transmitted via Wi-Fi to a remote server. This data includes timestamps, device ID, event type, and optional metadata. The backend aggregates data for visualization on the KošKo web dashboard, allowing users to monitor performance in real time.
3.4. Performance Metrics and Evaluation
The performance of the proposed basketball score detection system is evaluated through a two-pronged analysis: ball recognition and score detection. These evaluation domains are aligned with the respective components of the system, ensuring a detailed understanding of the strengths and limitations of each module.
The ball recognition component is assessed using spatial and geometric metrics specifically suited for evaluating object detection precision in visual recognition tasks. These include the Intersection over Union (IoU) between predicted and ground-truth bounding boxes, the area difference between predicted and annotated ball regions, and the center of mass deviation in both X and Y axes. These metrics offer granular insight into the spatial fidelity of detected basketball objects and directly impact the accuracy of trajectory tracking and score inference stages. Additionally, the mean confidence score of detected bounding boxes is reported to evaluate the model’s confidence calibration.
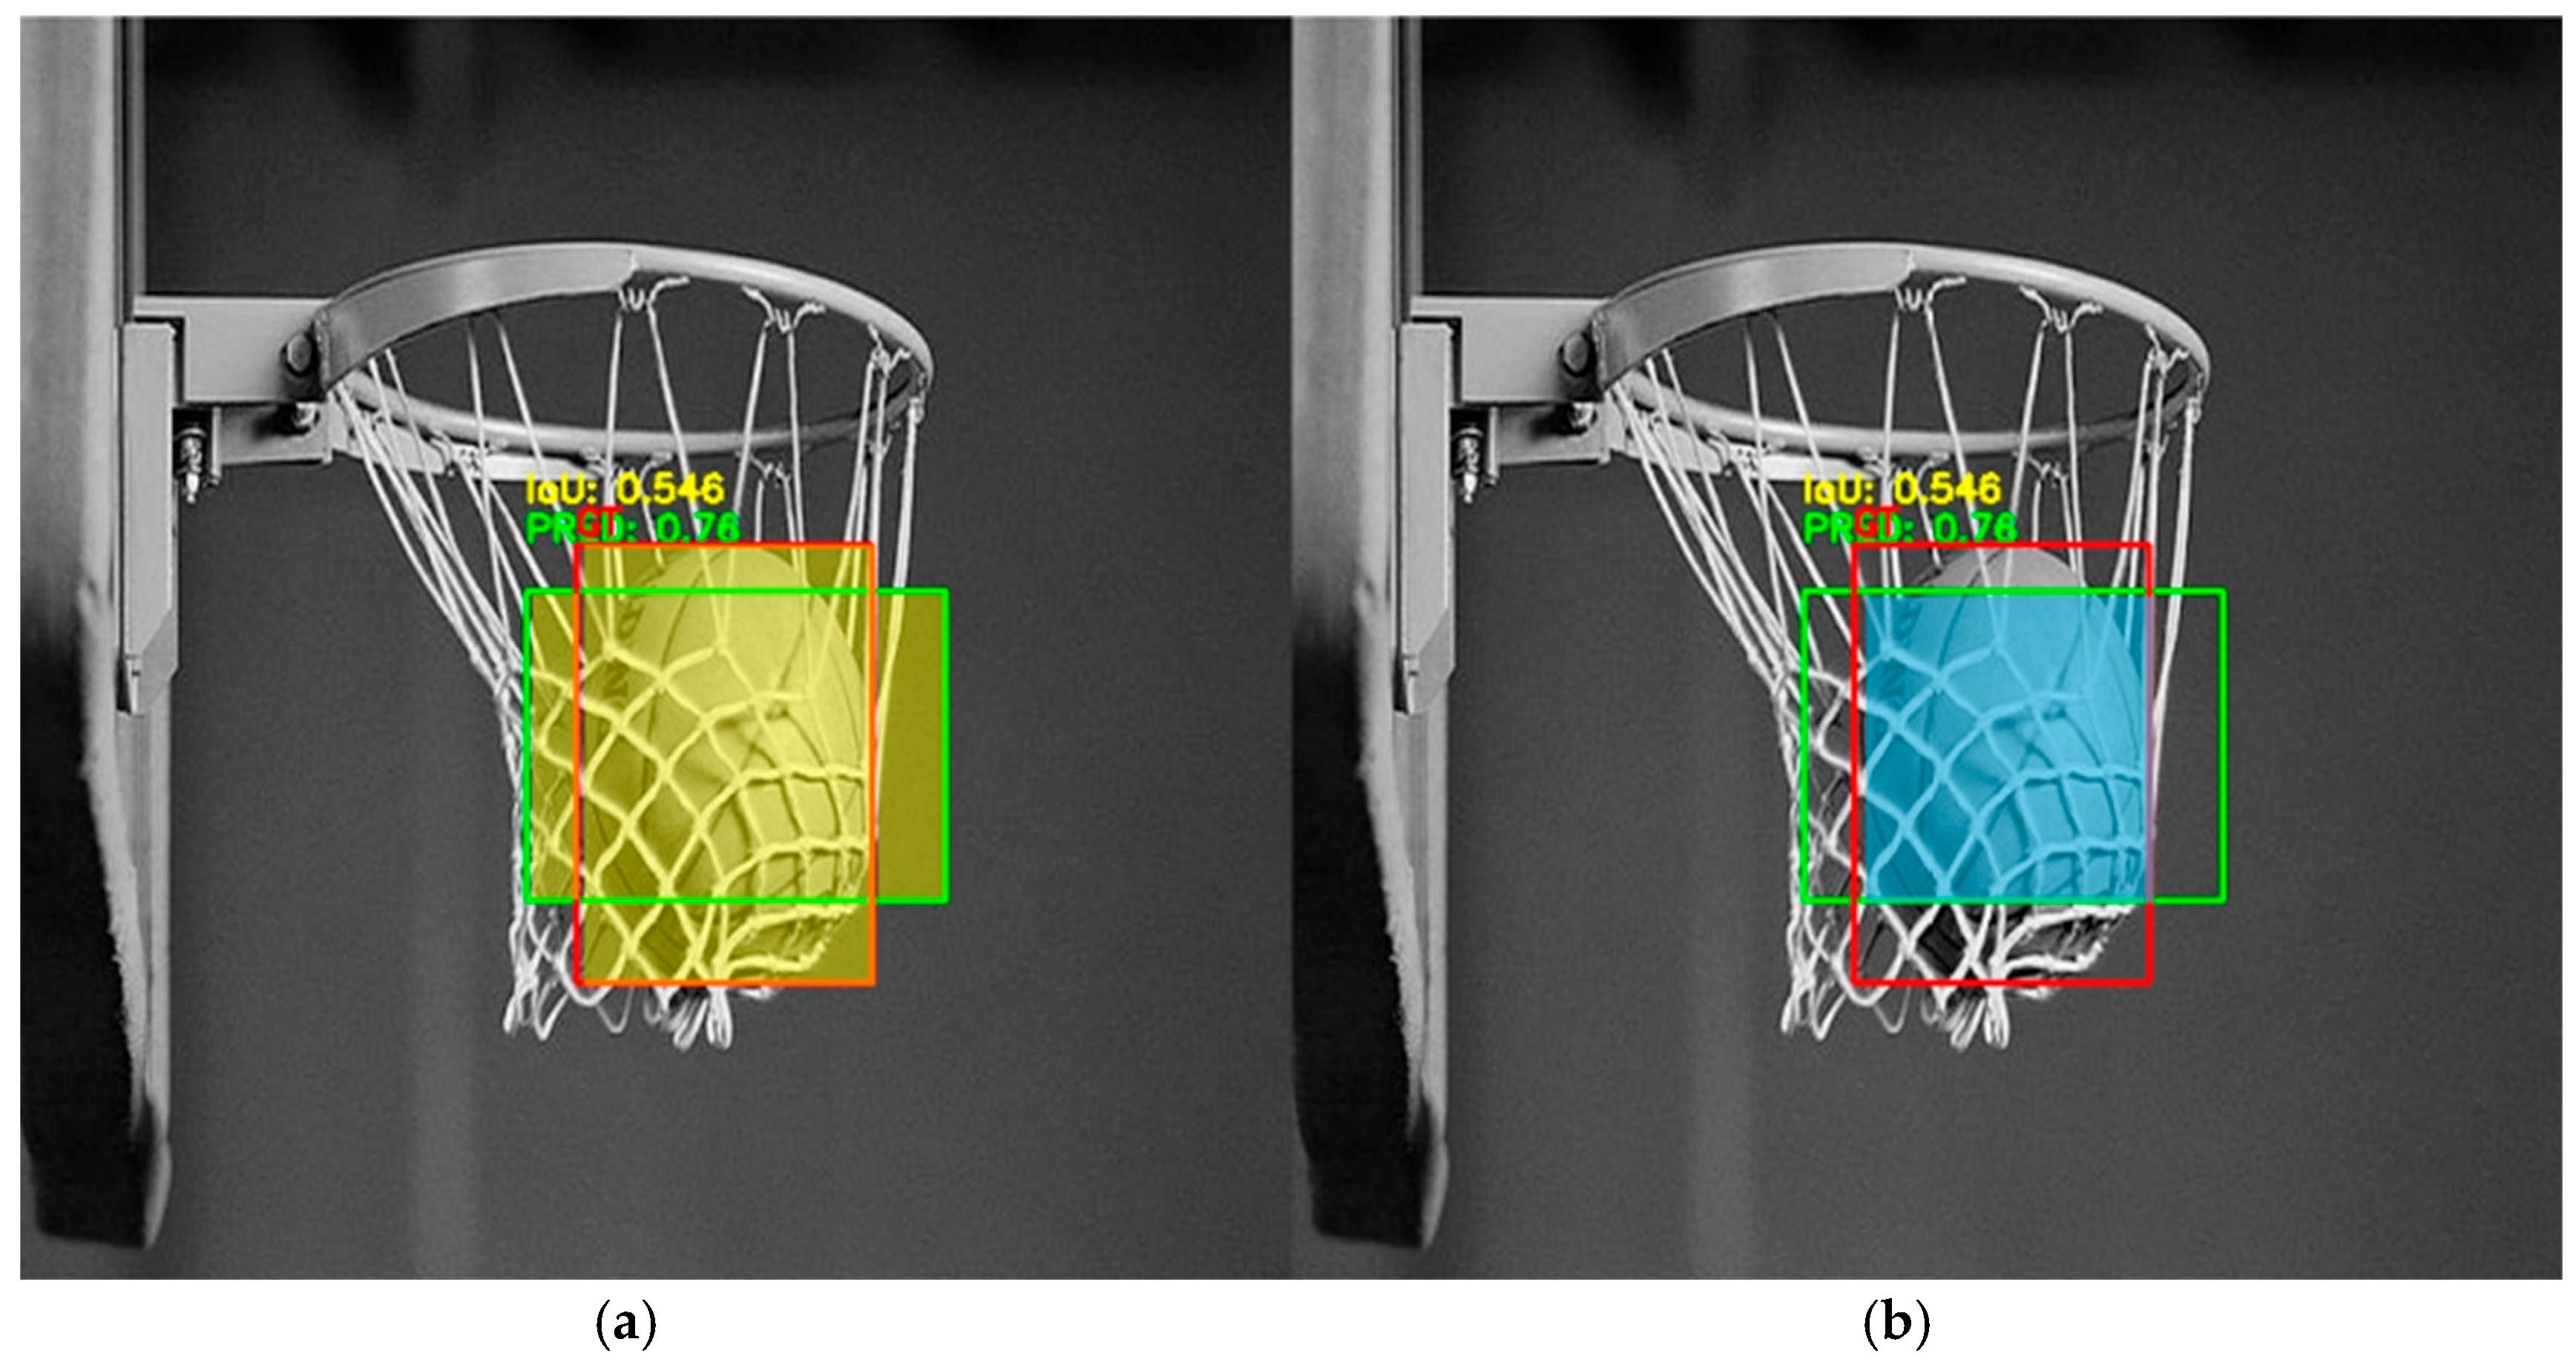
Intersection over Union (IoU) is the canonical geometric similarity metric for evaluating object-detection algorithms; it quantifies the overlap between a predicted bounding region and its corresponding ground-truth box as the ratio of their intersection area to their union area (
Figure 6), thereby ranging from 0 (no overlap) to 1 (perfect congruence). Because IoU simultaneously penalizes both localization error and unnecessary expansion, it provides a single, scale-invariant figure that captures how precisely a detector delineates an object, independent of class predictions.
Execution speed and throughput are measured across various hardware platforms: Raspberry Pi (with and without the Hailo-8L accelerator), Jetson Nano, Jetson Orin Nano, and a standard PC with GPU acceleration. Metrics such as average inference time per frame, frames per second (FPS), and power consumption are recorded. Notably, configurations that employed preprocessing optimization such as resizing and normalization prior to inference achieved superior performance. The integration of TensorRT on Jetson and quantized inference on Hailo also demonstrated substantial improvements in system responsiveness.
The score detection component is evaluated using annotated gameplay video sequences that include both successful and unsuccessful shot attempts. A scoring event is defined as a ball passing downward through the hoop across multiple consecutive frames. Performance is assessed using established classification metrics: accuracy, precision, recall, and the F1-score. Accuracy measures the overall correctness of the score detection module.
In Formula (2),
TP (True Positives),
TN (True Negatives),
FP (False Positives), and
FN (False Negatives) denote the number of correctly and incorrectly classified events, respectively. Precision indicates the proportion of detected scoring events that were true positives, while recall assesses the proportion of actual scoring events correctly identified by the system.
The F1-score provides a harmonic mean of precision and recall, ensuring a balanced view of model performance.
In addition, specificity is computed to determine the system’s effectiveness in identifying true negatives, or frames where no scoring occurred.
The proposed metrics are commonly used in the evaluation of classification performance; however, in our study, they were adapted to the specific context of basketball score detection. Accordingly, it was necessary to explicitly define the quantities TP, TN, FP and FN in relation to our detection outcomes. To quantify the temporal precision of detections, true positive timing deviation (TPTD) is recorded, which reflects the time offset between actual scoring events and system-detected outcomes. This metric is crucial for ensuring that the system aligns well with real-time requirements, especially when integrated into broader coaching or broadcasting platforms.
4. Results and Discussion
4.1. Ball Recognition Results
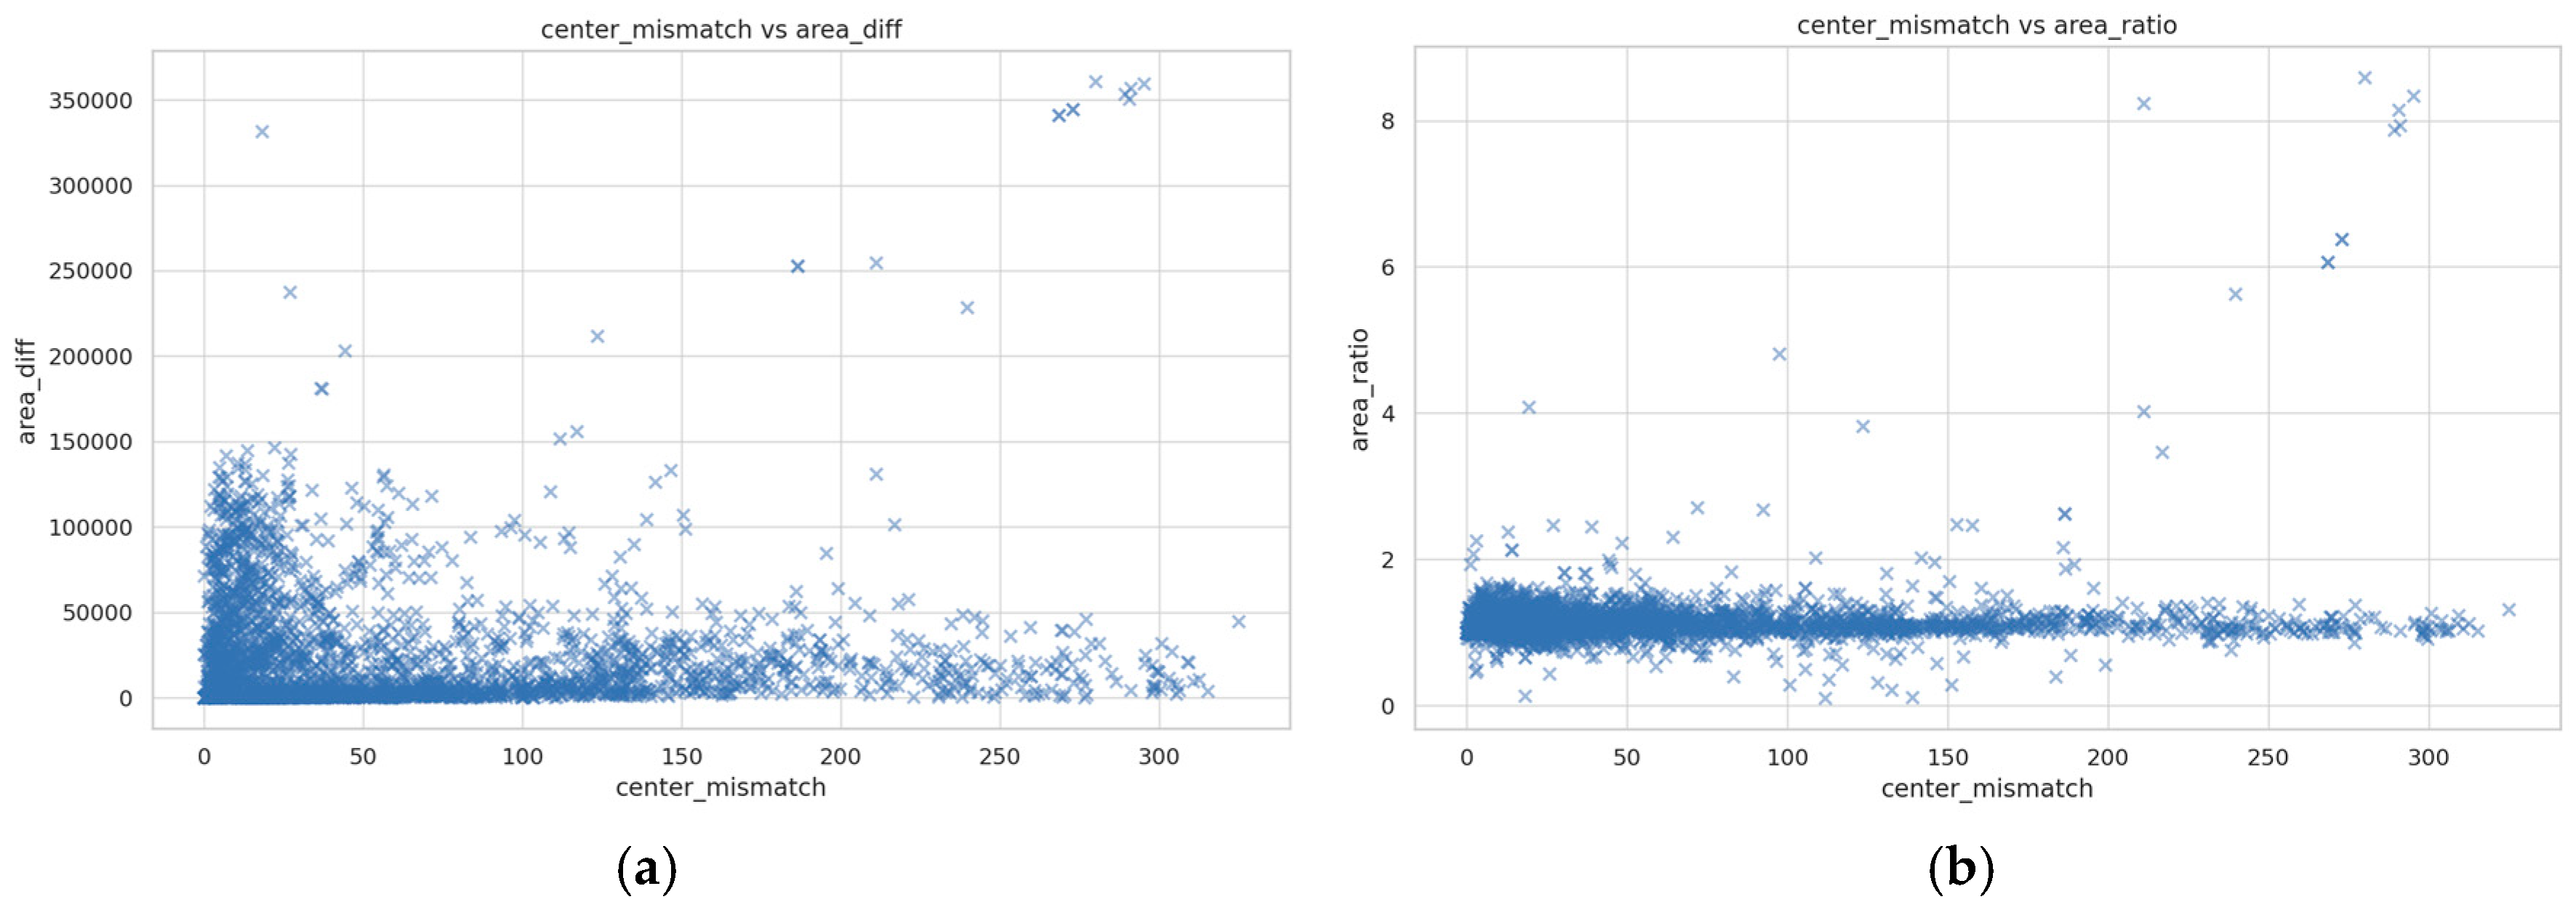
The scatter plots between center mismatch and both area difference and area ratio reveal key aspects of model performance. Center mismatch quantifies localization error, while area difference and area ratio reflect bounding box size accuracy.
Figure 7a shows that larger area discrepancies often accompany greater center mismatch, though some cases reveal well-sized boxes with poor positioning. A tight cluster near the origin (small mismatch and small area difference) indicates good predictions, where both size and position are accurately estimated.
Figure 7b indicates that even when scale is accurate (area ratio ≈ 1), localization errors can persist. These patterns suggest the model struggles with precise alignment in dynamic scenes. To address this, future improvements should focus on loss functions and post-processing that jointly optimize both position and scale.
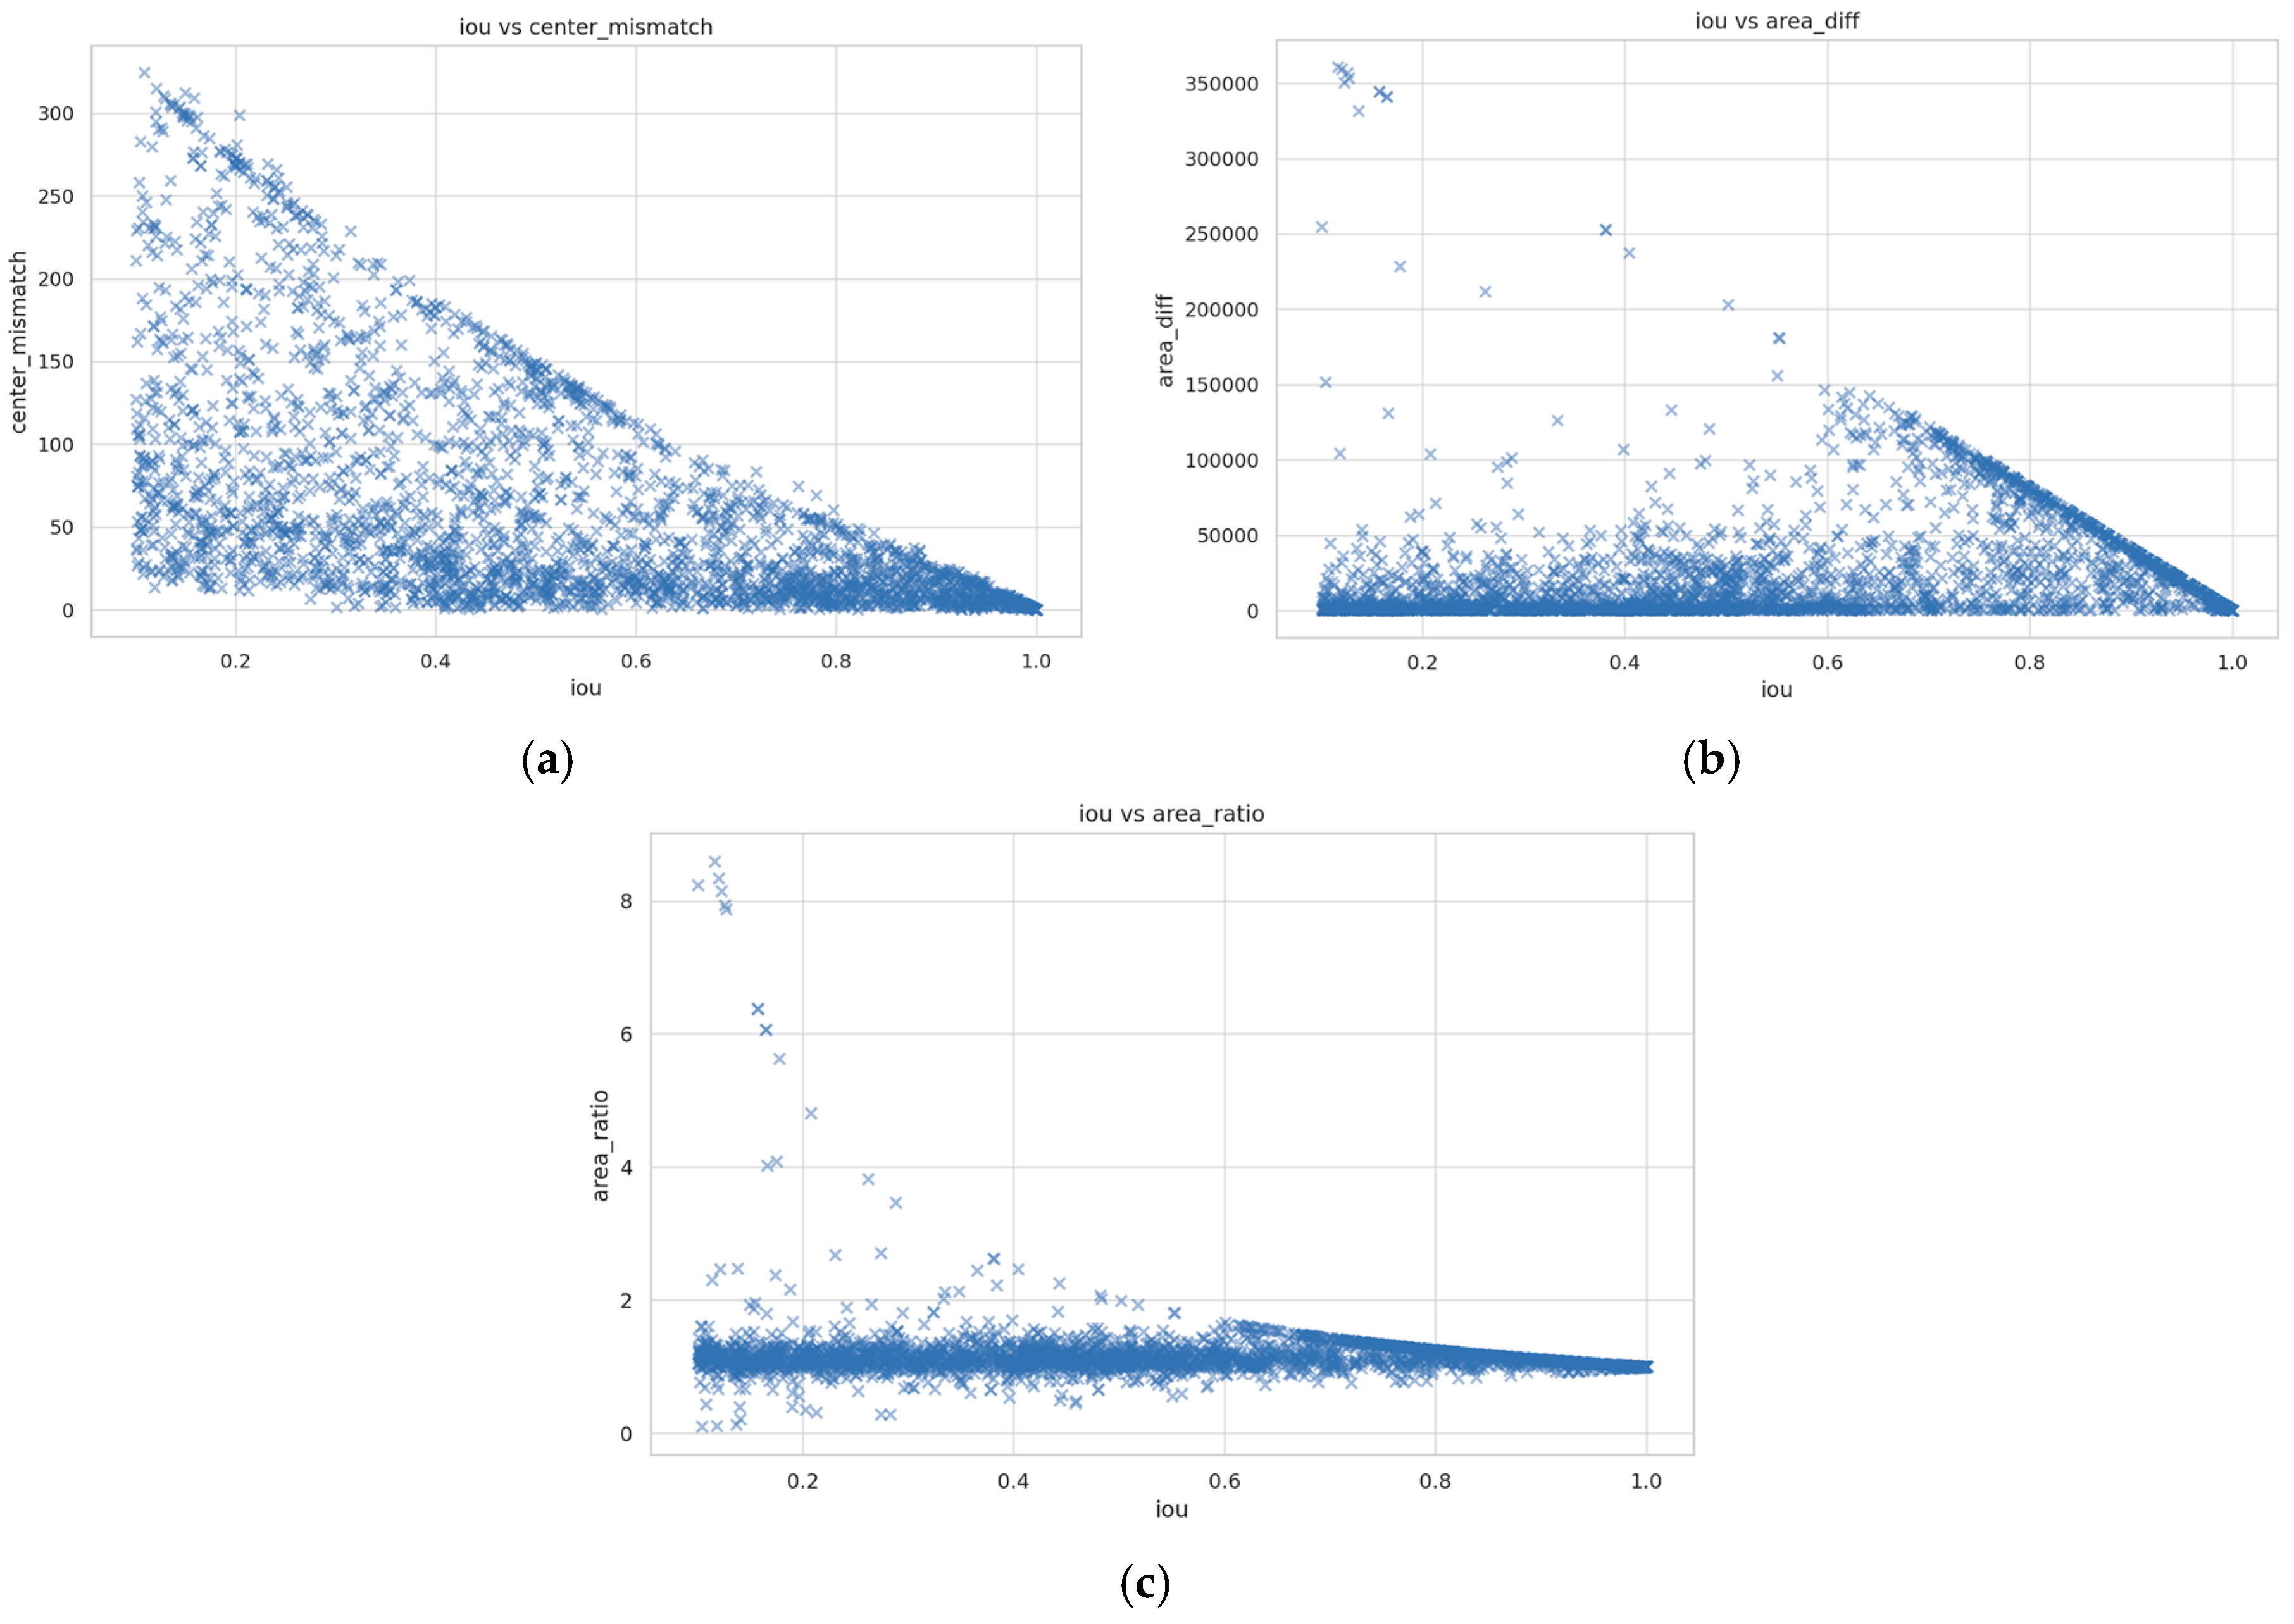
For both IoU vs. center-mismatch and IoU vs. area-difference (
Figure 8a,b), the points form a triangular wedge: high-IoU detections cluster near the origin, while a nearly linear upper envelope shows that once localization error or size error exceeds a threshold proportional to IoU, no detections occur. This boundary follows from large geometry displacements or size gaps quickly shrink the intersection region, capping IoU regardless of further error growth.
By contrast, the IoU vs. area-ratio plot (
Figure 8c) traces an inverted-“U” (exponential-like) curve. IoU peaks when the predicted and true boxes are similarly sized (ratio ≈ 1); it falls off sharply as the ratio diverges, even if the box centers coincide.
Across all three IoU scatter plots, detections concentrate in two favorable regions. First, a dense wedge on the right-hand edge, where IoU is high while center-mismatch, area difference, or area ratio are low confirms that the system regularly produces tightly aligned, well-sized boxes. Second, many points sit along the bottom axis where the non-IoU metric is essentially zero, showing that when the detector does error on overlap it still places the box almost perfectly over the true center and with negligible size drift. Together these clusters demonstrate that most predictions are either fully precise or, at worst, spatially well-anchored, underscoring the model’s practical reliability for automated basketball score tracking.
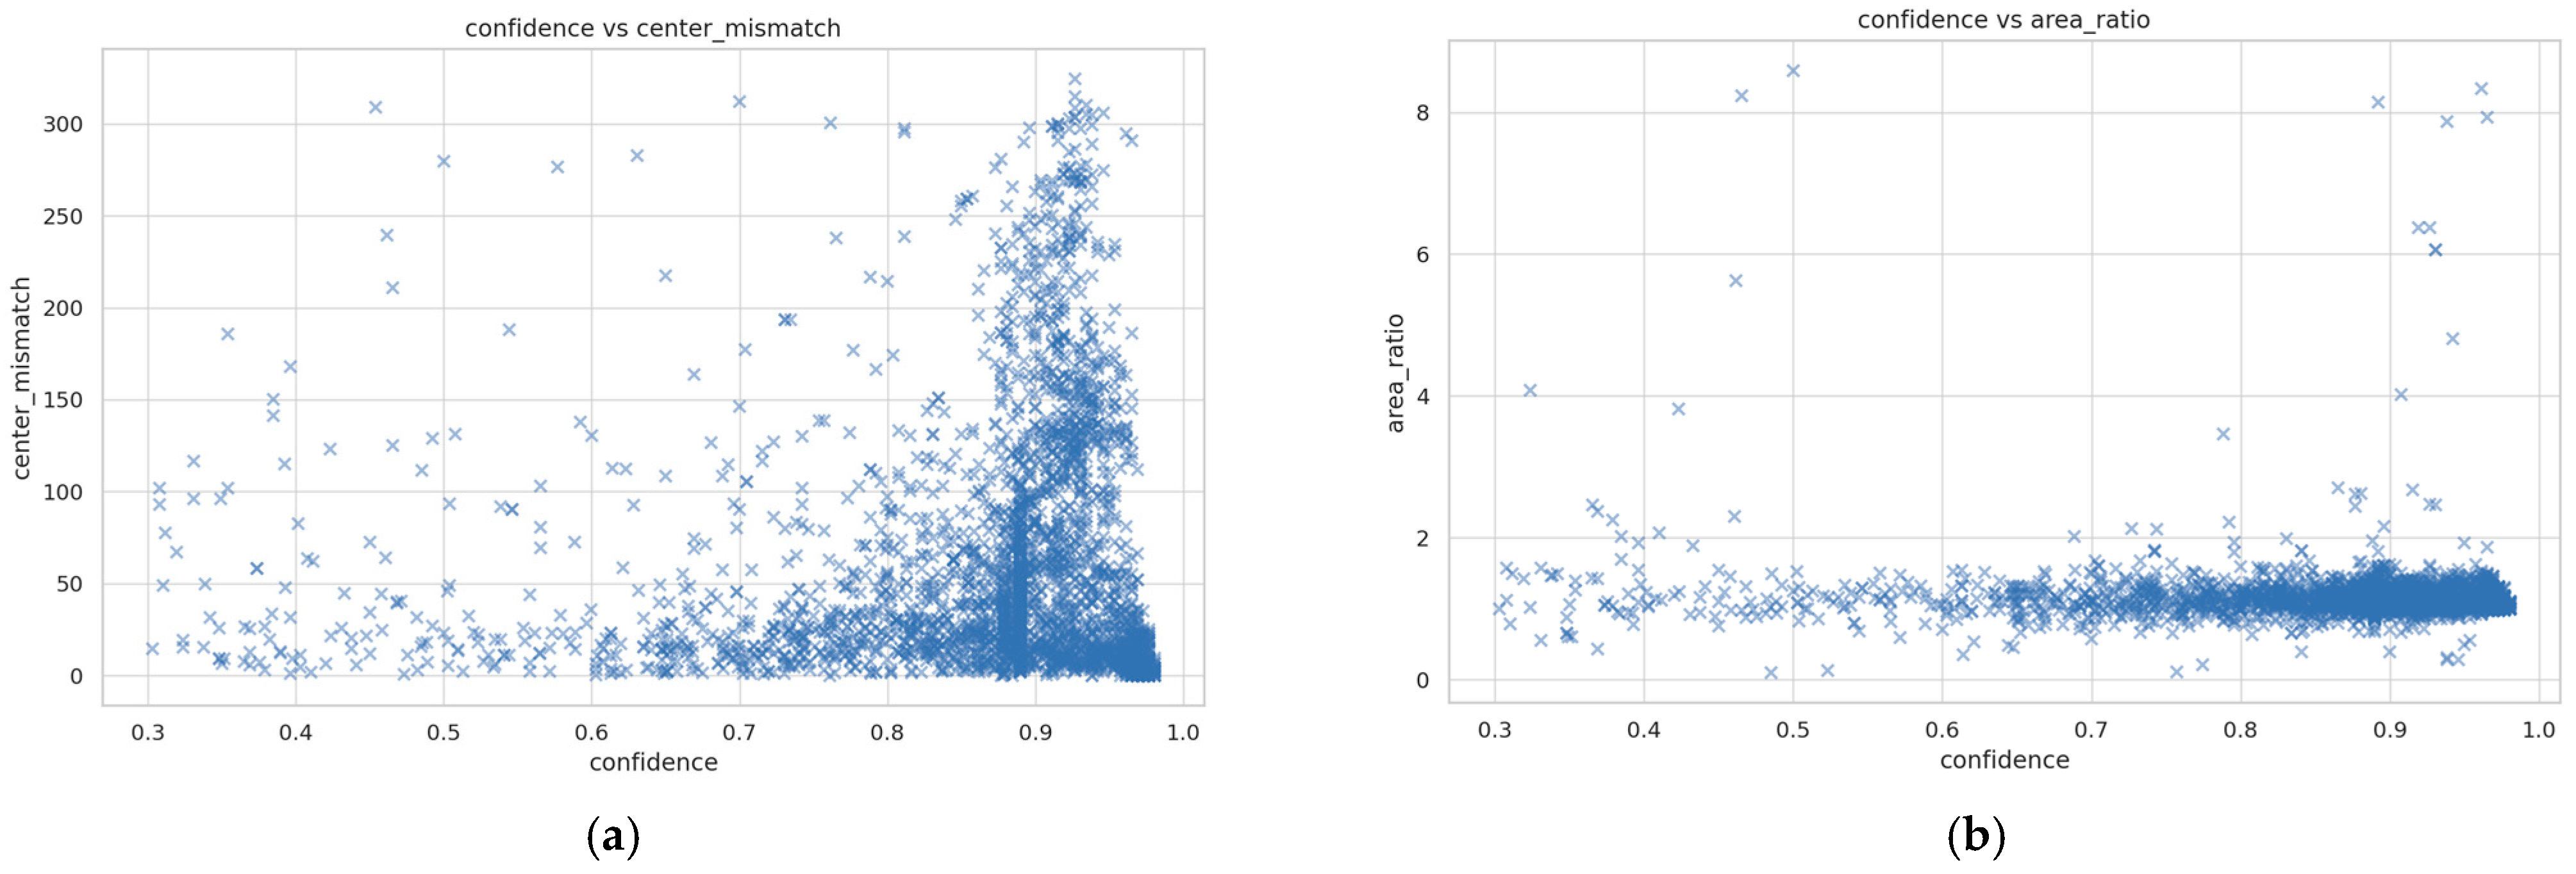
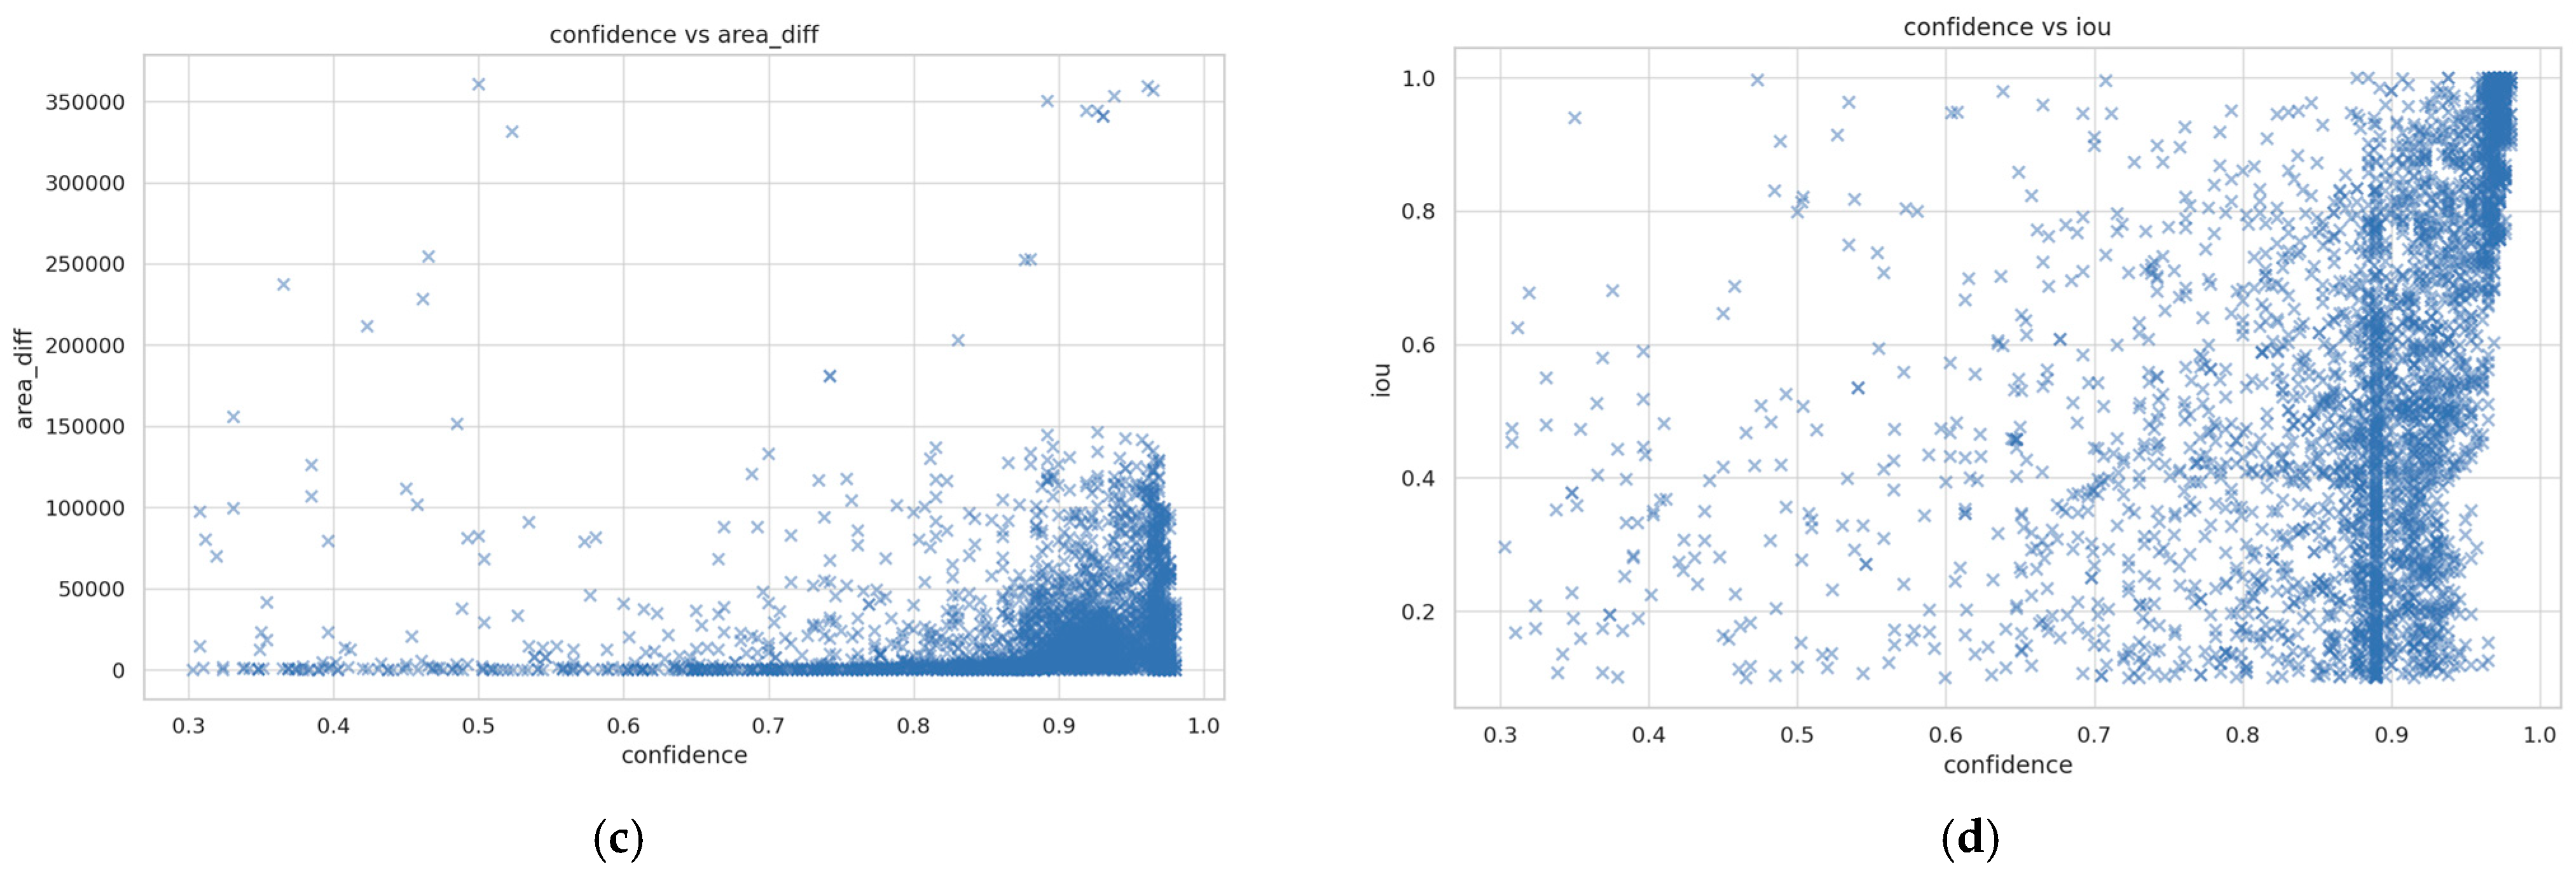
The confidence-based scatter plots reveal how the network’s internal certainty relates to geometric alignment errors. Small center-mismatch, small area difference or ratio, and high IoU all signal that the predicted bounding box closely matches the ground truth one; plotting confidence against these quantities therefore tests whether the detector “knows” when its localization is accurate. Across both the confidence-versus-center-mismatch and confidence-versus-IoU graphs (
Figure 9a,d) a dense vertical column emerges at roughly 0.85 confidence, spanning almost the entire error range. This phenomenon reflects the behavior of YOLO-style detectors: once a detection’s raw logits exceed the soft-max threshold, non-max suppression tends to quantize many scores to a canonical high value around 0.85–0.9. Because that score depends almost exclusively on the visual evidence for the “ball” class, it is essentially independent of center distance, area error, or IoU, so detections with very different localization quality can share identical confidence. The remaining plots (
Figure 9b,c) provide further insight. Confidence drops slightly as absolute or relative area error grows, implying that the classifier penalizes grossly oversized or undersized boxes, whereas high-confidence detections remain surprisingly tolerant of substantial center offsets, underscoring the weak coupling between appearance and precise positioning. In the IoU plot two clouds emerge: a right-hand cluster where IoU exceeds 0.5 and confidence aligns with accurate overlap, and a diffuse left-hand spray where IoU is poor, but confidence still hovers near 0.85.
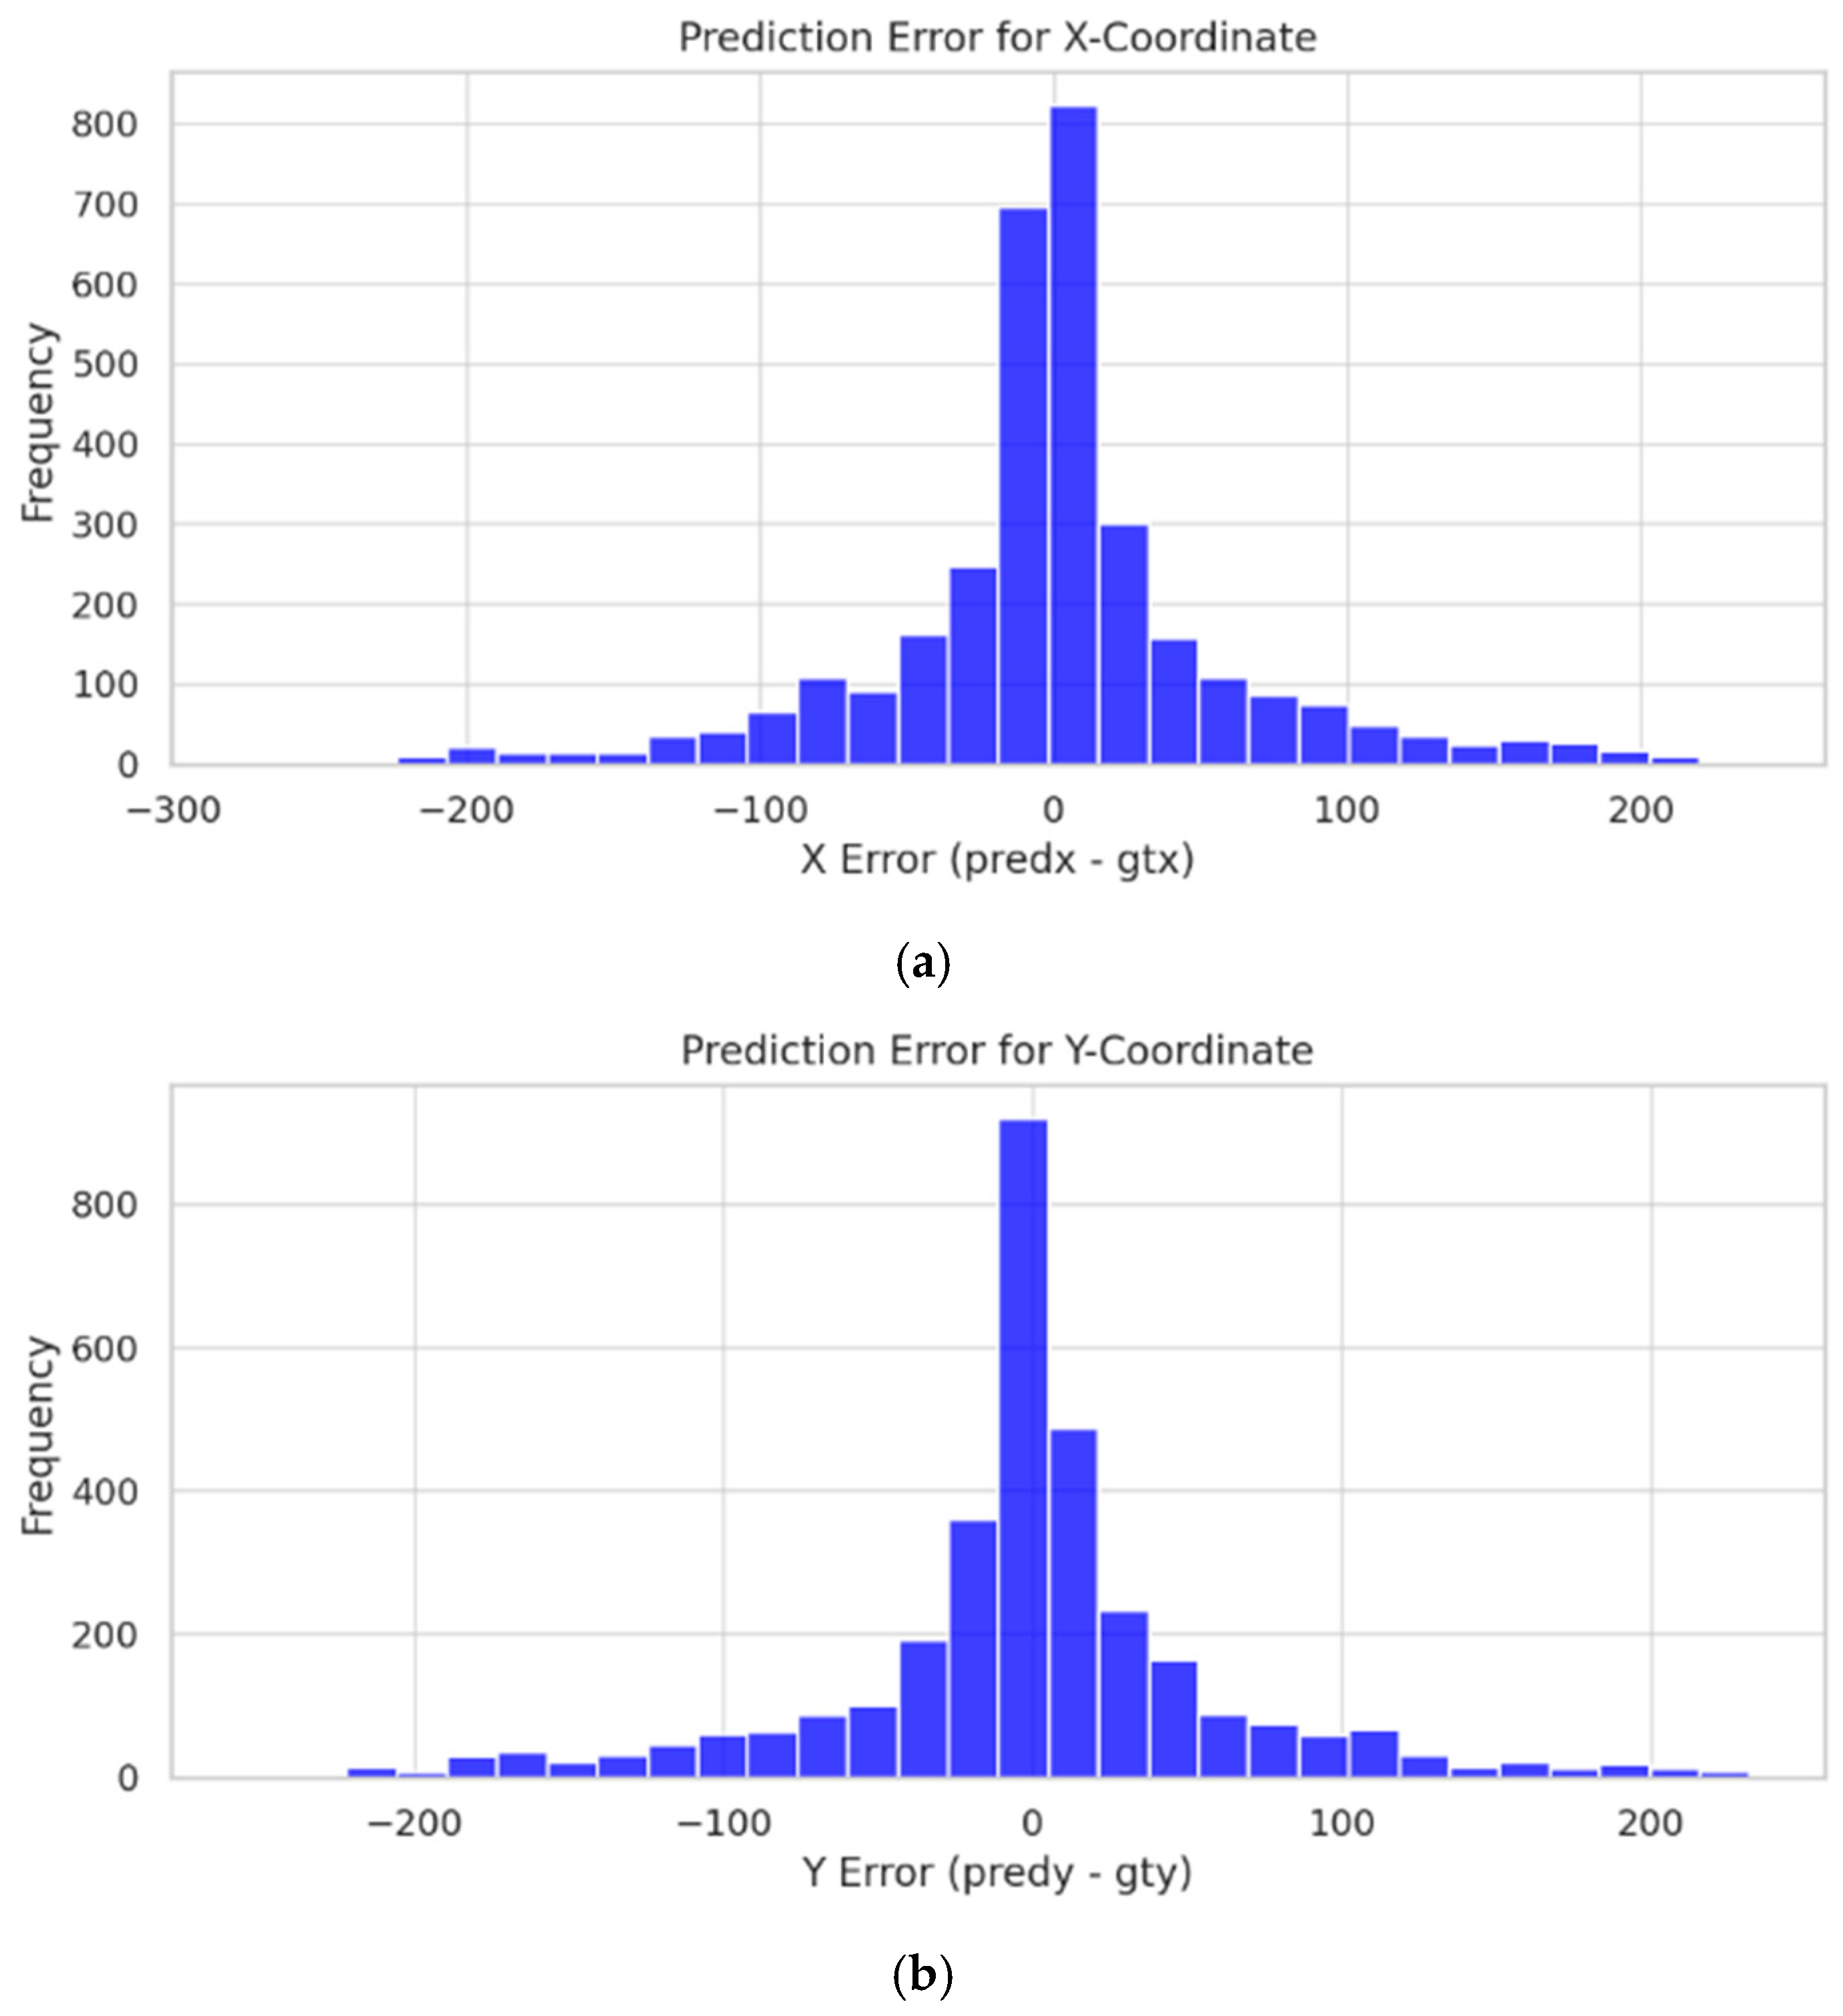
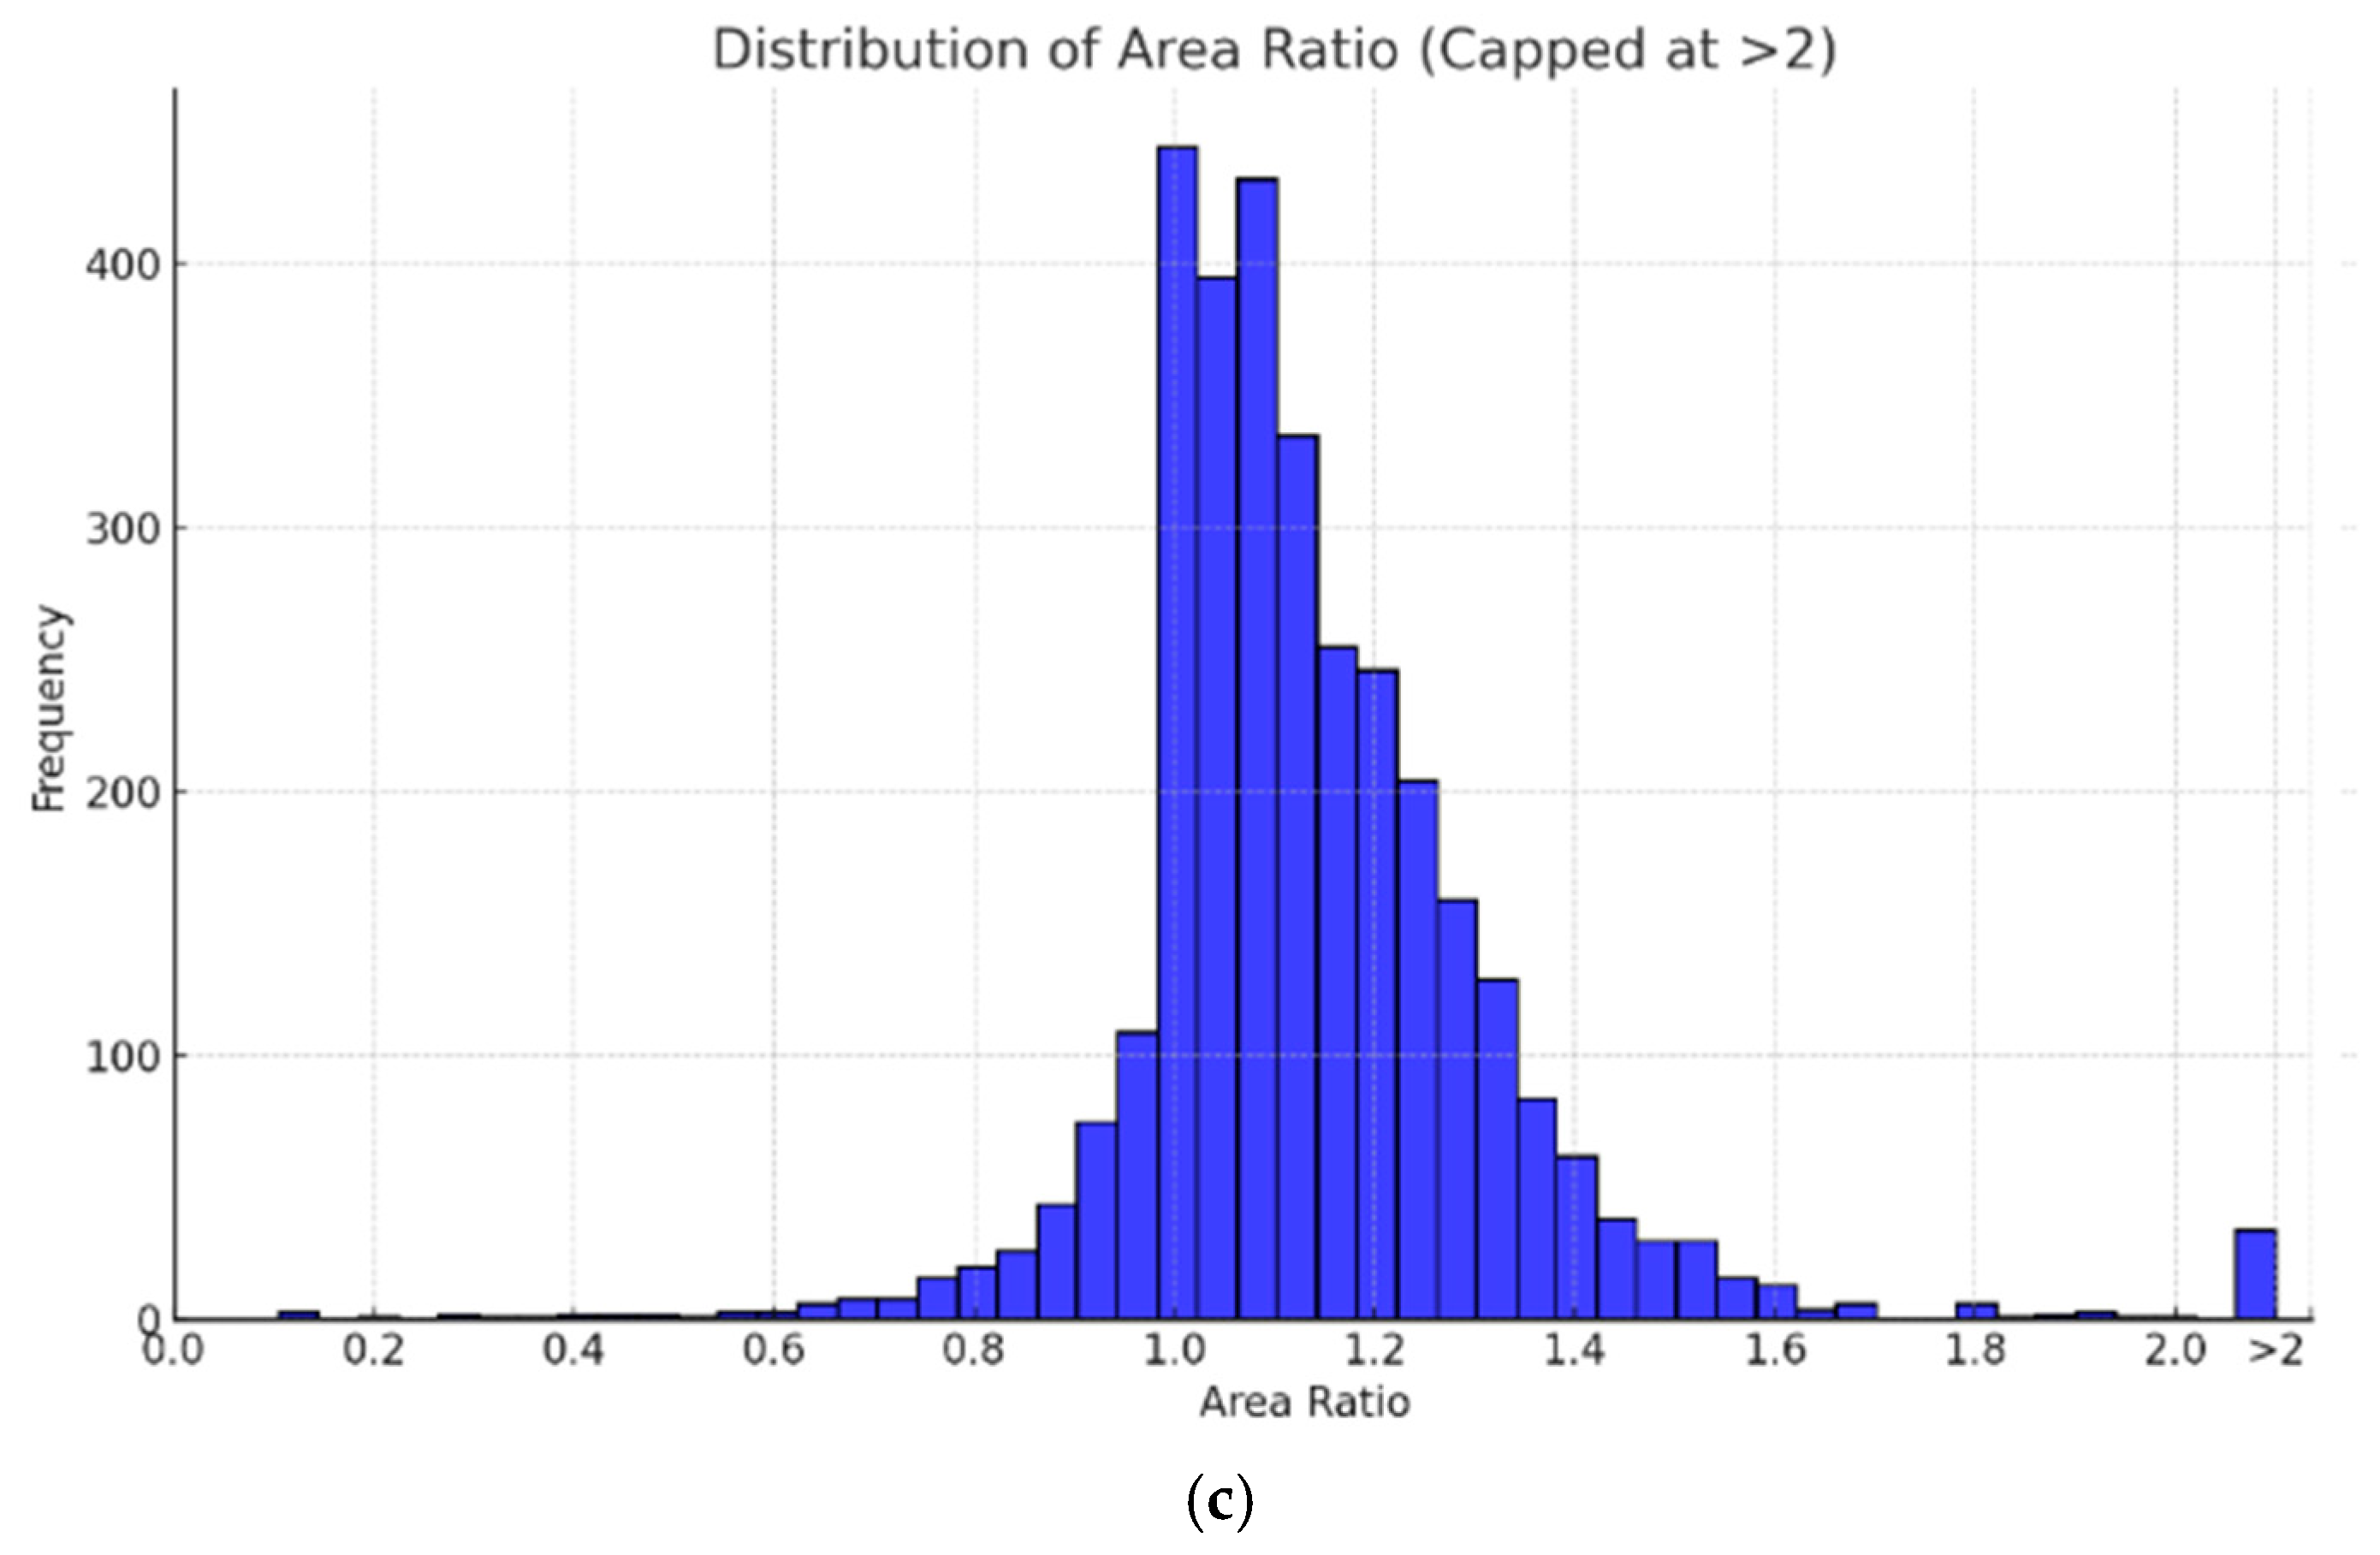
The histograms collectively trace how precisely the detector places its bounding boxes and how often it drifts. Both the x- and y-error curves (
Figure 10a,b) are sharply centered at zero with steep Gaussian-like shoulders that taper within a few pixels, showing the network is largely unbiased in either horizontal or vertical direction. The y-error spreads slightly further, which is expected in a perspective scene where the rim sits above the visual mid-line and vertical parallax changes faster than horizontal, which can cause larger misses when the ball rises or descends rapidly.
The area-overlap-ratio distribution (
Figure 10c) is tightly peaked just above 1.0 and decays quickly for larger ratios, confirming that most predicted boxes differ from the true box by only a few percent in size. Extreme ratios (those we binned > 2) are rare outliers stemming from motion blur or partial occlusion, so their scarcity underscores the robustness of the size filter.
In the IoU histogram (
Figure 11), more than half the mass lies beyond 0.5 and most sizeable mode appears near 1.0, indicating that the majority of detections meet or exceed the conventional “good match” threshold. The long-left tail mainly corresponds to frames where the ball is partially hidden behind the rim or player hands, reminding us that overlap metrics are most vulnerable to occlusion.
The center-mismatch-to-area-overlap ratio (
Figure 12) is skewed toward the origin, with a steep drop-off beyond about 0.2. Because this metric normalizes raw pixel error by box size, the concentration near zero means the detector keeps its center inside the true silhouette even when the box inflates or shrinks slightly. Taken together, the histograms paint a consistent picture: localization errors are small, largely symmetric, and rarely catastrophic; size discrepancies are modest; and IoU remains high except under severe occlusion.
Comparative analysis highlights the performance implications of varying weight precision, interpolation strategies, and hardware platforms during deep learning inference (
Table 1).
Raspberry Pi + Hailo achieves the highest frame rates across all configurations, peaking at 92.7 FPS with float32 weights and no preprocessing. This setup benefits from offloaded model execution to the Hailo-8 AI accelerator, where direct inference on preprocessed frames minimizes CPU overhead.
When switching from float32 to quantized uint8 weights, inference speed increases (e.g., from ~47.5 to ~67.4 FPS with bilinear interpolation). This is consistent with expected improvements from reduced bit-width in neural network computation.
Preprocessing methods also affect latency. No preprocessing setups significantly outperform those requiring image resizing on the device. This underlines the benefit of supplying pre-resized frames over inference engines.
Jetson Nano, without TensorRT, exhibits a substantially lower performance (17.6 FPS) in comparison to the Raspberry Pi + Hailo setup. However, with TensorRT optimization, Jetson improves to 28.4 FPS, confirming the boost provided by NVIDIA’s deep learning inference optimizer.
4.2. Score Results
To evaluate the score detection module, a 30 min video sequence featuring players shooting at a basketball hoop was manually annotated and analyzed.
The dataset includes recordings from three players, that were shooting four throw categories: free throws, layups, three-point shots, and mid-range shots. No trick shots or dunks were incorporated into the training or testing data. The basketball court used for data collection is situated below ground level, on the shaded northern side of the Science and Technology Park Niš building. Consequently, the court is never exposed to direct sunlight, and the ambient illumination during testing remained relatively low, ranging between 60 and 300 lux.
Ground-truth labels for scoring events were established frame by frame, and the algorithm’s output was compared against these annotations. The evaluation yielded 247 true positives, instances where the system correctly detected a scoring event, and 492 true negatives, where missed shots were accurately classified as non-scores. Additionally, 20 false positives were recorded, indicating occasions where the algorithm incorrectly classified a miss as a successful score, while 79 false negatives occurred when actual scoring events were not detected by the system (
Figure 13). These values form the basis for computing performance metrics such as accuracy, precision, recall, F1-score, and specificity.
The accuracy of 88.19% shows that overall score detection system is quite accurate, correctly classifying the majority of the video frames (
Table 2). However, accuracy alone can be misleading in imbalanced datasets, which is why additional metrics are crucial. High precision indicates that when the system predicts a score, it is correct over 92% of the time. This is vital for real-world deployments where false score detections (FPs) could mislead players or corrupt leaderboards.
The system successfully detects around 76% of actual scores. This means about 1 in 4 true baskets is missed (FN). The relatively low recall and the corresponding number of false negative classifications can primarily be attributed to challenging visual conditions during fast game sequences. In particular, the rapid motion of the basketball often resulted in motion blur or partial visibility within the frame, making detection difficult. Additional factors such as temporary occlusion by players’ hands or bodies, as well as unfavorable viewing angles of the ball, further contributed to missed detections. A qualitative inspection of the misclassified cases confirmed that these conditions were the dominant sources of false negatives. Future improvements in recall performance could be achieved by employing higher frame rate or global shutter cameras to minimize motion blur and ensure more consistent visibility of the ball during rapid movements.
The harmonic mean of precision and recall represented by F1 score provides a balanced measure. This value of 83% confirms a strong overall performance, though slightly skewed by lower recall. The model is excessively good at identifying misses correctly (96.09%), with very few false positives. This supports the idea that the system is conservatively tuned, so it prefers to avoid false scores at the cost of missing some valid scores.
The average measured True Positive Timing Deviation (TPTD) of 335 milliseconds indicates that, on average, the system registers scoring events with a delay of roughly one-third of a second relative to the ground truth. This level of temporal precision is acceptable for real-time feedback scenarios and is well within the threshold for seamless integration into coaching tools or live broadcasting overlays.
The key takeaway is that the system is highly precise and specific, making it ideal for public use without falsely inflating scores. However, the relatively lower recall suggests that some successful shots are being missed, possibly due to brief occlusion, lighting inconsistencies, or the need for better trajectory tracking. This points toward improving temporal smoothing, frame-based scoring heuristics, or multi-angle input as next steps for refining the algorithm.
5. Conclusions
This work proposed a realistic vision-based score recognition system suitable for intelligent IoT basketball systems. It is built on a small Raspberry Pi 5 board with an overhead camera and Hailo-8L AI processor, allowing in-time ball identification and classification of scores with no requirement of cloud systems or sophisticated hardware. By employing a YOLOv8n-based CNN, it identifies the ball, follows its movement, and logs scores when it descends through the hoop in several frames.
Evaluation on real-world data collected from basketball courts in Niš, Serbia, showed reliable detection performance. The ball recognition component achieved consistent localization with low positional error, high IoU, and effective size filtering. The score detection module reached 88% accuracy, with high precision (92%) and specificity (96%), confirming the system’s strength in correctly identifying scores and minimizing false detections. However, the recall of 76% suggests that some successful shots were missed, often due to occlusion or fast motion. This points to areas for improvement in tracking or temporal consistency.
The system extends previous work by enhancing generalization across varied environments with wider training datasets and optimizing performance with quantization and hardware-aware execution. Preprocessing techniques and execution benchmarks revealed that using uint8 weights along with preprocessing inputs resulted in maximum frame rates, especially on the Hailo-accelerated Raspberry Pi board.
The system is incorporated in the KošKo IoT platform, with the functionality of tracking scores, analytics, as well as with public leaderboards. Results indicate that the developed solution is capable of being implemented in outdoor as well as indoor environments and can function in real time with limited infrastructure.
Further improvements in score detection accuracy can be achieved by employing higher frame rate or global shutter cameras, as motion blur during rapid ball movement remains the primary source of false negative classifications. Future research will focus on enhancing recall by improving the system’s robustness to occlusions and refining trajectory reasoning, potentially supported by a secondary camera view for better spatial coverage. Additionally, upcoming work will involve benchmarking the proposed system against both baseline motion-based methods and alternative AI models to provide a more comprehensive evaluation of its performance. Despite some shortcomings, the system offers a good and deployable solution for automated basketball score recognition and can serve as a foundation for further expanding IoT-based sports analytics.

