Abstract
Nowadays, ubiquitous technology makes life easier, especially devices that use the internet (IoT). IoT devices have been used to generate data in various domains, including healthcare, industry, and education. However, there are often problems with this generated data such as missing values, duplication, and data errors, which can significantly affect data analysis results and lead to inaccurate decision making. Enhancing the quality of real-time data streams has become a challenging task as it is crucial for better decisions. In this paper, we propose a framework to improve the quality of a real-time data stream by considering different aspects, including context-awareness. The proposed framework tackles several issues in the data stream, including duplicated data, missing values, and outliers to improve data quality. The proposed framework also provides recommendations on appropriate data cleaning techniques to the user to help improve data quality in real time. Also, the data quality assessment is included in the proposed framework to provide insight to the user about the data stream quality for better decisions. We present a prototype to examine the concept of the proposed framework. We use a dataset that is collected in healthcare and process these data using a case study. The effectiveness of the proposed framework is verified by the ability to detect and repair stream data quality issues in selected context and to provide a recommended context and data cleaning techniques to the expert for better decision making in providing healthcare advice to the patient. We evaluate our proposed framework by comparing the proposed framework against previous works.
1. Introduction
Nowadays, ubiquitous technology makes life easier, especially with the use of Internet of Things (IoT) devices. The IoT has affected many domains in our daily lives, both on business and personal levels [1]. Analytical methods can be used to extract useful knowledge from the large volume of data collected from IoT devices [2]. These devices generate enormous amounts of data and are utilized in various fields such as industry, business, and healthcare. For instance, in healthcare, the Internet of Medical Things (IoMT) comprises medical devices, applications, and equipment that use networks to communicate online [3]. There are several benefits of using IoMT, such as the availability of a person’s vital signs at home, in a clinic, or in surgery, so a suitable response can be made in a short time [3]. When high quality data are processed in real time or near real time, a decision can be made in a short amount of time, which helps save patient lives.
However, the quality of generated data is often low because there are often problems with streaming data such as missing values, outliers, and data errors. As a result, an analysis of the streaming data will lead to incorrect results due to poor data quality. For example, when a sensor stops working without any performance degradation indication, it can result in either a missing value or no reading, where an erroneous reading or corrupt data can cause an outlier [4].
Preprocessing streaming data is crucial in enhancing streaming data quality and improving analysis results. Understanding the context in which the data were collected can assist in the data cleaning process. However, there is often insufficient information about the data collection context [5]. In IoT data, several elements make anomaly detection challenging, including but not limited to temporal context, noise, multivariate data produced by multiple sensors, and concept drift [2]. It is important to detect outliers in real time or near real time, which is challenging [2]. Therefore, cleaning streaming data is important to ensure that data quality is improved for better analysis results and decision making.
There are various data cleaning frameworks; however, they are unable to recommend suitable data cleaning approaches to the user to improve data quality [6]. Moreover, as the data quality assessment gives the decision maker the confidence to make difficult decisions, quality metrics need to be considered during the data cleaning process. In this paper, we propose a comprehensive streaming data cleaning framework comprising four phases: the context phase, preprocessing phase, analysis phase, and rules controller. The proposed framework helps to clean streaming data using several existing data cleaning techniques, which improves data quality and recommends data cleaning methods to the user. The data quality assessment in the proposed framework enables better decision making in real time or near real time. Thus, the proposed framework ensures the homogeneous work of these techniques together as it can switch between these techniques to maximize the data quality and provide a clear picture to the user to take better decisions with confidence.
This paper is structured as follows: the second section presents the related work on data cleaning in terms of framework data cleaning, context awareness, detection techniques, repairing techniques, and data quality assessment. The proposed framework is described in the third section with an explanation of each phase. The fourth section presents a prototype as proof of concept and a use case scenario in healthcare to validate the proposed framework. The proposed framework is evaluated in the fifth section. A summary of this paper and suggestions for future work are provided in the sixth section.
2. Related Works
Processing streaming data provides benefits in various domains, such as healthcare, industry, and business. Several methods have been proposed to improve streaming data quality due to the importance of processing data in real time to assist decision making. Cleaning streaming data addresses different data quality issues such as outliers, missing values, duplicated data, and other issues. Previous studies on data cleaning are classified into framework, context-awareness, data preprocessing, which includes detection techniques and repairing techniques, and data quality assessment. The framework section details the previous work that proposes a framework to clean data, while the context awareness section details the work that considers context to improve the performance of the data cleaning process. In relation to data preprocessing, the detection section details existing studies that focus on detection issues without repairing the problems, while the studies that concentrate on repairing data are grouped in the repairing techniques section. The data quality assessment section presents the related studies that proposed different approaches to calculate data quality.
2.1. Data Cleaning Frameworks
Building a data cleaning framework is beneficial to the data cleaning process because it combines different data cleaning techniques to improve data quality. Corrales et al. [6] proposed a framework to improve data quality in classification tasks (DQF4CT). The framework was designed to deal with missing values, outliers, high dimensionality, imbalanced classes, miss-labelled classes, and duplicated data. Also, the framework recommended a data cleaning technique to the user. However, the framework was not designed for data streams and did not consider the context during the data cleaning process, nor did it repair outliers when detected. In addition, an analysis section and data quality assessments were missing in this framework.
Miao et al. [7] proposed a framework to clean data in the patch process. The framework focused on removing missing values and outliers, substitution (substituting missing values and inconsistent values), and transformation. The preprocessing (detection and repairing) and analysis stages were included in this framework; however, context-awareness, recommendations for cleaning techniques, and user intervention are missing. Also, data quality assessment was not considered. Panjei et al. [8] proposed a framework to detect outliers in data streams by considering concept drift, unbounded volume, and cross-correlations. Najib et al. [9] proposed a framework called fuzzy c-means clustering for incomplete data streams (FID) to impute missing values.
Even though many data cleaning frameworks deal with specific aspects of data cleaning, none of the above studies included context or data quality assessment. Corrales et al. [6] proposed a data cleaning method, but it lacks analysis and does not address data stream cleaning. Miao et al. [7] proposed a framework for detecting outliers, but it lacks recommendations on how to clean the data stream. It also does not address other issues such as duplicated data, missing values, and inconsistent data, nor does the framework repair the data that contain outliers. The framework by Panjei et al. [8] considered outlier detection, but disregarded other issues such as missing values, duplicated data, and data inconsistency. Also, it did not include a section on data repairing in the framework. Najib et al. [9] focused on imputing missing values in streaming data; however, data analysis, recommendations for data cleaning techniques for the user, user intervention, and data detection are not included in their framework. Therefore, there is a need for a comprehensive data cleaning framework that includes the context of the data cleaning process, data analysis, recommendations for data cleaning techniques for the user, user intervention, data preprocessing (detection and repairing techniques), and data quality assessment to improve data quality in real-time data streams.
2.2. Context-Awareness in Data Stream Cleaning
Several researchers considered a context awareness capability to improve streaming data cleaning accuracy. Hassan et al. [10] proposed a deep learning model based on deep neural networks (DNNs) to detect outliers in the context of streaming data. Borah et al. [11] proposed an algorithm called contextual outlier in the data stream (CODS) using a graphics processing unit to detect contextual outliers. Gaudio et al. [5] proposed dynamic functional dependency rules extracted from a live context model to improve data cleaning methods for detecting errors. Context knowledge was used to improve existing data cleaning methods by proposing RTClean.
Some previous works considered context in data cleaning but failed to provide data analysis, data quality assessments, recommended data cleaning techniques, or a user intervention capability. The approaches proposed by Hassan et al. [10] and Borah et al. [11] only detected contextual outliers without detecting other issues such as duplicated data, data errors, and any repairing techniques applied to the detected contextual outliers. Gaudio et al. [5] considered detection issues to detect errors in the data stream. However, they do not provide a comprehensive data cleaning approach for streaming data that detects issues such as duplicated data and missing values and repairs the detected issues. Thus, a comprehensive data cleaning framework that offers data analysis, data quality assessments, user intervention in the data cleaning process, and recommended data cleaning techniques in a real-time data stream is needed to improve data quality to assist in the making of better decisions.
2.3. Data Preprocessing
Data preprocessing consists of two stages, namely data issue detection and data repair. Data issue detection techniques are methods that are used to check if the data contain issues or not, while the data repair technique is used to fix the issues detected in the data. Thus, we divide this section into detection and repair techniques.
2.3.1. Detection Techniques
Detecting issues in streaming data such as missing values or outliers is important in the data cleaning process. Many researchers have suggested techniques to detect specific issues in streaming data, especially for global outliers.
Cai et al. [12] proposed uncertain weighted frequent-pattern-based outlier detection to detect implicit outliers in streaming data. Tran et al. [13] proposed a core point-based outlier detection (CPOD) algorithm to improve the efficiency of outlier detection and reduce the requirements of memory usage. Shou et al. [14] proposed an algorithm for outlier detection that is based on the local density of the vector dot product in the data stream (LDVP-OD).
This section shows that the previous works focused on detecting techniques on one particular issue only, namely outlier detection. However, they do not propose approaches to detect other issues such as missing values, errors, or duplicated data. Also, none of the previous works use context to improve detection performance or consider data quality during the detection process, nor do they include data analysis or user intervention in the detection process such as choosing a detection technique or repairing data issues.
2.3.2. Repairing Techniques
Various techniques have been proposed to handle issues that might be detected in streaming data, such as imputing missing values or removing outliers. In relation to imputing missing values, a variety of approaches have been used, such as replacing the missing values with a maximum or minimum value, as proposed in Alotaibi et al. [15].
Turabieh et al. [3] proposed a dynamic adaptive network-based fuzzy inference system that combines a fuzzy system and artificial neural networks. The proposed method was used to impute missing values that can occur in data collected from IoMT. Fountas et al. [16] proposed an ensemble correlation model based on cosine similarity, and Mahalanobis distance was proposed to impute missing values in the data stream. Van Zoest et al. [17] focused on outlier detection and imputing missing data from data streams generated from IoT devices by applying various methods. A method based on spatio-temporal classification was adopted to detect outliers, where the missing value was estimated using the maximum likelihood estimation method.
In relation to repairing techniques, previous studies proposed various methods to impute missing values without discussing which technique was used to detect the missing values. Van Zoest et al. [17] considered outlier detection in addition to imputing missing values but their approach does not repair the outlier. None of the previous works include data quality assessment, data analysis, or using context during the process. Also, user intervention and user recommendations for data cleaning are missing in the previous works. The previous works only focus on one issue of data repair and none includes different data issues like outliers, data errors, and duplication.
This section shows that there is no complete data cleaning process in the previous works on detection and repairing techniques. In relation to detection, the previous works focus on detecting one issue, and repairing methods are not included in these works. Likewise, in relation to repairing techniques, previous research concentrates on how to tackle one issue and ignores detection. Therefore, there is a need for a complete data preprocessing technique where any data issue is repaired when detected.
2.4. Data Quality Assessment
Several studies have been conducted in terms of data quality measurement. However, as discussed in Elouataoui et al. [18], only a few data quality metrics are examined. Data quality can be measured in relation to different aspects, such as free of error, completeness, consistency, and timeliness [19]. Table 1 shows the metrics of each aspect that may help to assess data quality.

Table 1.
Data quality assessment metrics.
As discussed by Pipino et al. [19] in relation to timeliness metrics, currency = (delivery time—input time) + age, where delivery time refers to the time the user received the data, input time refers to the time at which the data entered the system, and age refers to the age of the data when they were first received by the system. Volatility refers to the length of time that the data remain valid, while the exponent value depends on the task. Elouataoui et al. [18] proposed 12 metrics to measure data quality, namely completeness, timeliness, consistency, volatility, uniqueness, conformity, ease of manipulation, relevancy, readability, security, accessibility, and integrity. The data quality metrics of completeness, consistency and timeliness are shown in Table 2.

Table 2.
Data quality measurement metrics.
Ehlinger et al. [20] conducted a systematic review of data quality measurement and presented various methods that proposed metrics to measure data quality.
There are many works on data cleaning; however, no comprehensive data cleaning method has been proposed. For instance, when Cai et al. [12], Tran et al. [13], and Shou et al. [14] focused on detecting outliers, they failed to consider the repairing technique for the detected outliers. In relation to the repairing technique, missing values are the only issue that Turabieh et al. [3], Fountas et al. [16], and Van Zoest et al. [17] concentrated on solving; however, they did not include how they detected missing values or if they used multiple techniques to repair missing values. The majority of the previous work did not include data analysis, data cleaning recommendations, user intervention, or context awareness.
Data quality measurement is missing in the previous data cleaning works because they concentrated on proposing an approach to deal with data issues. Data quality assessment needs to be considered in the data cleaning process because it is important to show the improvement of data quality after preprocessing the data to help the user make decisions.
The contribution of this paper is to fill the gap and provide a comprehensive data cleaning framework that contains various data cleaning phases to improve data quality in a real-time data stream. The proposed framework includes context awareness, data detection, data repair, data analysis, and data quality assessment. The proposed framework detects several issues when they appear in the data stream, including but not limited to missing values, outliers, date and time formatting, and errors. The proposed framework repairs each of the detected issues based on the repairing technique that the user selected. The proposed framework recommends a cleaning technique to the user that increases data quality in streaming data and analyzes and visualizes the results to the user. According to Alotaibi et al. [15], most detection techniques concentrate on detecting global outliers, whereas only a few researchers considered context in cleaning processing to detect contextual outliers or whether the sequence of cleaning stream data may have an effect on the data cleaning process. Thus, we combine and utilize various existing data cleaning techniques to provide a comprehensive framework that aims to improve data quality in streaming data, which will help the user make better decisions. These existing data cleaning techniques are combined to provide a full picture to the user and recommend the context and suitable data cleaning techniques based on the current situation. The proposed framework is detailed in the following section.
3. Proposed Framework
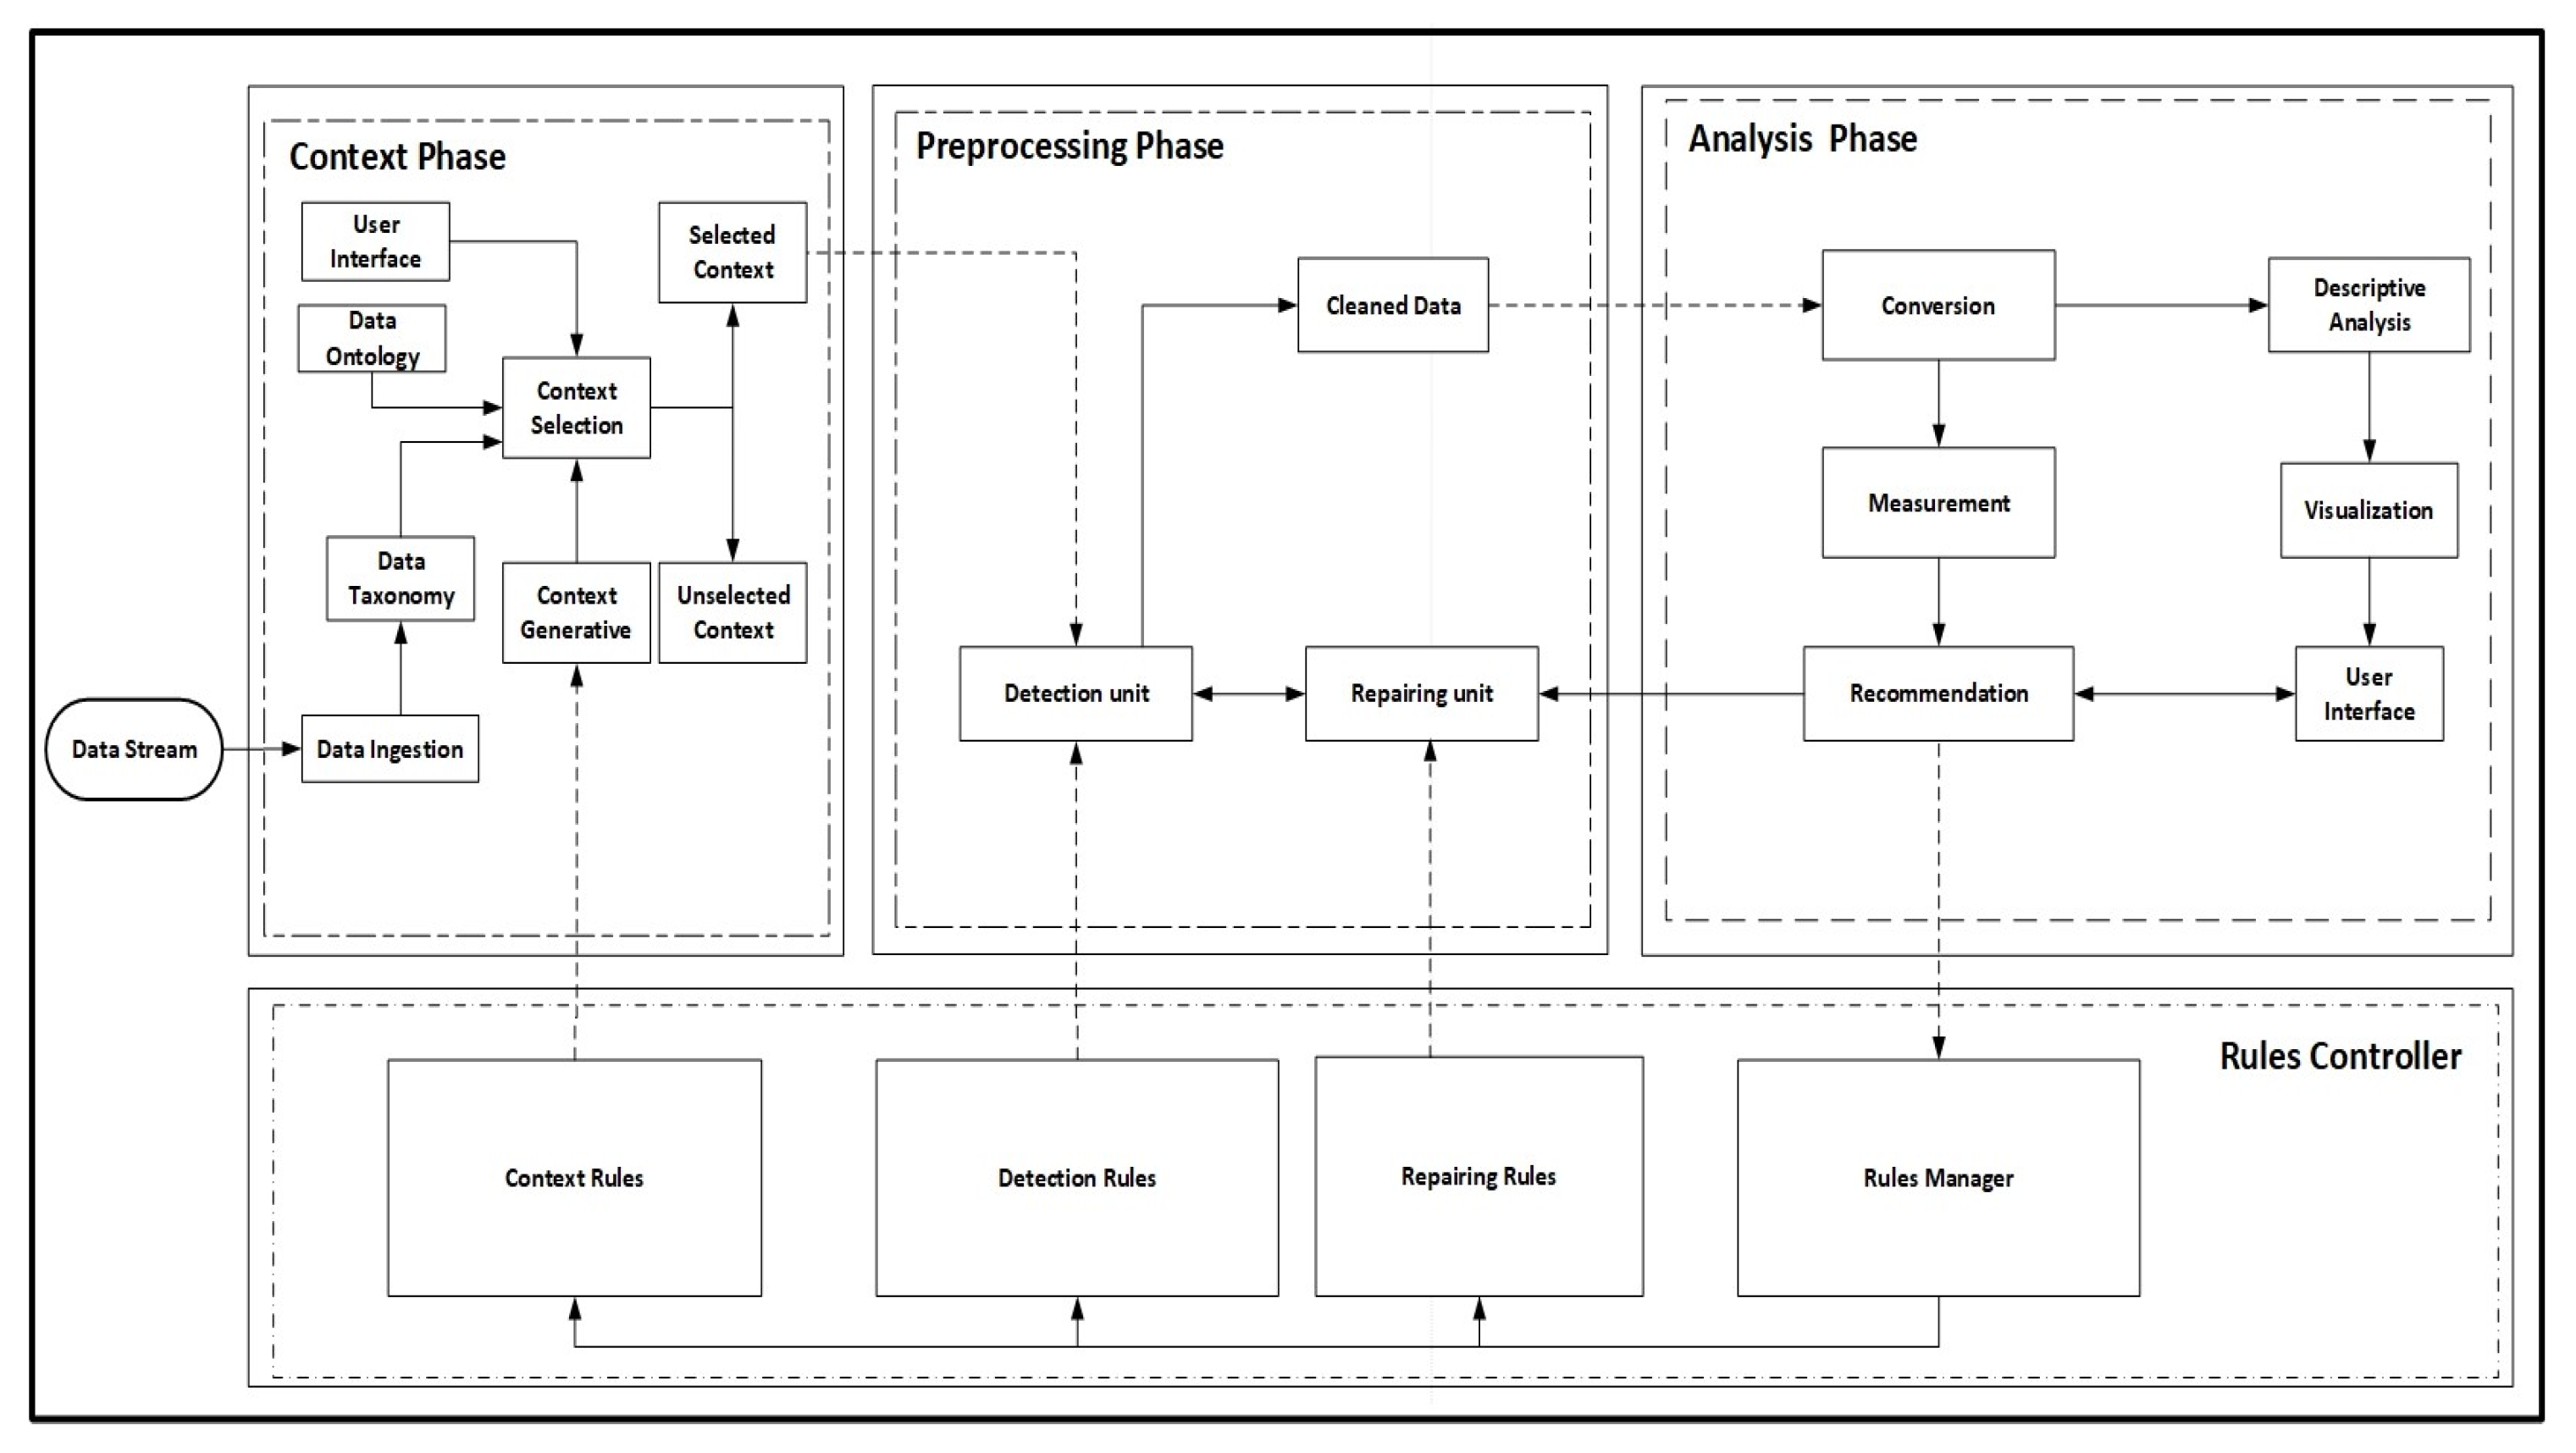
The proposed streaming data cleaning framework, as shown in Figure 1, consists of four sections, namely the context phase, preprocessing phase, analysis phase, and rules controller.
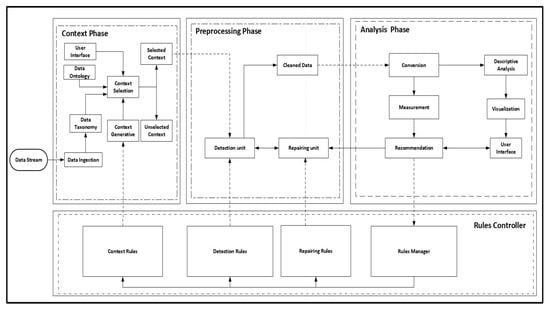
Figure 1.
Proposed framework.
The context phase aims to understand the context of the data stream and provide recommendations. The context phase comprises data ingestion, data taxonomy, data ontology, context selection, and context generative unit in streaming data. The preprocessing phase detects and repairs any data issues that appear in streaming data. The preprocessing phase comprises the detection unit and repairing unit. If the context has no data issue, it is sent to the analysis phase. The analysis phase analyzes and visualizes the context and recommends data cleaning techniques to the user. The analysis phase comprises the conversion, measurement, recommendation, descriptive analysis, and visualization of streaming data. The dynamics of the proposed framework are ensured by the rules controller, which amends the rules of each phase. The rules controller comprises the rules manager, repairing rules, detection rules, and context rules. Each phase is explained in detail in the following subsections.
3.1. Context Phase
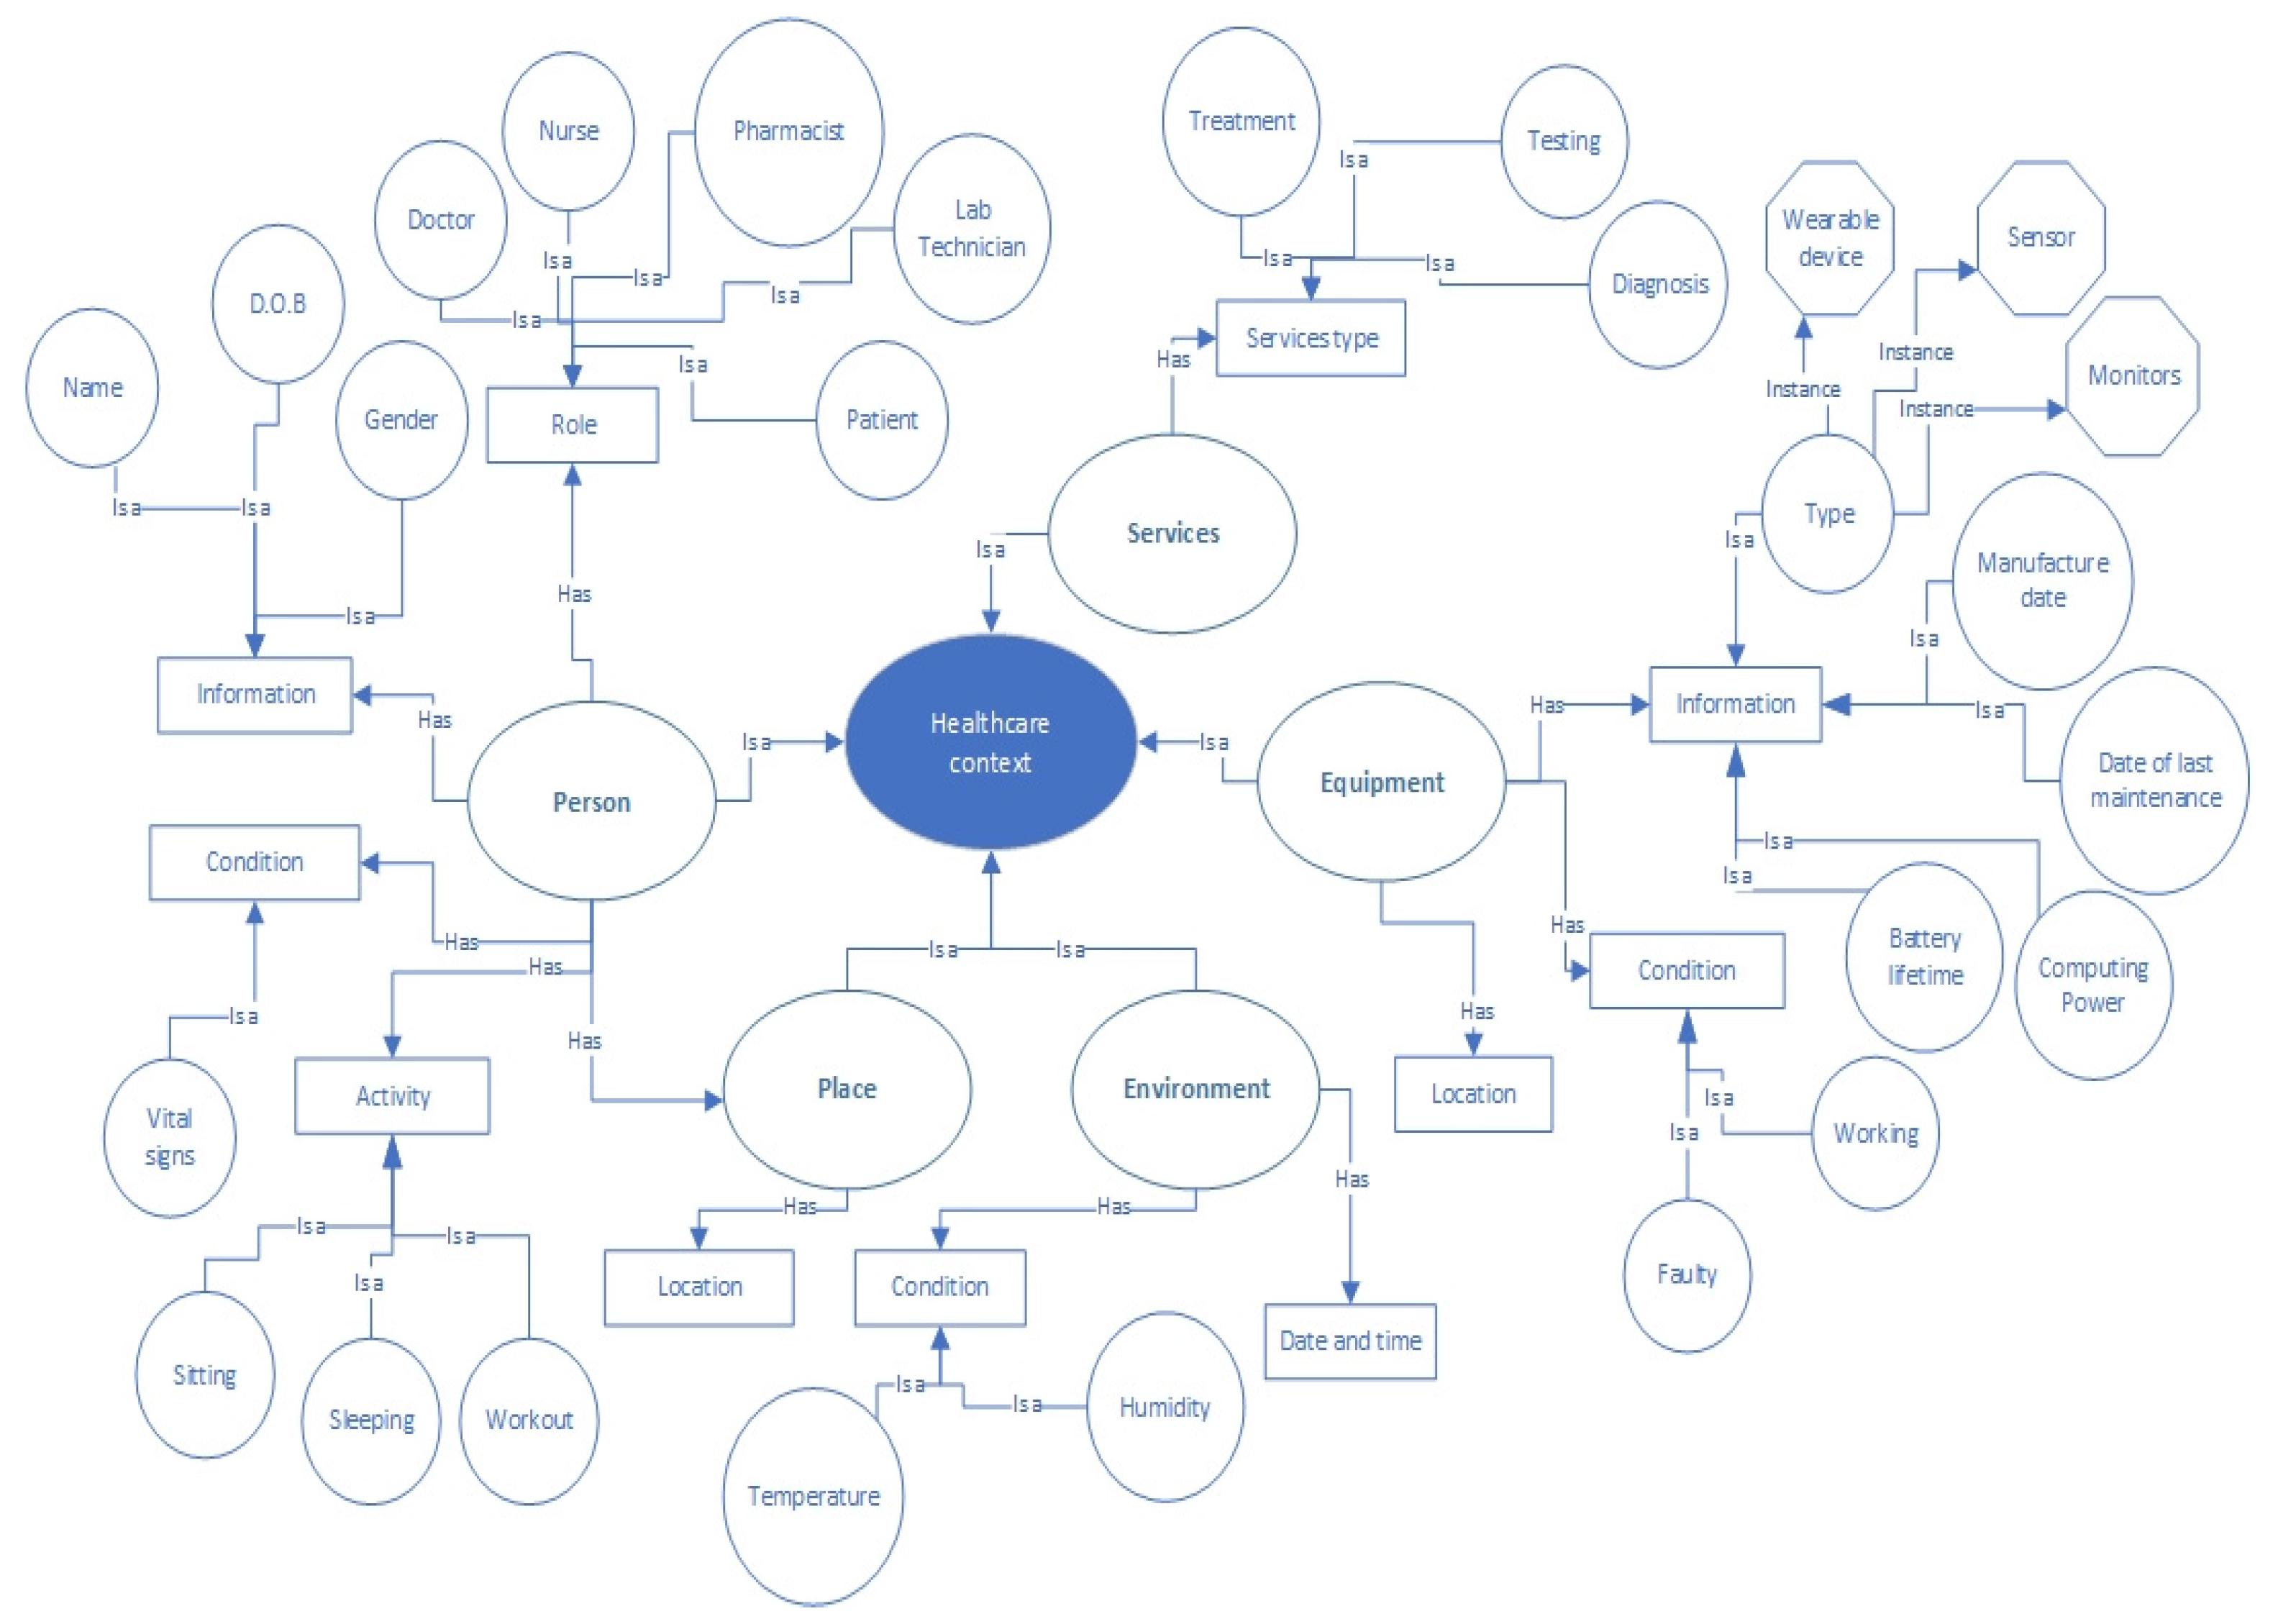
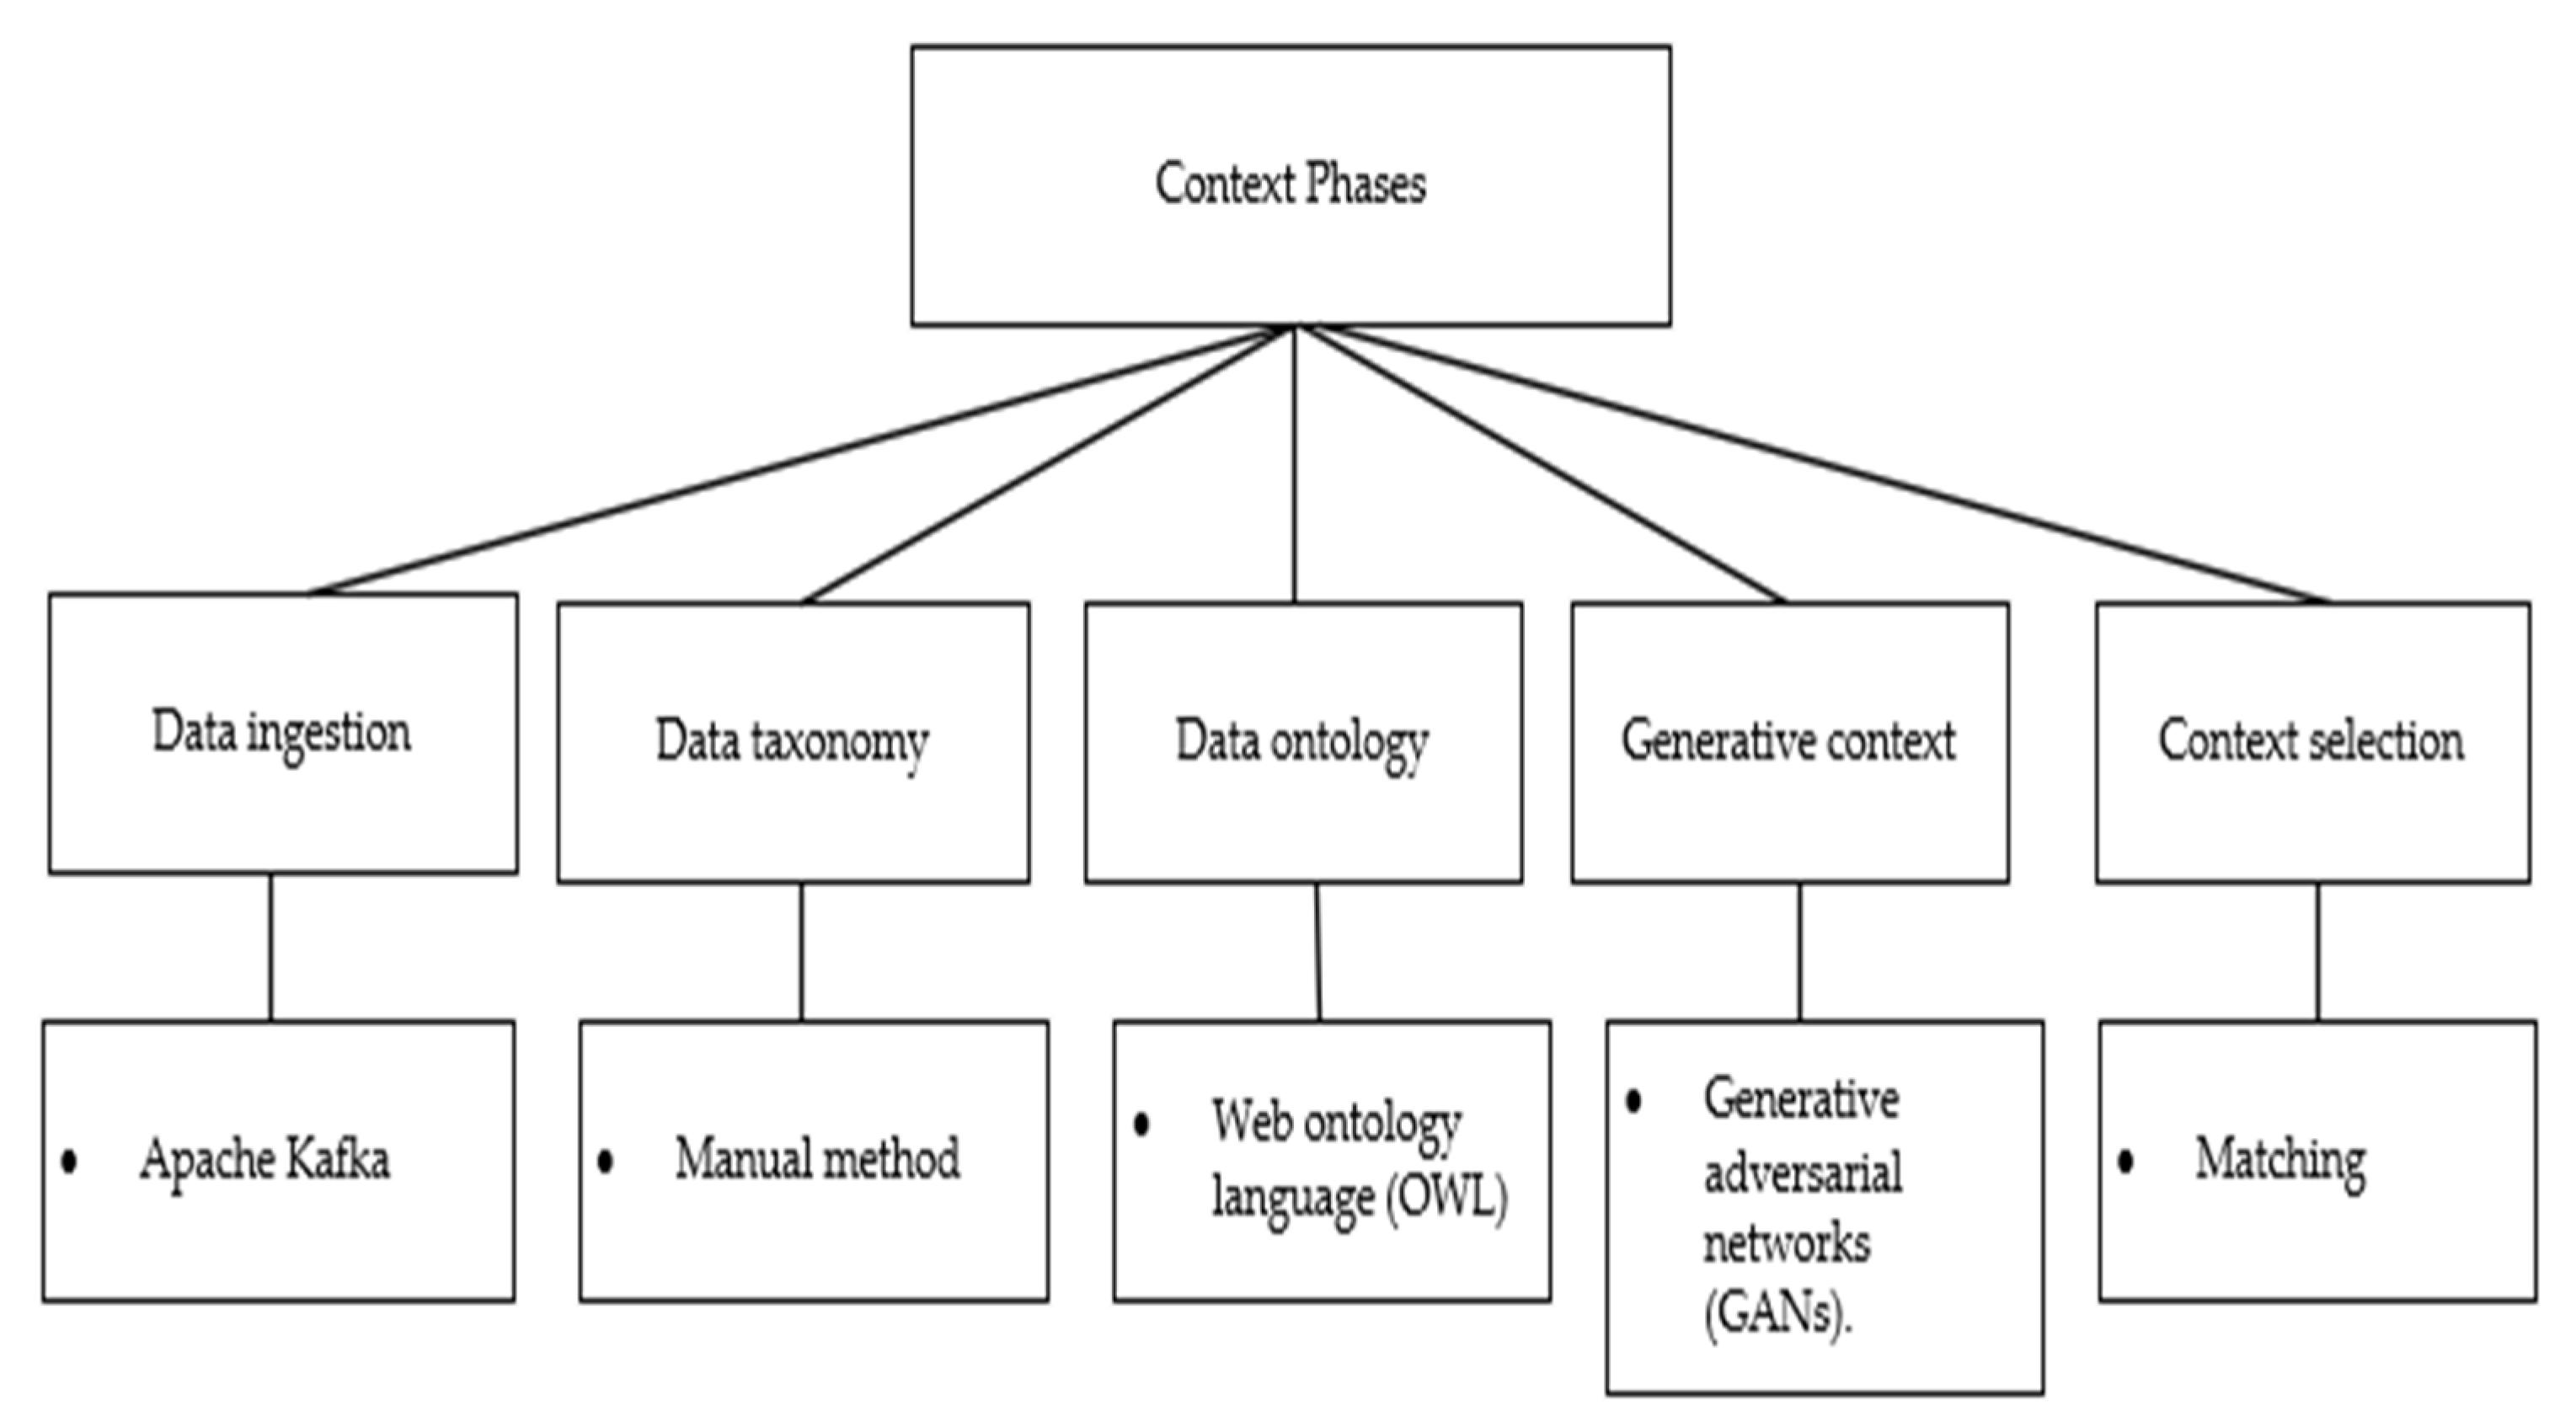
This phase incorporates several steps to deal with incoming data that come from various sources. The first step in this phase is data ingestion, the goal of which is to gather data and move it to a target, which makes it easier to capture useful information in the streaming data. When the streaming data are ingested, using Apache Kafka, a data taxonomy is created to classify the streaming data, as shown in Table 3, since the data in the stream are not classified. After classifying the data in the stream, we use Protégé to build a data ontology to link the data together. Figure 2 presents a healthcare data ontology in the streaming data.

Table 3.
Context classification.
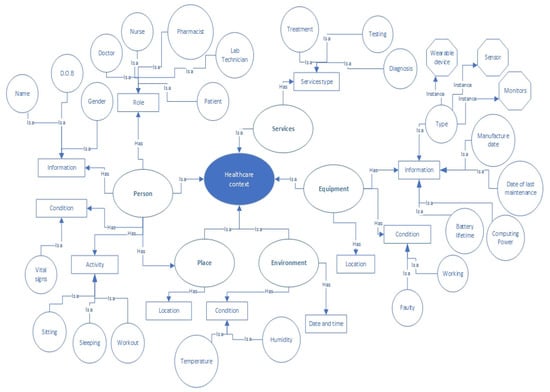
Figure 2.
Healthcare data ontology to link the streaming data together.
The context selection unit maps the data taxonomy into the data ontology and then the context is selected based on the user’s selection via the user interface. The data classification helps to provide a recommended context to the user interface for selection in the streaming data, based on the user selection. For example, the user starts by selecting a domain such as healthcare, industry, banking, etc. Then, the category is displayed to the user, as shown in Table 3, namely Person, Equipment, Environment, Place, and Services, each category having a different subcategory. After this, the subcategories are provided for the selected category; for instance, if the user selects Person as the category, the subcategories are information, condition, role, and activities. If the user selects the category Equipment, the subcategories are equipment information and equipment condition. Thus, the system provides the context to the user based on the user’s selection in the previous section. Further clarification is given in Section 4.1. Generative adversarial networks are applied to generate context in streaming data. The context generative unit automatically amends the context by adding or removing context from the streaming data based on the context rules unit from the rules controller. The rules controller is explained in the following subsections. The context is passed to the preprocessing phase. Figure 3 shows the possible techniques that can be used for each unit in the context phase.
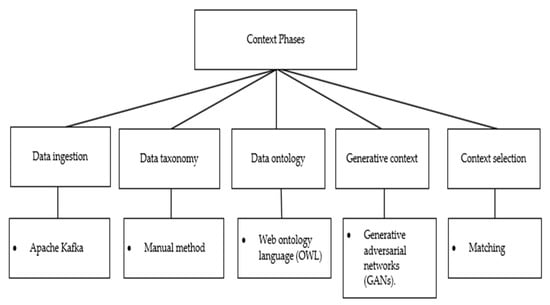
Figure 3.
Context Phase Techniques.
3.2. Preprocessing Phase
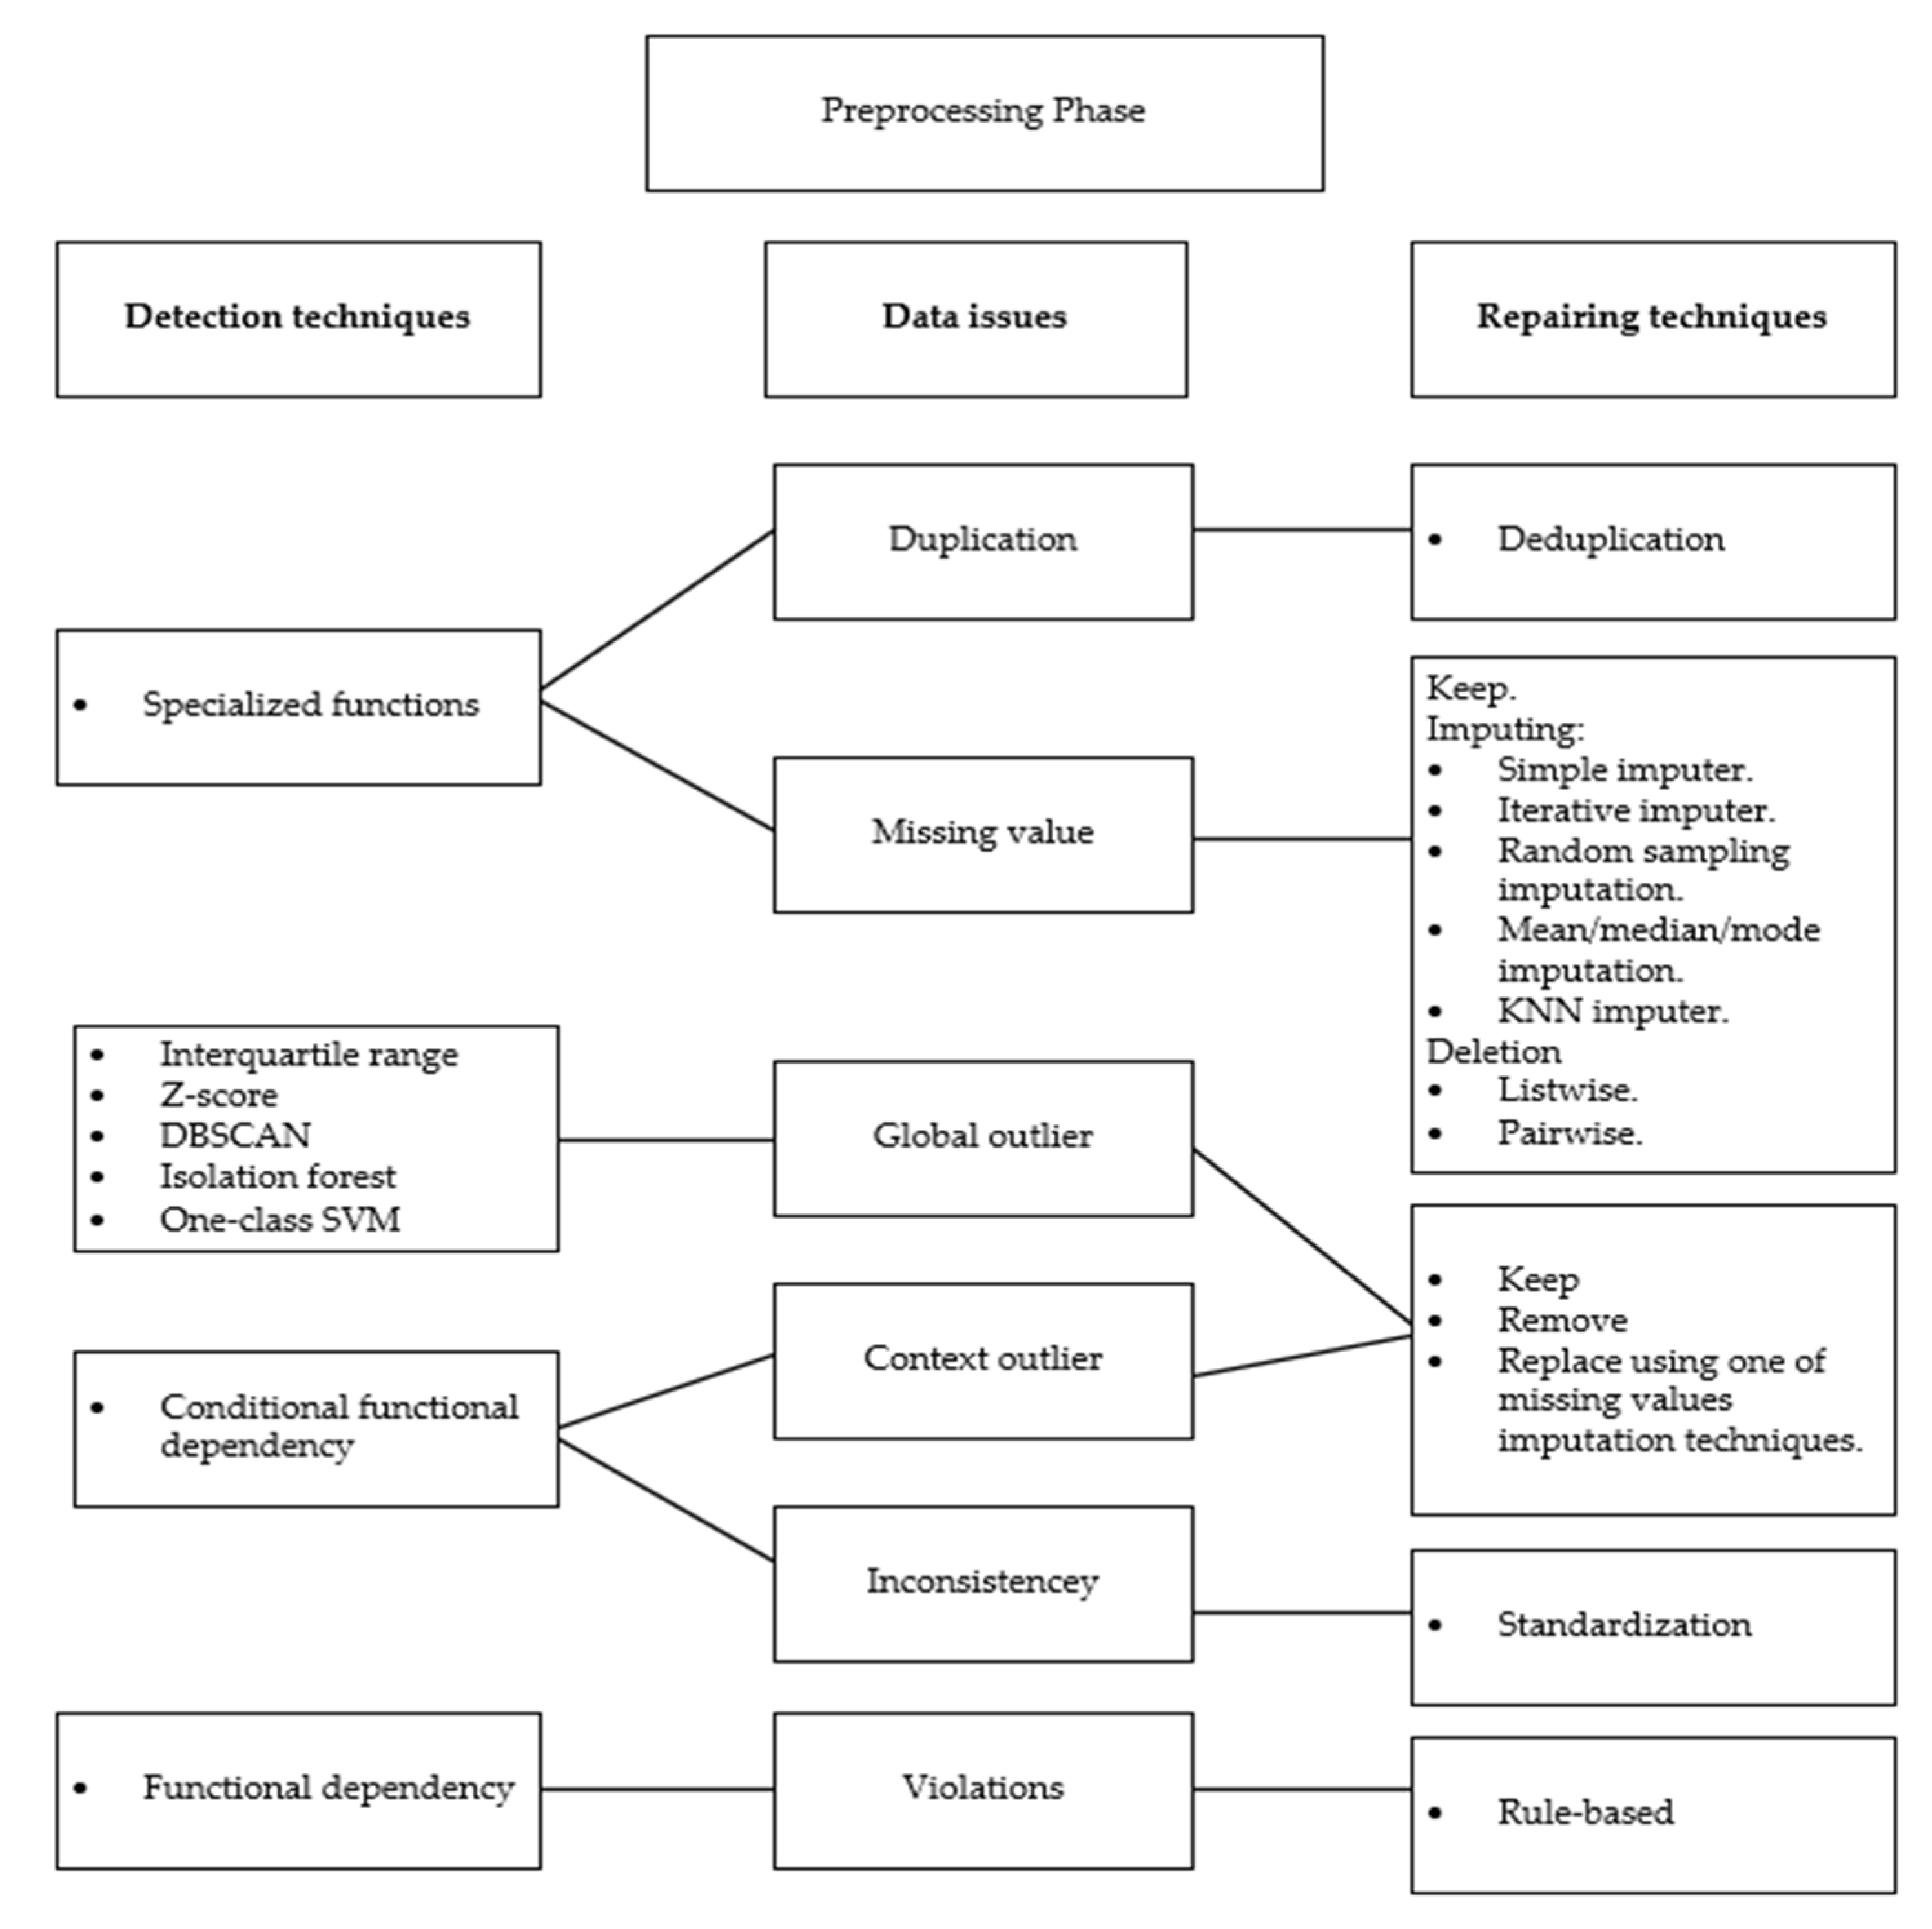
The selected context in the streaming data undergoes the preprocessing phase, which comprises a detection unit and a repairing unit. The detection unit finds issues that appear in the streaming data, such as duplication, missing values, context outlier, global outlier, inconsistent data, and violations. These issues are detected by utilizing several techniques. To detect duplicated data and missing values in the streaming data, a specialized function is used. While interquartile range and Z-score are used to detect global outliers in numerical data, clustering techniques such as DBSCAN, isolation forest, and one-class SVM are applied to detect global outliers in categorical and numerical data. These techniques are selected by the users. Contextual outliers and inconsistencies in the streaming data are detected using conditional functional dependency. Functional dependency is applied to find violations in the streaming data. When the selected streaming data goes through the detection unit, if there are any issues (unclean data), it passes to the repairing unit.
The repairing unit fixes the issues in the streaming data. For each issue detected in the context, there is a repairing technique to address it. In relation to duplicated data, deduplication techniques are applied to remove redundant data. In relation to missing values, there are three approaches to tackle incomplete data, namely keeping missing values, imputing missing values, and deleting incomplete data. Keeping missing values means not taking any action and leaving the streaming data with missing values. Imputing incomplete data means replacing the missing values with a specific value, as there are several techniques to impute missing values, such as simple imputer and KNN imputer, which are applied based on user selection. Deleting incomplete data means removing the data with missing values from the context in the streaming data. The user determines which technique to apply and when. Similar to missing values repairing techniques, global outliers and contextual outliers are tackled using one of three approaches, namely deleting, keeping, and replacing outliers using missing value imputation techniques. The user selects what technique to use to address global outliers and contextual outliers. If inconsistent data are detected in the context, a standardization technique is used to repair the inconsistency. Rule-based techniques are utilized to handle any detected violation in the context. If the detection unit does not find any issue in the context, the context passes to the analysis phase. Figure 4 shows the techniques that are used in the preprocessing phase in terms of detecting and repairing streaming data.
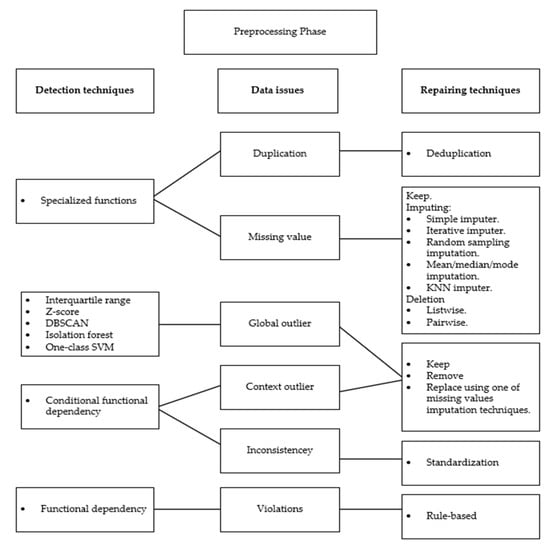
Figure 4.
Preprocessing Phase Techniques.
3.3. Analysis Phase
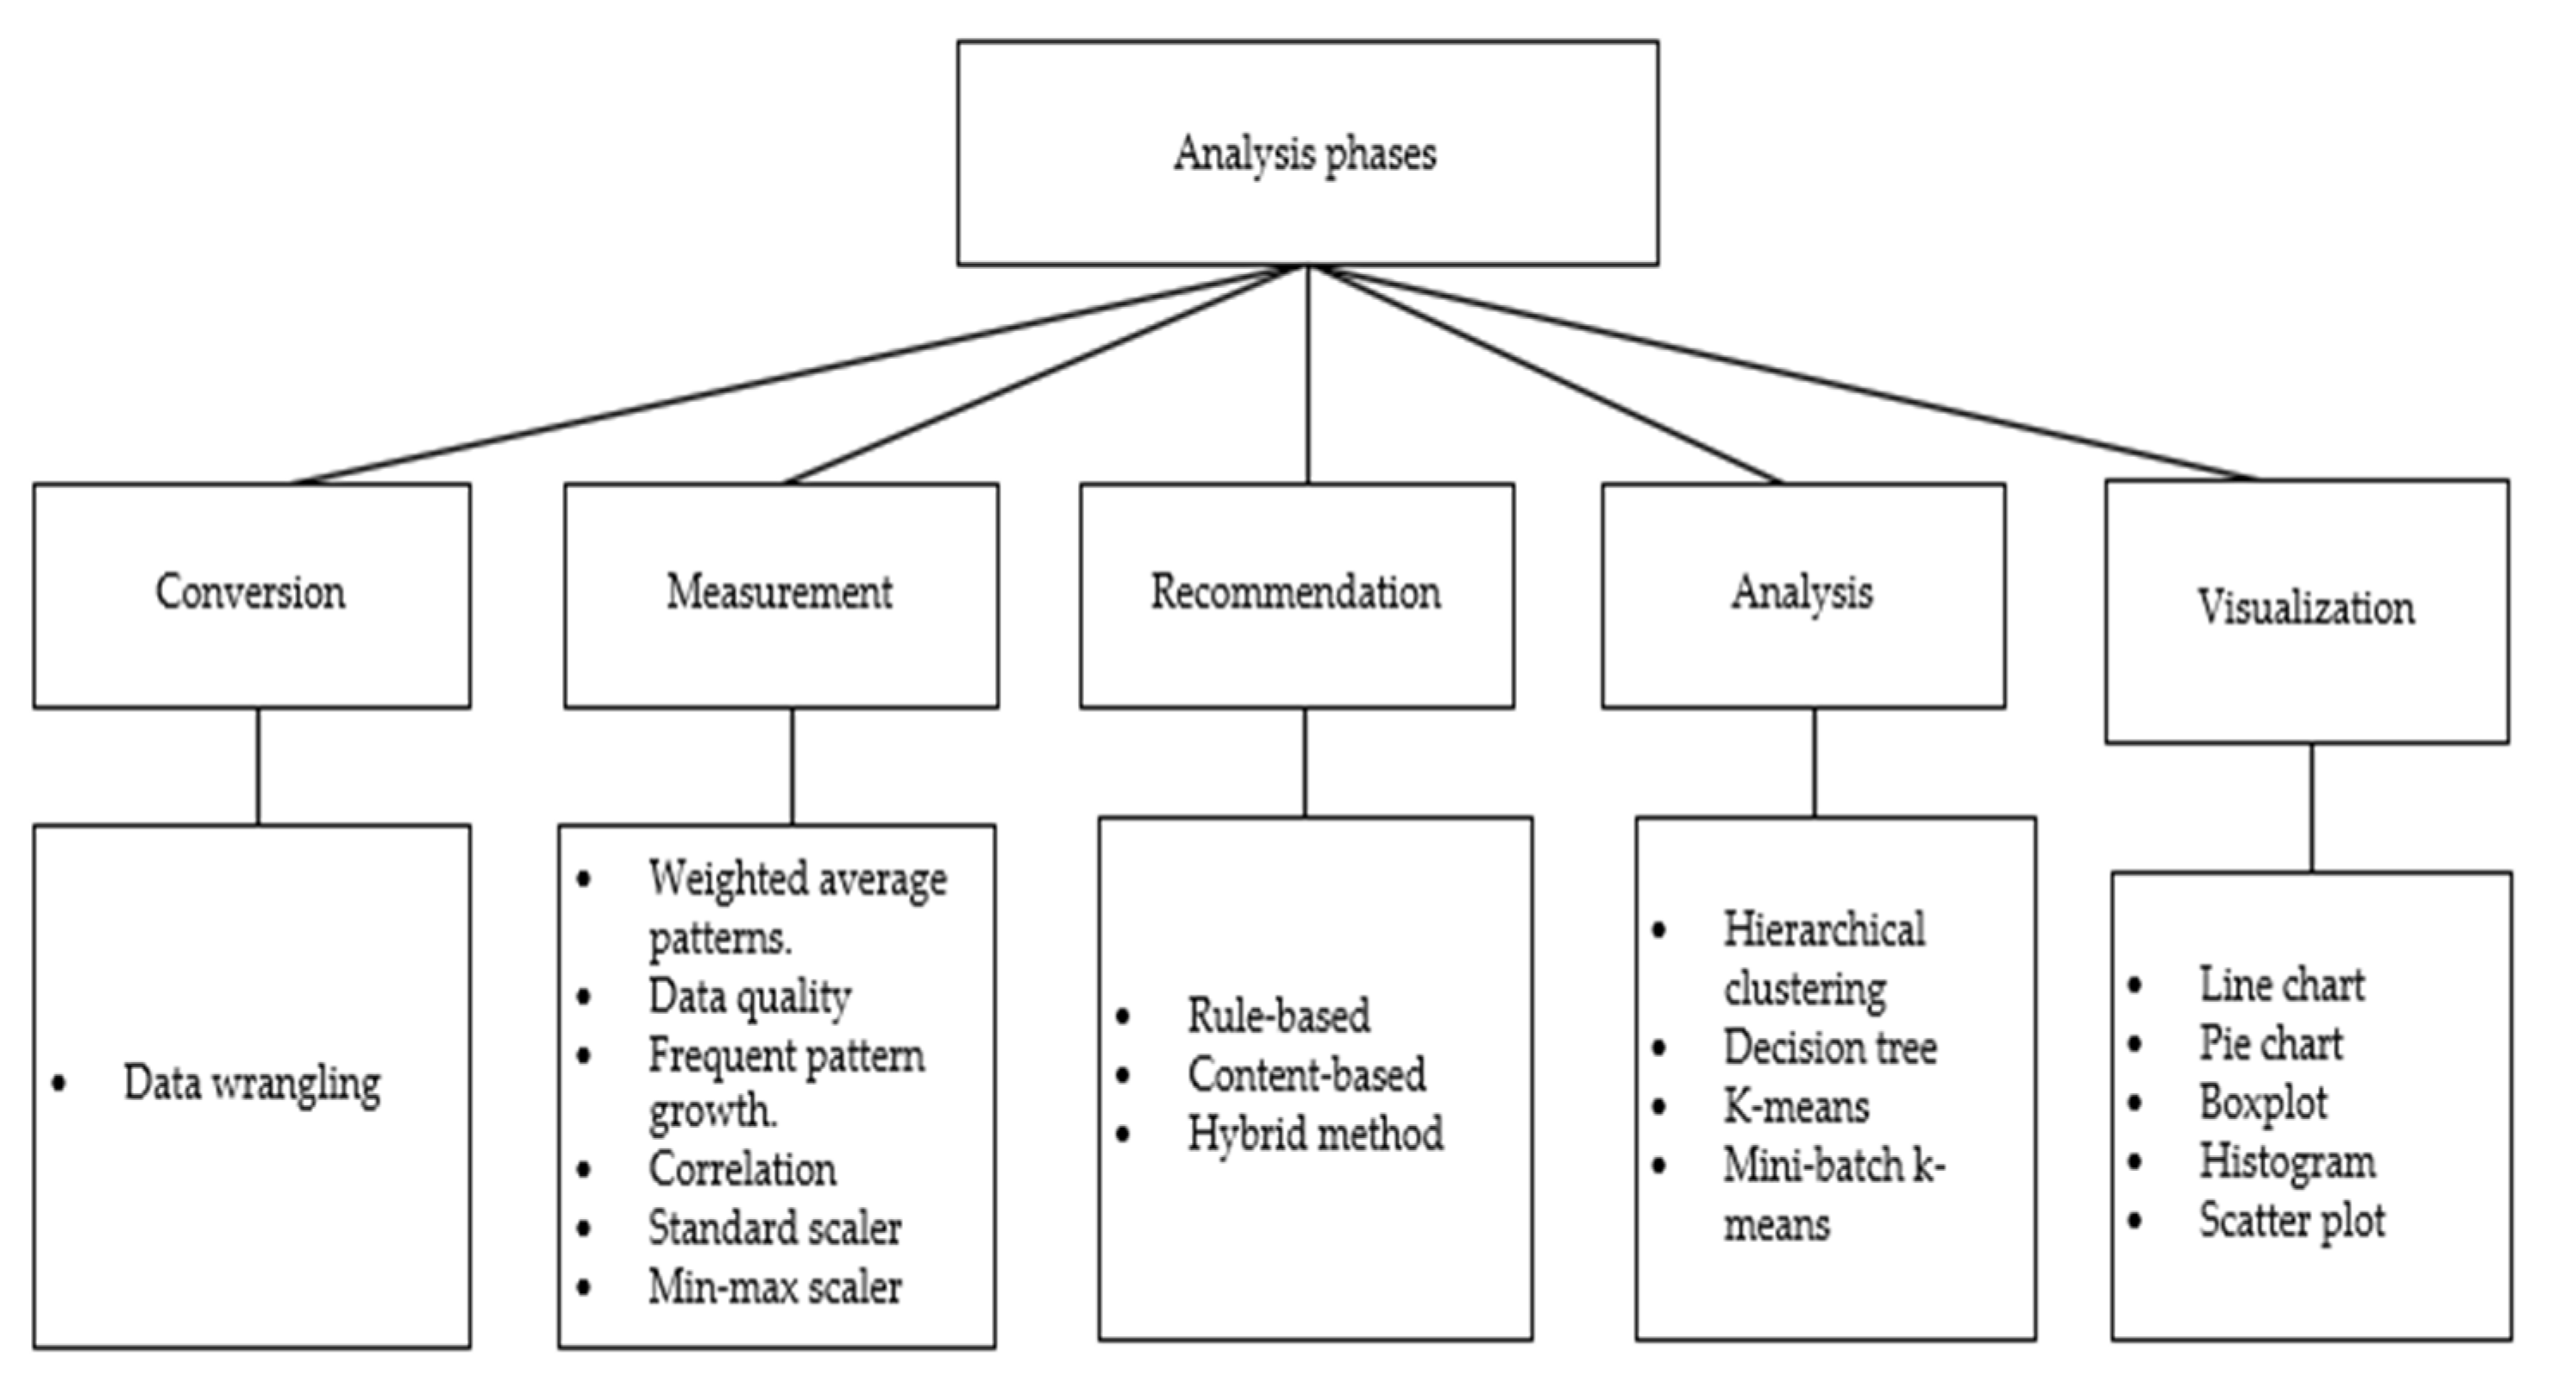
The analysis phase comprises several components, namely conversion, measurement, recommendation, descriptive analysis, and visualization. The conversion unit transforms the format of the streaming data to a usable format using the data wrangling technique. The measurement unit comprises several techniques that are applied to the context, such as data quality measurement, min-max normalization, and weighted average patterns technique. The weighted average patterns technique captures any change in the data stream patterns. The normalization techniques are useful for classification and clustering [21]. The result of the measurement unit passes to the descriptive analysis unit and the recommendation unit. The descriptive analysis unit analyzes the context and there are several techniques that can be used such as k-means clustering and decision tree. Then, the visualization unit visualizes the result of the descriptive analysis to the user using charts such as line charts or pie charts. The recommendation unit recommends a cleaning data method to the user based on a comparison of the performance of each cleaning technique using the rules-based approach and recommends the best technique in terms of performance to the user. This comparison is repeated if the streaming data patterns change. The user makes a decision whether to apply the recommended cleaning technique or not based on analytics visualization and data quality measurement. Figure 5 shows the different approaches that are used in the analysis phase.
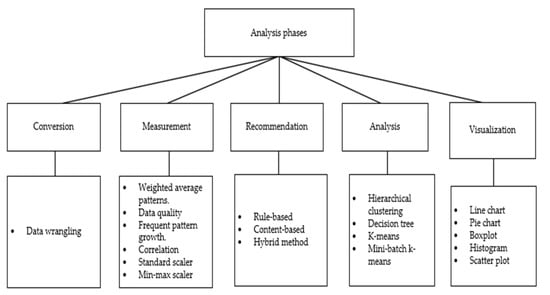
Figure 5.
Analysis Phase Approaches.
3.4. Rules Controller
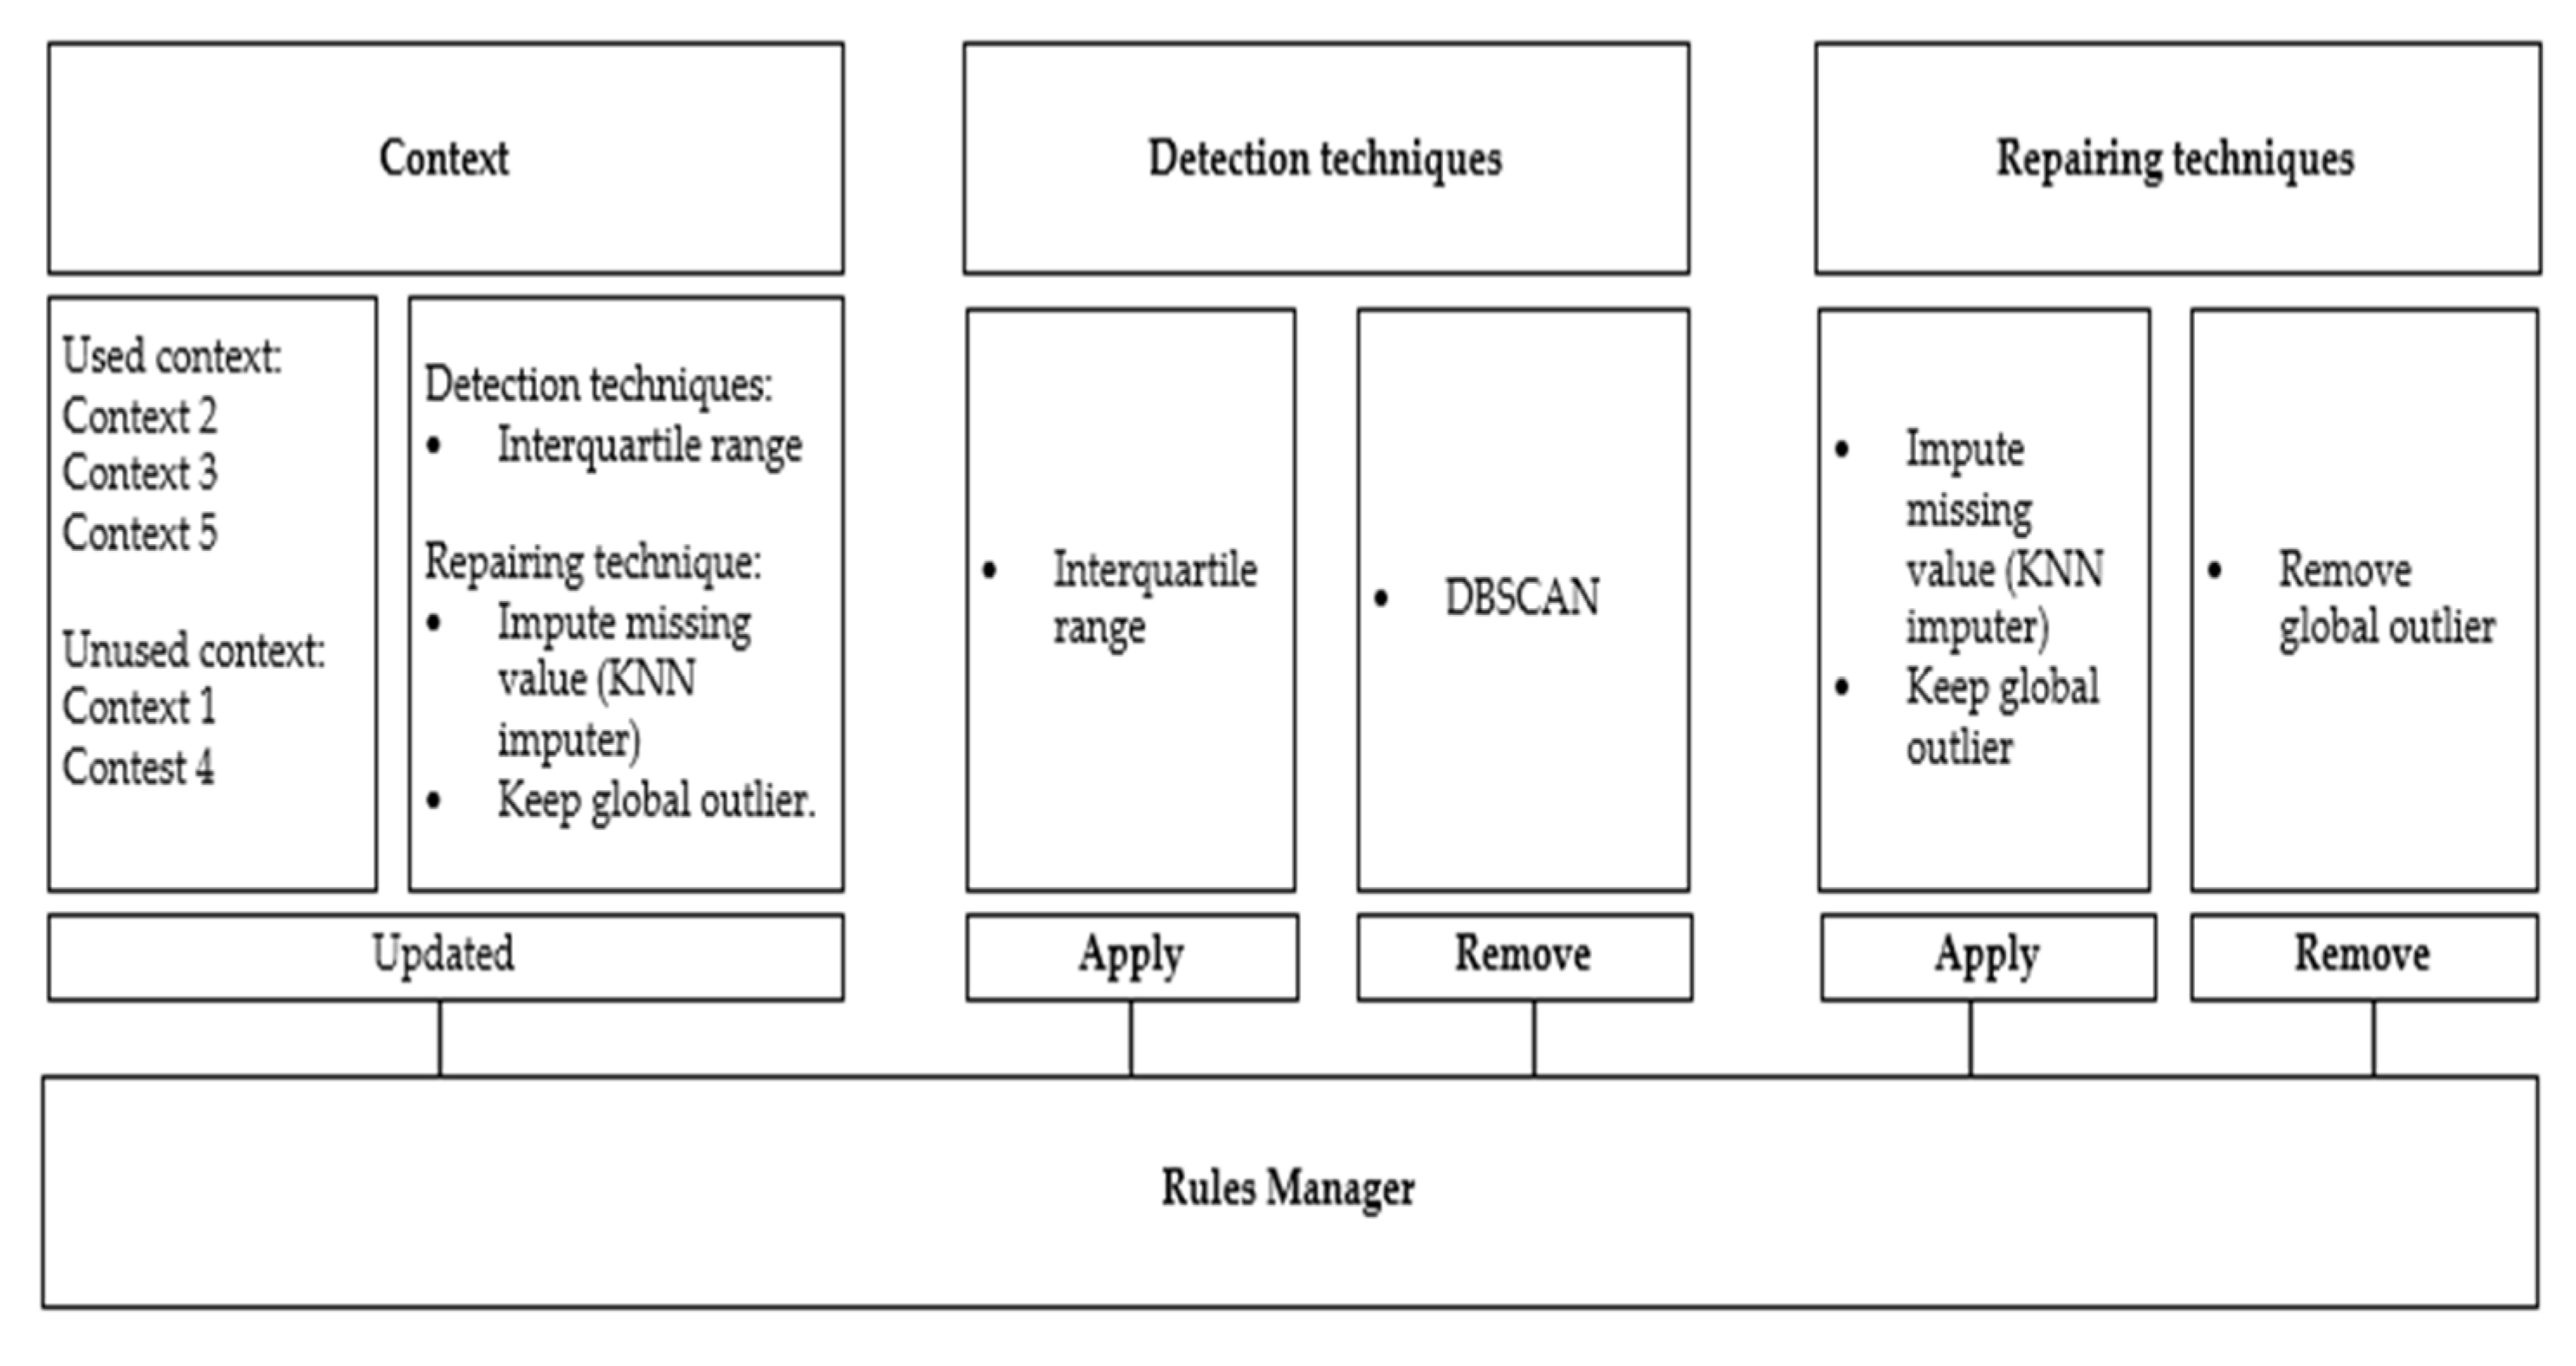
The rules controller connects all the different phases and comprises four units, namely context rules, detection rules, repairing rules, and rules manager. The rules manager keeps the dynamics of the proposed framework by amending the other rules units based on the outcome of the recommendation unit and user selection from the analysis phase. The purpose of the context rules unit is to update the context generative unit with current preprocessing techniques and current context, so it is connected to the context generative unit to add or remove context from the selected context unit in the context phase. The detection rules unit applies and removes detection rules from the detection unit in the preprocessing phase based on the analysis phase result and user selection. Similar to the detection rules, the repairing rules unit keeps adding and deleting the repairing rules from the repairing unit in the preprocessing phase. Figure 6 shows an example of the rules controller.
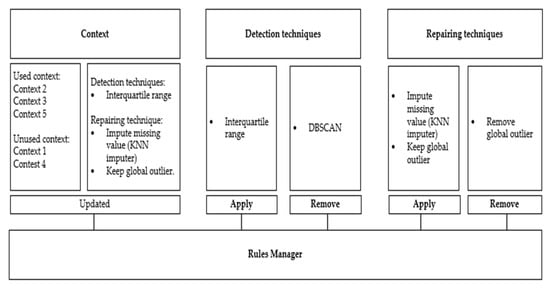
Figure 6.
Rules Controller Example.
4. Implementation
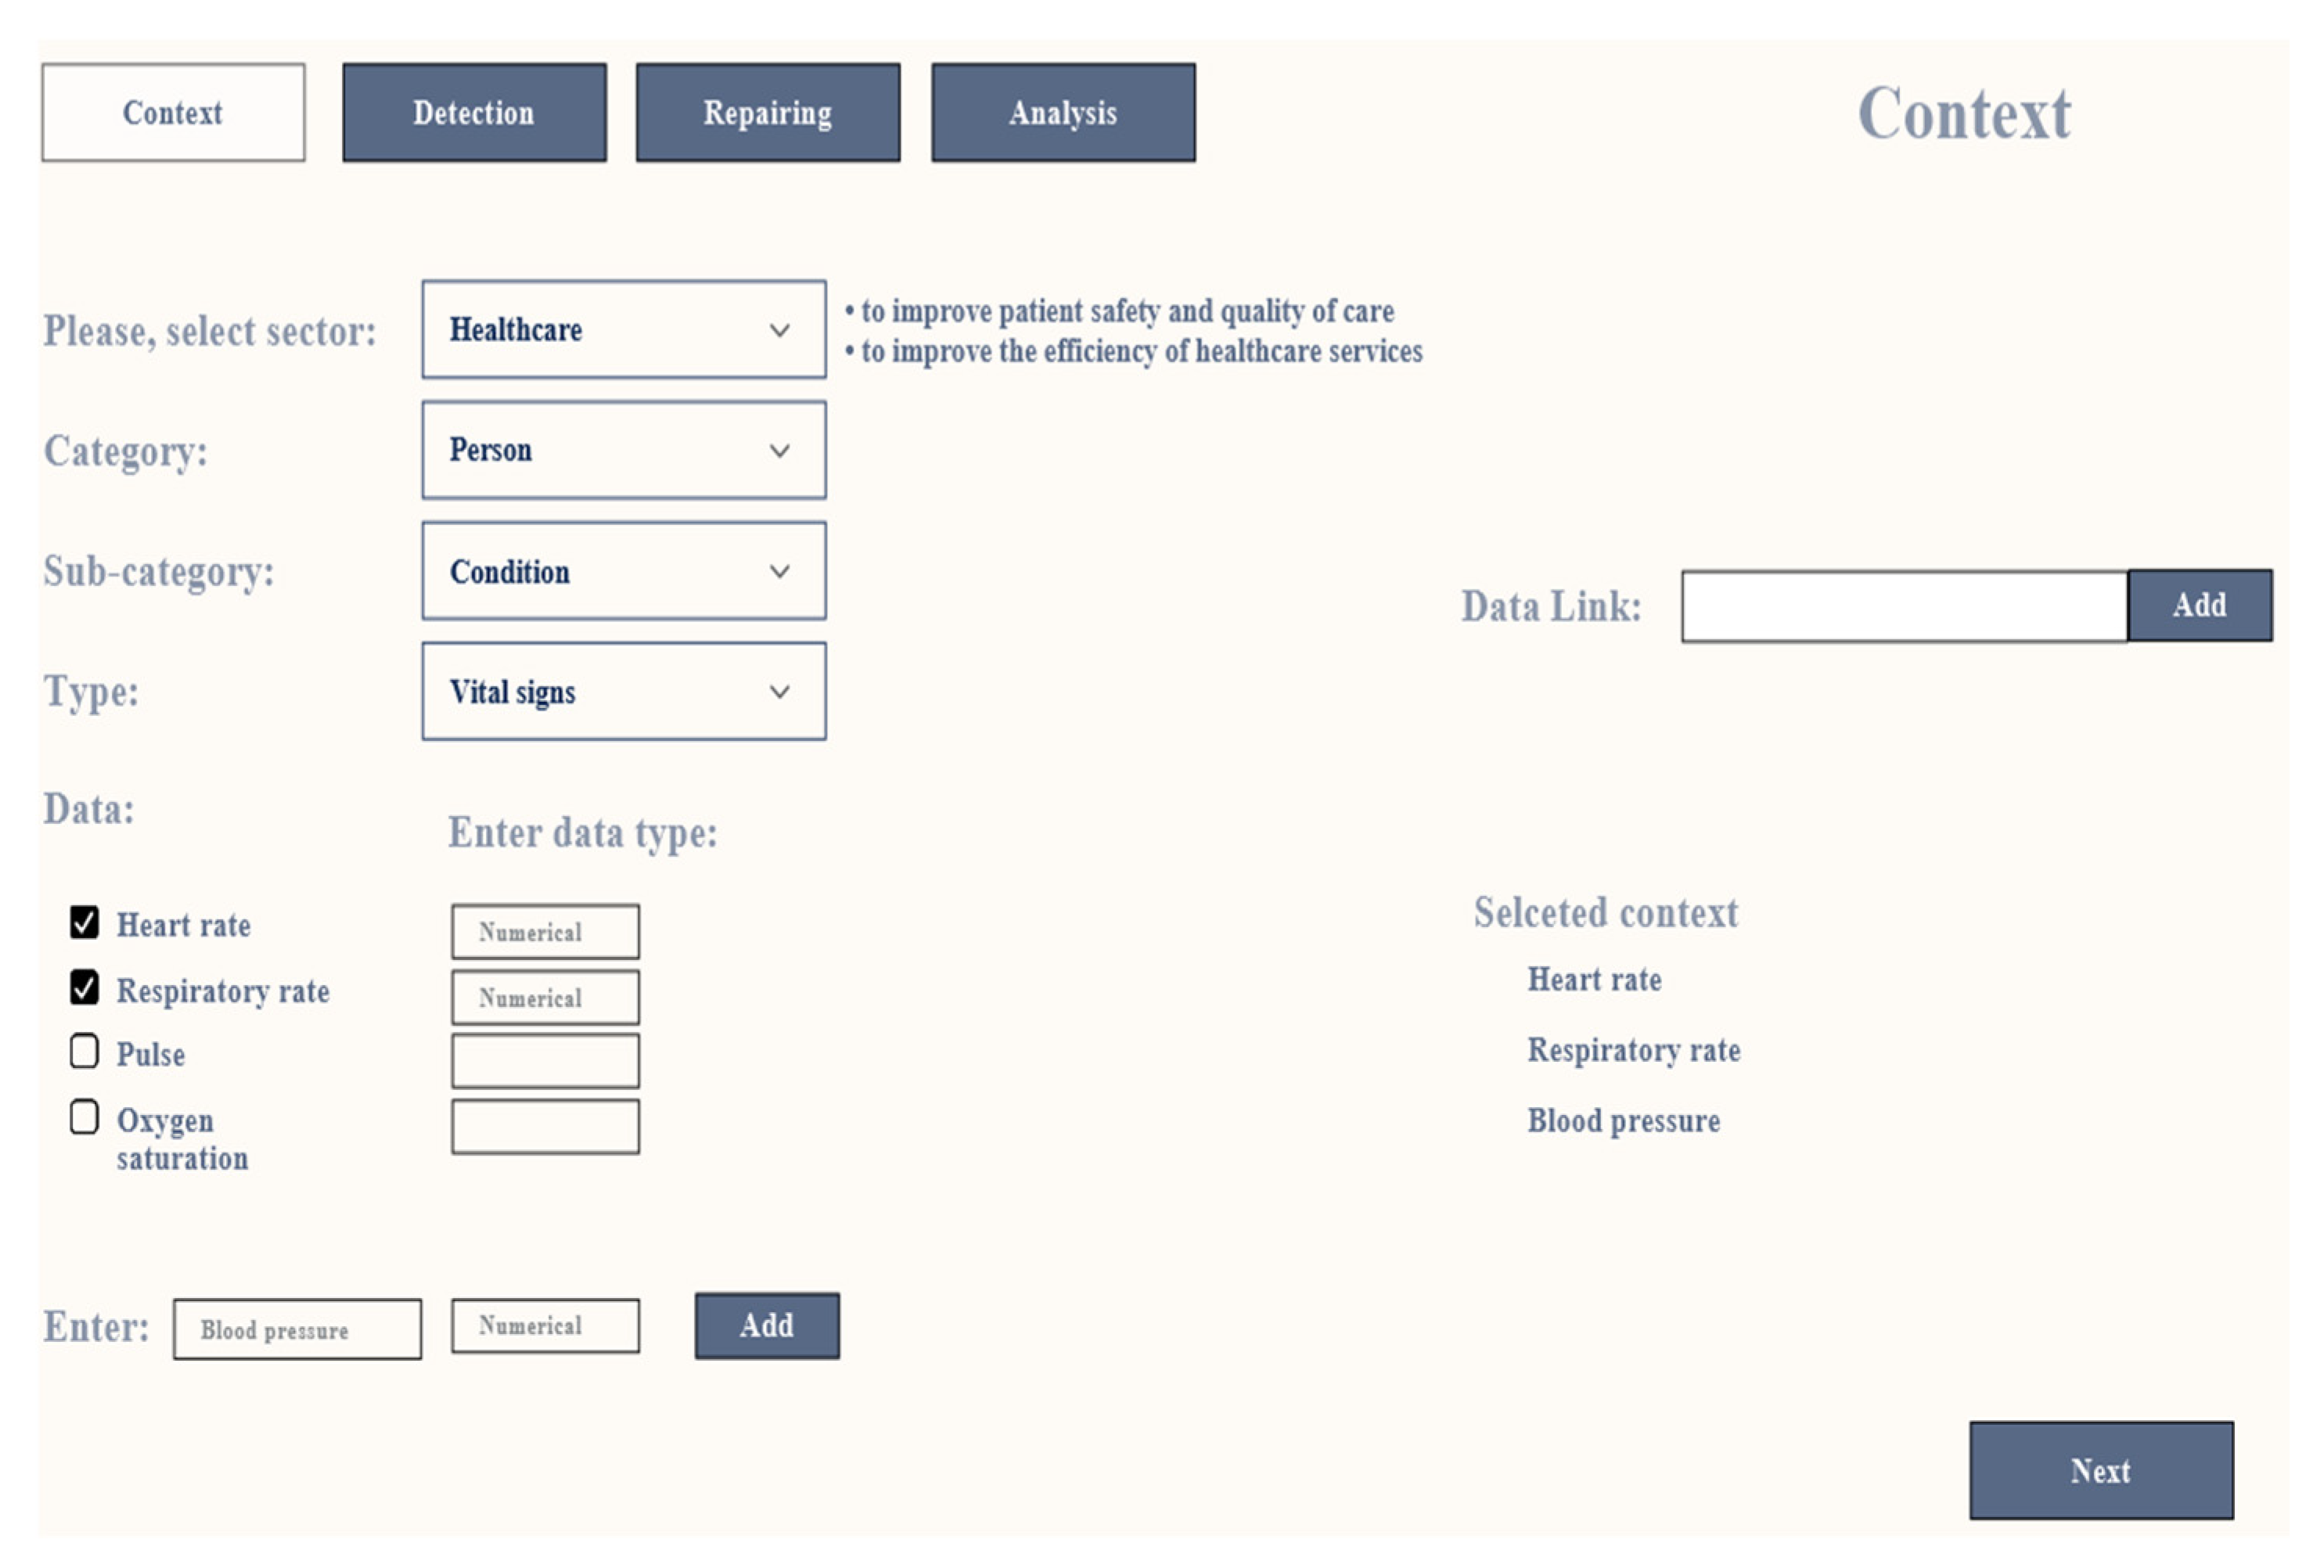
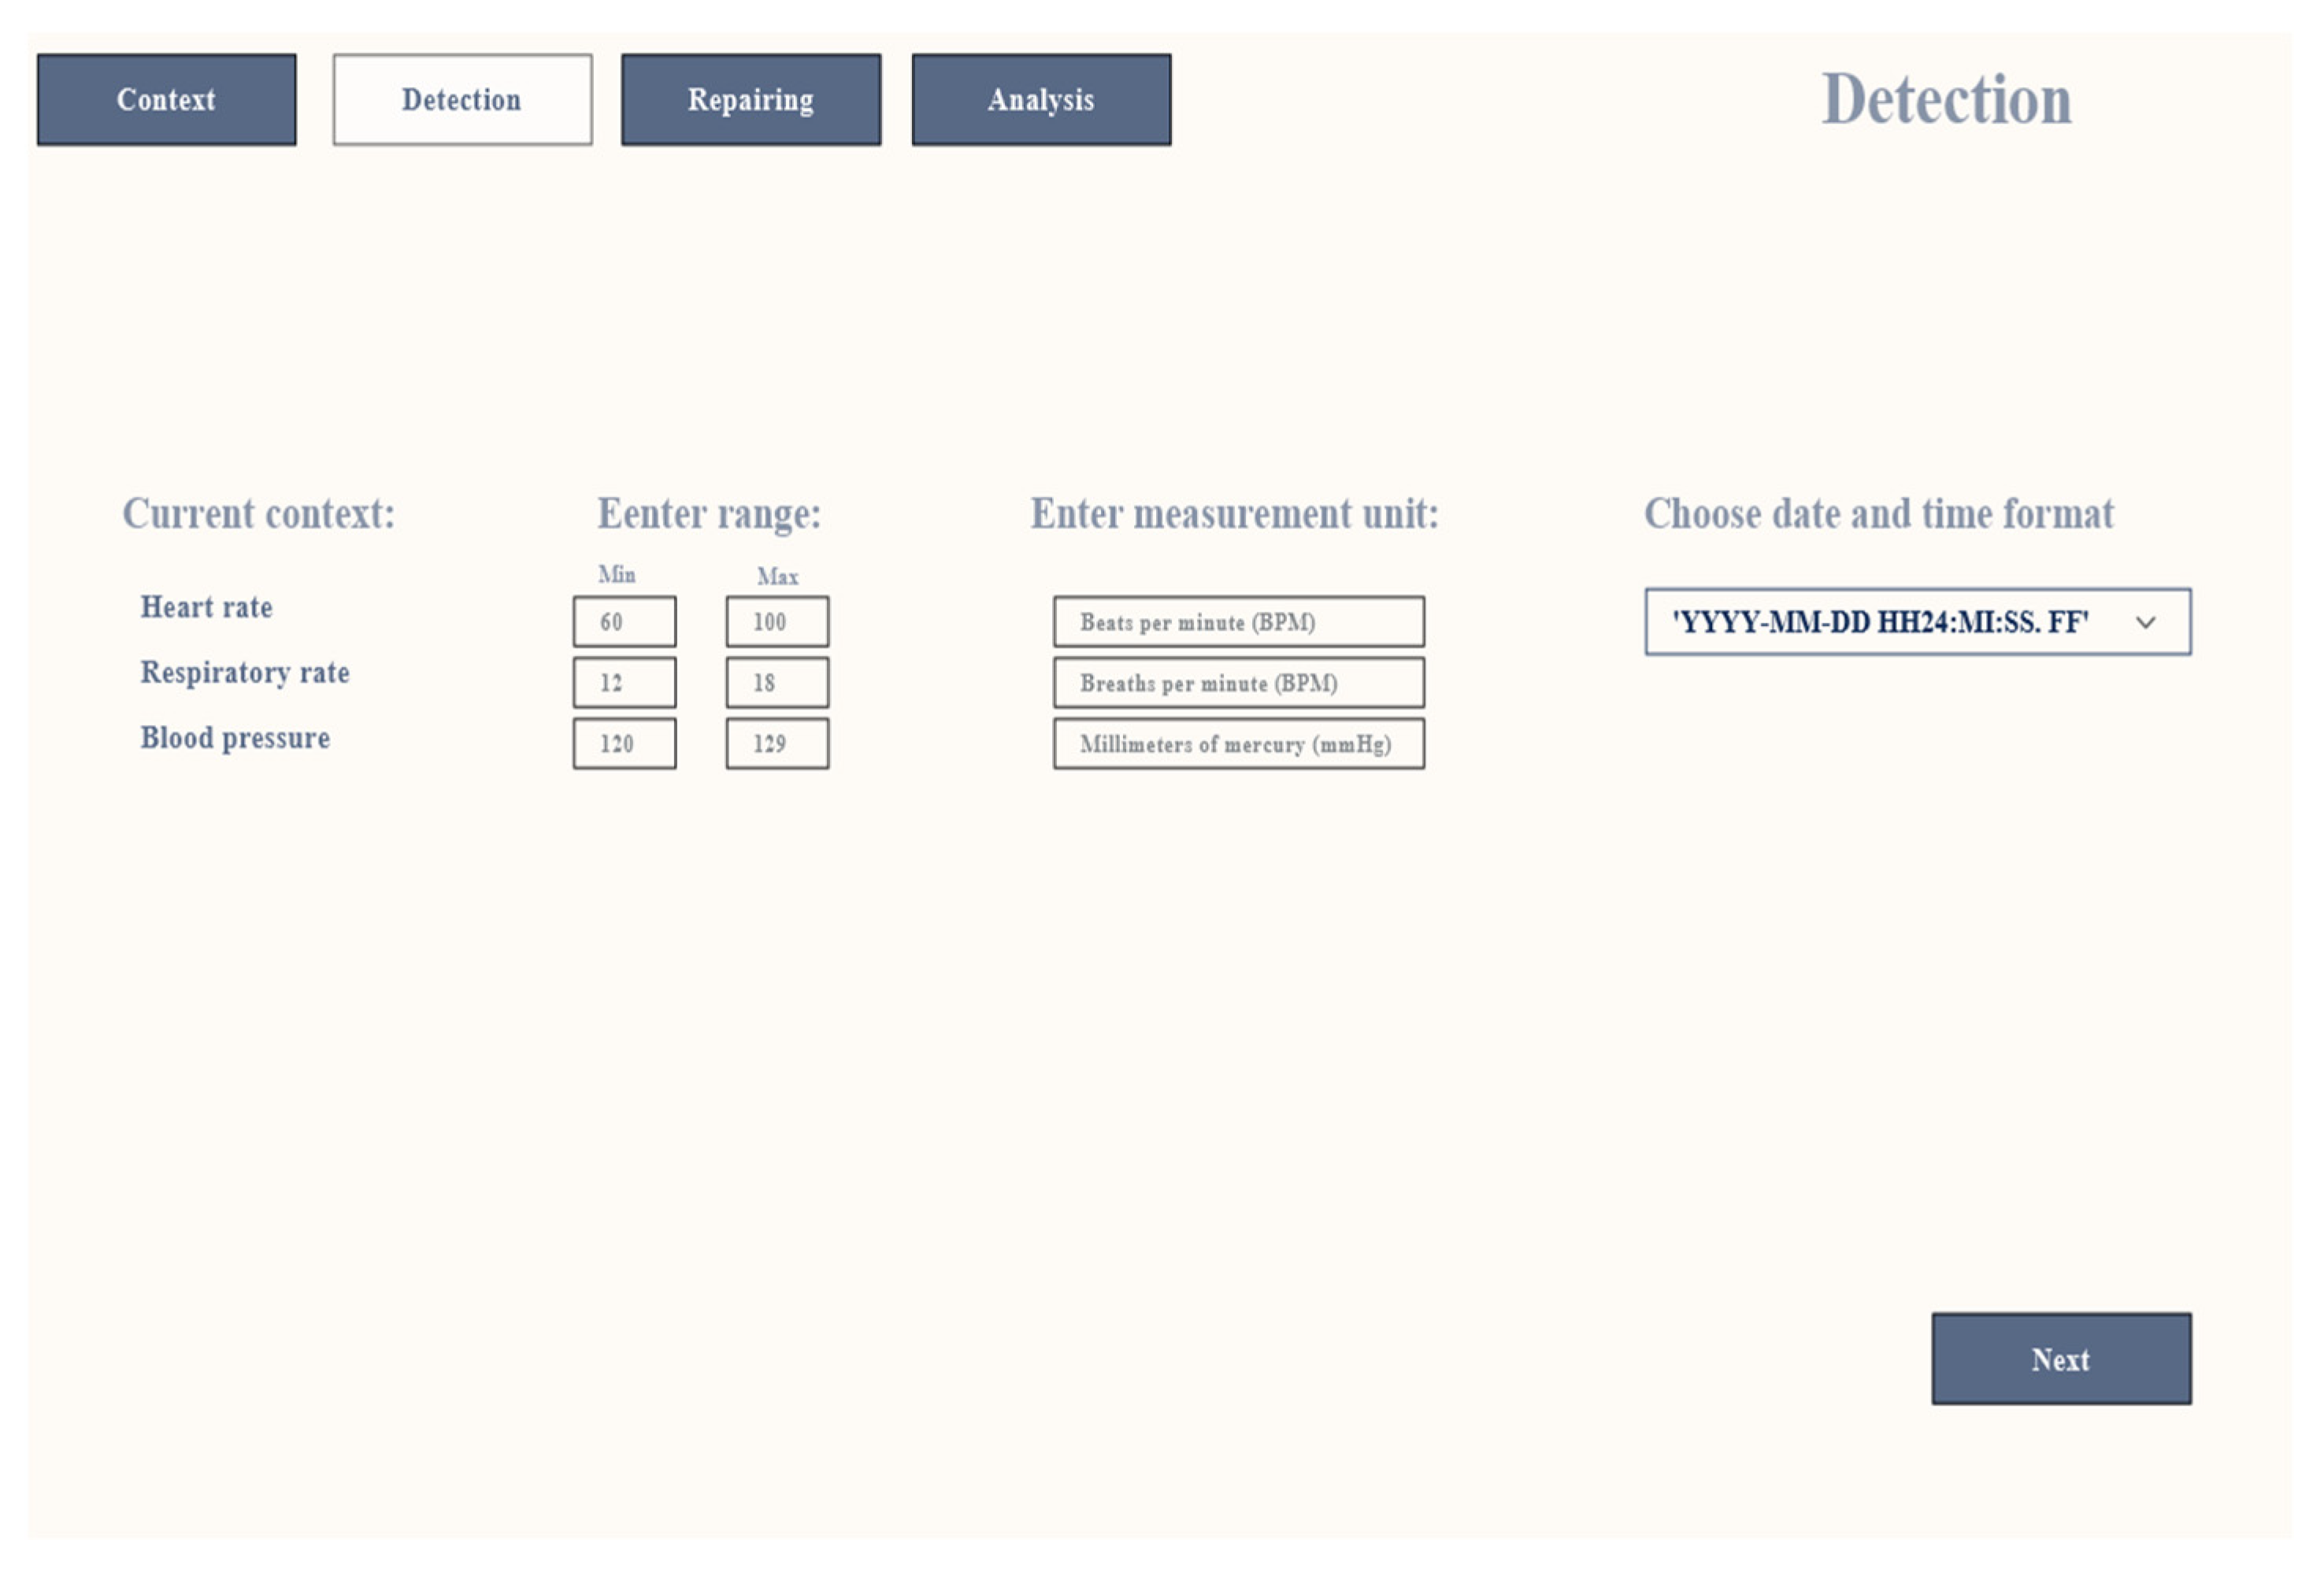
This section presents a prototype to examine the concept of our proposed framework. The model is implemented as a web interface as shown in Figure 7, Figure 8, Figure 9, Figure 10 and Figure 11. A detailed explanation of the prototype is discussed using a use-case scenario in the following section.
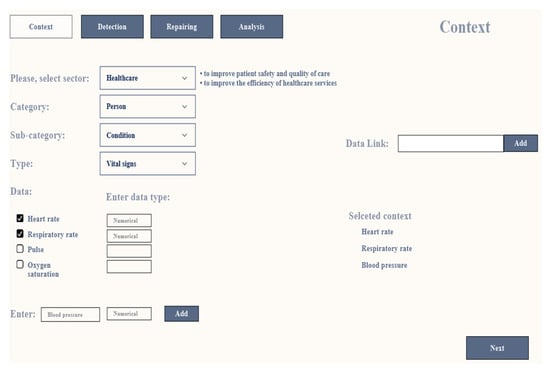
Figure 7.
Context Screen.
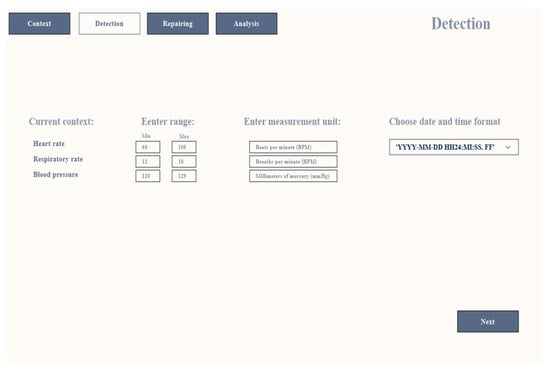
Figure 8.
Detection Screen.
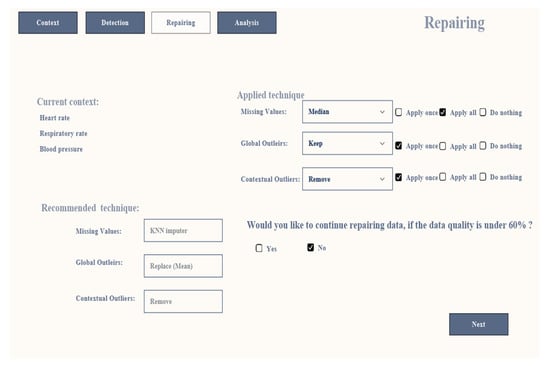
Figure 9.
Repairing Screen.
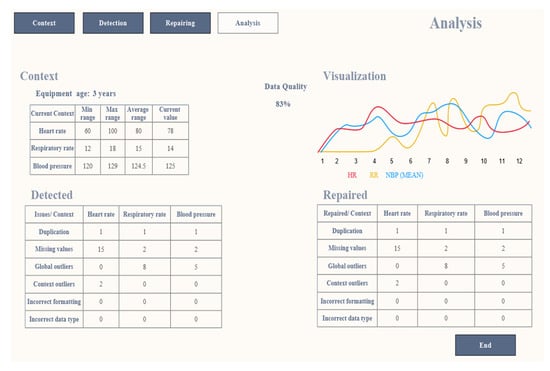
Figure 10.
Analysis Screen.
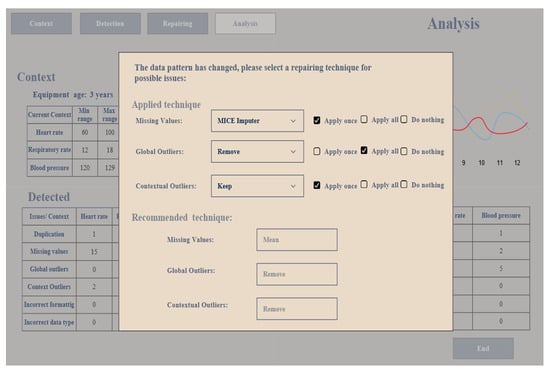
Figure 11.
A popup window on the analysis screen if the pattern of the streaming data has changed.
4.1. Prototype
The prototype comprises four screens, namely the context screen, detection screen, repairing screen, and analysis screen, each having a different functionality and a menu bar to navigate between the screens. The context screen is used to select the context in the streaming data as it is linked to the context phase in the proposed framework, and the detection screen is utilized to determine some of the detection rules from the rules controller. The repairing screen is designed to present a repairing technique and a recommended technique for each selected technique. The repairing screen is connected to the repairing rule in the rules controller and the recommendation unit in the analysis phase. The analysis screen shows a summary of each screen and visualizes the result of the streaming data to the user. Further explanation of these screens follows.
In the context screen, the user identifies the context, starting with choosing the domain from the drop-down menu, either healthcare, industry, business, weather, or education. When the user selects the domain, a description of using the system in this domain automatically appears next to the domain field to help the user understand what kind of analysis the user can perform based on the selected scenario and the data type. The description appears based on the information stored in the database, and after selecting the domain, the user selects a category from the category field, regardless whether the category is a person, place, environment, equipment, or services. After selecting the category, the user chooses one of the sub-categories that appear in the drop-down menu, which is a subset of the category, as shown in Table 1. The sub-category automatically changes if the category changes.
Next, the user chooses the sort of data from the sub-categories, then the type. Also, the sort of data is changed based on the sub-categories as well as the type. When the type of data is selected, the user sees the available variables as a list and the user selects the variables required to build the context. If the required variable does not appear in the list, the user adds the variable manually by typing the name and the type of data and presses the add button to add it to the context. The aforementioned fields are connected to the data ontology in the context phase. When the context is built, the user provides the data link where the data can be collected. Then, the user checks the context in the selected context section and when everything is ready, the user presses the next button to move to the detection screen. The context selected from the context screen is passed to the context selection unit in the context phase to match the user’s input with the context in the stream data and the matched context is considered as the selected context. It is then passed to the detection unit in the preprocessing phase. Figure 7 illustrates the context screen.
In the detection screen, the user sees the selected context from the context screen as the current context. Then the user determines the range of the data if the data type is numerical, which helps detect the outliers. The reason why the user defines the range of data values is that the range varies based on different factors, which is obvious to the user. The user needs to set the measurement unit of the context that has been selected to unify the measurement as it assists in detecting errors in the streaming data if they occur. Finally, the user defines the date and time format that is followed during the detection process if a different format appears. This screen is connected to the detection rules unit in the rules controller. Other issues, such as duplication and missing values, do not need any setup from the user side because there is only one approach to detect these issues. When the detection rules are finalized, the user clicks the next button to move to the repairing screen. The detection rules are sent to the detection unit in the preprocessing phase that is set by the user and other default detection rules (i.e., duplication, missing value issues). Figure 8 shows the detection screen.
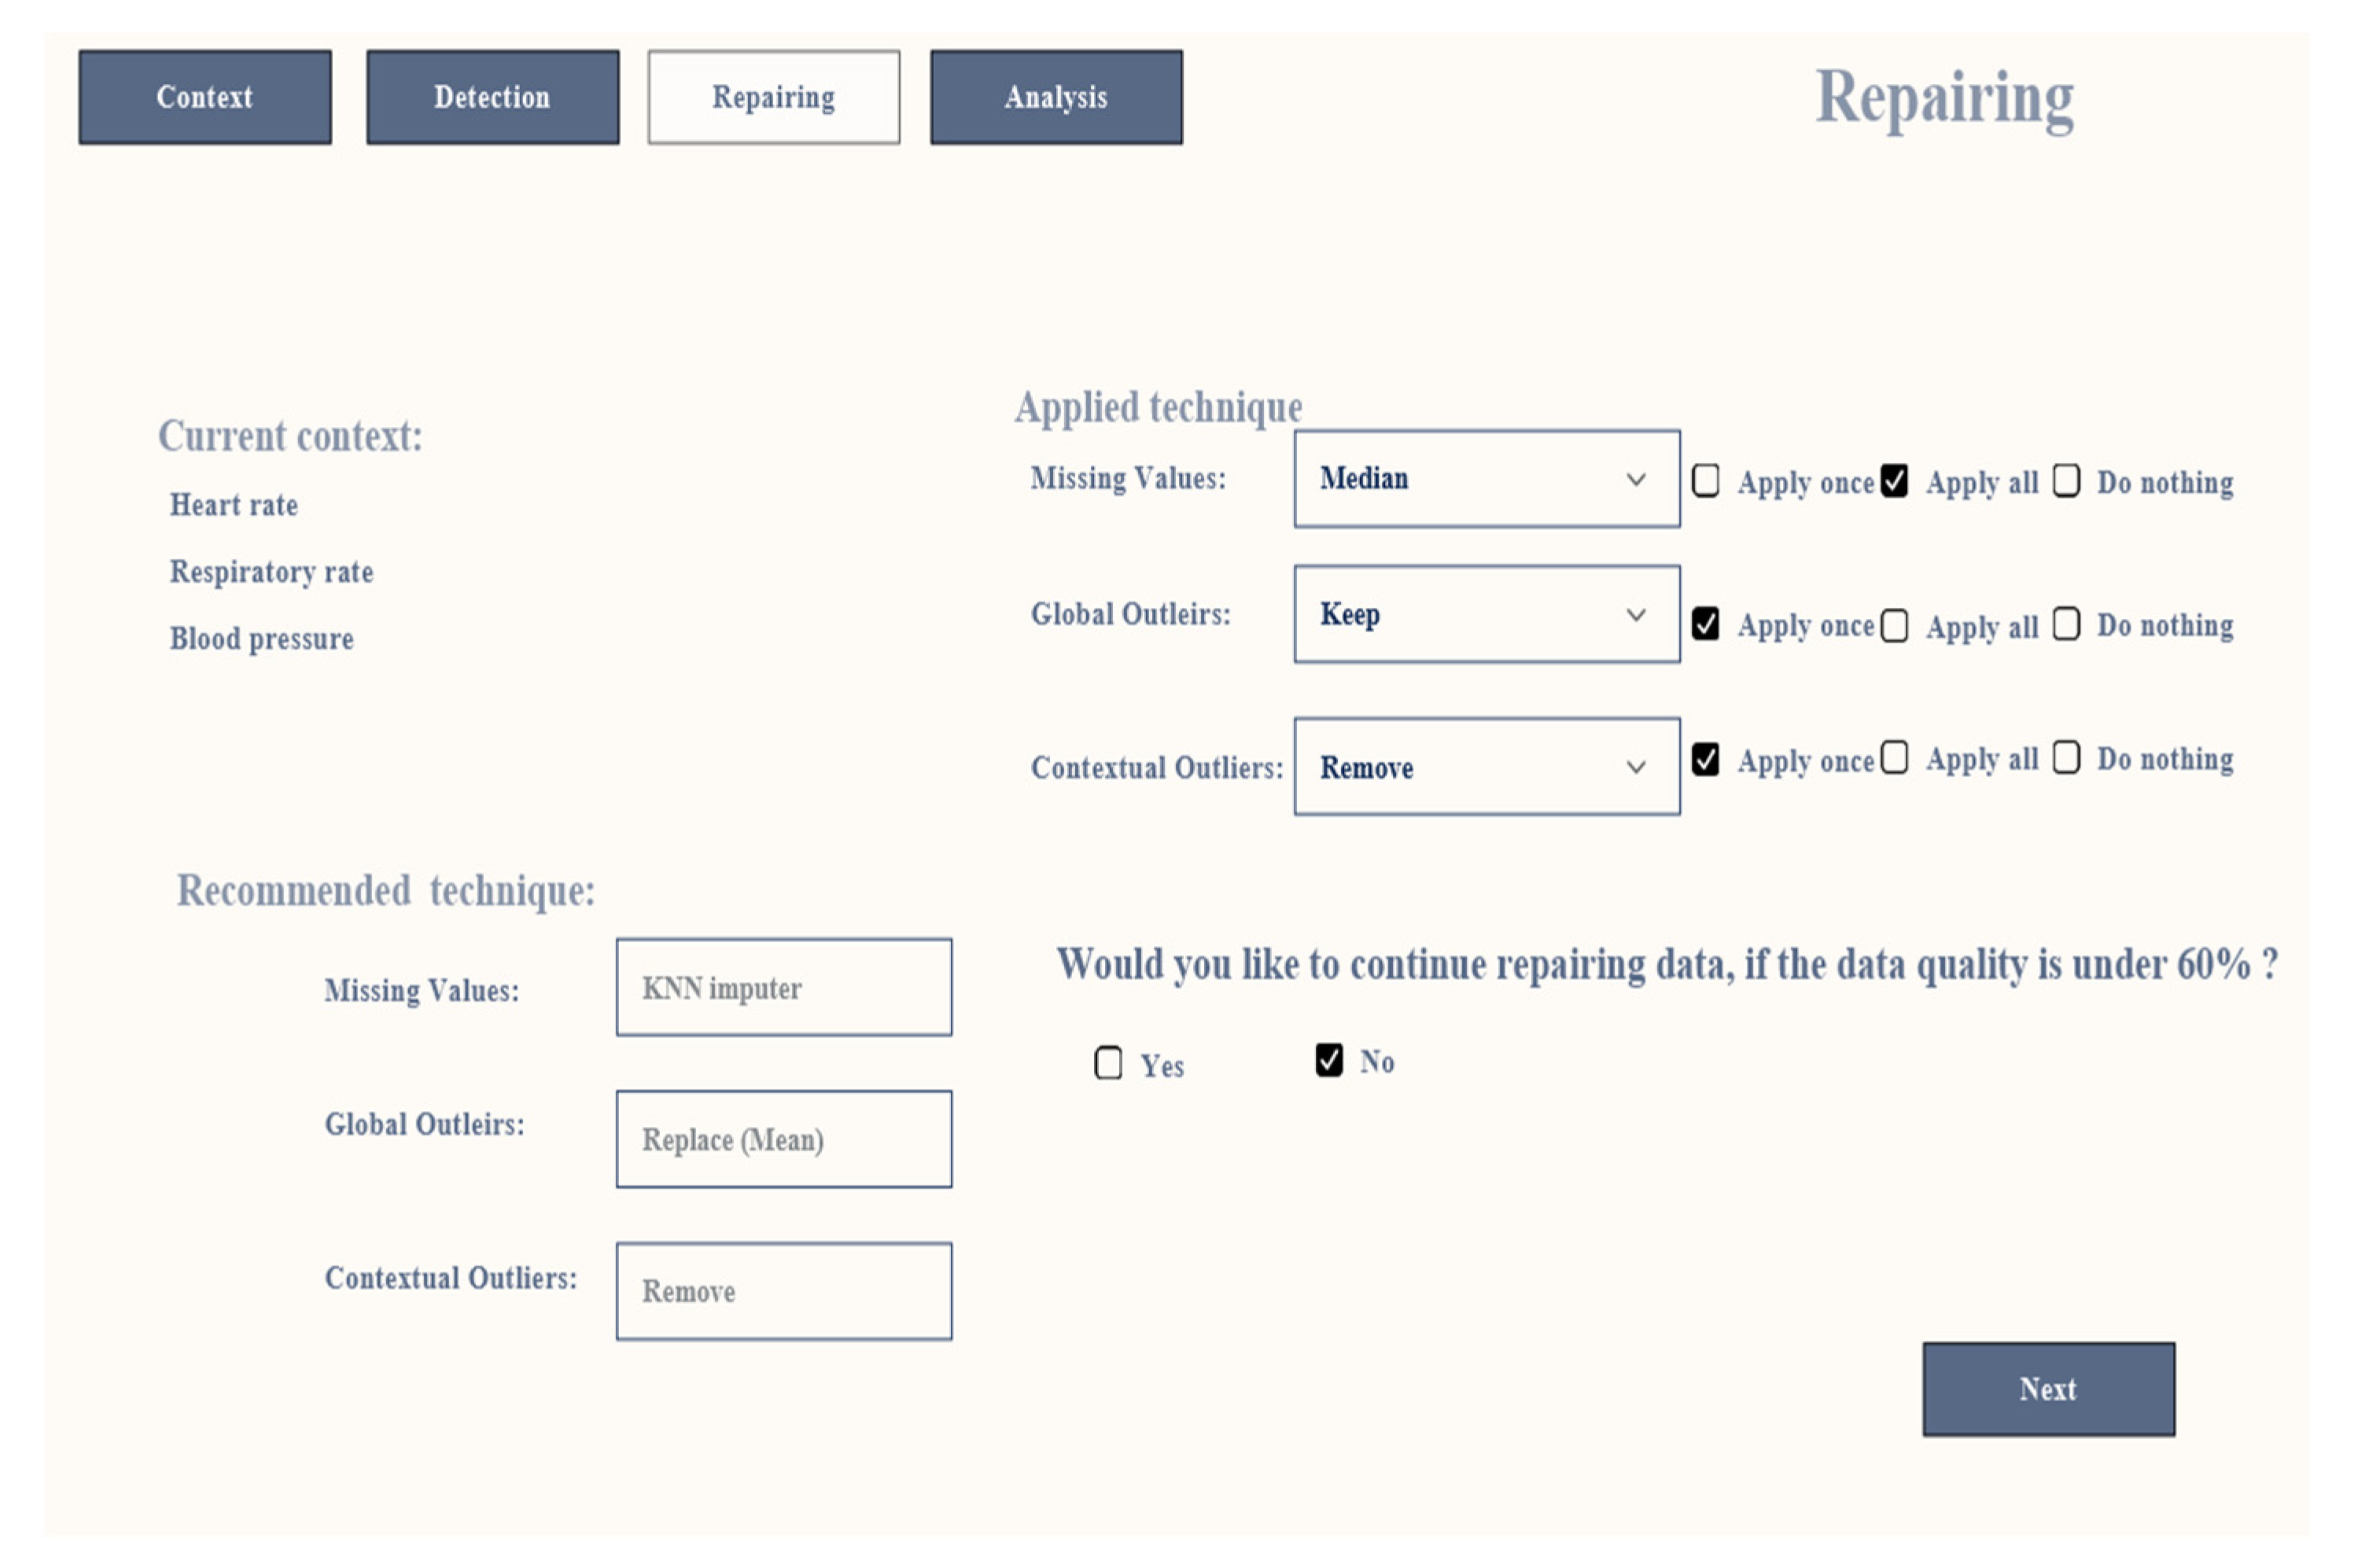
In the repairing screen, the user sees the context selected from the context screen as the current context. The user has multiple technique options to tackle the issues that appear in the selected context in the streaming data, as there are various methods to deal with these issues. So, the user is allowed to apply any technique in the real-time data stream. For instance, there are several drop-down lists, and each drop-down list is allocated to a particular issue such as a missing value, global outlier, or context outlier. Each list contains multiple cleaning techniques that can be applied to tackle these issues in the real-time stream. When the user chooses a technique to handle missing values, the recommendation unit in the analysis phase recommends a technique from the list to the user that can help to improve data quality in the real-time data stream.
It is noteworthy that the detection screen displays issues that need to be a specified value from the user side, such as the range of outliers or date and time format, which will help in the detection process, whereas issues like missing values or duplicated data, which do not need a specified value from the user to be detected, will not appear on the detection screen, as these issues will be detected by the system. However, in the repairing screen, there is only one method to fix particular issues, such as the date format or removing duplicated data as this will be done by the system, whereas there are several methods to fix issues such as missing values like imputing, ignoring, or removing missing values and handling outliers, so the user has to select a technique to resolve these issues. After selecting a technique, the user needs to choose whether to apply this technique once the problems are detected, choose the Apply all option to apply the technique to all issues that appear in the data stream as long as the data pattern does not change, or choose to do nothing, so the detected issue will be ignored and no repair technique will be applied.
Since streaming data are affected by several issues that reduce data quality, the system asks the user if it should continue repairing the streaming data when the data quality falls below 60% because cleaning data with a data quality of 50% will adversely affect the outcome of the data analysis. For example, the data in the sliding window contain 50% missing values, so imputing missing values will lead to unreliable results because there will be a bias in the data. Removing these missing values will lead to the loss of valuable information. Therefore, the user needs to decide whether to remove, keep, or ignore the missing values based on the current situation because these missing values occur due to defects in devices or for other reasons that are obvious to the user.
The user sets the repairing techniques to fix any issues that appear in the context and presses the next button to navigate to the analysis screen. The repairing unit in the preprocessing phase receives these repair rules in two ways. If the user applies the recommendation technique, the repairing techniques are sent from the recommendation unit in the analysis phase and the repairing rules in the rules controller are updated. If the user chooses to apply a different technique to what the system recommends, the repairing rules are sent from the repairing rules to the repairing unit in the preprocessing phase. Figure 9 presents the repairing screen.
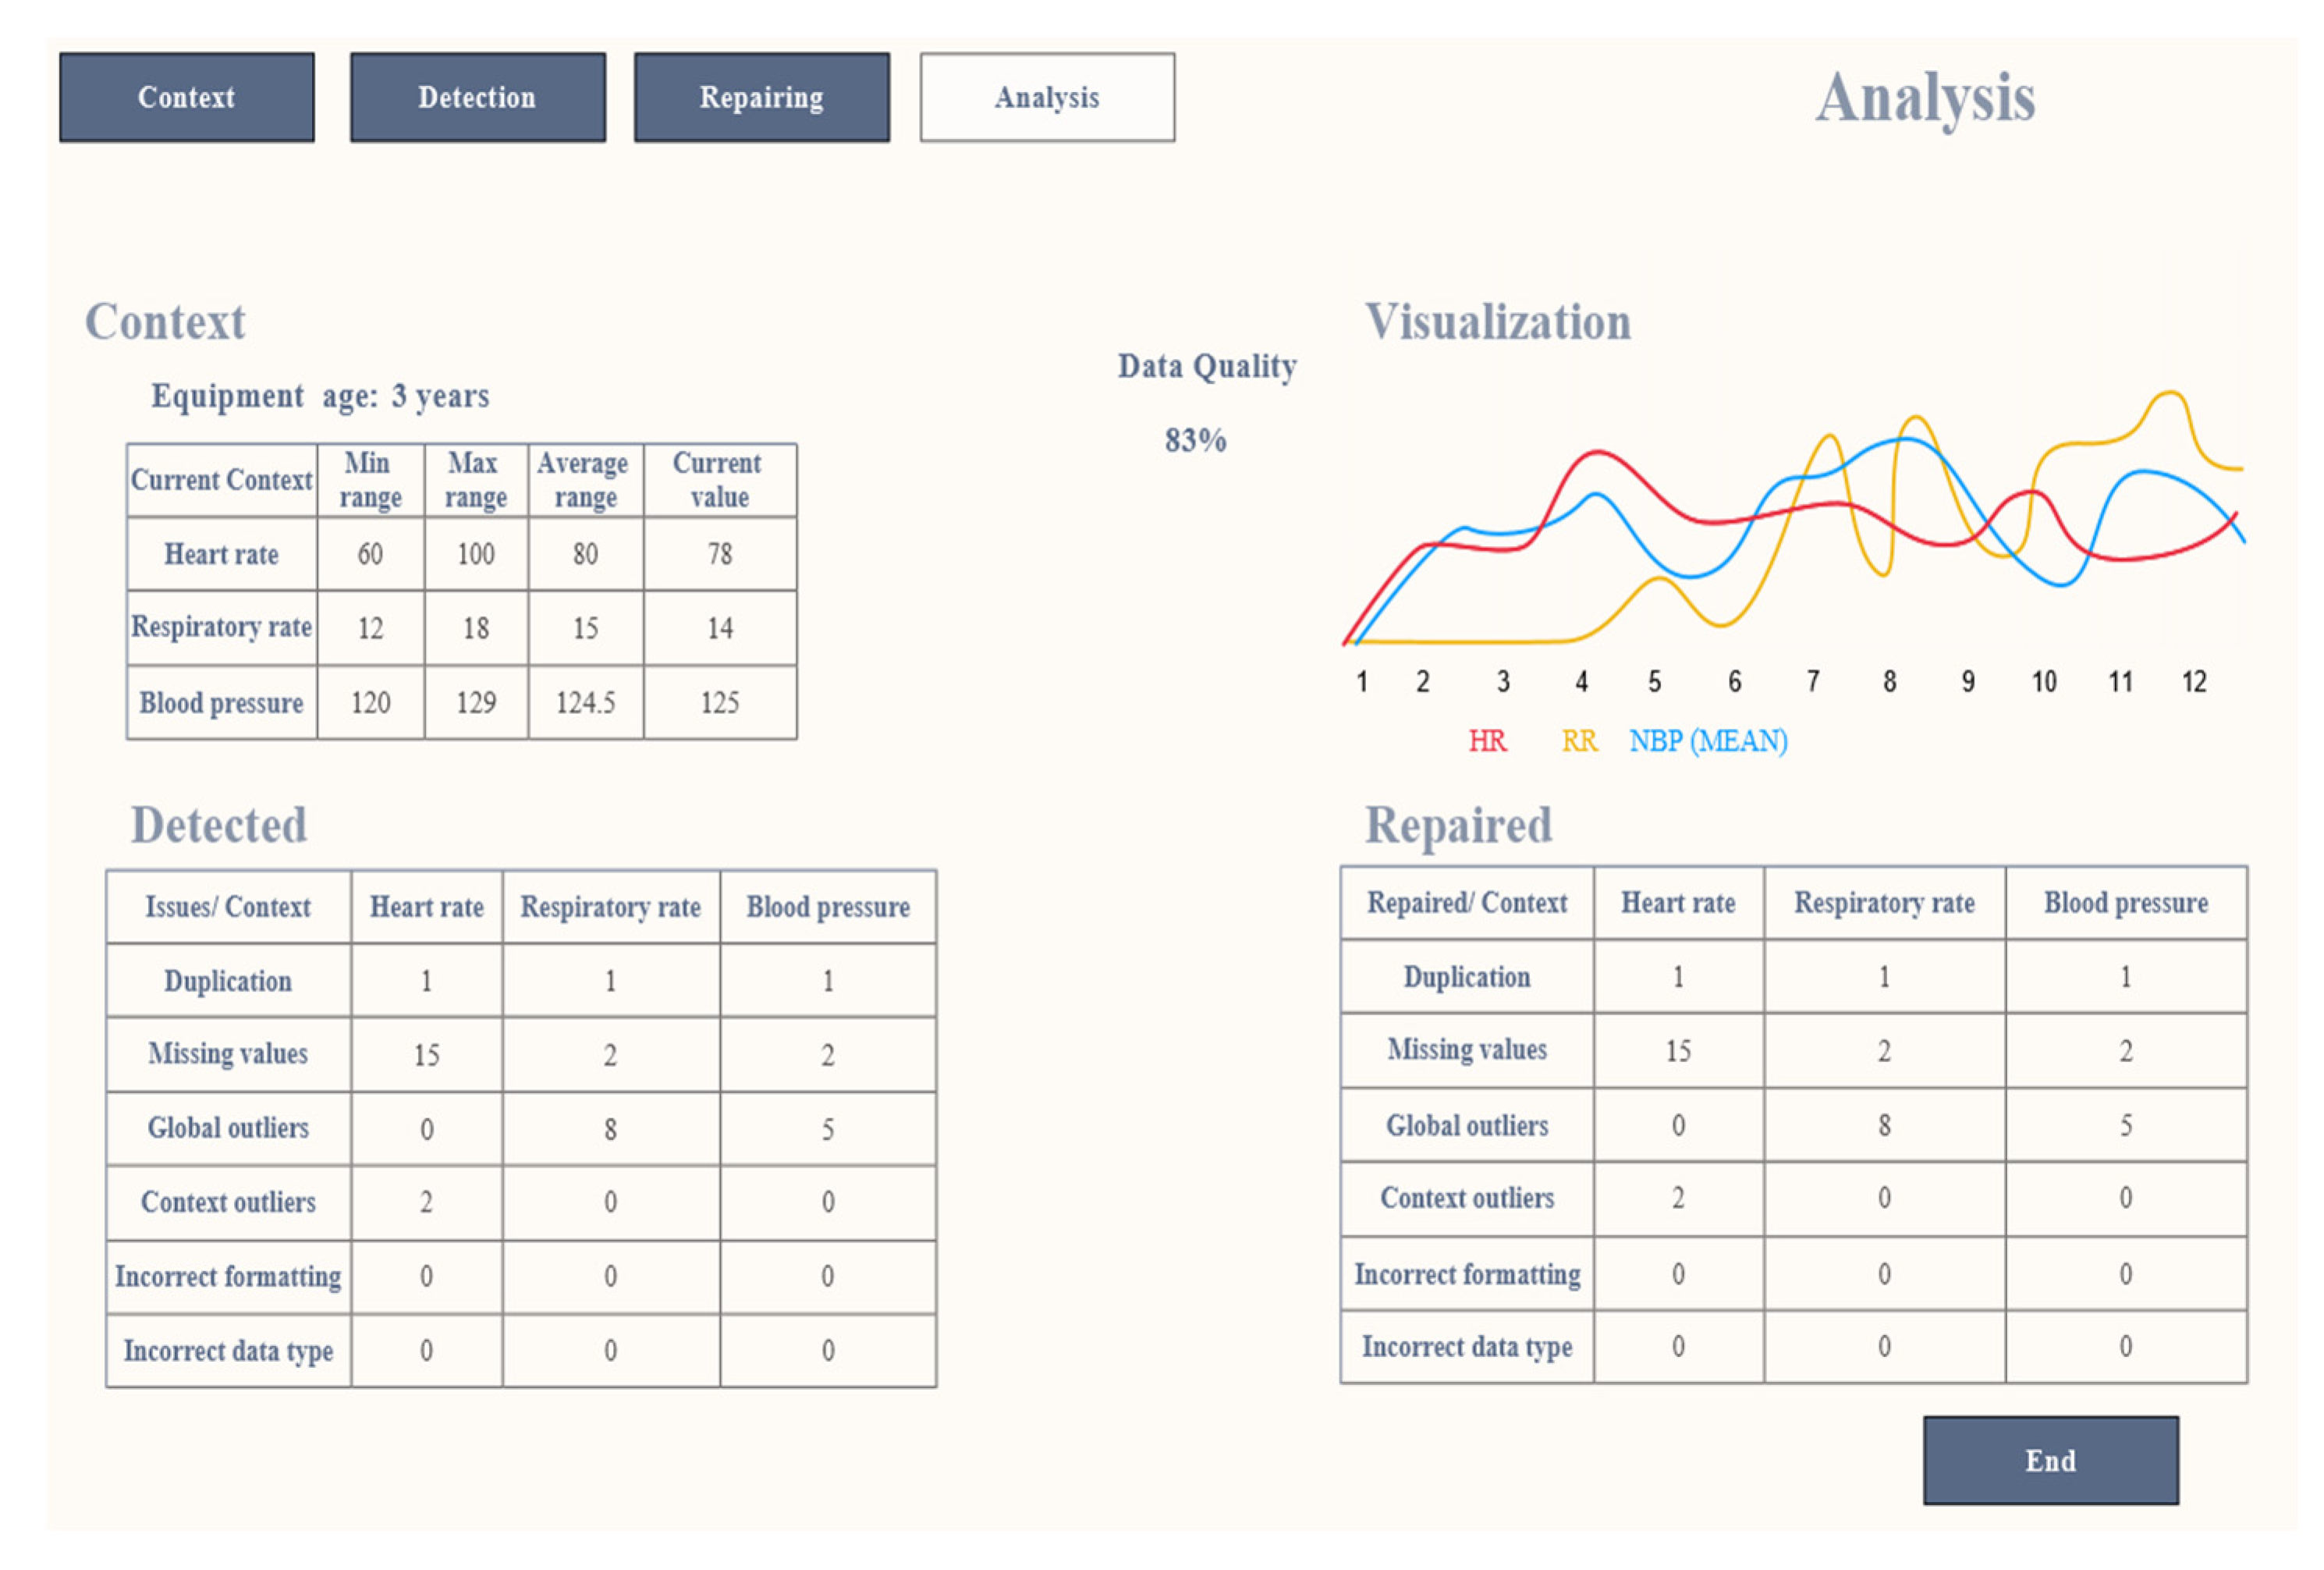
In the analysis screen, the user sees four subsections, namely summary of context, summary of data detection, summary of data repairing, and visualization. The context area is in the upper left screen. The user sees the summary of the current context that was selected from the context screen and sees the normal range of the selected context, average range, current value, and the equipment age. The equipment’s age is considered in the data quality. Also, the user sees if a new context is added or removed from the context area by the context generative unit in the context phase. These amendments are sent from the context rule to the context generative unit and are updated by the rules manager in the rules controller. On the lower left of the analysis screen is the detection area, which presents a statistical table as a summary of the number of detected issues in the streaming data. The detection table is linked to the detection unit in the preprocessing phase.
The repair area in the lower right of the screen shows a summary table of the number of repaired issues based on the selected cleaning techniques from the repair screen. The repair table is connected to the repair unit in the preprocessing phase. In the visualization area (top right), the results are visualized to the user based on the result of the descriptive analysis unit in the analysis phase. The data quality percentage is displayed to the user next to the visualization chart. We initially propose the following formula to measure the data quality in the stream data:
The equation is used in the detection unit and when the data come to the analysis stage. Then we take the average of these measurements as follows:
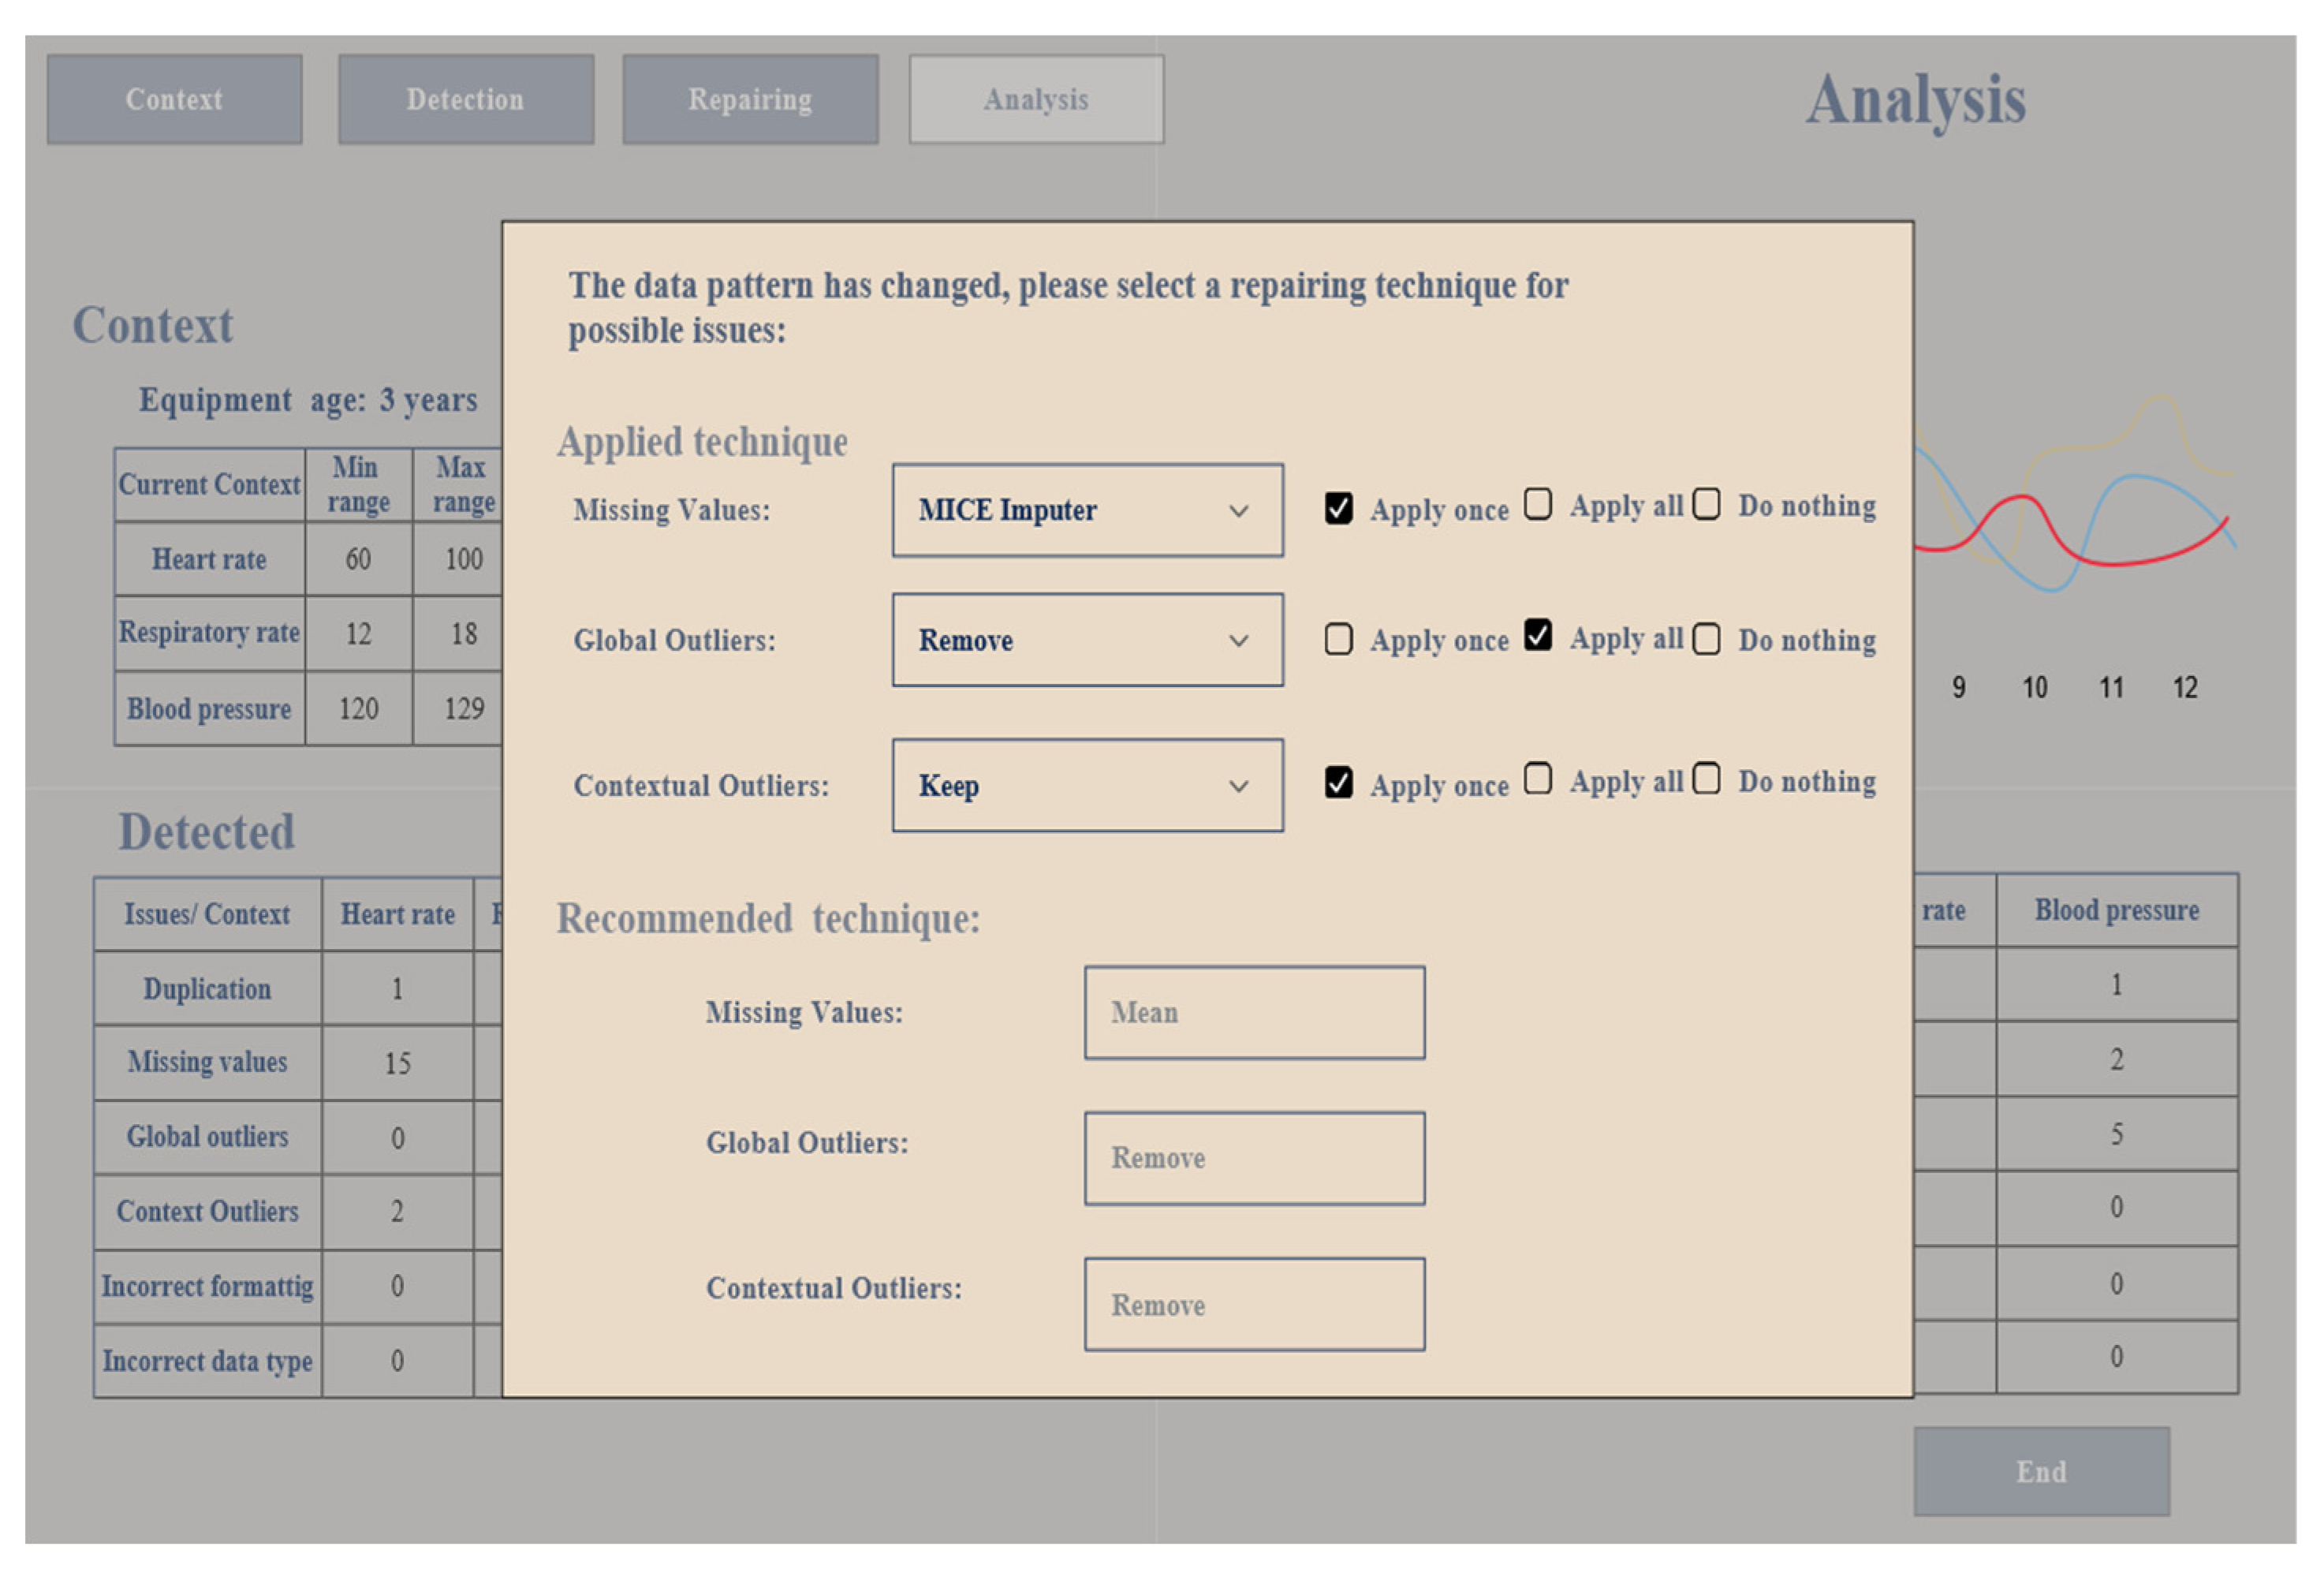
The reason for using average data quality is that repairing data is based on assumptions, especially imputing missing values or replacing outliers. Therefore, the data quality percentage and the charts can assist the user in making better decisions in real time. If the data pattern in the stream data has changed, a popup window appears on the analysis screen that asks the user to select the repair techniques based on the current situation. Finally, the user clicks on a button to end the session. Figure 10 shows the analysis screen and Figure 11 shows the popup window.
It is noteworthy that there is a default setting for each section on every screen. If the user has left some section of the screen empty, this setting is applied to these sections. For example, if the user does not specify the date and time format in the detection screen, there is a default date and time format that is applied to the date and time format section, and so for the other screens.
4.2. Use Case
We use a vital signs dataset that was collected at the Royal Adelaide Hospital by [22], which contains a wide range of patient vital signs monitoring data. The dataset parameter description is given in [23].
Let us say an expert wants to see a patient’s vital signs because some patients have reactions to particular types of drugs that change heart rate, breathing, and blood pressure. Thus, the expert wants to monitor these vital signs so they can react to any changes in these vital signs, if they occur.
The expert starts by selecting healthcare as a domain from the context screen. Improving patient safety, healthcare services, and quality of care are the benefits that the expert expects when selecting the healthcare domain as a sector. The expert continues selecting a person as a category, then selects a condition as a sub-category of the person, and finally, vital signs as a type of the condition. Then, the vital signs automatically appear on the screen and the expert selects the heart rate (HR), the mean blood pressure (NBP (Mean)), and the breathing rate (RR) to be monitored and provides the data link because sensors are used to collect data during surgery. When the context is ready and the data link is provided, the expert presses the next button to move to the next screen, as shown in Figure 7.
In the detection screen, the expert determines the upper limit and lower limit of the selected vital signs considering the patient’s age, gender, and medical history. The expert assigns 60 as the lower limit and 100 as the upper limit for the HR, 12 as the lower limit 18 as the upper limit for the RR, and 120 as the minimum limit and 129 as the maximum limit for the NBP (Mean). These ranges are normal for healthy adults (the patient is an adult and has not previously suffered from any medical issues). After the upper and lower limits have been assigned to the vital signs, the expert defines the measurement units for the selected context as follows: beats per minute for the HR, breaths per minute for the RR, and millimeters of mercury (mmHg) for the NBP(Mean). The expert chooses the format of date and time to be as follows ‘YYYY:MM: DD HH24:MI: SS.FF’. If the values of the selected context exceed the determined limit, they are considered an outlier. Also, the data measurement units are standardized based on the user selection so, if the data appears with different measurement units, it is fixed. When the detection rules are set, as presented in Figure 8, the expert moves to the repairing screen.
In the repairing screen, the expert chooses a proper technique to deal with the issues in the streaming data. For the missing values, the expert assigns a median method to replace the missing values with the median and chooses this technique to be applied to all missing values as long as the data pattern has not changed. For the global outliers, the expert chooses to keep the outlier and applies this technique only once when the global outlier is detected. For the contextual outlier, the expert decides to remove any detecting contextual outlier and implement the removing approach once. When the technique has been allocated to the data issue, the expert sees the recommended technique for the same issue and the expert prefers not to apply this technique. The expert prefers not to repair the streaming data if the data quality is under 60%, as depicted in Figure 9. Since the context, detection techniques, and repair techniques have been defined, the expert moves to the analysis screen by pressing the next button and sees the visualization of the selected context in the real-time data stream.
The expert monitors the analysis screen and the streaming data starts to arrive from different sources to the context phase in the proposed framework, and it is ingested by the data ingestion unit in the context phase. Then, the ingested data are passed to the taxonomy unit in the context phase. In the taxonomy unit, the stream data are classified into five categories, namely person, equipment, environment, place, and services; each category has types, as presented in Table 3. After categorizing the streaming data, they are mapped to the data ontology in the context selection unit, and the expert input in the context screen is also passed to the context selection unit. In the context selection unit, the streaming data are already categorized and mapped to the data ontology. The patient’s vital signs are selected based on the expert input from the context screen, then the selected context is sent to the preprocessing phase to check if the selected context contains any issues such as missing data, outliers, wrong unit measurements, etc.
In the preprocessing phase, the detection unit checks the selected context when it comes to the preprocessing phase based on the rules that have been received from the detection rules unit in the rules controller. When the selected context comes to the detection unit, the context values are as follows: the NBP (Mean) is 87 mmHg, the RR is 0 breaths per minute at the beginning and it increases when the breathing device is used, and the HR is 80 beats per minute for patient’s vital signs. If the selected context is in the normal range and does not have any issues, it is considered to be clean data and is passed to the analysis phase; otherwise, it is considered to be uncleaned data and is sent to the repairing unit.
The analysis screen presents to the expert a summary table of the currently selected context, a summary of the detected issues and repairing issues, and the chart with the data quality percentage of the stream data. The detection unit captures issues regarding the values of the HR, RR, and NBP (Mean) and the number of the detected issues for each issue is presented in the detection table to the expert. These issues pass to the repair unit and the selected techniques are applied to repair these issues. The repairing table shows the number of repaired data for each issue, as shown in Figure 10. The expert noted from the detection table that the selected context contains missing values, and the RR has eight global outliers because the breathing device was not used at the beginning (the RR values were 0 breaths per minute and the lower limit for RR was 12 breaths per minute); however, the breathing rate is now in the normal range, so the expert ignores the outliers in the RR. The expert sees any detection issues that appear in the detected table. The repair table shows the number of repaired issues to the expert, so the expert has insight into the functionality of the system in terms of detecting issues and repairing the issues in the streaming data based on the selected cleaning techniques.
The data continue to arrive and the system continues to ensure that the incoming data are cleaned. The system repairs the streaming data if they have issues in improving data quality in a real-time stream. Also, the system visualizes the result and assesses the data quality based on our proposed metrics. With the high-quality data that the system provides, difficult decisions can be made with confidence.
5. Discussion
This section discusses our comprehensive proposed framework, which is designed to improve data quality in streaming data compared to previous works in terms of context awareness, data preprocessing (data detection and data repair), and framework availability.
In terms of using context to improve data quality in streaming data, our proposed framework considers context to detect several issues in real-time data streams, such as duplicated data, missing values, data errors, outliers, contextual outliers, etc. Different to our framework, Refs. [10,11] utilized context to detect contextual outliers in the streaming data, whereas our framework ensures context is not limited to detecting contextual outliers but is able to detect several issues in the data stream.
In the data detection stage of our proposed framework, we consider data detection and data repairing in the data preprocessing phase, and when the issue is detected, it is repaired. Several issues, such as global outliers, contextual outliers, missing values, duplication, inconsistent data, and violation are detected and repaired in our proposed framework. Different to our framework, several researchers, such as [8,12,14], focused on detecting global outliers only without the data repairing, while other works, such as [3,9,16], concentrated on data repairing to assist in imputing the missing values. Only [17] combined the detection and repairing process by detecting the global outliers and imputing the missing values.
Our framework is designed to clean streaming data using context, data analysis, and data quality assessment, whereas it is missing in the framework in [6]. In our framework, the user has more options and can use different techniques to deal with the detection and repairing issues in the streaming data, so the technique that is assigned by the user will change when new data arrive due to situational change, and thus the recommendation technique will change as well. Different to our framework, [7] does not include any recommendations for cleaning methods, nor does it consider context during data preprocessing. Also, the data cleaning process is conducted without a user’s intervention, and it was not conducted in the streaming data. Similar to our framework, [8,9] take into consideration cleaning stream data in their framework. However, [8] focuses on detected issues in stream data, while [9] concentrates on repairing stream data. Our framework considers both side detecting and repairing issues in stream data. There are several data cleaning methods; however, the data quality assessment and context-awareness are missing are missing in the previous frameworks.
The proposed framework brings a positive effect to healthcare data management, since the data that contains errors, is inaccurate, incomplete, and/or duplicated can negatively affect critical healthcare decision on patient treatment. Applying the proposed framework helps to fix errors, remove duplicated data, and fill missing values, which increases the accuracy of patient records. Thus, the patient will receive proper treatment with an appropriate dose and high-quality healthcare.
The proposed framework is examined using a prototype, then we validate the prototype by using a use case study. Also, we provide a comparative analysis between the proposed framework and previous works and illustrate the existing gap and how the proposed framework fills this gap as shown in Table 4 whereas ✓ sign means included, and ✕ sign means not considered. While ----- sign indicates that there is no additional information to be mentioned.

Table 4.
The proposed framework compared to previous works.
6. Conclusions
This paper details the effect of low data quality on data analysis results, which leads to incorrect decisions. It also discusses how important it is to keep data clean so that better decisions can be made. Using an example, we demonstrated that cleaning streaming data results in various benefits to several domains, such as providing good healthcare and saving patients’ lives in the healthcare sector, detecting issues with machines at an early stage and reducing the cost of repairs in the industry domain, or increasing the accuracy of credit card fraud detection and preventing it in the banking sector. Also, we highlighted the challenges facing data preprocessing in streaming data. In the future, we will work with real equipment data.
To address these challenges and to benefit from data cleaning in streaming data, we proposed a comprehensive framework to improve data quality in streaming data. The proposed framework combined various techniques to provide a clear picture to the expert for better decision. Also, the proposed framework recommended a context and cleaning technique to the user based on the current situation and several aspects were considered in the proposed framework, such as context, data preprocessing, data analysis. The context was considered in the proposed framework to enhance the performance of data preprocessing in streaming data. In addition, the proposed framework was designed to detect and repair several data issues in streaming data, such as duplicated data, missing values, and outliers. The proposed framework analyzed and visualized high-quality streaming data for the user to make difficult decisions with confidence in real time or in near real time.
We also presented a prototype as proof of concept to demonstrate the effectiveness of our proposed framework. We validated the prototype using a healthcare use-case scenario to clarify the benefits of utilizing the proposed framework in cleaning streaming data and to demonstrate the full picture of the prototype functionalities. We discussed and evaluated the proposed framework by comparing it against previous works.
In future works, we will implement the context phase to select context in streaming data. Then, we will implement the data preprocessing phase to detect and repair issues in streaming data and will examine the impact of considering context in the data preprocessing performance and the data quality improvement in the streaming data. After this, we will complete the framework by implementing the analysis phase and calculating the data quality of the streaming data and we will also consider cleaning the data that comes from multiple sensors. We will also include AI techniques in the framework to reduce user intervention and automate the process of the proposed framework in adding or removing context from the selected context and switching between data preprocessing techniques (detection and repairing unit) based on data stream patterns to improve data quality. We will focus on cleaning the structured data format in the streaming data. When the proposed framework is fully implemented, we will extend the framework to include cleaning the semi-structured and unstructured data in the streaming data.
Nowadays, domains such as, but not limited to, business, health, and industry increasingly depend on digital data. The importance of data quality has seen enormous growth over time in these domains because using poor data quality will result in serious consequences. Thus, the framework will be a useful tool for improving data quality in streaming data to enable better decisions to be made and to benefit the domain as much as possible.
The environment between companies is highly competitive as they seek to increase their profits by gaining the trust of their current customers and attract new customers. Low-quality data in business will lead to faulty analysis, wrong decisions, increased operational costs, and decreased customer satisfaction, which may result in the loss of customers. Implementing the proposed framework will improve the company’s data quality and lead to an accurate analysis, better decisions, reduced operational costs, and increased customer satisfaction, which translates to attracting new customers and company profit growth.
Hospitals aim to provide high-quality care to patients and ensure their safety. Low-quality data will lead to misdiagnosis, inappropriate treatment plans, and dosage miscalculations that threaten patients’ safety and result in poor-quality care services. Using the proposed framework will ensure a proper diagnosis, an appropriate curing plan, and the right dose calculations by improving data quality, which results in an increase in patient safety and better care services.
Industry aims to increase productivity and reduce the cost of repairing machines. With poor-quality data and a wrong analysis, repair costs will be higher and productivity will be lower, which will negatively affect employees as they will have to undertake extra work. Applying the framework will improve data quality in industry and lead to increased productivity, reducing repair costs by detecting issues at an early stage and before the issue becomes worse, which will positively affect employees.
In future work, we will include data privacy in the proposed framework because it is important to consider data privacy and security in the data cleaning process in streaming data. Encrypting or anonymizing data are two methods that can be used to clean sensitive data in the stream. However, it is challenging to distinguish between normal data and sensitive data in streaming data. We need to ensure data privacy while cleaning the streaming data to prevent any misuse by third parties, such as identity theft. In addition, protecting data privacy will help to prevent cybercrime and ensure that data will be protected, and fraud is prevented while cleaning the stream data.
Author Contributions
Conceptualization, O.A., E.P. and S.T.; methodology, O.A.; software, O.A.; validation, O.A.; formal analysis, O.A.; investigation, O.A.; data curation, O.A.; writing—original draft preparation, O.A.; writing—review and editing, E.P. and S.T.; visualization, O.A.; supervision, E.P. and S.T. All authors have read and agreed to the published version of the manuscript.
Funding
This research received no external funding.
Data Availability Statement
The original data presented in the study are openly available http://dx.doi.org/102.100.100/6914.
Conflicts of Interest
The authors declare no conflicts of interest.
References
- Karkouch, A.; Moatassime, H.A.; Mousannif, H.; Noel, T. Data quality enhancement in Internet of Things environment. In Proceedings of the 2015 IEEE/ACS 12th International Conference of Computer Systems and Applications (AICCSA), Marrakech, Morocco, 17–20 November 2015; pp. 1–8. [Google Scholar]
- Cook, A.A.; Mısırlı, G.; Fan, Z. Anomaly Detection for IoT Time-Series Data: A Survey. IEEE Internet Things J. 2020, 7, 6481–6494. [Google Scholar] [CrossRef]
- Turabieh, H.; Mafarja, M.; Mirjalili, S. Dynamic Adaptive Network-Based Fuzzy Inference System (D-ANFIS) for the Imputation of Missing Data for Internet of Medical Things Applications. IEEE Internet Things J. 2019, 6, 9316–9325. [Google Scholar] [CrossRef]
- Gaddam, A.; Wilkin, T.; Angelova, M. Anomaly Detection Models for Detecting Sensor Faults and Outliers in the IoT—A Survey. In Proceedings of the 2019 13th International Conference on Sensing Technology (ICST), Sydney, NSW, Australia, 2–4 December 2019; pp. 1–6. [Google Scholar]
- Gaudio, D.D.; Schubert, T.; Abdelaal, M. RTClean: Context-aware Tabular Data Cleaning using Real-time OFDs. In Proceedings of the 2023 IEEE International Conference on Pervasive Computing and Communications Workshops and other Affiliated Events (PerCom Workshops), Atlanta, GA, USA, 13–17 March 2023; pp. 546–551. [Google Scholar]
- Corrales, D.C.; Ledezma, A.; Corrales, J.C. From Theory to Practice: A Data Quality Framework for Classification Tasks. Symmetry 2018, 10, 248. [Google Scholar] [CrossRef]
- Miao, Z.; Sealey, M.D.; Sathyanarayanan, S.; Delen, D.; Zhu, L.; Shepherd, S. A data preparation framework for cleaning electronic health records and assessing cleaning outcomes for secondary analysis. Inf. Syst. 2023, 111, 102130. [Google Scholar] [CrossRef]
- Panjei, E.; Gruenwald, L. EXOS: Explaining Outliers in Data Streams. In International Conference on Big Data Analytics and Knowledge Discovery; Springer Nature: Cham, Switzerland, 2023; pp. 25–41. [Google Scholar]
- Najib, F.M.; Ismail, R.M.; Badr, N.L.; Gharib, T.F. Clustering based approach for incomplete data streams processing. J. Intell. Fuzzy Syst. 2020, 38, 3213–3227. [Google Scholar] [CrossRef]
- Hassan, A.F.; Barakat, S.; Rezk, A. Towards a deep learning-based outlier detection approach in the context of streaming data. J. Big Data 2022, 9, 120. [Google Scholar] [CrossRef]
- Borah, A.; Gruenwald, L.; Leal, E.; Panjei, E. A GPU Algorithm for Detecting Contextual Outliers in Multiple Concurrent Data Streams. In Proceedings of the 2021 IEEE International Conference on Big Data (Big Data), Orlando, FL, USA, 15–18 December 2021; pp. 2737–2742. [Google Scholar] [CrossRef]
- Cai, S.; Li, L.; Li, Q.; Li, S.; Hao, S.; Sun, R. UWFP-Outlier: An efficient frequent-pattern-based outlier detection method for uncertain weighted data streams. Appl. Intell. 2020, 50, 3452–3470. [Google Scholar] [CrossRef]
- Tran, L.; Mun, M.Y.; Shahabi, C. Real-time distance-based outlier detection in data streams. Proc. VLDB Endow. 2020, 14, 141–153. [Google Scholar] [CrossRef]
- Shou, Z.; Zou, F.; Tian, H.; Li, S. Outlier Detection Based on Local Density of Vector Dot Product in Data Stream. In Security with Intelligent Computing and Big-Data Services: Proceedings of the Second International Conference on Security with Intelligent Computing and Big Data Services; Springer International Publishing: Cham, Switzerland, 2020; pp. 170–184. [Google Scholar]
- Alotaibi, O.; Pardede, E.; Tomy, S. Cleaning Big Data Streams: A Systematic Literature Review. Technologies 2023, 11, 101. [Google Scholar] [CrossRef]
- Fountas, P.; Kolomvatsos, K. A Continuous Data Imputation Mechanism based on Streams Correlation. In Proceedings of the 2020 IEEE Symposium on Computers and Communications (ISCC), Rennes, France, 7–10 July 2020; pp. 1–6. [Google Scholar] [CrossRef]
- Van Zoest, V.; Liu, X.; Ngai, E. Data Quality Evaluation, Outlier Detection and Missing Data Imputation Methods for IoT in Smart Cities. In Machine Intelligence and Data Analytics for Sustainable Future Smart Cities; Ghosh, U., Maleh, Y., Alazab, M., Pathan, A.-S.K., Eds.; Springer International Publishing: Cham, Switzerland, 2021; pp. 1–18. [Google Scholar] [CrossRef]
- Elouataoui, W.; El Alaoui, I.; El Mendili, S.; Gahi, Y. An Advanced Big Data Quality Framework Based on Weighted Metrics. Big Data Cogn. Comput. 2022, 6, 153. [Google Scholar] [CrossRef]
- Pipino, L.L.; Wang, R.Y.; Funk, J.D.; Lee, Y.W. Journey to Data Quality; The MIT Press: Cambridge, MA, USA, 2006. [Google Scholar] [CrossRef]
- Ehrlinger, L.; Wöß, W. A Survey of Data Quality Measurement and Monitoring Tools. Front. Big Data 2022, 5, 850611. [Google Scholar] [CrossRef] [PubMed]
- Han, J.; Pei, J.; Tong, H. Data Mining: Concepts and Techniques; Morgan kaufmann: Cambridge, MA, USA, 2022. [Google Scholar]
- Liu, D.; Görges, M.; Jenkins, S.A. University of Queensland Vital Signs Dataset: Development of an Accessible Repository of Anesthesia Patient Monitoring Data for Research. Anesth. Analg. 2012, 114, 584–589. [Google Scholar] [CrossRef] [PubMed]
- The University of Queensland. Available online: https://outbox.eait.uq.edu.au/uqdliu3/uqvitalsignsdataset/parameters.html (accessed on 20 December 2011).
Disclaimer/Publisher’s Note: The statements, opinions and data contained in all publications are solely those of the individual author(s) and contributor(s) and not of MDPI and/or the editor(s). MDPI and/or the editor(s) disclaim responsibility for any injury to people or property resulting from any ideas, methods, instructions or products referred to in the content. |
© 2024 by the authors. Licensee MDPI, Basel, Switzerland. This article is an open access article distributed under the terms and conditions of the Creative Commons Attribution (CC BY) license (https://creativecommons.org/licenses/by/4.0/).

