
An Improved Ensemble-Based Cardiovascular Disease Detection System with Chi-Square Feature Selection


Abstract
1. Introduction
- To develop a CVD detection system with a voting ensemble model that combines various ML model predictions to reduce the overall error and increase accuracy.
- To implement a chi-square feature selection algorithm to extract the features that are most useful, aiming to decrease the computation time and enhance prediction accuracy.
- To evaluate the performance of the proposed CVD detection system by comparing it with existing systems using various performance metrics.
- The paper is organized as follows: Section 2 reviews previous research on the use of ensemble ML models for HD detection and prediction; Section 3 outlines our methodology, which includes detailed explanations of data collection, pre-processing, the chi-square feature selection algorithm, and the ML models used; Section 4 presents the experimental results and compares them with existing methodologies; Section 5 concludes the paper by summarizing our findings and their implications.
2. Related Work
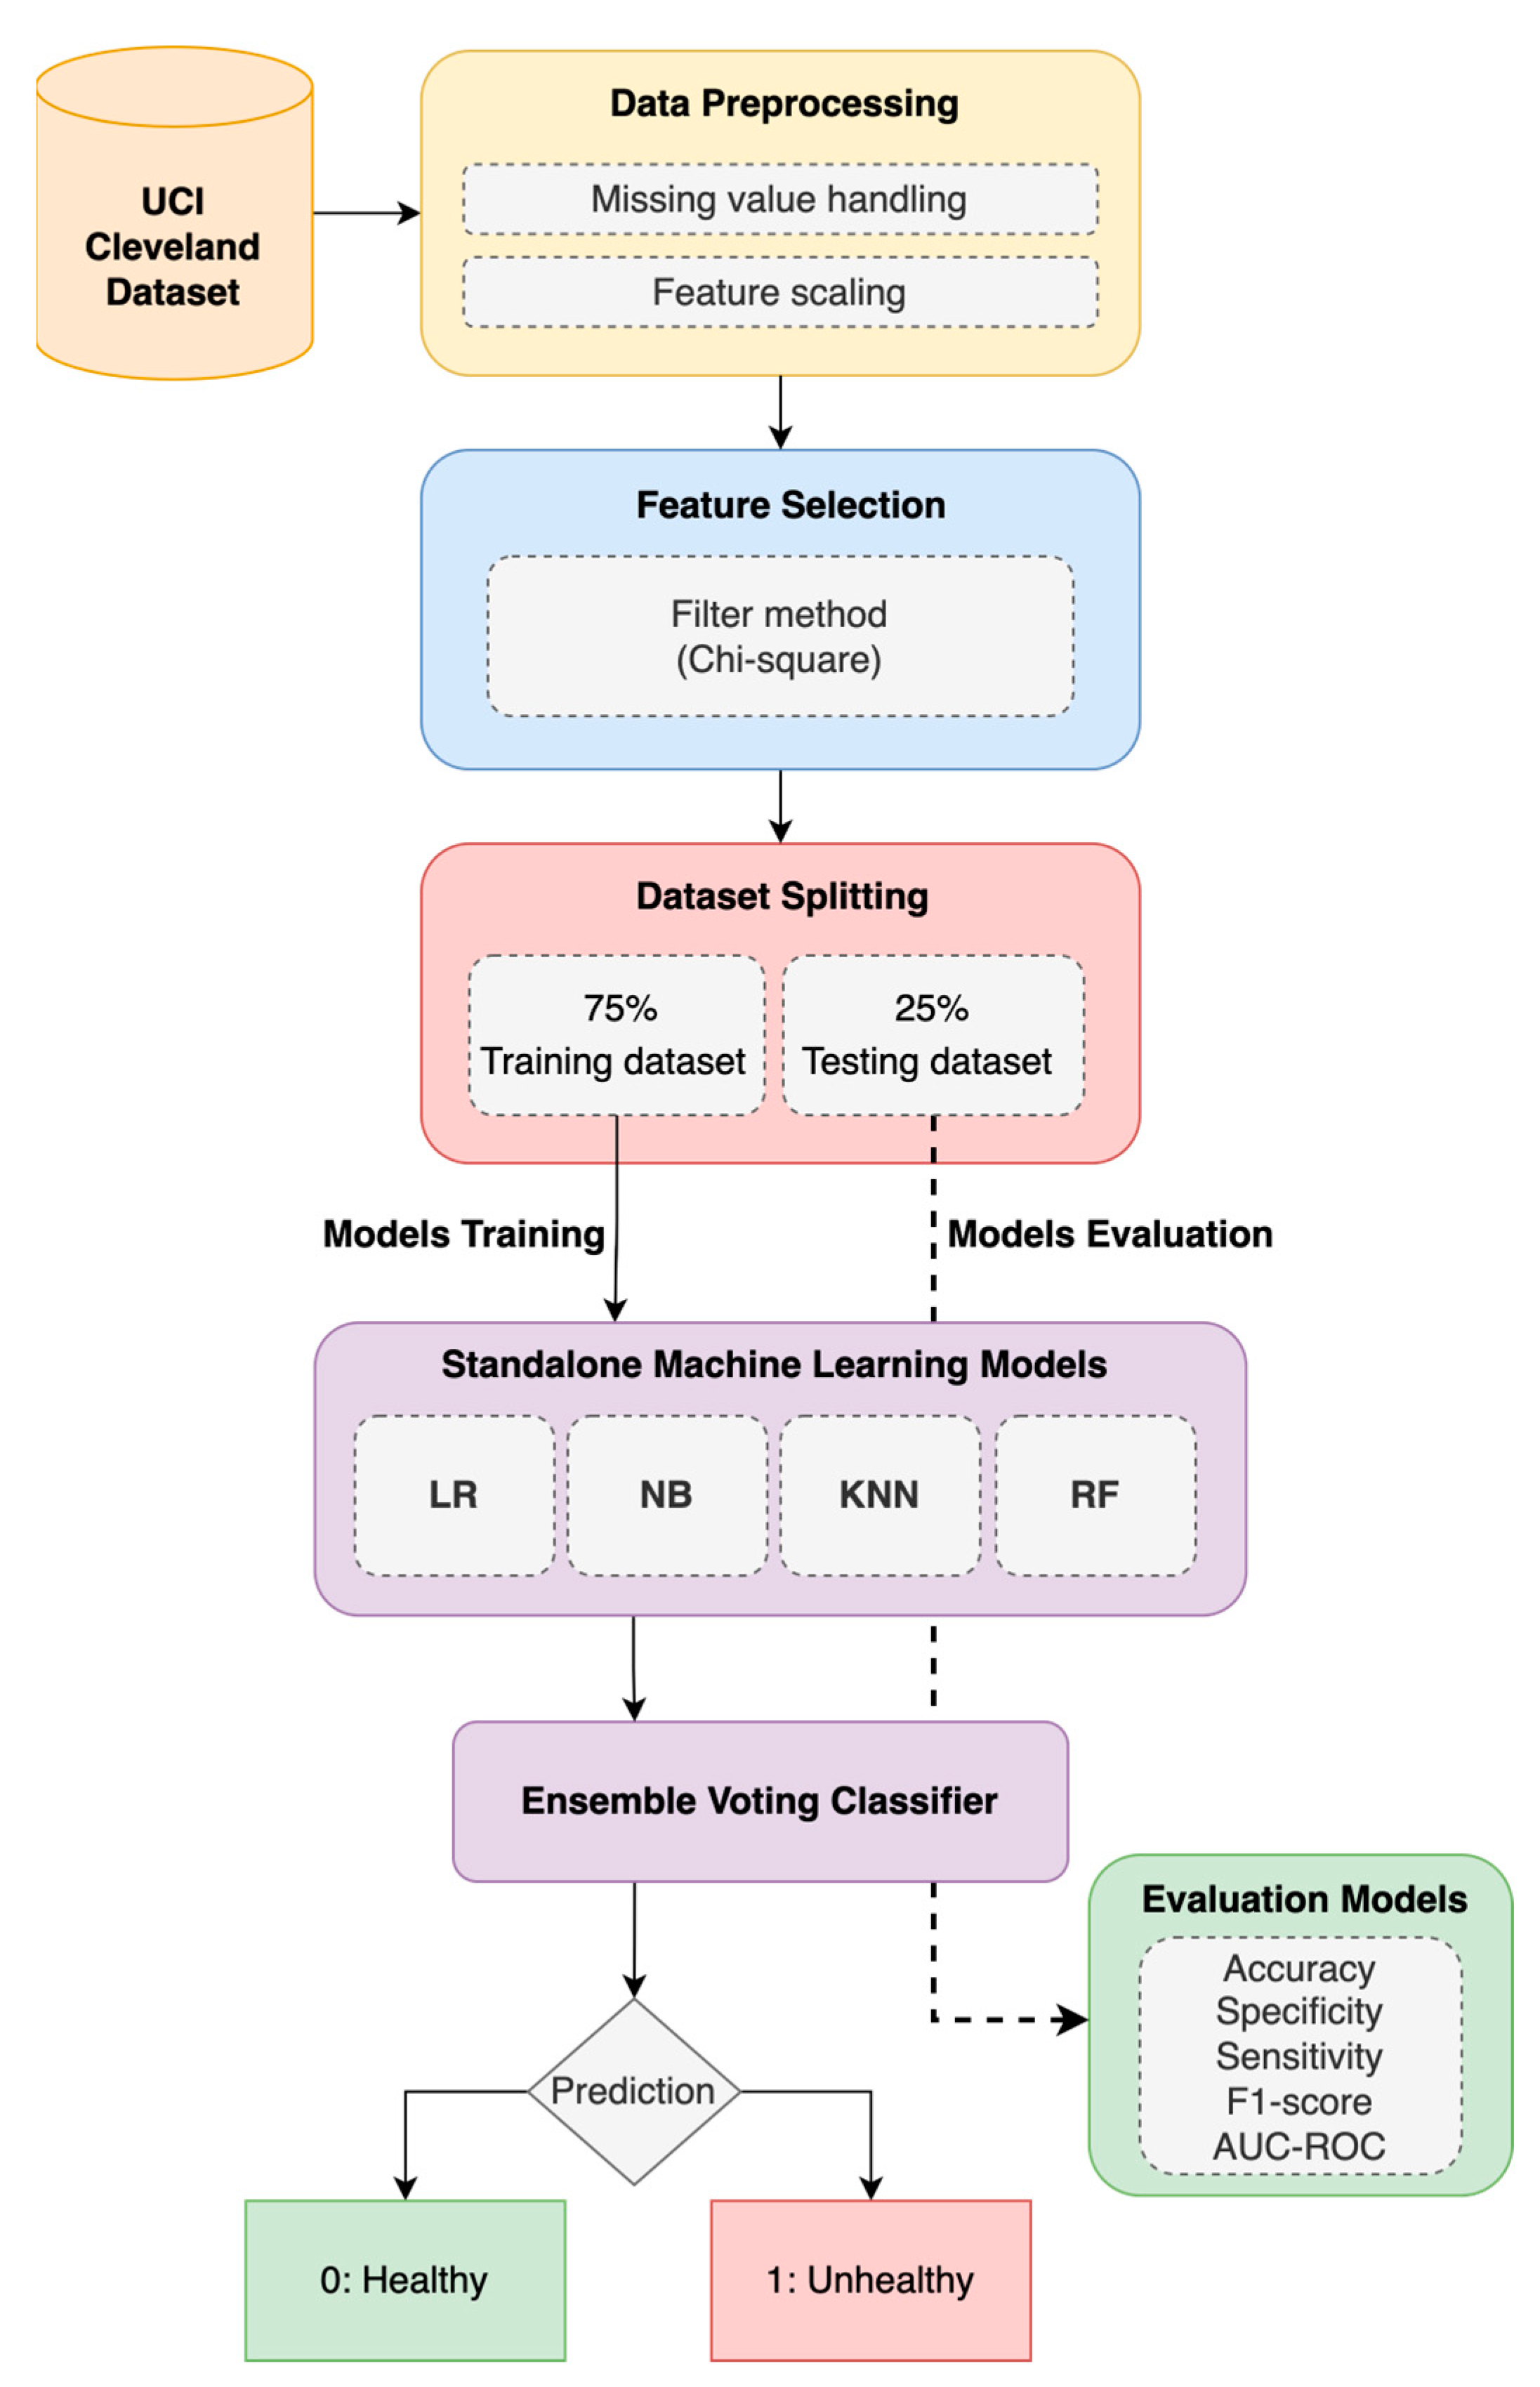
3. Materials and Methods
3.1. Ensemble Model
3.1.1. Heart Disease (HD) Dataset and Pre-Processing
3.1.2. Machine-Learning (ML) Models
- (a)
- Logistic Regression (LR)
- (b)
- Random Forest (RF)
- (c)
- Naïve Bayes (NB)
- (d)
- K-Nearest Neighbor (KNN)
- (e)
- Voting Classifier (VC)
3.2. Enhanced Ensemble Model with Feature Selection (FS)
4. Result and Discussion
- Accuracy, denoted as Acc, is the proportion of positive model instances to total model instances, as stated in Equation (14).
- Specificity, denoted as Spe, is the proportion of true negatives among all healthy persons, as stated in Equation (15). It is usually used to properly classify persons who are disease-free.
- Sensitivity, denoted as Sen, is the proportion of true positives among all unhealthy persons, as stated in Equation (16). It is usually used to properly classify heart disease persons.
- F1-score is known as the harmonic mean of sensitivity and specificity, according to Equation (17).
5. Conclusions
Author Contributions
Funding
Institutional Review Board Statement
Informed Consent Statement
Data Availability Statement
Conflicts of Interest
References
- Rajalakshmi, S.; Madhav, K.V. A collaborative prediction of presence of Arrhythmia in human heart with electrocardiogram data using machine learning algorithms with analytics. J. Comput. Syst. Sci. 2019, 15, 278–287. [Google Scholar] [CrossRef]
- Hiriyannaiah, S.; Siddesh, G.M.; Kiran, M.H.M.; Srinivasa, K.G. A comparative study and analysis of LSTM deep neural networks for heartbeats classification. Health Technol. 2021, 11, 663–671. [Google Scholar] [CrossRef]
- Sakila, V.S.; Dhiman, A.; Mohapatra, K.; Jagdishkumar, P.R. An automatic system for heart disease prediction using perceptron model and gradient descent algorithm. Int. J. Eng. Adv. Technol. 2019, 9, 1506–1509. [Google Scholar] [CrossRef]
- World Health Statistics. Available online: https://www.who.int/data/gho/publications/world-health-statistics (accessed on 1 March 2024).
- Tan, J.H.; Hagiwara, Y.; Pang, W.; Lim, I.; Oh, S.L.; Adam, M.; Tan, R.S.; Chen, M.; Acharya, U.R. Application of stacked convolutional and long short-term memory network for accurate identification of CAD ECG signals. Comput. Biol. Med. 2018, 94, 19–26. [Google Scholar] [CrossRef] [PubMed]
- Bizopoulos, P.; Koutsouris, D. Deep Learning in Cardiology. IEEE Rev. Biomed. Eng. 2019, 12, 168–193. [Google Scholar] [CrossRef] [PubMed]
- Kaur, S.; Singla, J.; Nkenyereye, L.; Jha, S.; Prashar, D.; Joshi, G.P.; El-Sappagh, S.; Islam, M.S.; Islam, S.M.R. Medical Diagnostic Systems Using Artificial Intelligence (AI) Algorithms: Principles and Perspectives. IEEE Access 2020, 8, 228049–228069. [Google Scholar] [CrossRef]
- Taye, M.M. Understanding of Machine Learning with Deep Learning: Architectures, Workflow, Applications and Future Directions. Computers 2023, 12, 91. [Google Scholar] [CrossRef]
- Al-Khazraji, H.; Nasser, A.R.; Hasan, A.M.; Al Mhdawi, A.K.; Al-Raweshidy, H.; Humaidi, A.J. Aircraft engines remaining useful life prediction based on a hybrid model of autoencoder and deep belief network. IEEE Access 2022, 10, 82156–82163. [Google Scholar] [CrossRef]
- Hadi, R.H.; Hady, H.N.; Hasan, A.M.; Al-Jodah, A.; Humaidi, A.J. Improved fault classification for predictive maintenance in industrial IoT based on AutoML: A case study of ball-bearing faults. Processes 2023, 11, 1507. [Google Scholar] [CrossRef]
- Deshmukh, V.M. Heart disease prediction using ensemble methods. Int. J. Recent Technol. Eng. 2019, 8, 8521–8526. [Google Scholar] [CrossRef]
- Sharma, R.; Singh, S.N. Towards Accurate Heart Disease Prediction System: An Enhanced Machine Learning Approach. Int. J. Perform. Eng. 2022, 18, 136–148. [Google Scholar] [CrossRef]
- AlMohimeed, A.; Saleh, H.; Mostafa, S.; Saad, R.M.A.; Talaat, A.S. Cervical Cancer Diagnosis Using Stacked Ensemble Model and Optimized Feature Selection: An Explainable Artificial Intelligence Approach. Computers 2023, 12, 200. [Google Scholar] [CrossRef]
- Miao, L.; Wang, W. Cardiovascular Disease Prediction Based on Soft Voting Ensemble Model. J. Phys. Conf. 2023, 2504, 012021. [Google Scholar] [CrossRef]
- Shorewala, V. Early detection of coronary heart disease using ensemble techniques. Inform. Med. Unlocked 2021, 26, 100655. [Google Scholar] [CrossRef]
- Jain, V.; Kashyap, K.L. Multilayer Hybrid Ensemble Machine Learning Model for Analysis of COVID-19 Vaccine Sentiments. J. Intell. Fuzzy Syst. 2022, 43, 6307–6319. [Google Scholar] [CrossRef]
- Aliyar Vellameeran, F.; Brindha, T. A new variant of deep belief network assisted with optimal feature selection for heart disease diagnosis using IoT wearable medical devices. Comput. Methods Biomech. Biomed. Engin. 2021, 25, 387–411. [Google Scholar] [CrossRef]
- Diwan, S.; Thakur, G.S.; Sahu, S.K.; Sahu, M.; Swamy, N. Predicting Heart Diseases through Feature Selection and Ensemble Classifiers. J. Phys. Conf. Ser. 2022, 2273, 012027. [Google Scholar] [CrossRef]
- Baranidharan, B.; Pal, A.; Muruganandam, P. Cardiovascular disease prediction based on ensemble technique enhanced using extra tree classifier for feature selection. Int. J. Recent Technol. Eng. 2019, 8, 3236–3242. [Google Scholar]
- Srınıvasa Rao, B. A New Ensenble Learning Based Optimal Prediction Model for Cardiovascular Diseases. E3S Web Conf. 2021, 309, 01007. [Google Scholar] [CrossRef]
- Alqahtani, A.; Alsubai, S.; Sha, M.; Vilcekova, L.; Javed, T. Cardiovascular disease detection using ensemble learning. Comput. Intell. Neurosci. 2022, 2022, 267498. [Google Scholar] [CrossRef]
- Latha, C.B.C.; Jeeva, S.C. Improving the accuracy of prediction of heart disease risk based on ensemble classification techniques. Inform. Med. Unlocked 2019, 16, 100203. [Google Scholar] [CrossRef]
- Tama, B.A.; Im, S.; Lee, S. Improving an Intelligent Detection System for Coronary Heart Disease Using a Two-Tier Classifier Ensemble. Biomed Res. Int. 2020, 2020, 9816142. [Google Scholar] [CrossRef]
- Wenxin, X. Heart disease prediction model based on model ensemble. In Proceedings of the 2020 3rd International Conference on Artificial Intelligence and Big Data (ICAIBD), Chengdu, China, 28–31 May 2020; pp. 95–199. [Google Scholar]
- Bashir, S.; Almazroi, A.A.; Ashfaq, S.; Almazroi, A.A.; Khan, F.H. A Knowledge-Based Clinical Decision Support System Utilizing an Intelligent Ensemble Voting Scheme for Improved Cardiovascular Disease Prediction. IEEE Access 2021, 9, 130805–130822. [Google Scholar] [CrossRef]
- Javid, I.; Alsaedi, A.K.Z.; Ghazali, R. Enhanced accuracy of heart disease prediction using machine learning and recurrent neural networks ensemble majority voting method. Int. J. Adv. Comput. Sci. Appl. 2020, 11, 540–551. [Google Scholar] [CrossRef]
- Harika, N.; Swamy, S.R. Artificial Intelligence-Based Ensemble Model for Rapid Prediction of Heart Disease. SN Comput. Sci. 2021, 2, 431. [Google Scholar] [CrossRef]
- UCI Machine Learning Repository: Heart Disease Dataset. Available online: https://archive.ics.uci.edu/dataset/45/heart+disease (accessed on 1 January 2024).
- Pedregosa, F.; Varoquaux, G.; Gramfort, A.; Michel, V.; Thirion, B.; Grisel, O.; Blondel, M.; Prettenhofer, P.; Weiss, R.; Dubourg, V. Scikit-learn: Machine learning in Python. JMLR 2011, 12, 2825–2830. [Google Scholar]
- Ali, S.A.; Raza, B.; Malik, A.K.; Shahid, A.R.; Faheem, M.; Alquhayz, H.; Kumar, Y.J. An optimally configured and improved deep belief network (OCI-DBN) approach for heart disease prediction based on Ruzzo–Tompa and stacked genetic algorithm. IEEE Access 2020, 8, 65947–65958. [Google Scholar] [CrossRef]
- Vijayashree, J.; Parveen Sultana, H. Heart disease classification using hybridized Ruzzo-Tompa memetic based deep trained Neocognitron neural network. Health Technol. 2020, 10, 207–216. [Google Scholar] [CrossRef]
- Sajja, T.K.; Kalluri, H.K. A deep learning method for prediction of cardiovascular disease using convolutional neural network. Rev. d’Intelligence Artif. 2020, 34, 601–606. [Google Scholar] [CrossRef]
- Ivan, J.; Prasetyo, S.Y. Heart Disease Prediction Using Ensemble Model and Hyperparameter Optimization. Int. J. Recent Innov. Trends Comput. Commun. 2023, 11, 290–295. [Google Scholar] [CrossRef]
- Haseena, S.; Priya, S.K.; Saroja, S.; Madavan, R.; Muhibbullah, M.; Subramaniam, U. Moth-Flame Optimization for Early Prediction of Heart Diseases. Comp. Math. Methods Med. 2022, 2022, 9178302. [Google Scholar] [CrossRef] [PubMed]
- Du, Z.; Yang, Y.; Zheng, J.; Li, Q.; Lin, D.; Li, Y.; Fan, J.; Cheng, W.; Chen, X.-H.; Cai, Y. Accurate prediction of coronary heart disease for patients with hypertension from electronic health records with big data and machine-learning methods: Model development and performance evaluation. JMIR Med. Inform. 2020, 8, e17257. [Google Scholar] [CrossRef]
- Ambrish, G.; Ganesh, B.; Ganesh, A.; Srinivas, C.; Mensinkal, K. Logistic regression technique for prediction of cardiovascular disease. Glob. Transit. Proc. 2022, 3, 127–130. [Google Scholar]
- Ebnou Abdem, S.A.; Chenal, J.; Diop, E.B.; Azmi, R.; Adraoui, M.; Tekouabou Koumetio, C.S. Using Logistic Regression to Predict Access to Essential Services: Electricity and Internet in Nouakchott, Mauritania. Sustainability 2023, 15, 16197. [Google Scholar] [CrossRef]
- Alshehri, G.A.; Alharbi, H.M. Prediction of Heart Disease using an Ensemble Learning Approach. Intl. J. Adv. Comput. Sci. Appl. 2023, 14, 1089–1097. [Google Scholar] [CrossRef]
- Tiwari, A.; Chugh, A.; Sharma, A. Ensemble framework for cardiovascular disease prediction. Comput. Biol. Med. 2022, 146, 105624. [Google Scholar] [CrossRef]
- Kapila, R.; Ragunathan, T.; Saleti, S.; Lakshmi, T.J.; Ahmad, M.W. Heart Disease Prediction using Novel Quine McCluskey Binary Classifier (QMBC). IEEE Access 2023, 11, 64324–64347. [Google Scholar] [CrossRef]
- Hastie, T.; Tibshirani, R.; Friedman, J.H.; Friedman, J.H. The Elements of Statistical Learning: Data Mining, Inference, and Prediction; Springer: Berlin/Heidelberg, Germany, 2009; Volume 2, 758p. [Google Scholar]
- Asif, D.; Bibi, M.; Arif, M.S.; Mukheimer, A. Enhancing Heart Disease Prediction through Ensemble Learning Techniques with Hyperparameter Optimization. Algorithms 2023, 16, 308. [Google Scholar] [CrossRef]
- Yewale, D.; Vijayaragavan, S.P.; Bairagi, V.K. An Effective Heart Disease Prediction Framework based on Ensemble Techniques in Machine Learning. Intl. J. Adv. Comput. Sci. Appl. 2023, 14, 182–190. [Google Scholar] [CrossRef]
- Gao, X.-Y.; Amin Ali, A.; Shaban Hassan, H.; Anwar, E.M. Improving the accuracy for analyzing heart diseases prediction based on the ensemble method. Complexity 2021, 2021, 6663455. [Google Scholar] [CrossRef]
- Abbas, S.; Avelino Sampedro, G.; Alsubai, S.; Almadhor, A.; Kim, T.-h. An Efficient Stacked Ensemble Model for Heart Disease Detection and Classification. CMC 2023, 77, 665–680. [Google Scholar] [CrossRef]
- Gupta, P.; Seth, D. Improving the Prediction of Heart Disease Using Ensemble Learning and Feature Selection. Int. J. Adv. Soft Comput. Appl. 2022, 14, 36–48. [Google Scholar] [CrossRef]
- Ali, L.; Rahman, A.; Khan, A.; Zhou, M.; Javeed, A.; Khan, J.A. An Automated Diagnostic System for Heart Disease Prediction Based on χ2 Statistical Model and Optimally Configured Deep Neural Network. IEEE Access 2019, 7, 34938–34945. [Google Scholar] [CrossRef]
- Yue, W.; Wang, Z.; Chen, H.; Payne, A.; Liu, X. Machine Learning with Applications in Breast Cancer Diagnosis and Prognosis. Designs 2018, 2, 13. [Google Scholar] [CrossRef]
- Ali, L.; Zhu, C.; Zhou, M.; Liu, Y. Early diagnosis of Parkinson’s disease from multiple voice recordings by simultaneous sample and feature selection. Exp. Syst. Appl. 2019, 137, 22–28. [Google Scholar] [CrossRef]
- Liu, H.; Setiono, R. Chi2: Feature selection and discretization of numeric attributes. In Proceedings of the 7th IEEE International Conference on Tools with Artificial Intelligence, Herndon, VA, USA, 5–8 November 1995; pp. 388–391. [Google Scholar]
- Maldonado, S.; Pérez, J.; Weber, R.; Labbé, M. Feature selection for support vector machines via mixed integer linear programming. Inf. Sci. 2014, 279, 163–175. [Google Scholar] [CrossRef]
- Nasser, A.R.; Hasan, A.M.; Humaidi, A.J. DL-AMDet: Deep learning-based malware detector for android. Int. Sys. App. 2024, 21, 200318. [Google Scholar] [CrossRef]
- Ganie, S.M.; Pramanik, P.K.D.; Malik, M.B.; Nayyar, A.; Kwak, K.S. An Improved Ensemble Learning Approach for Heart Disease Prediction Using Boosting Algorithms. Comput. Syst. Sci. Eng. 2023, 46, 3993–4006. [Google Scholar] [CrossRef]
- Wang, E.K.; Zhang, X.; Pan, L. Automatic Classification of CAD ECG Signals with SDAE and Bidirectional Long Short-Term Network. IEEE Access 2019, 7, 182873–182880. [Google Scholar] [CrossRef]


| Name | Type | Description |
|---|---|---|
| Age | Number | Age of person in years |
| Sex | Category | 1 for Male and 0 for Female |
| Cp | Category | Chest pain type (4 for asymptomatic, 3 for non-anginal pain, 2 for atypical angina, and 1 for typical angina) |
| Trestbps | Number | Blood pressure in (mmHg) |
| Chol | Number | Cholesterol in (mg/dL) |
| Fbs | Category | More than 120 mg/dL of fasting blood sugar (no = 0, yes = 1) |
| Restecg | Category | ECG results (left ventricular hypertrophy = 2, ST-T wave abnormality = 1, normal = 0) |
| Thalach | Number | heart rate |
| Exang | Category | Angina induced by exercise (yes = 1, no = 0) |
| Oldpeak | Number | ST segment depression induced by exercise |
| Slope | Category | Sloping of peak exercise ST segment (3 for downsloping, 2 for flat, 1 for upsloping) |
| Ca | Category | The total number of vessels that were colored via fluoroscopy |
| Thal | Category | Result of thallium stress test (reversible defect = 7, fixed = 6, normal = 3) |
| Num | Category | Status of cardiac disease (0 if the diameter narrowing is less than 50%, 1 if it is greater than 50%) |
| Class (Positive) | Class (Negative) | Total | |
|---|---|---|---|
| When feature is present | a | b | m = a + b |
| When feature is absent | c | d | t – m = c + d |
| Total | p = a + c | t – p = b + d | t |
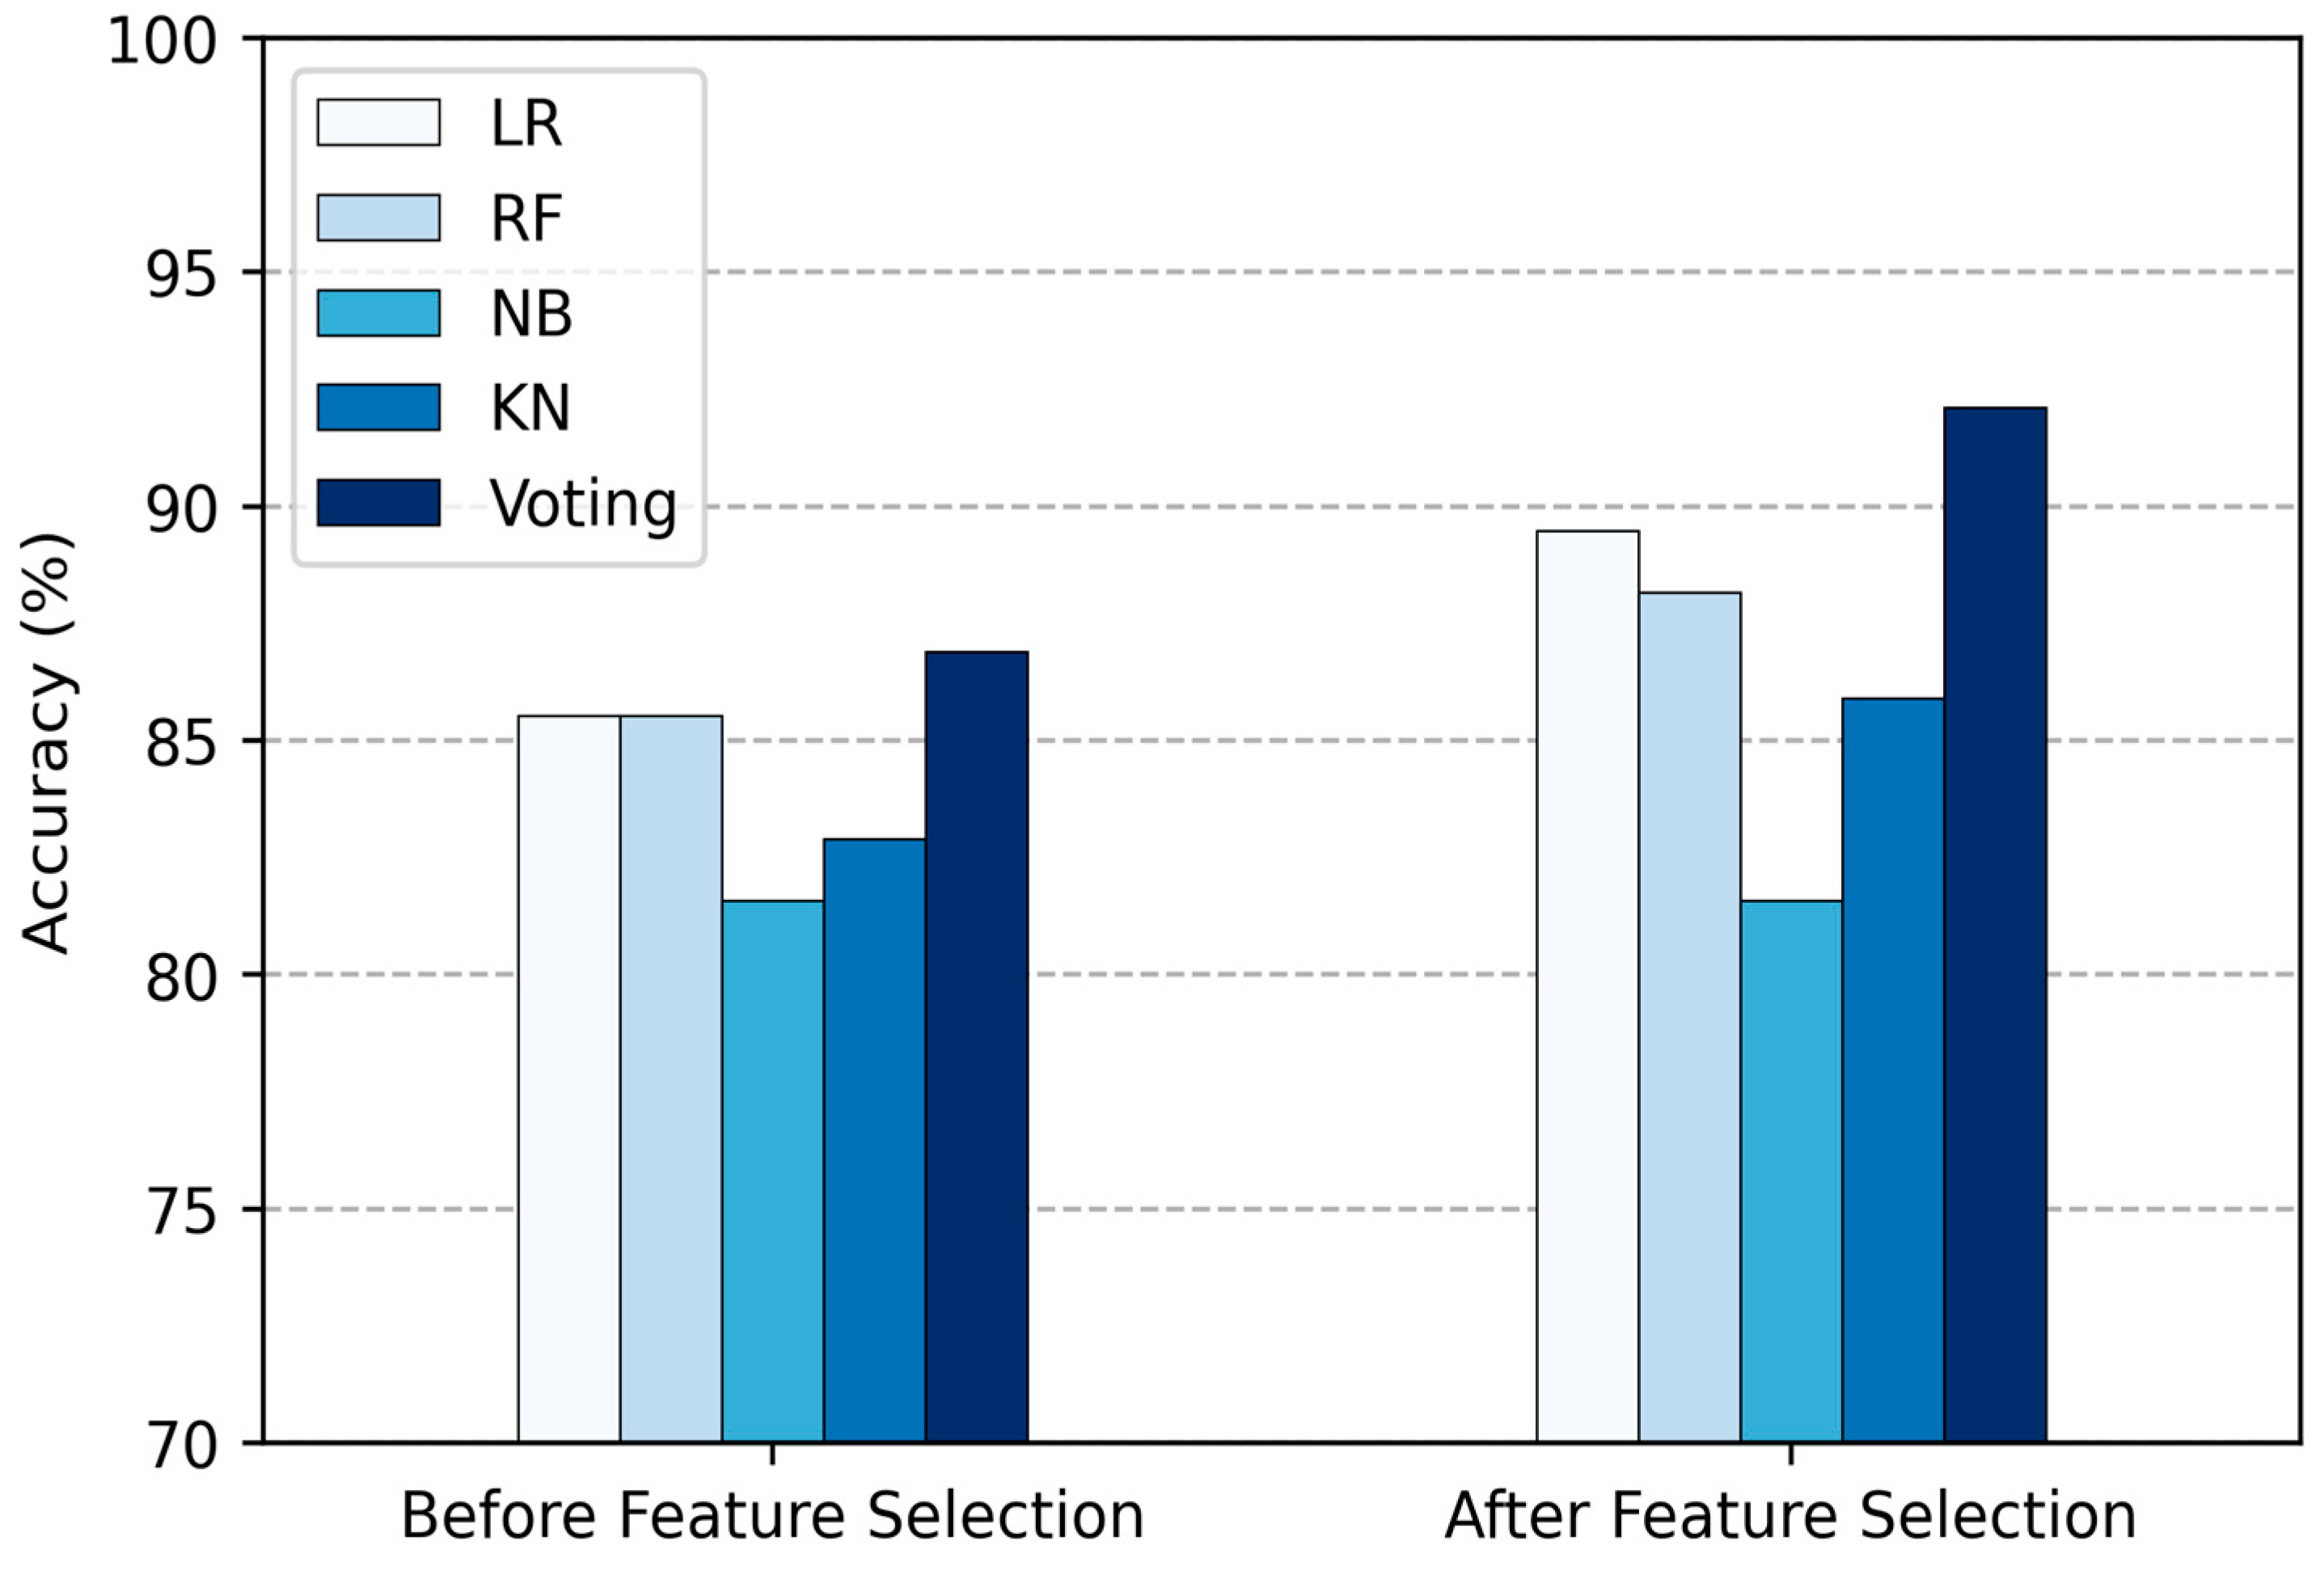
| Method | Total Features | Acc (%) | Sen (%) | Spe (%) | F1-Score (%) |
|---|---|---|---|---|---|
| LR | 13 | 85.53 | 85.53 | 85.53 | 85.53 |
| RF | 13 | 85.52 | 85.52 | 85.52 | 85.52 |
| NB | 13 | 81.58 | 81.58 | 81.58 | 81.58 |
| KNN | 13 | 82.89 | 82.89 | 82.89 | 82.89 |
| Proposed Voting Ensemble | 13 | 86.84 | 86.84 | 86.84 | 86.84 |
| Method | Total Features | Acc (%) | Sen (%) | Spe (%) | F1-Score (%) |
|---|---|---|---|---|---|
| LR | 5 | 89.473 | 89.473 | 89.473 | 89.473 |
| RF | 5 | 88.157 | 88.157 | 88.157 | 88.157 |
| NB | 5 | 81.85 | 81.85 | 81.85 | 81.85 |
| KNN | 5 | 85.53 | 85.53 | 85.53 | 85.53 |
| Proposed Voting Ensemble | 5 | 92.11 | 92.11 | 92.11 | 92.11 |
| Work | Year | Dataset | Feature Selection Method | Classifier | No. of Selected Features | Accuracy |
|---|---|---|---|---|---|---|
| [20] | 2019 | Cleveland | Feature Selection | Bagging, Boosting, Voting Ensemble (NB, RF, Bayes net, c4.5, MLP, PART) | 9 | 7.26% increase |
| [9] | 2019 | Cleveland | Extra Tree Classifier | Voting, Bagging Ensemble (DT, LR, ANN, KNN, NB) | - | 87.78% |
| [17] | 2019 | Cleveland | Feature Selection | Voting Ensemble (SVM, NB, LR) | 6 | 84.79% |
| [24] | 2020 | Cleveland | - | Voting Ensemble ML (RF, SVM, KNN) Voting Ensemble DL (LSTM, GRU) | - | 75–86% |
| [22] | 2020 | Cleveland | - | Voting Ensemble (SVM, ANN, DT) | - | 87.3% |
| [21] | 2020 | Cleveland | CFS with PSO | Stacked Ensemble (RF, GBM, XGB) | 7 | 85.71% |
| [23] | 2021 | Cleveland | - | Voting Ensemble (NB, SVM, DT, NN, MLP, SLP) | - | 83% |
| [25] | 2021 | Cleveland | - | Voting Ensemble (SVM, NB, ANN) | - | 87.05% |
| [16] | 2022 | Cleveland | Chi-square and RFE | Voting Ensemble (CART, GBM, Adaboost) | 7 | 87% |
| [19] | 2022 | Cleveland | - | Voting Ensemble (RF, KNN, DT, XGB, DNN, KDNN) | - | 88.70% |
| Proposed | 2024 | Cleveland | Chi-square | ML Voting Ensemble (NB, LR, RF, KNN) | 5 | 92.11% |
Disclaimer/Publisher’s Note: The statements, opinions and data contained in all publications are solely those of the individual author(s) and contributor(s) and not of MDPI and/or the editor(s). MDPI and/or the editor(s) disclaim responsibility for any injury to people or property resulting from any ideas, methods, instructions or products referred to in the content. |
© 2024 by the authors. Licensee MDPI, Basel, Switzerland. This article is an open access article distributed under the terms and conditions of the Creative Commons Attribution (CC BY) license (https://creativecommons.org/licenses/by/4.0/).
Share and Cite
Korial, A.E.; Gorial, I.I.; Humaidi, A.J. An Improved Ensemble-Based Cardiovascular Disease Detection System with Chi-Square Feature Selection. Computers 2024, 13, 126. https://doi.org/10.3390/computers13060126
Korial AE, Gorial II, Humaidi AJ. An Improved Ensemble-Based Cardiovascular Disease Detection System with Chi-Square Feature Selection. Computers. 2024; 13(6):126. https://doi.org/10.3390/computers13060126
Chicago/Turabian StyleKorial, Ayad E., Ivan Isho Gorial, and Amjad J. Humaidi. 2024. "An Improved Ensemble-Based Cardiovascular Disease Detection System with Chi-Square Feature Selection" Computers 13, no. 6: 126. https://doi.org/10.3390/computers13060126
APA StyleKorial, A. E., Gorial, I. I., & Humaidi, A. J. (2024). An Improved Ensemble-Based Cardiovascular Disease Detection System with Chi-Square Feature Selection. Computers, 13(6), 126. https://doi.org/10.3390/computers13060126