Abstract
Readily available software analysis and analytics tools are often operated within external services, where the measured software analysis data are kept internally and no external access to the data is available. We propose an approach to integrate visual software analysis on the GitHub platform by leveraging GitHub Actions and the GitHub API, covering both analysis and visualization. The process is to perform software analysis for each commit, e.g., static source code complexity metrics, and augment the commit using the resulting data, stored as git objects within the same repository. We show that this approach is feasible by integrating it into 64 open source TypeScript projects. Furthermore, we analyze the impact on Continuous Integration (CI) run time and repository storage. The stored software analysis data are externally accessible to allow for visualization tools, such as software maps. The effort to integrate our approach is limited to enabling the analysis component within a project’s CI on GitHub and embed an HTML snippet into the project’s website for visualization. This enables a large amount of projects to have access to software analysis as well as provide means to communicate the current status of a project.
1. Introduction
During the software development process, a large amount of data is created and stored in the various software repositories. For example, changes to the code are managed in a version control system, tasks are organized in an issue-tracking system, and errors that occur are documented in a bug-tracking system. Software analytics uses software data analysis and information visualization techniques “to obtain insightful and actionable information from software artifacts that help practitioners accomplish tasks related to software development, systems, and users” [1]. The applications in which software analysis is used are diverse [2], e.g., effort estimation [3], social network analysis [4], or using visualization to support program comprehension tasks [5,6,7]. Of particular relevance is the analysis of git repositories [8], as widely used type of repositories, and GitHub as popular social coding platform [9]. Various platforms have been developed to provide software analytics services to stakeholders [10,11,12]. These analytics services either integrate directly into the Continuous Integration (CI) pipeline or they are to be operated externally [13]. In both cases, only a higher-level view of the analysis results is reported back to the developer by means of a review command, or a dashboard overview or visualization on the services’ side. On the other hand, there are low-level tools available for direct use (https://analysis-tools.dev/, accessed on 16 January 2024), but they are usually operated within those analytics services, or their results are only used at a higher level. While techniques and tools are available for open source and industry projects, the processing steps as well as the data storage of software analysis data are usually considered separate to the source code repository. For example, the source code of an open source project like Angular can be hosted on GitHub and built using GitHub Actions [14], but software analysis is performed through external services and external storage—here, GitHub CodeQL (https://codeql.github.com/, accessed on 16 January 2024) and OpenSSF Scorecards (https://github.com/ossf/scorecard, accessed on 16 January 2024). Using readily available external services allows for easy-to-integrate software analysis, but the analysis results are kept internally by the operators of those services—an association of the source code with the derived analysis data is not considered. This comes with a number of limitations on the availability and reusability of those software data. For one, the performed analyses are I/O-intensive, implementation-specific, and usually time-consuming, as whole software projects and further software data repositories are parsed and analyzed. Second, the derived data are not externally available for further processing and visualization. Third, using external services limits the available analyses by means of mining tools, software metrics, and higher-level analysis and reports. The latter two impede easy access to “resources and tools needed for practitioners to experiment and use MSR techniques on their repositories” [15]. Last, this unavailability of the analysis data for third parties leads to multiple computations of such analyses, as there is a broad interest in software measurements, e.g., by the Mining Software Repositories community and for software quality assurance and modern development processes and practices. To summarize, the current state of the art has the following limitations:
- Readily available software analytics tools are often operated as external services;
- Measured software analysis data are kept internally;
- No external use of the data is available.
We propose an approach to derive software analysis data during the execution of a project’s CI pipeline and store the results within its source code repository. This approach is exemplified using GitHub and GitHub Actions together with an exemplary set of static source code complexity metrics. For this, we propose a default component to run for software analysis, such that software metrics are computed and stored on a per-commit basis. As accessible storage location, we use the git object database and mirror the commit graph structure to augment existing commits using software analysis data. We use the GitHub API to store the software analysis data within the git repository. These data can later be used for further software analyses and software visualization (Figure 1). Although CI and GitHub Actions are often used to ensure the quality and thus the approachability of a project, using them to provide a form of public self-representation whose underlying data are reusable is underrepresented [16,17]. We validate our approach with a case study on 64 open source GitHub written in TypeScript and show the performance impact on the CI and memory impact on the git repository. Last, we discuss the approach in the context of the diverse set of open source projects, different development environments, and analysis scenarios.
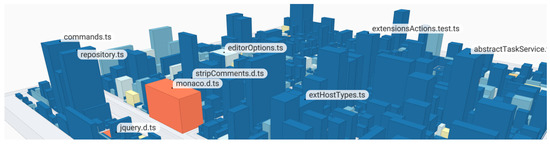
Figure 1.
A 2.5D interactive software map visualization of the Microsoft vscode software project. The number of lines of code (LoC) is mapped to weight, the number of functions (NoF) is mapped to height, and the density of comments (DoC) is mapped to color, ranging from inconspicuous (blue) to conspicuous (red).
The remainder of this paper is structured as follows. Section 2 introduces the related work. In Section 3, we present our approach and prototypical implementation for integrated software analytics. In Section 4, we describe our case study and evaluation of run-time performance and memory overhead. We discuss the approach in Section 5, focusing on its limitations and extensibility. In Section 6, we conclude this work.
2. Related Work
Software analyses became a standard activity during software development, usually executed as part of the CI pipeline. Thereby, the activity can be decomposed into several phases: (1) software repository mining, (2) optional intermediate storage, and (3) communication of the results. Specific to our proposed approach, the corresponding related work can be categorized into (1) tools for mining software repositories, (2) software metric storage and storage formats, and (3) software visualization. As the overall process targets an integration of software analytics into the GitHub platform, general software analytics systems are related works as well.
2.1. Tools for Mining Software Repositories
Version control systems, such as git, enable collaborative work on software projects. All activities and the entire history of a project are stored in a repository, which provides extensive information for further analysis. Example applications for analyzing git repositories include capturing static and dynamic software metrics [18,19,20], locating expertise among developers [21], or measuring environmental sustainability [22]. The extraction of relevant data requires efficient processing tools, e.g., for compiling software metrics [23]. An example of such a tool is PyDriller, which allows the efficient extraction of software metrics from a git repository [24]. By combining different optimizations, e.g., in-memory storage and caching, pyrepositoryminer provides an alternative tool that shows better performance. Other examples with different aspects of variation are (1) ModelMine [25], a tool focusing on mining model-based artifacts; (2) GitcProc [26], a tool based on regular expressions for extracting fine-grained source code information; (3) Analizo [27], a tool with support for object-oriented metrics in multiple languages; (4) LineVul [28], an approach for predicting vulnerability within source code; and (5) srcML [29], an infrastructure for the exploration, analysis, and manipulation of source code.
In addition to efficiently processing individual projects, it is often necessary to process entire collections of projects, for example, to generate data for training ML procedures. One of the first attempts to make data from GitHub accessible for research is Boa [30]. Besides the infrastructure, it provides a domain-specific language and web-based interface to enable researchers to analyze GitHub data. Similarly, GHTorrent provides an infrastructure for generating datasets from GitHub [31], which can further be made available for local storage [32]. An infrastructure that also provides a frontend is given by SmartSHARK [33]. A technical hurdle in crawling large datasets from GitHub is the limitation of API requests. Crossflow addresses this problem through a distributed infrastructure [34]. Besides source code, other software repositories, e.g., issue-tracking systems or mailing lists, are also suitable for collecting information for subsequent analyses [35].
2.2. Metric Storage Formats
Source code metrics and similar software analyses are directly derived from recorded software data that are often cached or stored after computation. This is feasible because such metrics and analyses are determinate and desirable, as their computation can be time- and memory-intensive. For such storage, state-of-the-art approaches are applicable and usually chosen based on structural complexity, amount of data, and a developers’ personal preference [36]. As a result, there is a broad diversity in the data models, storage systems, and formats used. With a file focus, the common formats, namely XML [37], ARFF [38], CSV [39], and JSON—more specifically, JSONL [40]—are used as well. Specific to the Moose system, there is also the MSE file format used to store static source code metrics [41]. As a standardized format for static source code analysis results, there is the SARIF file format (https://sarifweb.azurewebsites.net/, accessed on 16 January 2024) that is also used by GitHub for their security dashboard. These approaches are not strictly used in isolation, but can be used in combination as well [11,42]. Although stored as files, for subsequent analyses in individual MSR use cases, these metrics are further gathered and stored into their own databases [43]. For example, relational databases such as Postgres are used by projects such as source{d} (https://github.com/src-d/sourced-ce, accessed on 16 January 2024) and Sonarqube (https://www.sonarsource.com/products/sonarqube/, accessed on 16 January 2024).
2.3. Software Visualization
For the observation of recorded metrics by a user, such metrics can be depicted using a table-structured representation. However, this approach does not scale for even mid-sized projects [44]. As software itself has no intrinsic shape or gestalt, the area of software visualization provides techniques for representing software projects’ structure, behavior, or evolution for supporting the stakeholders in different program comprehension tasks. In many cases, the layout of a visualization is derived from a project’s folder hierarchy [45], e.g., when using treemaps [46]. Software metrics can be mapped on the visual attributes of treemaps, e.g., texture, color, and size [47]. Especially, 2.5D treemaps provide further visual attributes, which motivates their use for exploring large software projects by means of code cities [48], software cities [49], or software maps [5]. Besides hierarchy-preserving visualizations, layouts can also be generated based on the semantic composition of software projects [50,51]. In this case, abstract concepts in the source code are captured by applying a topic model, which results in a high-dimensional representation of each source code file. The local and global structures within the high-dimensional representation are captured in a two-dimensional scatter plot after using dimensionality reduction techniques. By enriching the visualization with cartographic metaphors or the placement of glyphs, software metrics can be mapped in the visualization.
2.4. Software Analytics Systems
Various Software as a Service (SaaS) platforms have been developed to gain insights from the development process and support developers in their work. Thereby, the intended use case is either (1) software analytics for a single project or (2) software repository mining for a large set of projects. The former use case is supported by platforms such as Sonarqube and the source{d} Community Edition. The latter use case is supported by research platforms such as MetricMiner [52] and GrimoireLab [53]. For metrics already measured by GitHub, there is also Google BigQuery for Github (https://cloud.google.com/blog/topics/public-datasets/github-on-bigquery-analyze-all-the-open-source-code, accessed on 16 January 2024), which allows for access to data using an SQL interface. Lastly, there are some software analytics platforms that are deemed to be used for both use cases—serving both researchers and software developers—such as Microsoft CODEMINE [11]. Another example is Nalanda, which comprises a socio-technical graph and index system to support expert and artifact recommendation tasks [12]. As a main demarcation and apart from readily available tools, infrastructures, and full-featured external software analytics services, we propose an extension to visual software analytics by means of an integrated approach within the GitHub platform.
3. Approach
Our proposed approach consists of two components: software analysis and software visualization. The software analysis component builds upon GitHub Actions to provide per-commit software analysis while storing the results as blobs in the git objects database of a project. The results are available for further processing and visualization for internal and external use cases, e.g., software visualization (Figure 1). Our software visualization demonstrator is implemented as a web application that fetches the analyzed data and renders them in an interactive software map client.
3.1. Process Overview
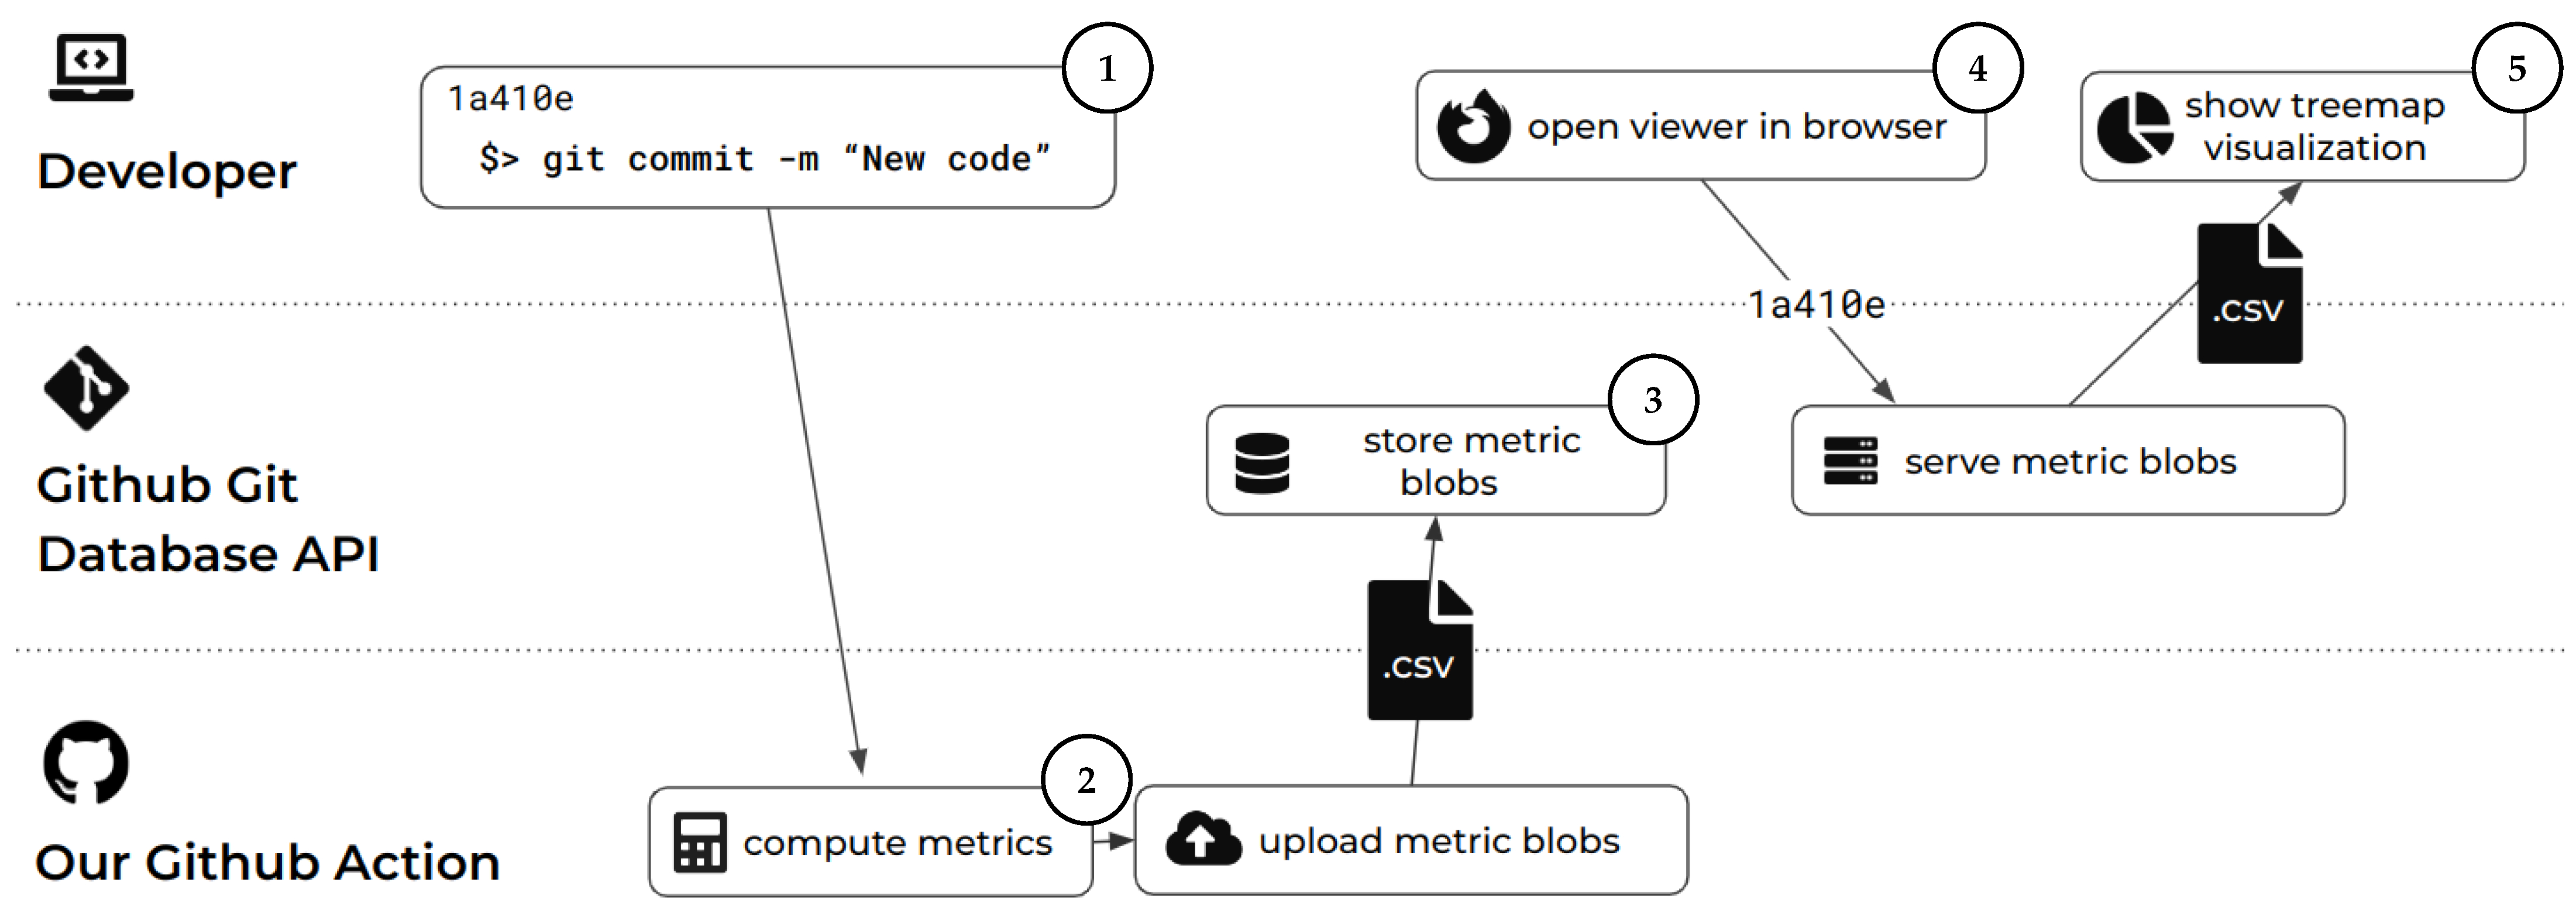
Both the analysis and the visualization operate in an isolated manner with a shared point of interaction: the git repository of the software project on GitHub (Figure 2). The analysis component integrates into the GitHub CI process and the visualization component integrates into web pages, e.g., hosted by GitHub Pages. The overall process is split into phases matching the two components and is summarized as follows: the analysis phase including storage of the results (➀–➂) and the visualization phase (➃–➄). The analysis phase is started when a developer creates and pushes a commit to the git repository, starting its CI ➀. After project-specific analysis ➁, the software analytics data are added to the repository as git blob objects ➂. This allows each commit of a repository to be annotated with project-specific software analysis data, such as source code metrics. Later, these data can be queried and fetched from a client component ➃ and used for visualizing the software project ➄. For example, we use the data to derive a representative visualization of a software project that can be shown to maintainers, developers, contributors, stakeholder, and visitors. Such a visualization can be embedded into a project’s landing page and serve as a self-presentation to potential new collaborators and even long-time collaborators.
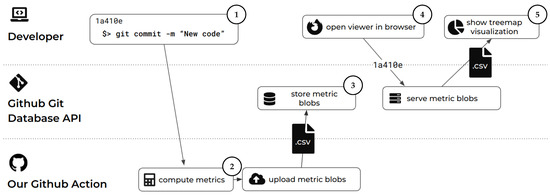
Figure 2.
Process overview showing the participation of different actors through our data-processing pipeline triggered by a new commit. After processing, a visualization component can query the resulting software analytics data and derive visualization artifacts, such as software maps.
3.2. Analysis
The analysis is designed to be part of a project’s CI process. As such, we designed an extension to available CI processes on GitHub by means of a GitHub Action. This action is specifically designed to analyze the source code for a given commit ➀, i.e., the CI can be configured to execute this action on push to a branch. The general processing approach for this action is to collect the source code, apply static source code metrics, and store the results. However, choosing metrics for analysis is highly dependent on the used programming languages, the quality goals, and the available implementations. As such, we see this as a major point of variation for future work. The interface for GitHub Actions for integrating potential metrics implementations is a Docker container, which allows for a highly flexible use of available tools and individual developments of metrics.
3.3. Storage
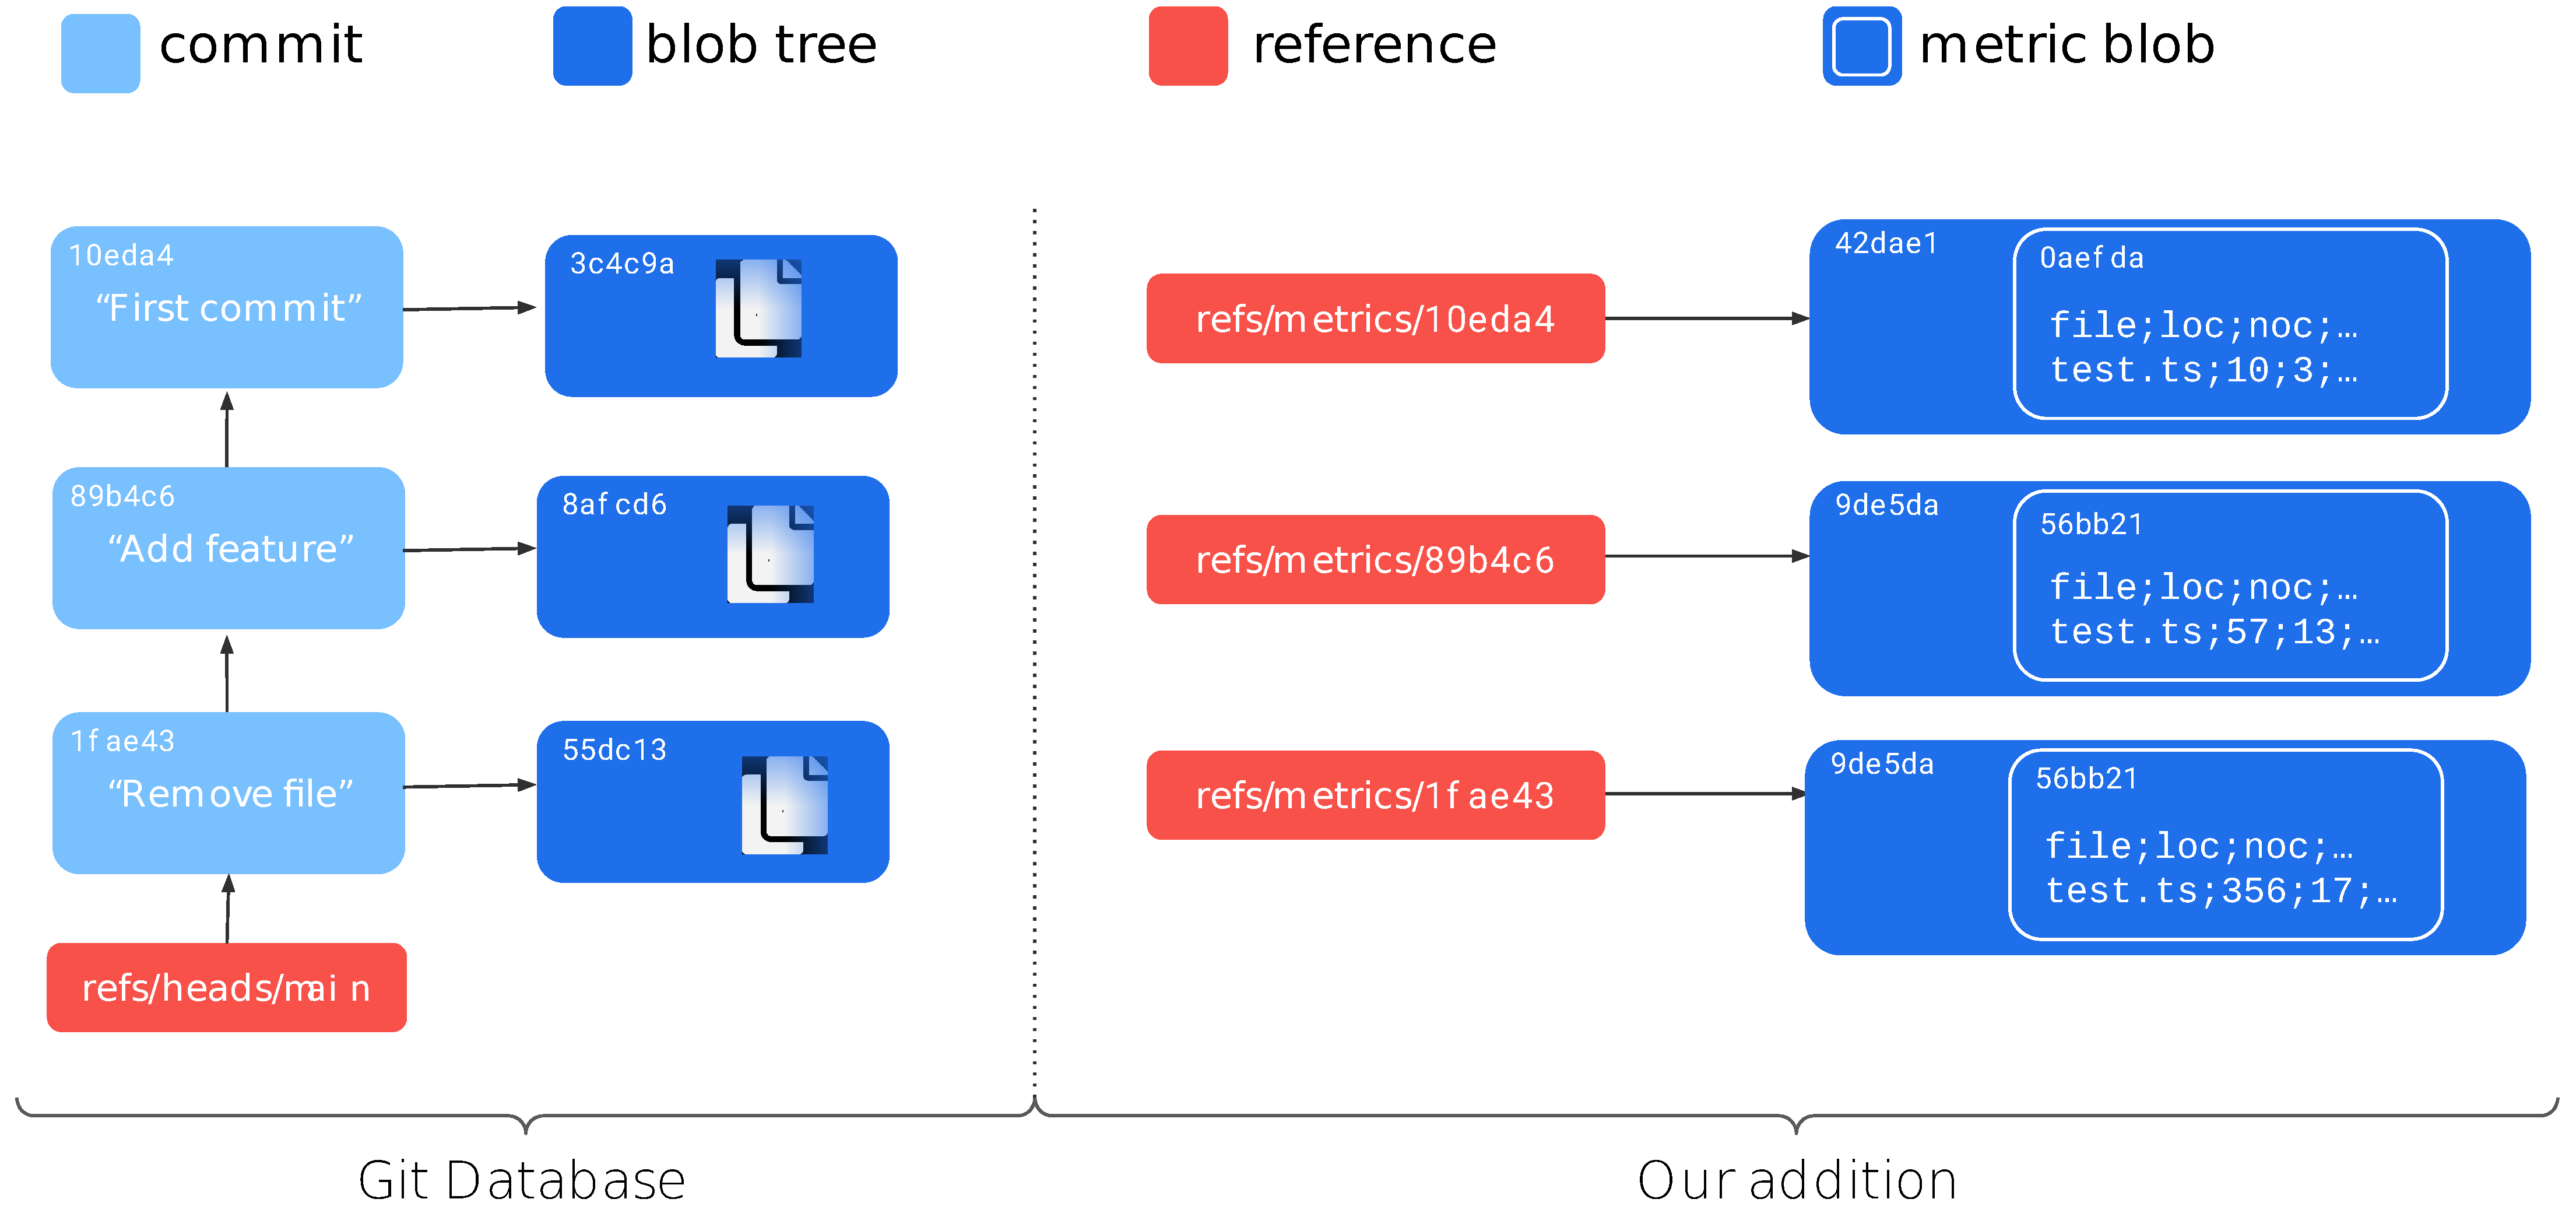
The output of the analysis component is then stored within the git repository. Such a repository could contain different types of objects, but for interoperability and available APIs, we focused on files to represent software analysis data. Specific to our prototype, we use a CSV file format, where each line contains the measurements for a source code file, identified by its file path. Although these metric files are created within a Docker container, this container has only read-only access to the git repository. Instead, we use the GitHub API to store these files within blobs (https://git-scm.com/book/en/v2/Git-Internals-Git-Objects, accessed on 16 January 2024). The API allows the git trees and refs to be manipulated using the /repos/{owner}/{repo}/git/trees and/repos/{owner}/{repo}/git/refs endpoints, respectively. This file is then committed to the git repository using a commit-specific git refs tree in the location refs/metrics/{sha} (Figure 3). This allows one to query the software analysis data within the refs/metrics subtree from a given git SHA later on. For convenience, we create and maintain specific git refs to branches as well. The sequence of requests is as follows. We first create a tree by sending a POST request to the/repos/{owner}/{repo}/git/trees endpoint. The API’s response will contain a SHA-1 hash of the newly created tree. We then create a reference under refs/metrics/{sha}, storing the SHA reference to the tree. This is achieved by a further POST request to the/repos/{owner}/{repo}/git/refs endpoint. This ensures that the blob tree is retrievable for every analyzed commit. Last, we populate the tree with the CSV file.

Figure 3.
Proposed data structure to save commit-based metadata in the git object database. Each commit with software data references the original commit through name matching.
3.4. Visualization
The per-commit software analysis data are then available for fetching and visualization by the visualization component. As we chose to measure software metrics per file organized in a file tree, the visualization is a hierarchy visualization by means of a software map.The data retrieval consists of multiple requests and uses the GitHub API as follows. The prototype first requests the metrics reference for a certain commit using a GET request to the endpoint/repos/{owner}/{repo}/git/refs. The retrieved tree SHA is then used to request an intermediate blob tree at the/repos/{owner}/{repo}/git/trees endpoint. This gives us a tree that stores the SHA reference to the blob containing our metrics data. This hash is then used to request the blob using another GET request, this time to the/repos/{owner}/{repo}/git/blobs endpoint. Once the blob is retrieved, the last step is to decode the base64-encoded content of the blob to retrieve the metrics content that is stored as a CSV string.
Parsing this string as tabular data results in a dataset suitable for software maps. Thereby, the software map visualization technique is a 3D-extruded information landscape that is derived from a 2D treemap layout. The tree structure for the treemap layout is hereby derived from the tree structure of the file path. The available visual variables in the visualization are the footprint area (weight), the extruded height (height), and te leaf color (color). The visualization allows for basic navigation through the 3D scene, allowing users to make themselves familiar with the project and build up a mental map [54].
3.5. Prototype Implementation Details
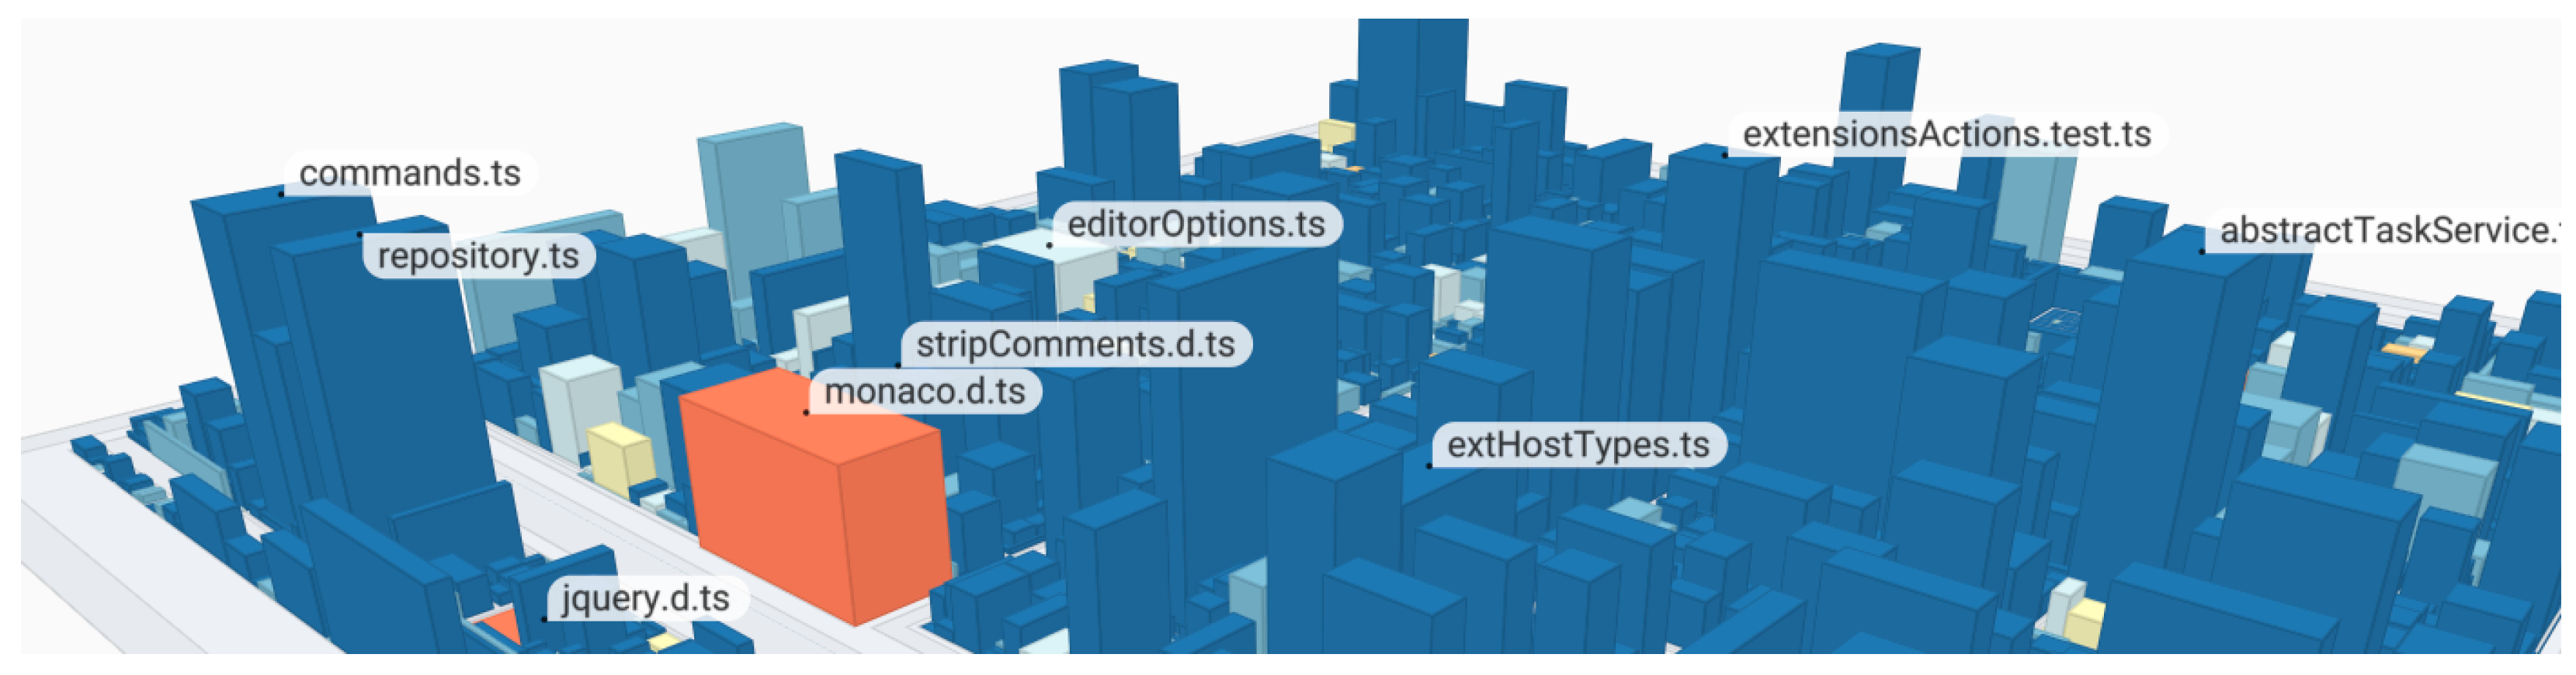
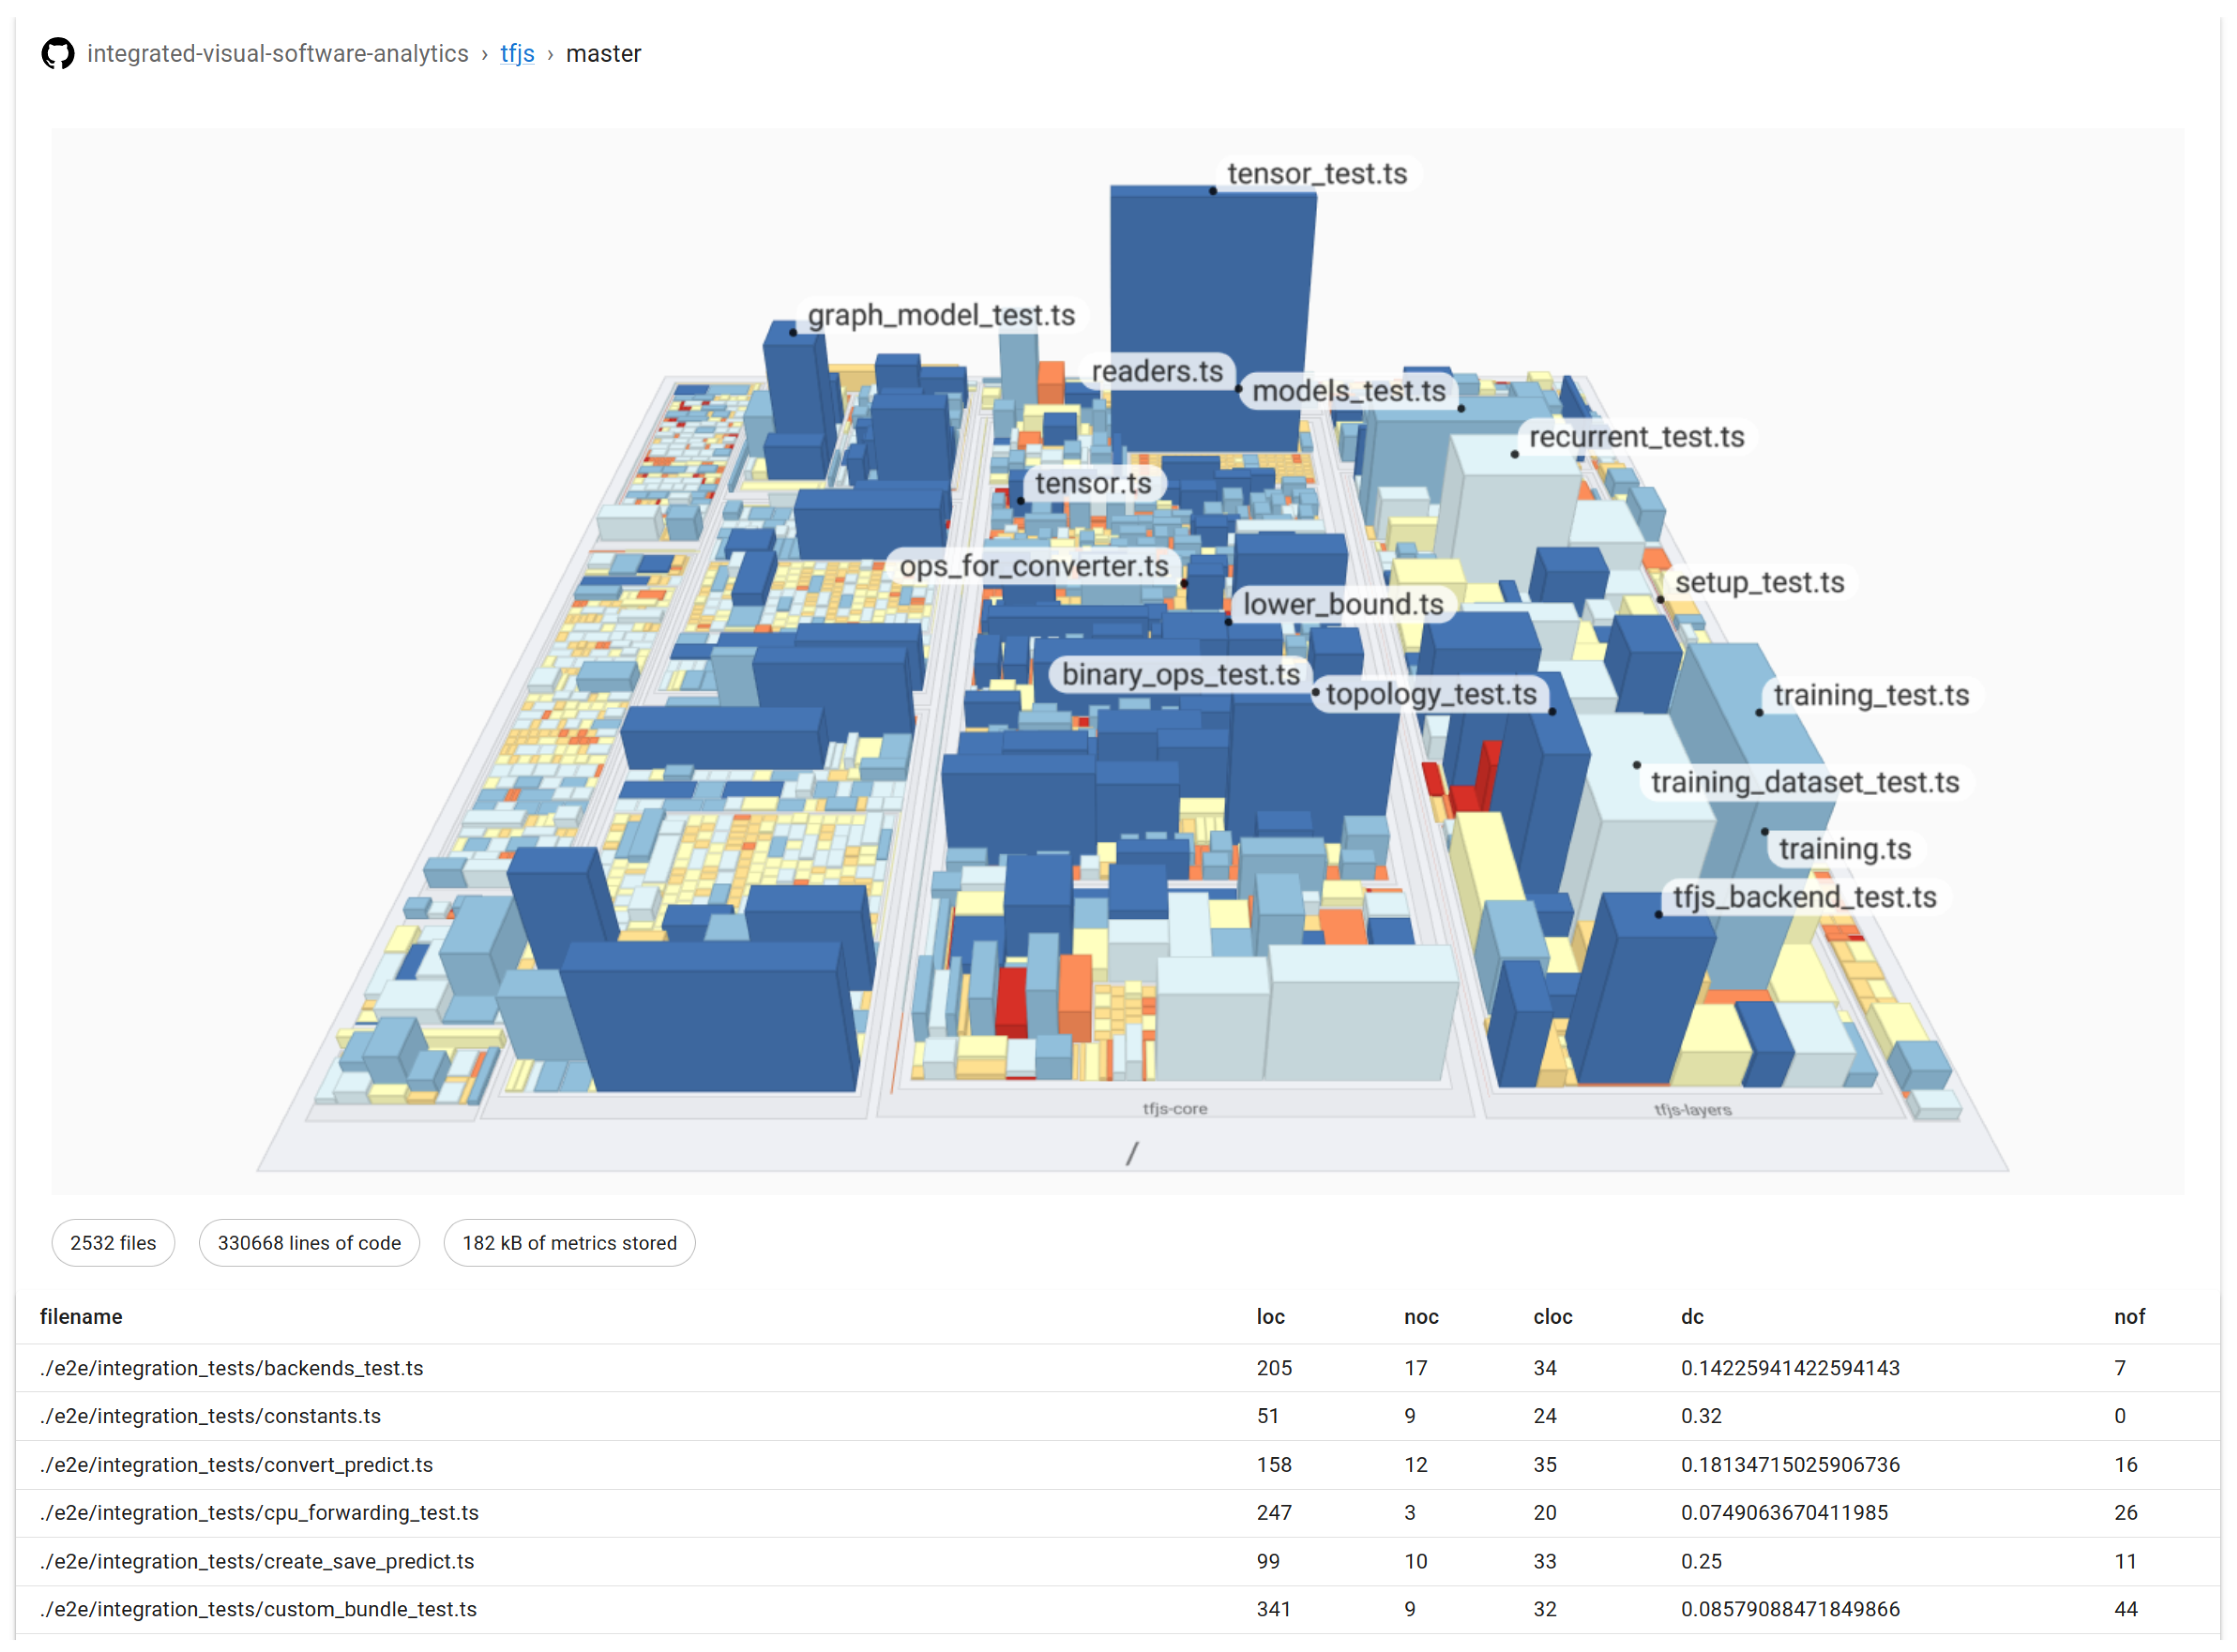
We prototypically implemented the proposed approach as an open source project on GitHub. It is available within the project github-software-analytics-embedding (https://github.com/hpicgs/github-software-analytics-embedding, accessed on 16 January 2024). Additionally, we provide the GitHub Action on the market place (https://github.com/marketplace/actions/analytics-treemap-embedding-action, accessed on 16 January 2024). Adding this action to a repository enables the integration of the prototypical TypeScript source code metrics for new commits. An example client (https://hpicgs.github.io/github-software-analytics-embedding, accessed on 16 January 2024) that is built with React is hosted on GitHub Pages (Figure 4).
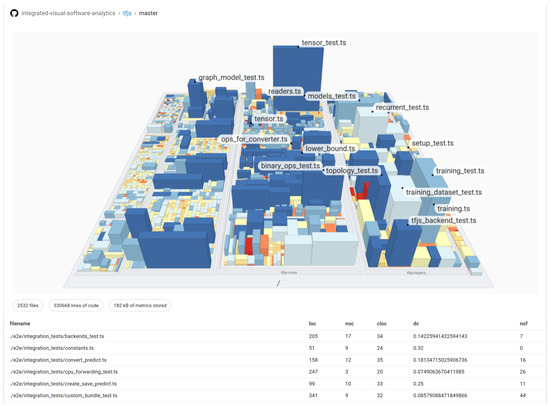
Figure 4.
A screenshot of the prototypical client, showing the TensorFlow.js project. The number of lines of code (LoC) is mapped to weight, the number of functions (NoF) is mapped to height, and the density of comments (DoC) is mapped to color, ranging from inconspicuous (blue) to conspicuous (red).
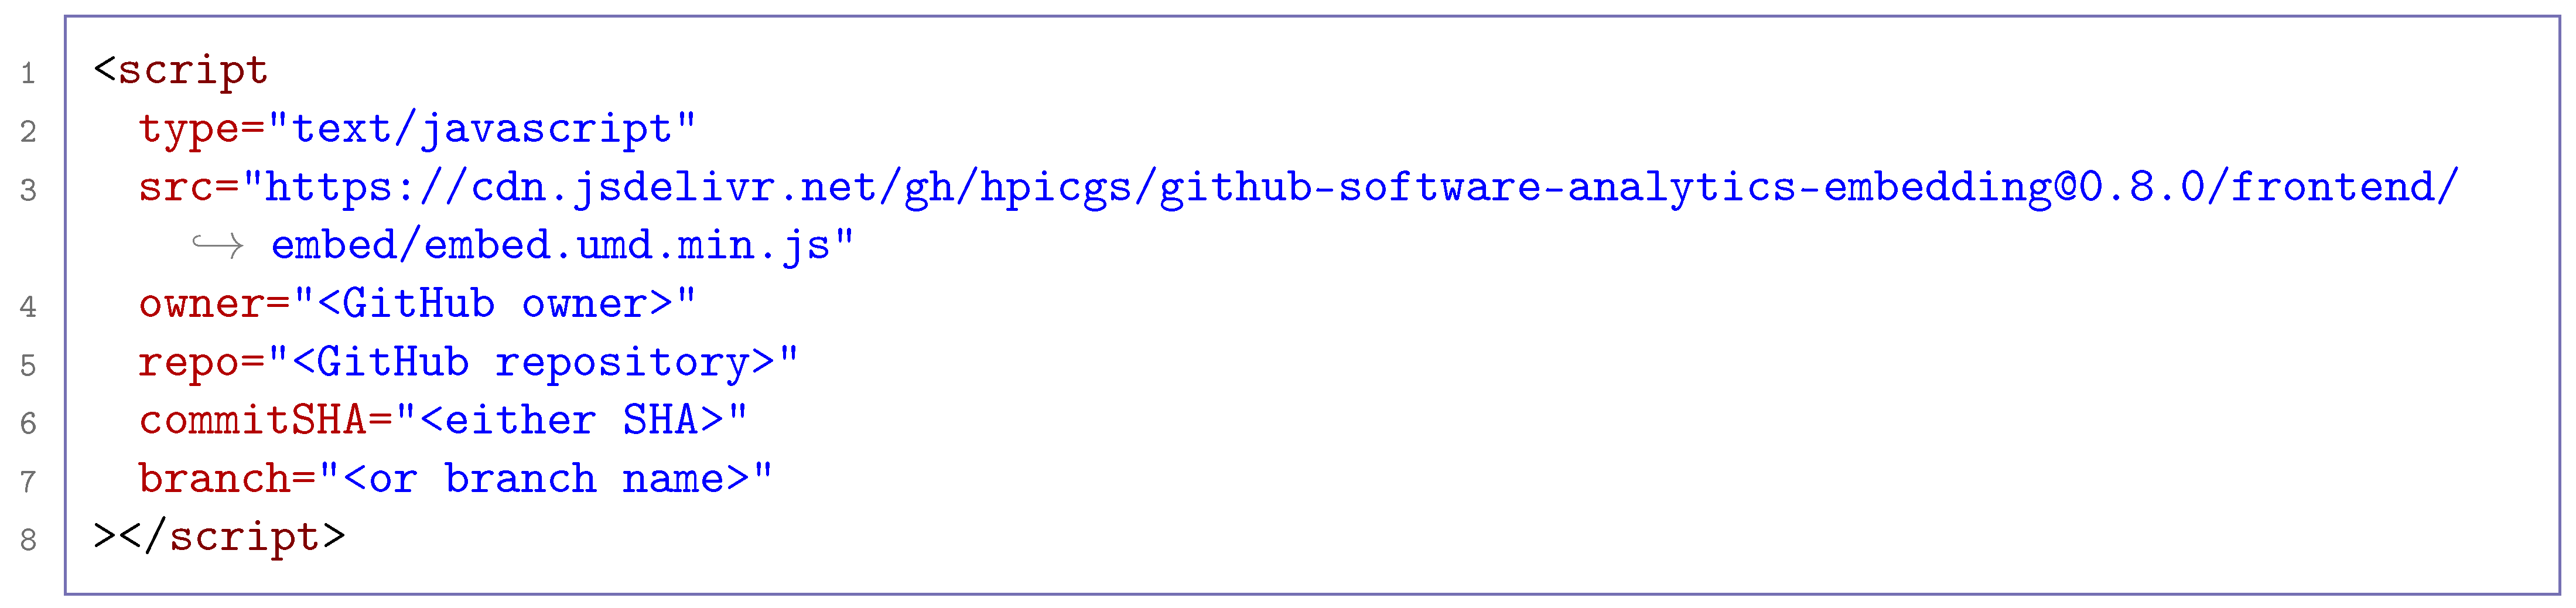
However, the client could also be embedded on any self-hosted web page (such as GitHub pages) using just an HTML script tag (Figure 5). Our prototypical analysis module is written in TypeScript. We decided to use TypeScript as a programming language because it provides first-citizen support for TypeScript code analysis using the TypeScript compiler API. The analysis code first creates an abstract syntax tree (AST) for each TypeScript file in the specified repository path. Then, the AST is used for static source code analysis. We decided to focus on a few simple software metrics, which include:
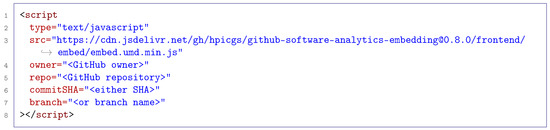
Figure 5.
HTML script tag that loads the client and initializes the visualization with the given GitHub project and commit.
- Lines of Code (LoC);
- Number of Comments (NoC);
- Comment Lines of Code (CLoC);
- Density of Comments (DoC);
- Number of Functions (NoF).
The LoC metric returns the total number of source code lines a source file contains. NoC counts the occurrence of comments, counting both single-line comments and multi-line comments as one, while CLoC focuses on the code lines comments take up in a file. A single-line comment would therefore count as one, while multi-line comments would count as their respective number of lines. The DoC is calculated by dividing the sum of CLoC and LoC by the CLoC. The number of functions (NoF) counts the number of method declarations and function declarations within a source code file.
4. Evaluation
We integrated our approach as GitHub Action into 64 open source TypeScript projects of various sizes. Then, we benchmarked the performance of this action and resource consumption within the git repository. Specifically, we compared the transmission size of a single metric blob, the pure metric calculation time for all TypeScript files in the repository, the total execution time of our GitHub Action, and an extrapolated metric blob memory consumption when used for every commit on the “main” branch (the main branch is a placeholder identifier for the mainly used branch in the project; it may be named differently, such as master, dev, or develop). Thereby, the integration process consisted of forking and adding the GitHub workflow file to each of the repositories, which took approximately two minutes per project.
4.1. Case Study
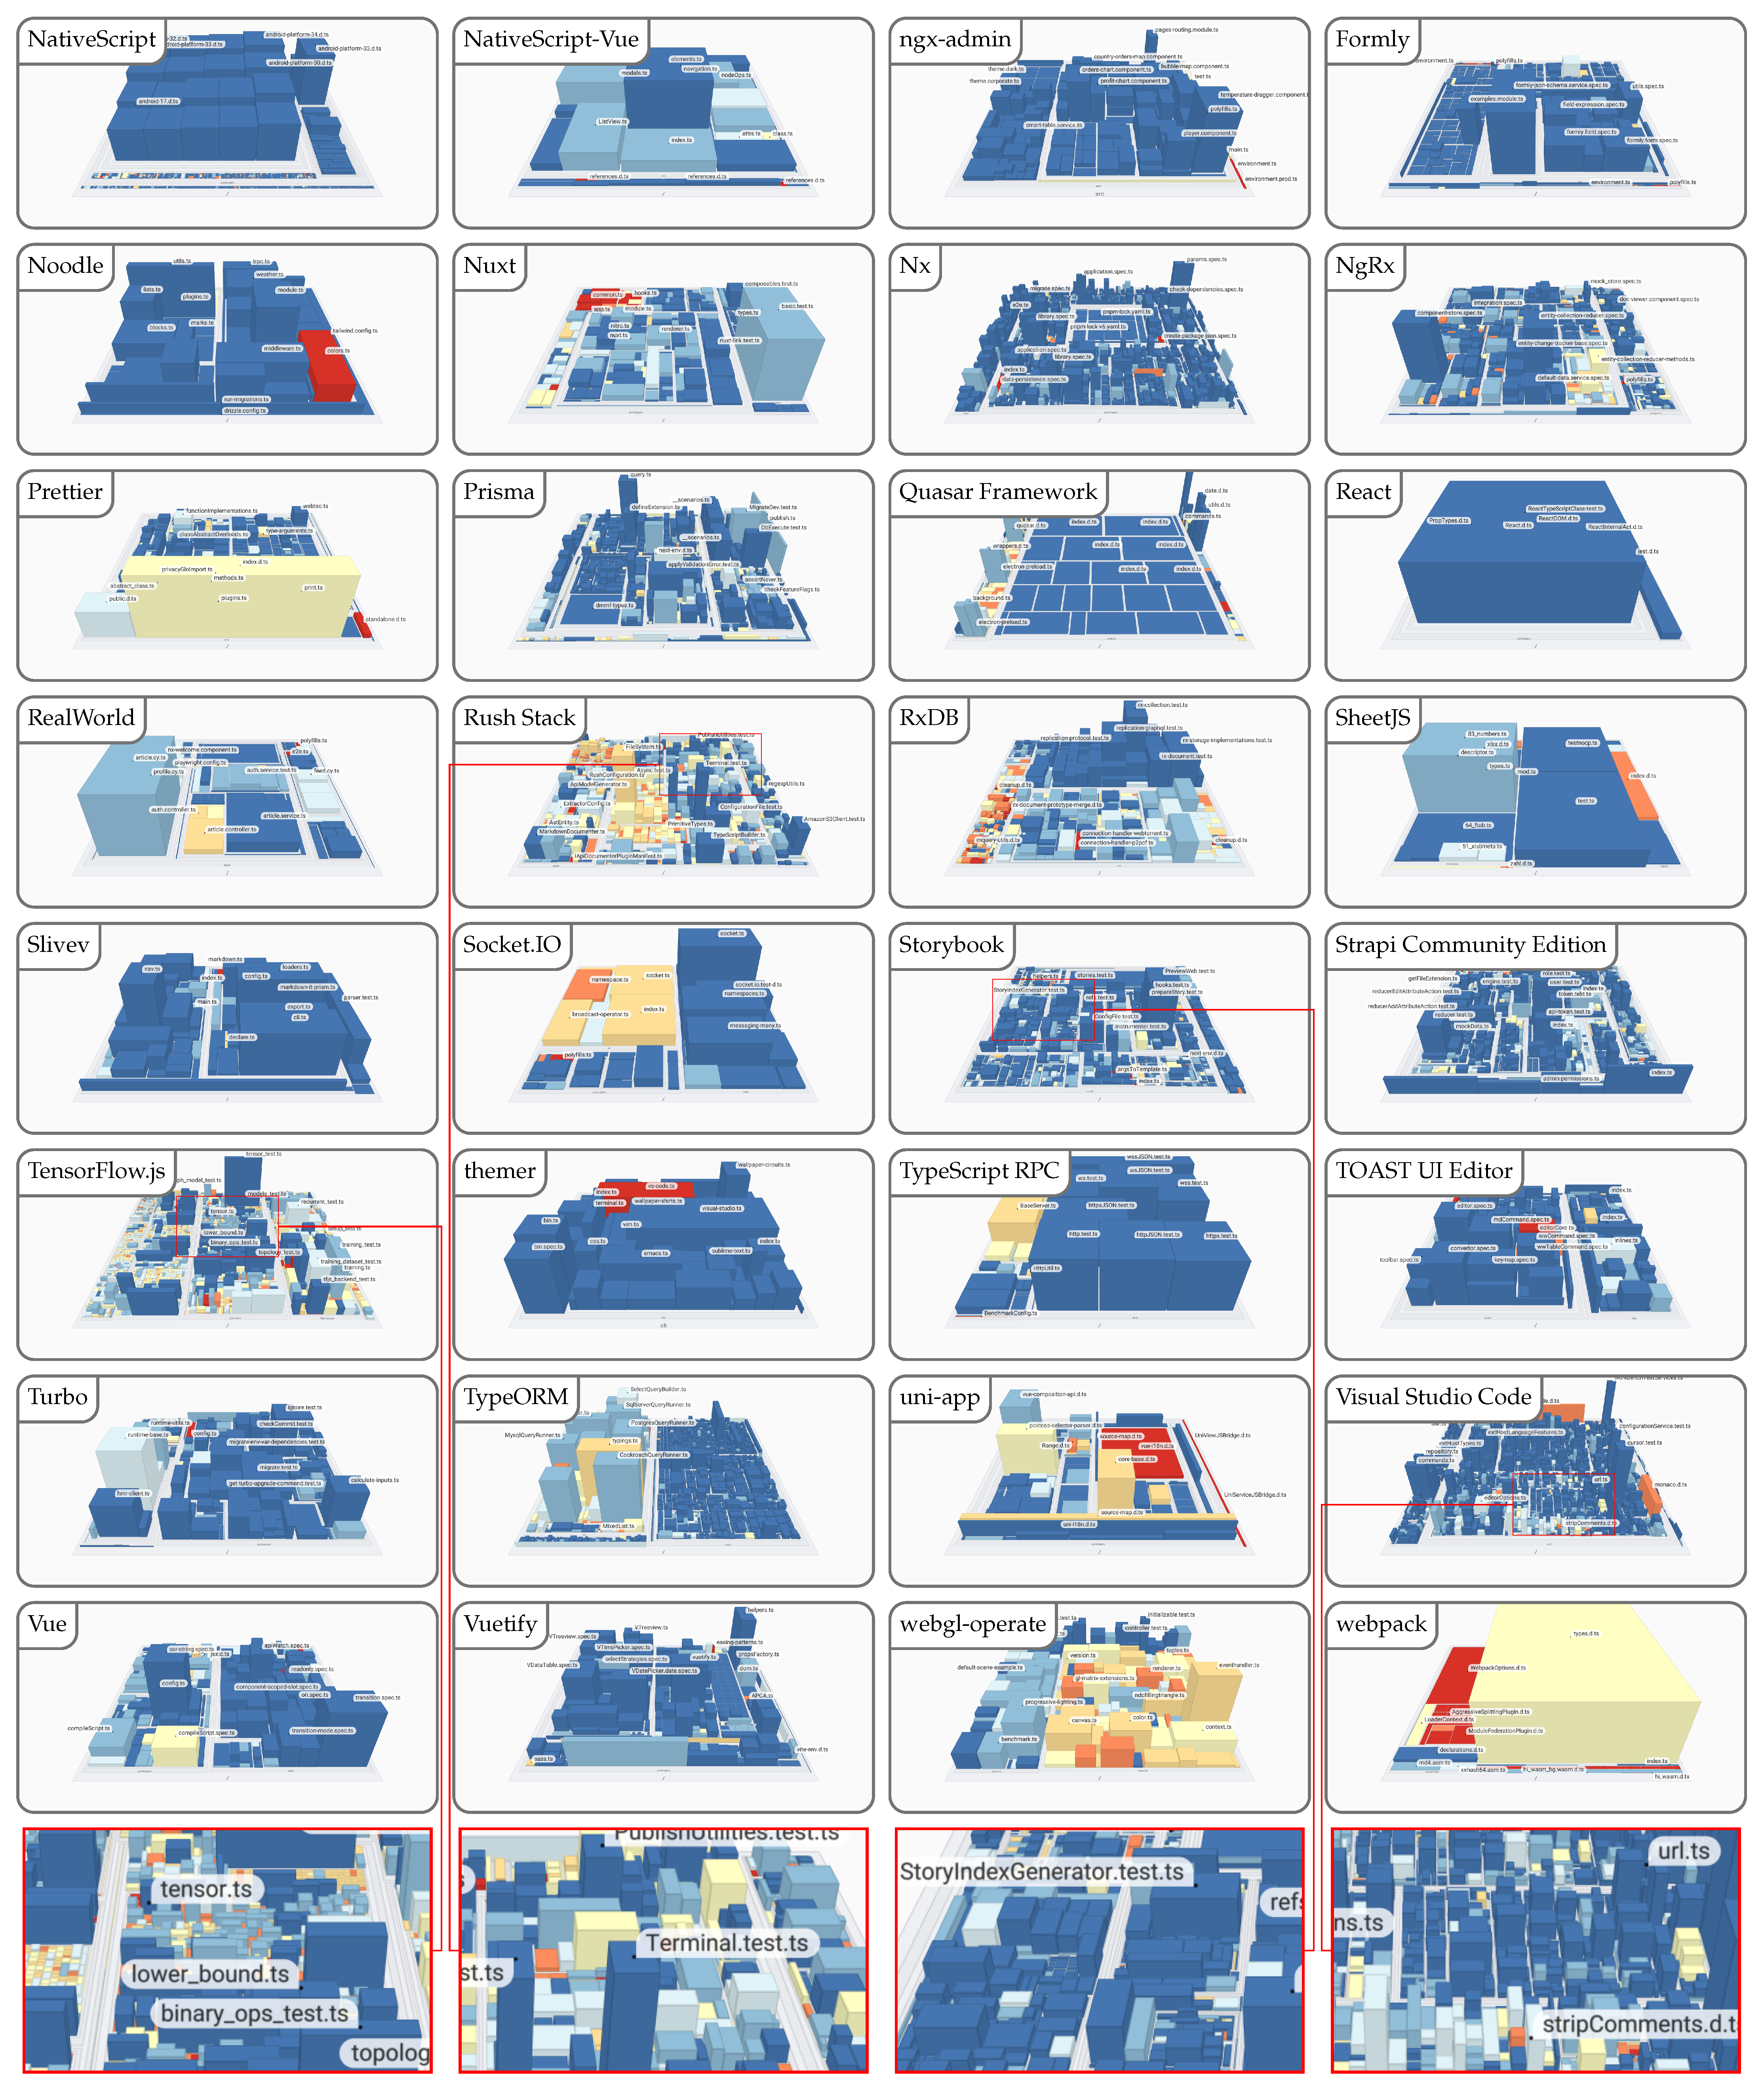
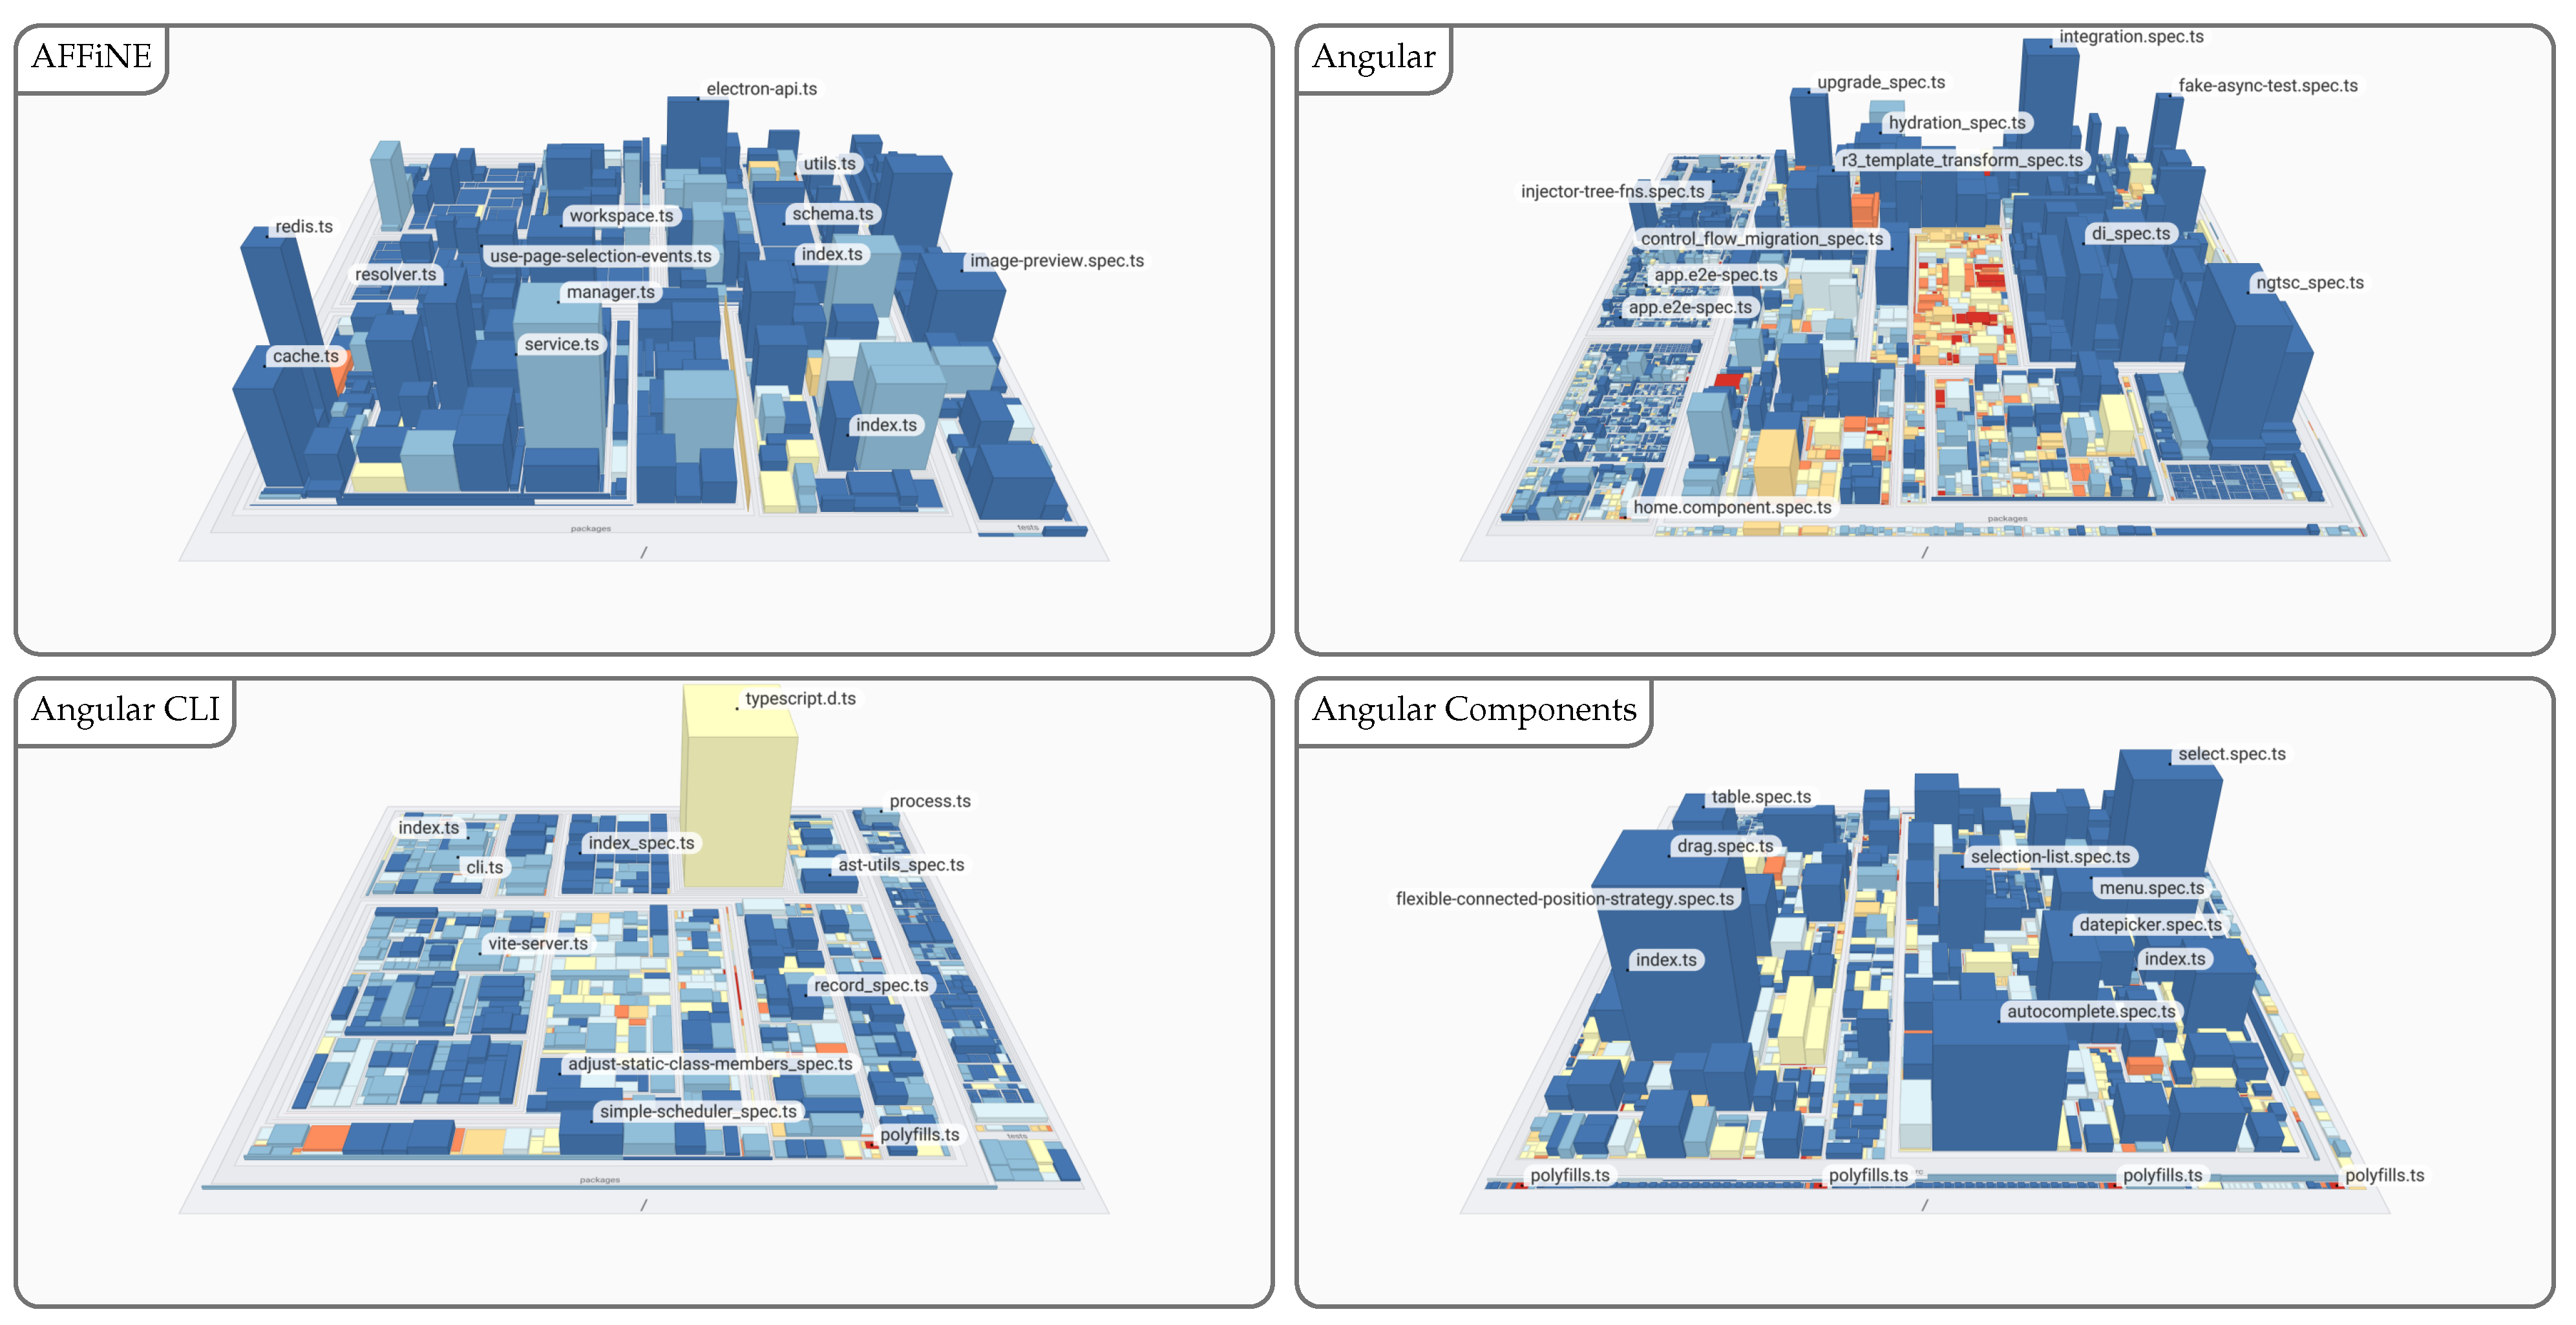
The projects were chosen by their use of TypeScript as one of their programming languages and were either known to the authors or are popular within the community (see details in Table A1 and Table A2). These projects differ largely in size, application area, and development processes. The only common characteristic is the chosen programming language is TypeScript or the availability of TypeScript typings, i.e., that the project contains .ts files. The sizes of the projects range from only a couple of files with a few hundred lines of code to almost 35 k source code files with above 6.5 M lines of code. Four example projects are highlighted in Table 1 and Figure 6; the remainder are available in the appendix, supplemental material, and online prototype (Table A1 and Table A2, Figure A1 and Figure A2).

Table 1.
Excerpt of the TypeScript repositories used for the evaluation. The number of commits relates to the observed branch. The number of files represent the number of TypeScript source code files in the most current commit on this branch. The lines of code (LoCs) are the lines of code from the TypeScript source code files. The overall share of TypeScript to the other programming languages (% TS) is the self-declaration of GitHub and is a rough estimate. The full list is provided in Table A1 and Table A2.
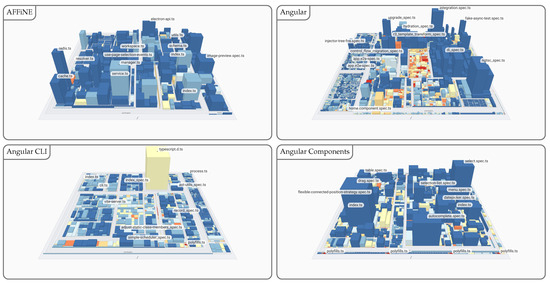
Figure 6.
Excerpt comparison of TypeScript projects with increasing size and complexity using a software map visualization. The number of lines of code (LoC) is mapped to weight, the number of functions (NoF) is mapped to height, and the density of comments (DoC) is mapped to color, ranging from inconspicuous (blue) to conspicuous (red). The full overview is provided in Figure A1 and Figure A2.
4.2. Repository Memory Impact
We measure memory footprint by the size of the base64-encoded metrics file response of the API, although it may be stored compressed within the git repository. The memory footprint of our analysis of a single commit scales linearly with the number of files within a project (Figure 7). This is to be expected, as each file in the repository is represented through a single line in the metrics file, where each line stores the numerical values of each metric with a strict upper bound on the character length. The memory footprint seems rather high for large software projects such as Angular or Visual Studio Code, each having a couple of hundred kilobytes per commit. However, smaller projects can profit from a low-consumption software analysis component. Furthermore, the per-commit blob size is a trade-off between a full CSV file of all files and their metrics and only a file for all changed files. While the former approach allows all metrics for all files to be fetched at once, which is especially suitable for visualization, the latter approach allows for a much smaller memory footprint and is considered a default approach in software analytics [24]. However, providing a full visualization for the latter approach results in a multitude of requests.
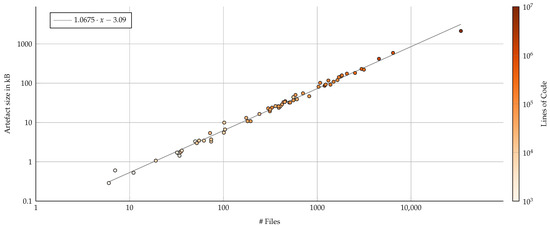
Figure 7.
Emory impact of the metric file blob in kB on the repository per commit when measured by number of files (log–log axis). Color represents the number of lines of code as a second visual indicator of correlation. A derived linear regression (gray line) suggests that each file in the repository contributes approximately one kB of base64-encoded metric blob storage per commit.
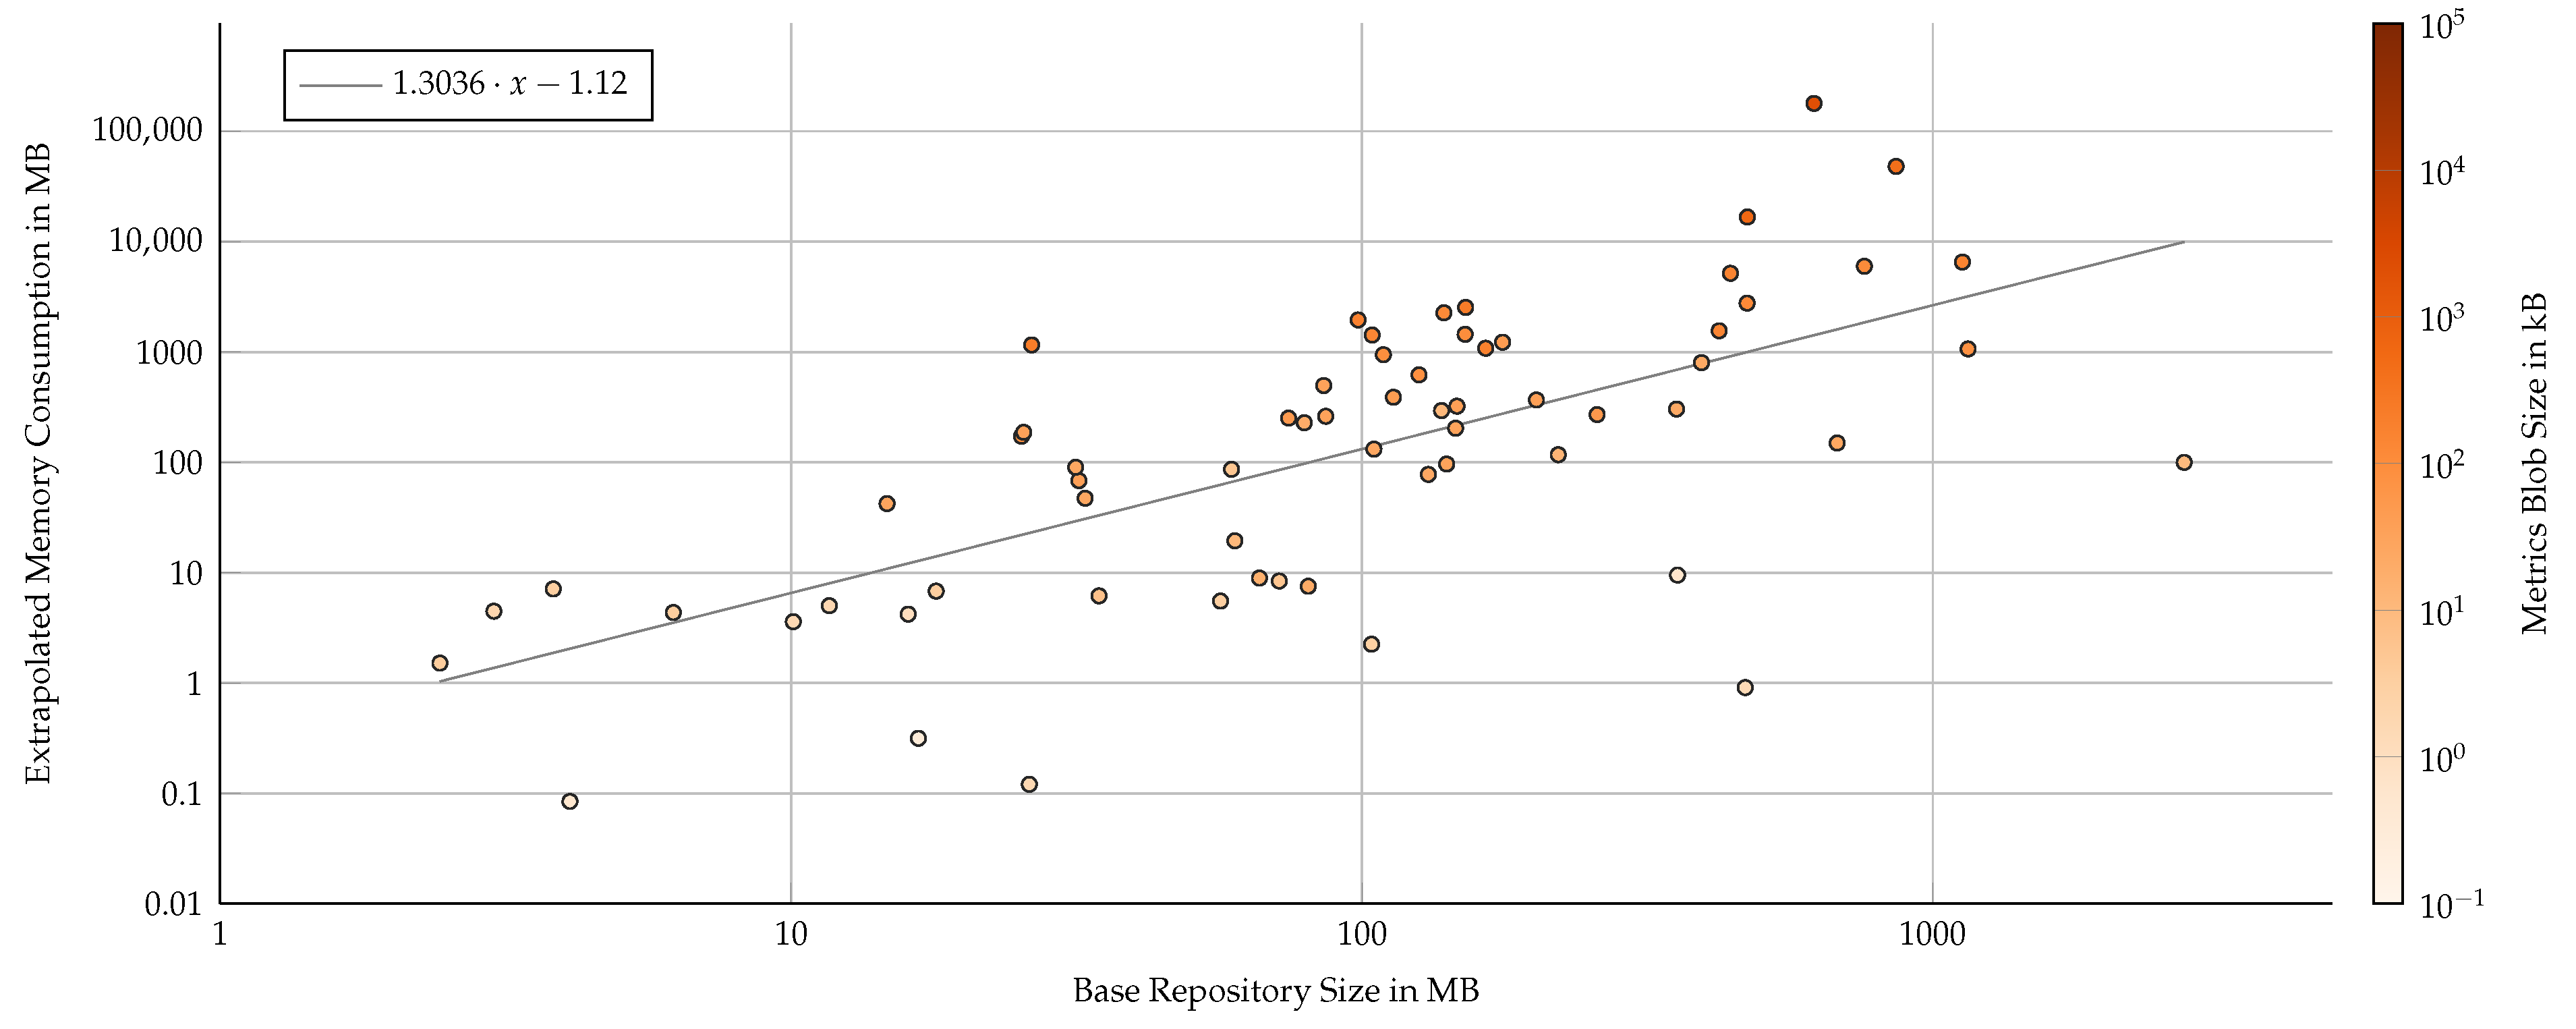
While extrapolating the per-commit blob size to whole repositories naively, i.e., simulating an integration of our approach from the first commit, the proposed technique shows strong limitations (Figure 8). The simulated extrapolation assumes that each and every commit of the main branch would have its files analyzed and stored within the repository with no data retention policy. As an upper bound, the results indicate a median increase in the repository by a factor two with an absolute increase of 180 MB. This number will be considerably smaller when taking into account (1) the compressed, binary representation of the git blob, (2) a more sensible application of the approach by only major commits instead of every one on the main branch, and (3) differential metric files containing only changed files. Reducing this to an empirically validated factor is a direction for future work.

Figure 8.
Extrapolated repository size impact if every commit of the main branch was augmented with software metrics information, measured by base repository size (log–log axis). Color represents the per-commit metric blob size as a second visual indicator. A derived linear regression (gray line) suggests that a repository would increase its size by 1.3-fold, i.e., the final size would have factor of 2.3. However, the spread is rather high and corresponds to the number of commits on the main branch of a repository.
4.3. CI Execution Time Impact
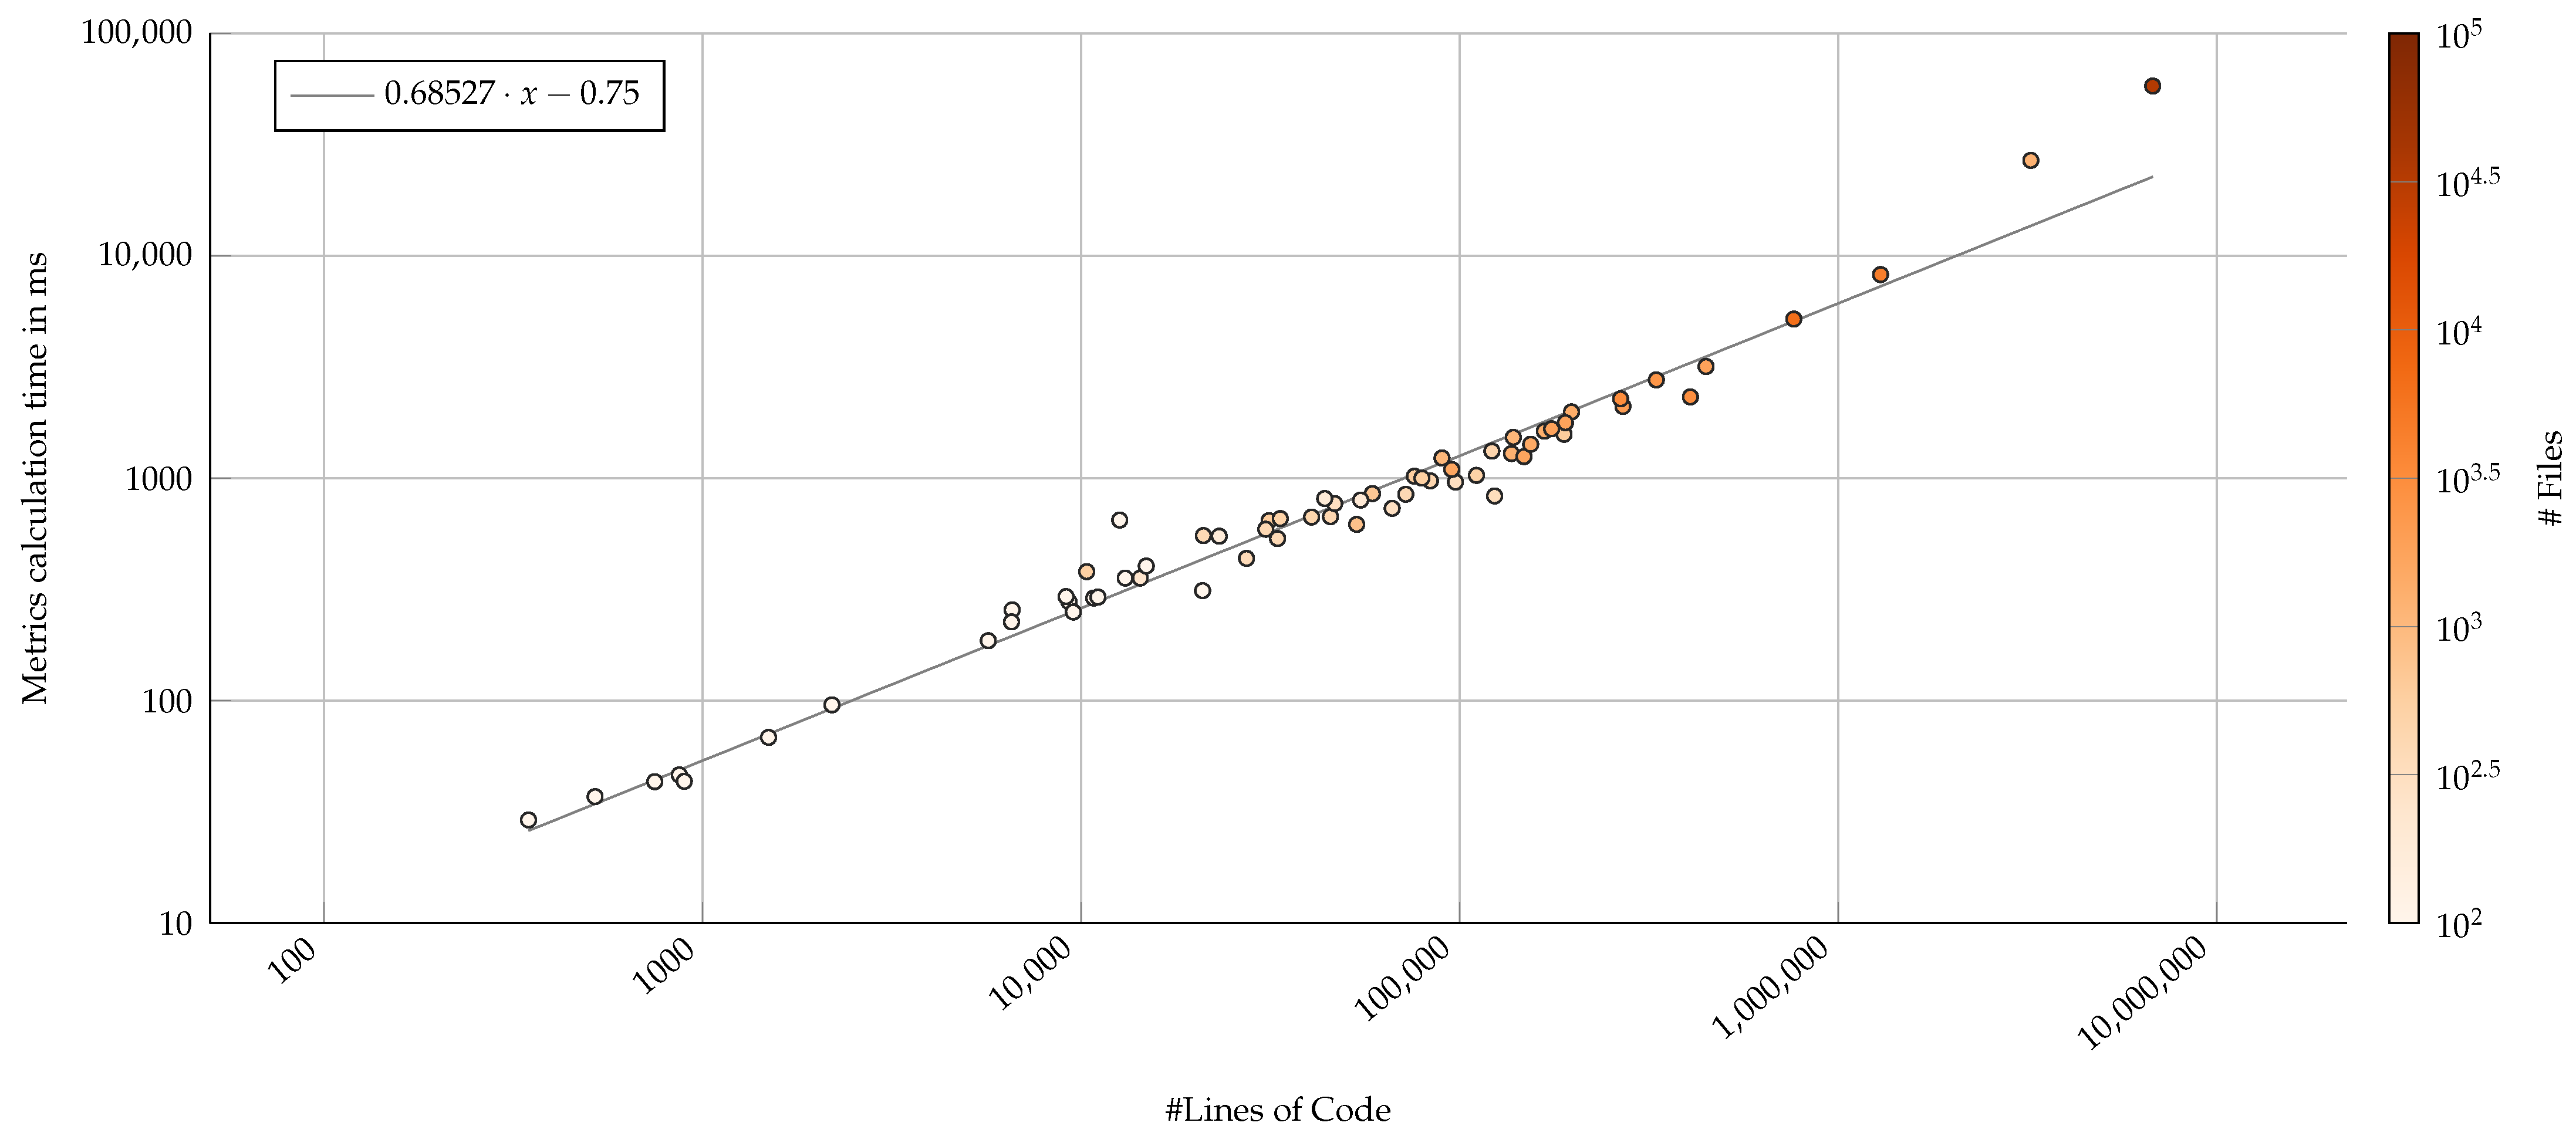
The time our metrics computation took does not scale linearly with the lines of code of a project (Figure 9). However, even for large projects such as Visual Studio Code and Angular, the time to measure all files is limited to a few seconds (up to 8.2 s for Visual Studio Code). The maximum measured time was approximately 58 s for the Definitely Typed project. Considering the overall execution time of the GitHub Action (Figure 10), the process does not seem to scale linearly by neither lines of code nor number of files. However, for projects below 1,000,000 LoC or below 10,000 files, this process does not run longer than 10 s.
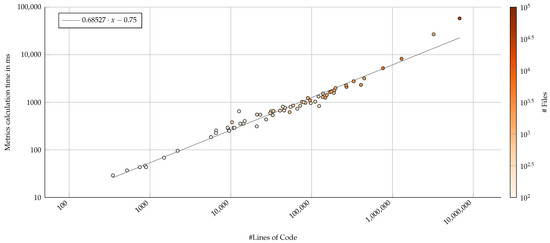
Figure 9.
Run-time performance impact of the proposed software analysis component, measured by lines of code (log–log axis). Color represents the number of files as a second visual indicator that the analysis correlates with number of files as well. A derived linear regression (gray line) suggests that the analysis component does not scale linearly with the project size.
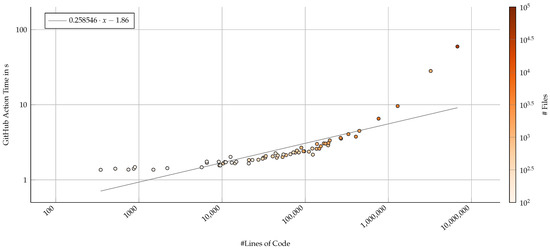
Figure 10.
Run-time performance of the full GitHub Action that includes the proposed software analysis component and metrics blob storage, measured by lines of code (log–log axis). Color represents the number of files as a second visual indicator that the analysis correlates with number of files as well. A derived linear regression (gray line) suggests that the analysis component does not scale linearly with the project size.
4.4. Practical Considerations and Recommendations
We conclude that the general runtime and repository size overhead is sensible for small and mid-sized open source projects. The proposed approach in its current state—prototypical, unoptimized, and limited in features—does scale for open source projects up to medium size. An example project would be Angular CLI, which comes with 14.5 k commits, around 1 k files and above 100 k LoCs. The corresponding memory and runtime impact would be 3 s of GitHub Action time (of which 1.5 s is the metrics computation) and 102 kB of base64-encoded metric blob size, which would result in a doubled repository size when measured for every tenth commit on the main branch since the very start of the project. Within our sample of 64 TypeScript projects measured by memory impact when measured for each commit on the main branch, Angular CLI is larger than 54 projects and smaller than 9 projects, placing it in the 86th percentile. Thus, the majority of projects are smaller and thus applicable for our proposed approach.
5. Discussion
This analysis, however, comes with multiple assumptions and design alternatives. As such, the measurements and results are specific to the chosen implementation and environment, i.e., GitHub and its Actions, such as CI; git; the GitHub API; the TypeScript language; individual metrics analysis components; and the integration and assumed usage by open source developers. This comes with a number of threats to the validity to our results, as well as points for discussion on limitations through the specific environment we have chosen and a broad set of opportunities for extensions to the proposed approach.
5.1. Threats to Validity
We identified several potential threats to the validity of the results, covering both the runtime analysis and the storage consumption analysis.
5.1.1. Runtime Analysis
For example, one limitation is our choice of a prototype implementation for the metrics computation rather than employing existing, established tooling. This approach allowed for a focused, controlled, and low-profile metrics computation component to be used for the proposed approach. However, we see our measured timings as some kind of lower bound for the execution time of a static source code analysis. Furthermore, the analysis component cannot be considered production-ready by means of stability and available features.
As the analysis component with the specific metrics does not reflect the usual load an actual analysis component would bring into a CI pipeline, the execution time is expected to further increase through computational costs for additional or more complex metrics. We assume that an alternative use of real-world metrics computation tools would increase the measured timings, but not by multiple orders of magnitude. Furthermore, the allocated runners for the CI pose a threat to validity. To properly control for the allocated runners, a study should be conducted with self-hosted runners. However, these runners are the default runners that would be used by a majority of open source projects.
5.1.2. Storage Consumption Analysis
Regarding the storage consumption analysis, one threat is the inaccuracy in measuring the metrics’ blob size. We measured the base64-encoded API response string, which represents an upper bound for the required storage within the repository. Furthermore, the employed extrapolation on the assumed storage is based on unknown actual usage scenarios. For one, we suggest using a GitHub Action that is triggered on each commit on a set of target branches. This may or may not be a sensible configuration. However, this configuration largely influences the overall memory consumption over the history of a software project. Furthermore, the extrapolation assumes that the metrics’ blob files are constant in size, which correlates with the number of files in a repository being constant. This is a factor that will likely change over the history of a software project.
5.2. Limitations
An application of our approach to further open source projects on GitHub may be subject to technical limitations, for example, overcoming scalability issues, handling advanced git workflows, and facing security issues.
5.2.1. Scalability
Scalability for the proposed approach is a main topic as GitHub wants to ensure continuous service for all its users, which concerns available space per repository and execution time for the shared GitHub Action runners. While the default timeout for the shared runners is at six hours (https://docs.github.com/en/actions/learn-github-actions/usage-limits-billing-and-administration, accessed on 16 January 2024) and not likely to be a direct limitation based on our tested open source projects, a more comprehensive analysis covering multiple commits within one GitHub Action may run out of time. For those cases, GitHub allows one to register and use self-hosted runners (https://docs.github.com/en/actions/hosting-your-own-runners/managing-self-hosted-runners/about-self-hosted-runners, accessed on 16 January 2024). Likewise, switching to an external CI service that would also allow one to run the analysis component—available using Docker—may come with higher limits on computation. As another alternative, a developer of the project could execute the Docker image on their local machine.
Furthermore, git repositories on GitHub have a soft limit in size (https://docs.github.com/en/repositories/working-with-files/managing-large-files/about-large-files-on-github, accessed on 16 January 2024). Executing the metrics computation process for each and every commit and storing the full dataset in an ever-growing software repository is bound to reach those limits. Mitigations include different directions: (1) switching to an external file storage, such as git LFS, external databases, or foreign git repositories (https://github.com/gitrows/gitrows, accessed on 16 January 2024); (2) integrating data-retention policies and removing metrics data when superseded or obsolete; and (3) thinning out the measured commits and focusing on more important commits such as pull requests and releases.
5.2.2. Advanced Git Workflows
As a distributed version control system, git allows for more advanced usage scenarios to advance and handle the history of a software project. One such feature is the rebase, and another would be a commit filter, but the overall category is a history rewrite. Such a rewrite would derive new commits from existing ones while invalidating the latter ones. Currently, our proposed approach would naively handle such rewrites by recomputing the new commits as if they were normal commits. Any invalidation of stored metrics data for the obsolete commits is currently missing. Specific to this issue, but also applicable in a general sense, would be a handling of obsolete metrics data through the git garbage collector.
5.2.3. Security Considerations
Furthermore, the proposed public, side-by-side availability of software metrics is subject to security considerations, as the measured software may contain sensitive information. The targeted use cases for our approach are open source repositories that want to apply lightweight software analysis on their already public source code. This public availability makes these repositories subject to external source code mining on a regular basis [55]. Anyone with software mining tools can download the source code, derive software metrics, host them anywhere, and analyze them at their discretion. We argue that any security-related attack vector is introduced when publishing the source code and not when making individual software metrics available. On the contrary, with our approach, we connect to the original idea of developing source code publicly. A broad community can participate and ensure a more healthy software development process and thus a more healthy software project. One adaption to our approach to protect the measured software data is to use an external database. This adaption, however, would prevent other use cases such as public availability of visualizations of the software project. Security considerations in the area of open source development remain their own field of study [56,57].
5.2.4. Extensibility
The current state of the approach and prototype allows for a number of extensions in various directions, namely other modes of integration into the development process, other supported languages and supported metrics, available visualization techniques, and the types of stored artifacts. The current, narrow focus on single implementation paths limits the applicability of the approach considerably, as it is specifically designed and implemented to work for the CI process of git repositories of the TypeScript parts of open source projects hosted on GitHub, where a small set of static source code metrics are derived and later visualized using the software map visualization technique. Applying further state-of-the-art approaches in these directions would increase the approach’s fit for more use cases, application scenarios, and software projects.
5.2.5. Modes of Integration into Development Process
To allow for a low-threshold integration into an open source project’s development process, we proposed the integration into the GitHub CI processes using GitHub Actions on a single commit at a time. However, there are further modes through which this software analysis component can be integrated into the development process. For example, the trigger can be changed to trigger on pull requests or releases, or even on manual start through a contributor or even a software component. In the end, this storage can be considered a caching mechanism where the the cache can be populated by triggering the execution of the software analysis component and storing the data through the GitHub API. As an alternative to the GitHub API, it is feasible to use the git API directly and pull and push the according refs directly. This would also render this approach available to other software project management platforms and even plain hosting of git archives. Furthermore, each analysis process is not technically limited to measuring one single commit in isolation. This allows for (1) an extension to handle multiple individual commits and whole commit ranges within a single analysis process and (2) the use of more information sources in addition to the checked out commit, such as issue databases, development logs, CI logs, or the source code of other commits. An extended analysis, however, would increase the computation time considerably. Specific to GitHub, there is currently a six-hour-long time limit for shared runners, which would allow for such an increased amount of analysis.
5.2.6. Supported Programming Languages
In addition to the integration into GitHub and the development process, the approach and prototype could be adapted to support more languages. As the implementation details surrounding the analysis component do not rely on any specific language—they are designed to be language agnostic—supporting further programming languages is straight-forward and usually implemented using language-agnostic tools. Allowing for multiple programming languages is also important, as software projects likely use multiple languages within one repository [58].
5.2.7. Supported Metrics
For demonstration purposes, we focused on static source code analysis metrics for our analysis component. However, the design and implementation of the prototype specifically allows one to use a broad range of software analysis tools and custom implementations, and thereby languages as well. More importantly, a broad view on the state and evolution of a software project comes with metrics explicitly covering system dynamics and the evolution of metrics over time. As such, the current approach to store file-focused software metrics will become obsolete, and more diverse storage formats need to be used. However, for a low-threshold access to those metrics and no further dependency to third-party services, we suggest retaining file-based storage within the git repository.
5.2.8. Visualization Approaches
While our current prototype is built upon static source code analysis metrics and the software map visualization technique, the underlying idea of fetching the software metrics directly from the repository does not limit the use of specific software visualization techniques, e.g., source-code-similarity-based forest metaphors [59,60]. More specifically, the integrated software analysis data make up a specific kind of database that each technique should be adoptable to. Potential limitations come from the metrics measured and chosen file formats, both of which can be chosen as desired by our proposed approach. This flexibility enables contributors and developers to tailor the representation of their project and researchers to test novel visualization techniques on already measured software projects.
5.2.9. Stored Artifacts
Similar to the supported programming languages, metrics, and visualization techniques, the files stored as blobs within the git software repository are not limited to the proposed approach of storing software metrics. Instead, there are only a couple of limiting factors to the blobs stored within the repository, which are the base blob size, the overall repository size, the access speed through APIs, and possibly rate limits to ensure fair use of the APIs. This allows for a more diverse use of the available storage to augment software repositories. One example is to skip storage of the software metrics and to derive and store a static image of the software system instead. Although more complex, this corresponds to the creation and storage of project badges—such as the shields.io service (https://github.com/badges/shields, accessed on 16 January 2024)—directly within the software repository.
6. Conclusions
When a software development team wants to integrate software analysis into their project, selecting tools or services is a trade-off which usually results in (1) no control over metric computation or (2) no persistent availability of low-level analysis results. We proposed an approach to augment git commits of GitHub projects with software analysis data in the example of TypeScript projects and static source code metrics. The analysis is performed as part of a GitHub Actions CI pipeline, whose results are added to the git project as individual blobs. These results are thus persistently stored within the project and accessible through standard git interfaces and the GitHub API. The used analysis tool and visualization technique are designed to be exchangeable. The requirements to satisfy are the availability of analysis tools for Docker containers and the storage of software data within the git repository. To demonstrate this approach, we visualized GitHub projects using a basic React client and software maps as the visualization technique. We further performed an evaluation on 64 open source GitHub projects using TypeScript as their main or auxiliary language. The analysis suggests that small and mid-sized software repositories experience little impact to their CI runtime and repository size, even with extensive use of the proposed approach.
As such, we envision primarily a low-threshold and low-cost adoption of our approach for small and mid-sized open source projects that are otherwise struggling to set up their own software analysis pipelines, e.g., using external services. With our approach, we strive for direct access to abstract software information for a broad range of open source projects and their public representation to allow for a quick overview and a gestalt-providing component. Directly concerning open source projects and their development, we hope to increase a project’s “ability to be appealing” [61] to both existing and new collaborators. We further argue for versatility and flexibility of the underlying approach to store commit-related data directly within the git repository. Concerning the MSR community, such a broad integration of software metrics into the git repository would change the availability and use of the data for novel analyses and replicability of published results. Extrapolating from this, large-scale evaluations of source code metrics can profit from already computed metrics within each repository through our approach [62]. Furthermore, dedicated software analysis data repositories can be either derived directly from the software repositories or these repositories can be considered distributed datasets instead [55].
For future work, we envision a replacement of the analysis component for one with broad support for different programming languages and software metrics. As such, we see the other areas of software metrics—dynamic metrics, process metrics, developer metrics—as well as higher-level key performance indicators that should be available as well. Next to software measurements, the proposed approach can be used to store and provide the derived visualization artifacts [39]. Further, we consider to also allow developers perform the analyses on their machines and commit the results alongside their changes into the repository. This would allow for both CI and developers to perform measurements and distribute the workload, e.g., when computing measurements for whole branches of a project. From an MSR researcher’s perspective, augmenting the commits of distributed software projects, for example, through forks, by means of “rooted” repositories (https://github.com/src-d/gitcollector, accessed on 16 January 2024) would provide a greater impact, even with lower impact on overall repository size through reduced copies. In conclusion, augmenting software repositories and providing low-threshold and easily accessible tooling further contributes to visual software analytics as a key component in software development.
Author Contributions
Conceptualization, W.S. and J.D.; software, W.S., J.B. and F.L.; validation, W.S. and D.A.; investigation, W.S. and D.A.; writing—original draft preparation, W.S., J.B. and F.L.; writing—review and editing, W.S., D.A. and J.D.; visualization, W.S. and D.A.; supervision, W.S. and J.D.; funding acquisition, J.D. All authors have read and agreed to the published version of the manuscript.
Funding
This work was partially funded by the Federal Ministry of Education and Research, Germany, through grant 01IS20088B (“KnowhowAnalyzer”).
Data Availability Statement
Conflicts of Interest
The authors declare no conflicts of interest. The funders had no role in the design of the study; in the collection, analyses, or interpretation of data; in the writing of the manuscript; or in the decision to publish the results.
Appendix A
Table A1.
The first half of TypeScript repositories used for evaluation. The number of commits relate to the observed branch. The number of files represent the number of TypeScript source code files in the most current commit on the branch. The lines of code (LoCs) are the lines of code from the TypeScript source code files. The overall share of TypeScript to the other programming languages (%TS) is the self-declaration of GitHub and is a rough estimate. Continuation in Table A2.
| Project | Location | Branch | # Commits | % TS | # Files | # LoC |
|---|---|---|---|---|---|---|
| AFFiNE |  toevery thing/AFFiNE toevery thing/AFFiNE | canary | 5012 | 98.1% | 705 | 58,822 |
| Angular | angular/angular | main | 28,924 | 84.5% | 6438 | 762,820 |
| Angular CLI | angular/angular-cli | main | 14,499 | 94.6% | 1074 | 138,552 |
| Angular Components | angular/components | main | 11,413 | 81.0% | 2074 | 269,875 |
| Ant Design | ant-design/ant-design | master | 26,917 | 99.2% | 822 | 53,436 |
| Apollo Client | apollo-client | main | 12,105 | 98.4% | 313 | 97,443 |
| Babylon.js | BabylonJS/Babylon.js | master | 42,282 | 88.2% | 1829 | 447,296 |
| Bun | oven-sh/bun | main | 8399 | 5.4% | 607 | 188,673 |
| cheerio | cheeriojs/cheerio | main | 2905 | 74.2% | 35 | 13,074 |
| Definitely Typed | Definitely Typed/Definitely Typed | master | 85,867 | 99.9% | 34,067 | 6,769,450 |
| Deno | denoland/deno | main | 10,516 | 22.2% | 1386 | 197,437 |
| Electron | electron/electron | main | 27,898 | 31.1% | 195 | 54,764 |
| Electron React Boilerplate | electron-react-boilerplate/electron- react-boilerplate | main | 1122 | 81.3% | 6 | 520 |
| esbuild | evanw/esbuild | main | 4026 | 4.0% | 19 | 6576 |
| eslint-plugin-import | import-js/eslint-plugin-import | main | 2203 | 0.2% | 50 | 347 |
| Formly | ngx-formly/ngx-formly | main | 1790 | 98.8% | 608 | 31,366 |
| freeCodeCamp.org’s open-source codebase and curriculum | freeCodeCamp/freeCodeCamp | main | 34,553 | 64.1% | 390 | 33,026 |
| github-software-analytics-embedding | hpicgs/github-software-analytics- embedding | dev | 164 | 1.6% | 11 | 748 |
| GraphQL Code Generator | dotansimha/graphql-code-generator | master | 8130 | 83.4% | 437 | 83,693 |
| Hoppscotch | hoppscotch/hoppscotch | main | 5127 | 61.5% | 587 | 75,922 |
| Hydrogen | nteract/hydrogen | master | 2372 | 68.7% | 36 | 5685 |
| ice.js | alibaba/ice | master | 3067 | 83.4% | 503 | 33,575 |
| Ionic | ionic-team/ionic-framework | main | 13,427 | 56.2% | 1034 | 89,790 |
| Joplin | laurent22/joplin | dev | 10,687 | 66.5% | 1795 | 190,253 |
| mean stack | linnovate/mean | master | 2232 | 51.3% | 33 | 868 |
| Mermaid | mermaid-js/mermaid | develop | 9152 | 30.6% | 175 | 23,159 |
| Mitosis | BuilderIO/mitosis | main | 1514 | 98.3% | 420 | 45,541 |
| Monaco Editor | microsoft/monaco-editor | main | 3327 | 36.4% | 329 | 123,664 |
| MUI Core | mui/material-ui | master | 23,644 | 55.9% | 1646 | 95,283 |
| Nativefier | nativefier/nativefier | master | 1288 | 87.5% | 62 | 9289 |
| NativeScript | NativeScript/NativeScript | main | 7345 | 85.9% | 1200 | 3,226,971 |
| NativeScript Angular | NativeScript/nativescript-angular | master | 1867 | 92.0% | 385 | 21,038 |
Table A2.
The second half of TypeScript repositories used for evaluation. The number of commits relate to the observed branch. The number of files represent the number of TypeScript source code files in the most current commit on the branch. The lines of code (LoCs) are the lines of code from the TypeScript source code files. The overall share of TypeScript to the other programming languages (%TS) is the self-declaration of GitHub and is a rough estimate. Continuation from Table A1.
| Project | Location | Branch | # Commits | % TS | # Files | # LoC |
|---|---|---|---|---|---|---|
| NativeScript Command-Line Interface | NativeScript/nativescript-cli | main | 6470 | 26.7% | 515 | 110,724 |
| NativeScript-Vue | nativescript-vue/nativescript-vue | main | 72 | 79.2% | 32 | 2197 |
| NgRx | ngrx/platform | main | 1906 | 87.3% | 1230 | 136,981 |
| ngx-admin | akveo/ngx-admin | master | 554 | 67.2% | 242 | 14,329 |
| Noodle | noodle-run/noodle | main | 651 | 55.1% | 34 | 1494 |
| Nuxt | nuxt/nuxt | main | 5242 | 98.4% | 404 | 30,741 |
| Nx | nrwl/nx | master | 11,218 | 96.7% | 2975 | 406,848 |
| Prettier | prettier/prettier | main | 9026 | 5.8% | 557 | 10,345 |
| Prisma | prisma/prisma | main | 10,256 | 98.2% | 1702 | 147,821 |
| Quasar Framework | quasarframework/quasar | dev | 13,575 | 0.3% | 300 | 66,316 |
| React | facebook/react | main | 16,135 | 0.5% | 7 | 895 |
| RealWorld | gothinkster/realworld | main | 949 | 86.8% | 104 | 6549 |
| Rush Stack | microsoft/rushstack | main | 19,801 | 96.0% | 1315 | 167,304 |
| RxDB | pubkey/rxdb | master | 10,244 | 96.0% | 558 | 79,486 |
| SheetJS | SheetJS/sheetjs | github | 770 | 12.3% | 52 | 12,644 |
| Slidev | slidevjs/slidev | main | 1560 | 66.6% | 101 | 9127 |
| Socket.IO | socketio/socket.io | main | 2008 | 66.2% | 55 | 10,796 |
| Storybook | storybookjs/storybook | next | 56,100 | 69.1% | 1496 | 154,002 |
| Strapi Community Edition | strapi/strapi | develop | 33,413 | 73.6% | 1835 | 174,912 |
| TensorFlow.js | tensorflow/tfjs | master | 6076 | 80.3% | 2532 | 330,668 |
| themer | themerdev/themer | main | 1732 | 98.6% | 74 | 9537 |
| TOAST UI Editor | nhn/tui.editor | main | 362 | 85.8% | 315 | 46,744 |
| Turbo | vercel/turbo | main | 5842 | 8.2% | 359 | 27,344 |
| TypeORM | typeorm/typeorm | master | 5361 | 99.8% | 3150 | 266,117 |
| TypeScript RPC | k8w/tsrpc | master | 419 | 99.3% | 74 | 14,860 |
| uni-app | dcloudio/uni-app | dev | 10,295 | 0.7% | 102 | 11,078 |
| Visual Studio Code | microsoft/vscode | main | 117,393 | 93.7% | 4555 | 1,293,371 |
| Vue | vuejs/vue | main | 3591 | 96.7% | 388 | 72,050 |
| vuejs/core | vuejs/core | main | 5502 | 96.5% | 457 | 121,640 |
| Vuetify | vuetifyjs/vuetify | master | 15,303 | 51.4% | 451 | 40,627 |
| webgl-operate | cginternals/webgl-operate | master | 1844 | 70.3% | 181 | 44,000 |
| webpack | webpack/webpack | main | 16,408 | 0.2% | 72 | 20,931 |
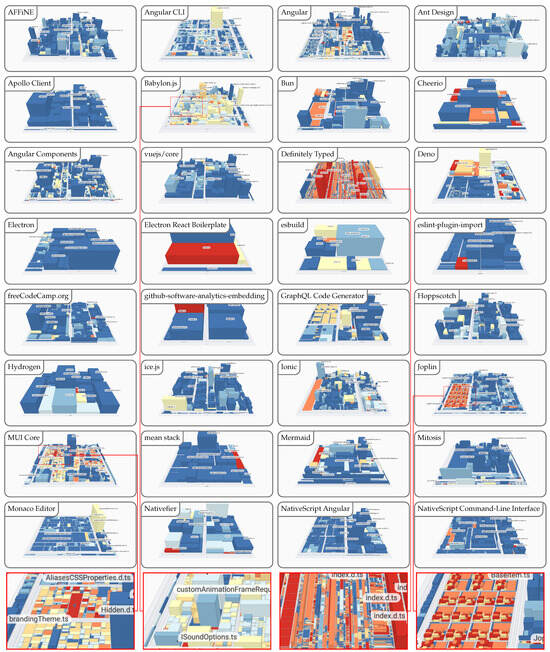
Figure A1.
Comparison of the first half of TypeScript projects with increasing size and complexity using a software map visualization. The number of lines of code (LoC) is mapped to weight, the number of functions (NoF) is mapped to height, and the density of comments (DoC) is mapped to color, ranging from inconspicuous (blue) to conspicuous (red). Continuation in Figure A2.
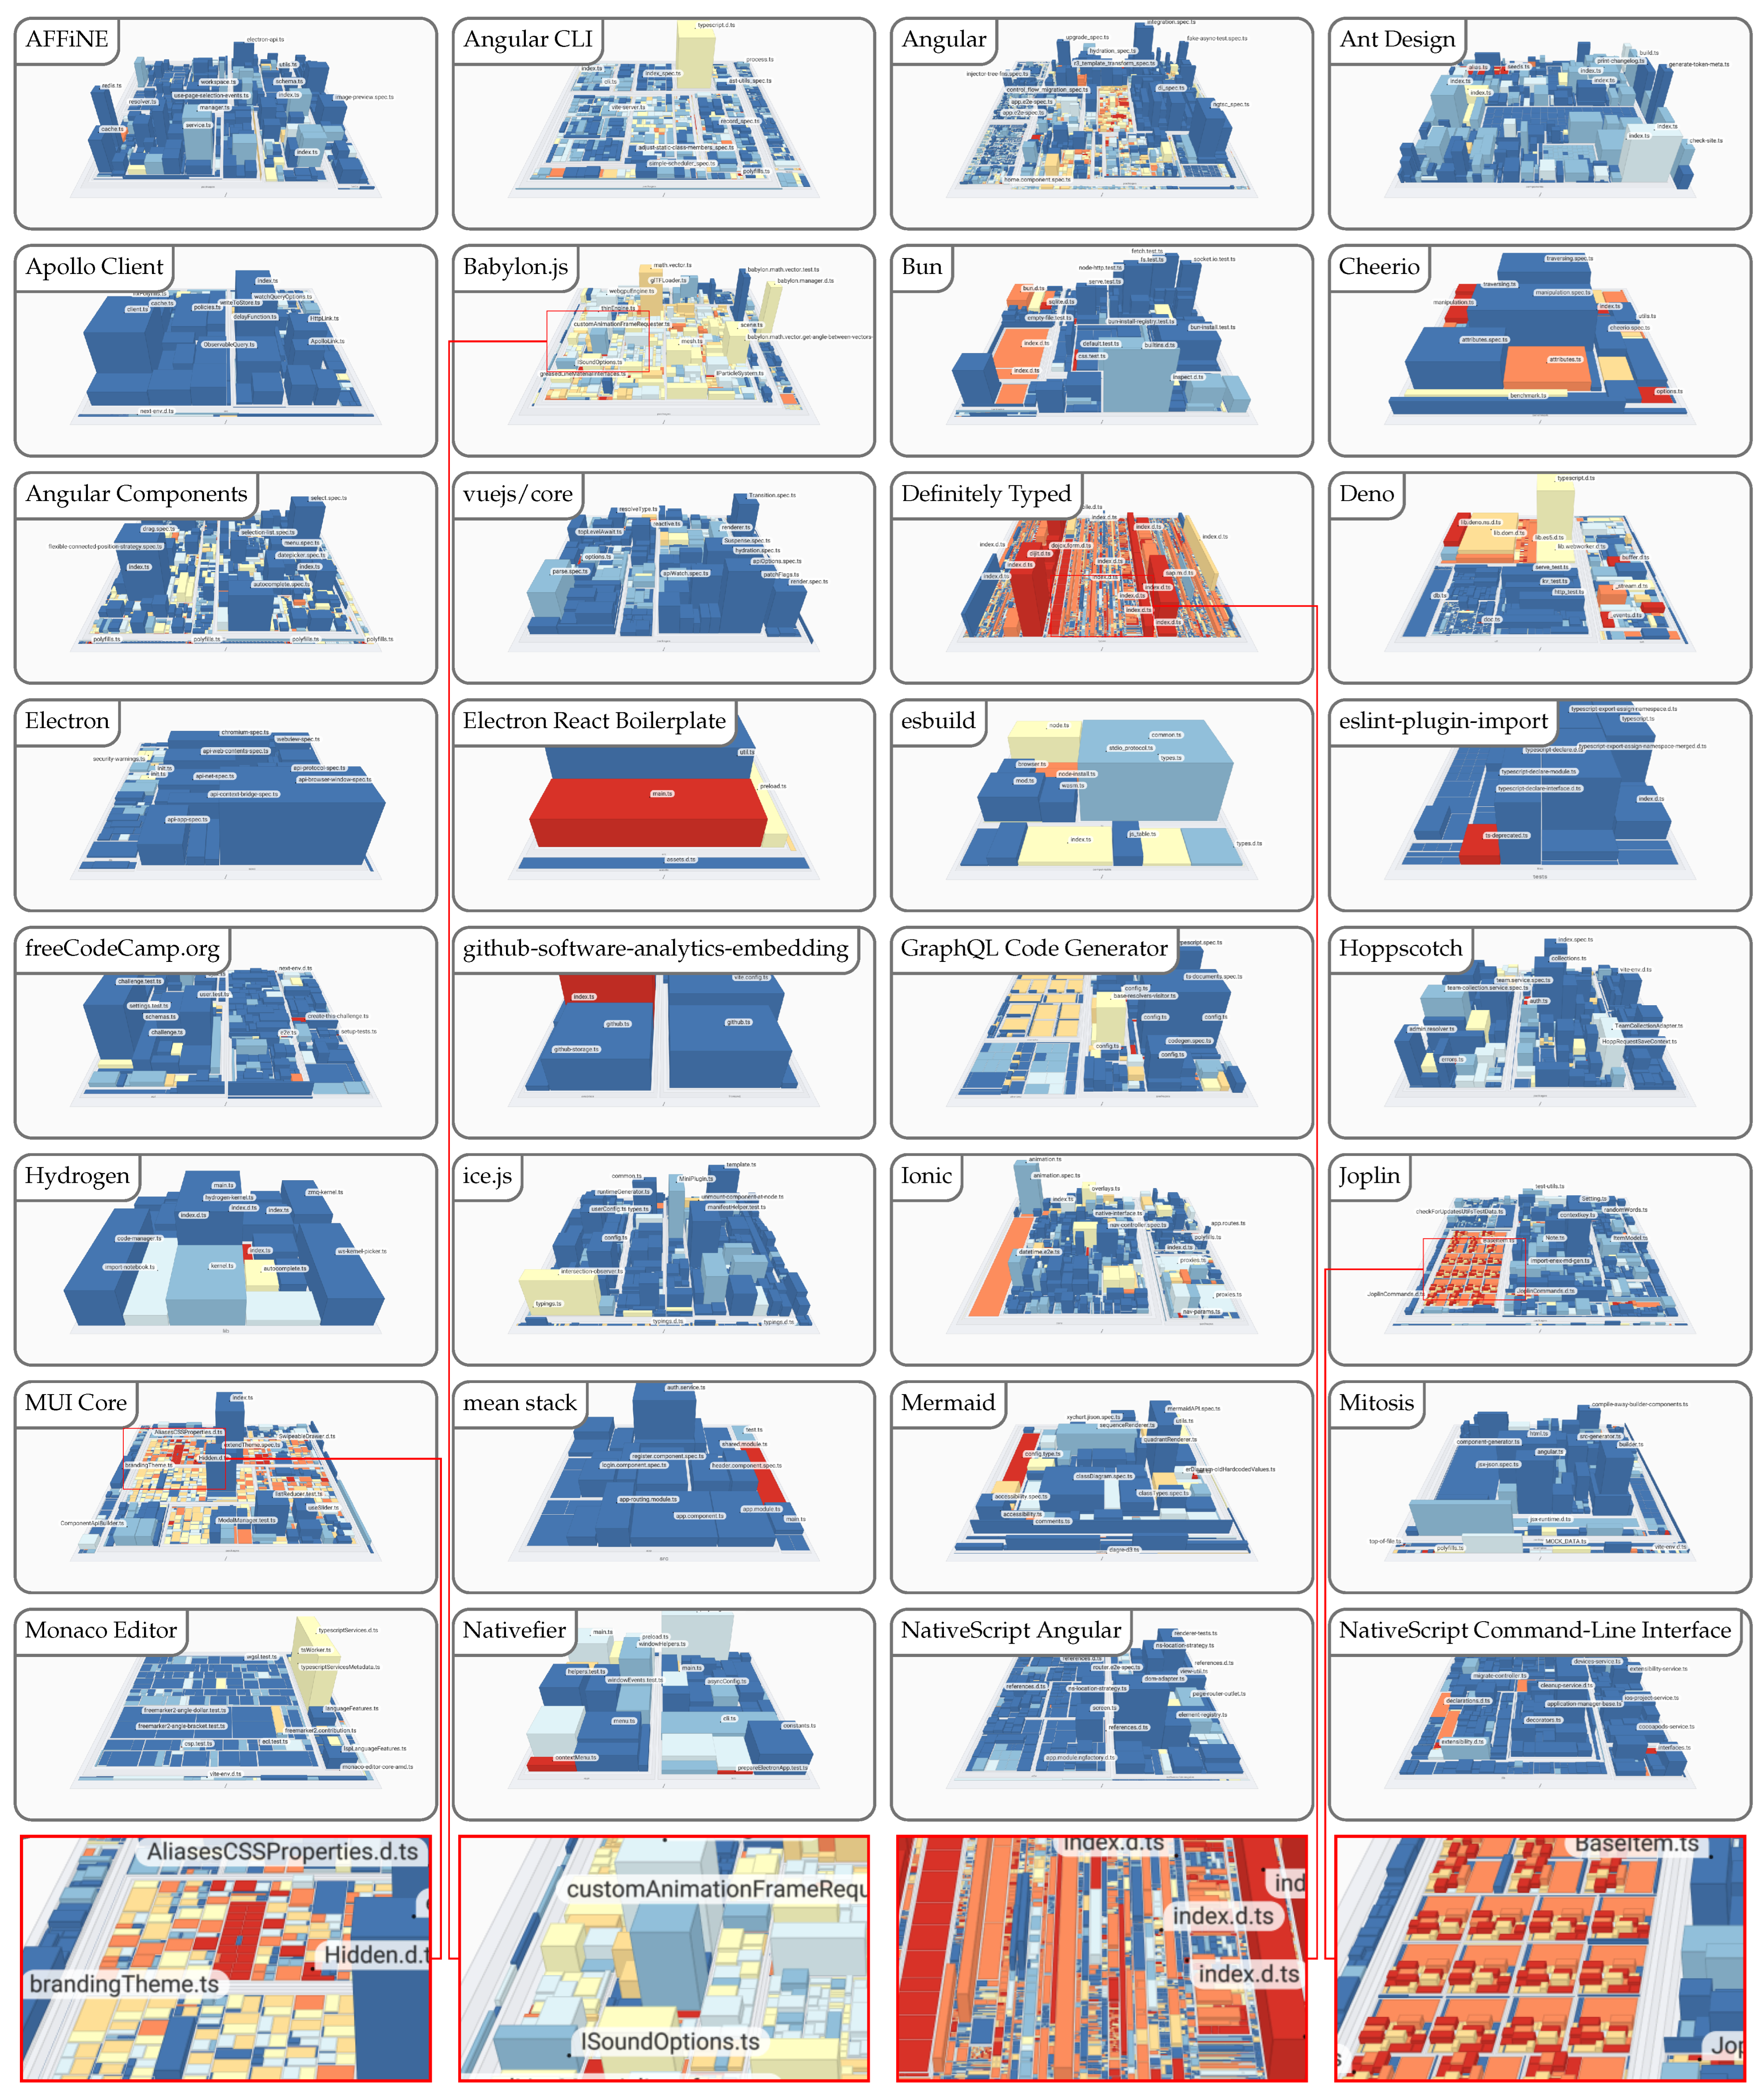

Figure A2.
Comparison of the second half of of TypeScript projects with increasing size and complexity using a software map visualization. The number of lines of code (LoC) is mapped to weight, the number of functions (NoF) is mapped to height, and the density of comments (DoC) is mapped to color, ranging from inconspicuous (blue) to conspicuous (red). Continuation from Figure A1.
References
- Zhang, D.; Han, S.; Dang, Y.; Lou, J.G.; Zhang, H.; Xie, T. Software Analytics in Practice. IEEE Softw. 2013, 30, 30–37. [Google Scholar] [CrossRef]
- Menzies, T.; Zimmermann, T. Software Analytics: So What? IEEE Softw. 2013, 30, 31–37. [Google Scholar] [CrossRef]
- Pospieszny, P. Software Estimation: Towards Prescriptive Analytics. In Proceedings of the 27th International Workshop on Software Measurement and 12th International Conference on Software Process and Product Measurement, Gothenburg, Sweden, 25–27 October 2017; ACM: New York, NY, USA, 2017; pp. 221–226. [Google Scholar] [CrossRef]
- Zhang, W.; Wang, S.; Yang, Y.; Wang, Q. Heterogeneous Network Analysis of Developer Contribution in Bug Repositories. In Proceedings of the International Conference on Cloud and Service Computing, Beijing, China, 4–6 November 2013; IEEE: Piscataway, NJ, USA, 2013; pp. 98–105. [Google Scholar] [CrossRef]
- Limberger, D.; Scheibel, W.; Döllner, J.; Trapp, M. Visual Variables and Configuration of Software Maps. Springer J. Vis. 2023, 26, 249–274. [Google Scholar] [CrossRef]
- Højelse, K.; Kilbak, T.; Røssum, J.; Jäpelt, E.; Merino, L.; Lungu, M. Git-Truck: Hierarchy-Oriented Visualization of Git Repository Evolution. In Proceedings of the Working Conference on Software Visualization, Limassol, Cyprus, 2–7 October 2022; IEEE: Piscataway, NJ, USA, 2022; pp. 131–140. [Google Scholar] [CrossRef]
- Paredes, J.; Anslow, C.; Maurer, F. Information Visualization for Agile Software Development. In Proceedings of the 2nd Working Conference on Software Visualization, Victoria, BC, Canada, 29–30 September 2014; IEEE: Piscataway, NJ, USA, 2014; pp. 157–166. [Google Scholar] [CrossRef]
- Bird, C.; Rigby, P.C.; Barr, E.T.; Hamilton, D.J.; German, D.M.; Devanbu, P. The Promises and Perils of Mining git. In Proceedings of the 6th International Working Conference on Mining Software Repositories, Vancouver, Canada, 16–17 May 2009; IEEE: Piscataway, NJ, USA, 2009; pp. 1–10. [Google Scholar] [CrossRef]
- Kalliamvakou, E.; Gousios, G.; Blincoe, K.; Singer, L.; German, D.M.; Damian, D. The Promises and Perils of Mining GitHub. In Proceedings of the 11th Working Conference on Mining Software Repositories, Hyderabad, India, 31 May–1 June 2014; ACM: New York, NY, USA, 2014; pp. 92–101. [Google Scholar] [CrossRef]
- Vargas, E.L.; Hejderup, J.; Kechagia, M.; Bruntink, M.; Gousios, G. Enabling Real-Time Feedback in Software Engineering. In Proceedings of the 40th International Conference on Software Engineering: New Ideas and Emerging Results, Gothenburg, Sweden, 27 May–3 June 2018; ACM: New York, NY, USA, 2018; pp. 21–24. [Google Scholar] [CrossRef]
- Czerwonka, J.; Nagappan, N.; Schulte, W.; Murphy, B. CODEMINE: Building a Software Development Data Analytics Platform at Microsoft. IEEE Softw. 2013, 30, 64–71. [Google Scholar] [CrossRef]
- Maddila, C.; Shanbhogue, S.; Agrawal, A.; Zimmermann, T.; Bansal, C.; Forsgren, N.; Agrawal, D.; Herzig, K.; van Deursen, A. Nalanda: A Socio-Technical Graph Platform for Building Software Analytics Tools at Enterprise Scale. In Proceedings of the 30th Joint European Software Engineering Conference and Symposium on the Foundations of Software Engineering, Singapore, 14–18 November 2022; ACM: New York, NY, USA, 2022; pp. 1246–1256. [Google Scholar] [CrossRef]
- Shahin, M.; Ali Babar, M.; Zhu, L. Continuous Integration, Delivery and Deployment: A Systematic Review on Approaches, Tools, Challenges and Practices. IEEE Access 2017, 5, 3909–3943. [Google Scholar] [CrossRef]
- Henry, G. Dave Cross on GitHub Actions. IEEE Softw. 2024, 41, 146–148. [Google Scholar] [CrossRef]
- Hassan, A.E. The road ahead for Mining Software Repositories. In Proceedings of the Frontiers of Software Maintenance, Beijing, China, 28 September–4 October 2008; IEEE: Piscataway, NJ, USA, 2008; pp. 48–57. [Google Scholar] [CrossRef]
- Decan, A.; Mens, T.; Mazrae, P.R.; Golzadeh, M. On the Use of GitHub Actions in Software Development Repositories. In Proceedings of the International Conference on Software Maintenance and Evolution, Limassol, Cyprus, 2–7 October 2022; IEEE: Piscataway, NJ, USA, 2022; pp. 235–245. [Google Scholar] [CrossRef]
- Khatami, A.; Zaidman, A. Quality Assurance Awareness in Open Source Software Projects on GitHub. In Proceedings of the 23rd International Working Conference on Source Code Analysis and Manipulation, Bogotá, Colombia, 1–2 October 2023; IEEE: Piscataway, NJ, USA, 2023; pp. 174–185. [Google Scholar] [CrossRef]
- Honglei, T.; Wei, S.; Yanan, Z. The Research on Software Metrics and Software Complexity Metrics. In Proceedings of the International Forum on Computer Science-Technology and Applications, Chongqing, China, 25–27 December 2009; IEEE: Piscataway, NJ, USA, 2009; pp. 131–136. [Google Scholar] [CrossRef]
- Sui, L.; Dietrich, J.; Tahir, A.; Fourtounis, G. On the Recall of Static Call Graph Construction in Practice. In Proceedings of the 42nd International Conference on Software Engineering, Seoul, Republic of Korea, 7–11 July 2020; ACM: New York, NY, USA, 2020; pp. 1049–1060. [Google Scholar] [CrossRef]
- Chidamber, S.R.; Kemerer, C.F. A metrics suite for object oriented design. IEEE Trans. Softw. Eng. 1994, 20, 476–493. [Google Scholar] [CrossRef]
- Atzberger, D.; Scordialo, N.; Cech, T.; Scheibel, W.; Trapp, M.; Döllner, J. CodeCV: Mining Expertise of GitHub Users from Coding Activities. In Proceedings of the 22nd International Working Conference on Source Code Analysis and Manipulation, Limassol, Cyprus, 3–4 October 2022; IEEE: Piscataway, NJ, USA, 2022; pp. 143–147. [Google Scholar] [CrossRef]
- Bozzelli, P.; Gu, Q.; Lago, P. A Systematic Literature Review on Green Software Metrics; Technical Report; VU University: Amsterdam, The Netherlands, 2013. [Google Scholar]
- Ludwig, J.; Xu, S.; Webber, F. Compiling static software metrics for reliability and maintainability from GitHub repositories. In Proceedings of the International Conference on Systems, Man, and Cybernetics, Banff, Canada, 5–8 October 2017; IEEE: Piscataway, NJ, USA, 2017; pp. 5–9. [Google Scholar] [CrossRef]
- Spadini, D.; Aniche, M.; Bacchelli, A. Pydriller: Python framework for mining software repositories. In Proceedings of the 26th Joint Meeting on European Software Engineering Conference and Symposium on the Foundations of Software Engineering, Lake Buena Vista, FL, USA, 4–9 November 2018; ACM: New York, NY, USA, 2018; pp. 908–911. [Google Scholar] [CrossRef]
- Reza, S.M.; Badreddin, O.; Rahad, K. ModelMine: A tool to facilitate mining models from open source repositories. In Proceedings of the 23rd International Conference on Model Driven Engineering Languages and Systems: Companion Proceedings, Virtual Event, 16–23 October 2020; ACM: New York, NY, USA, 2020; pp. 9:1–9:5. [Google Scholar] [CrossRef]
- Casalnuovo, C.; Suchak, Y.; Ray, B.; Rubio-González, C. GitcProc: A tool for processing and classifying GitHub commits. In Proceedings of the 26th SIGSOFT International Symposium on Software Testing and Analysis, Santa Barbara, CA, USA, 10–14 July 2017; ACM: New York, NY, USA, 2017; pp. 396–399. [Google Scholar]
- Terceiro, A.; Costa, J.; Miranda, J.; Meirelles, P.; Rios, L.R.; Almeida, L.; Chavez, C.; Kon, F. Analizo: An Extensible Multi-Language Source Code Analysis and Visualization Toolkit. In Proceedings of the Brazilian Conference on Software: Theory and Practice—Tools, Salvador, Bahia, Brazil, 27 September–1 October 2010. [Google Scholar]
- Fu, M.; Tantithamthavorn, C. LineVul: A Transformer-Based Line-Level Vulnerability Prediction. In Proceedings of the 19th International Conference on Mining Software Repositories, Pittsburgh, PA, USA, 23–24 May 2022; ACM: New York, NY, USA, 2022; pp. 608–620. [Google Scholar] [CrossRef]
- Collard, M.L.; Decker, M.J.; Maletic, J.I. srcML: An infrastructure for the exploration, analysis, and manipulation of source code: A tool demonstration. In Proceedings of the International Conference on Software Maintenance, Eindhoven, The Netherlands, 22–28 September 2013; IEEE: Piscataway, NJ, USA, 2013; pp. 516–519. [Google Scholar] [CrossRef]
- Dyer, R.; Nguyen, H.A.; Rajan, H.; Nguyen, T.N. Boa: A language and infrastructure for analyzing ultra-large-scale software repositories. In Proceedings of the 35th International Conference on Software Engineering, San Francisco, CA, USA, 18–26 May 2013; IEEE: Piscataway, NJ, USA, 2013; pp. 422–431. [Google Scholar] [CrossRef]
- Gousios, G. The GHTorrent dataset and tool suite. In Proceedings of the 10th Working Conference on Mining Software Repositories, San Francisco, CA, USA, 18–19 May 2013; IEEE: Piscataway, NJ, USA, 2013; pp. 233–236. [Google Scholar] [CrossRef]
- Mattis, T.; Rein, P.; Hirschfeld, R. Three trillion lines: Infrastructure for mining GitHub in the classroom. In Proceedings of the Conference Companion of the 4th International Conference on Art, Science, and Engineering of Programming, Porto, Portugal, 23–26 March 2020; ACM: New York, NY, USA, 2020; pp. 1–6. [Google Scholar] [CrossRef]
- Trautsch, A.; Trautsch, F.; Herbold, S.; Ledel, B.; Grabowski, J. The SmartSHARK ecosystem for software repository mining. In Proceedings of the 42nd International Conference on Software Engineering: Companion Proceedings, Seoul, South Korea, 7–11 July 2020; ACM: New York, NY, USA, 2020; pp. 25–28. [Google Scholar] [CrossRef]
- Kolovos, D.; Neubauer, P.; Barmpis, K.; Matragkas, N.; Paige, R. Crossflow: A framework for distributed mining of software repositories. In Proceedings of the 16th International Conference on Mining Software Repositories, Montreal, Canada, 26–27 May 2019; IEEE: Piscataway, NJ, USA, 2019; pp. 155–159. [Google Scholar] [CrossRef]
- Dueñas, S.; Cosentino, V.; Robles, G.; Gonzalez-Barahona, J.M. Perceval: Software Project Data at Your Will. In Proceedings of the 40th International Conference on Software Engineering: Companion Proceeedings, Melbourne, Australia, 14–20 May 2018; ACM: New York, NY, USA, 2018; pp. 1–4. [Google Scholar] [CrossRef]
- Foltin, E.; Dumke, R.R. Aspects of software metrics database design. Softw. Process. Improv. Pract. 1998, 4, 33–42. [Google Scholar] [CrossRef]
- Prause, C.R.; Hönle, A. Emperor’s New Clothes: Transparency Through Metrication in Customer-Supplier Relationships. In PROFES 2018: Product-Focused Software Process Improvement; Springer: Cham, Switzerland, 2018; pp. 288–296. [Google Scholar] [CrossRef]
- Sayyad Shirabad, J.; Menzies, T. The PROMISE Repository of Software Engineering Databases; School of Information Technology and Engineering, University of Ottawa: Ottawa, Canada, 2005. [Google Scholar]
- Scheibel, W.; Hartmann, J.; Limberger, D.; Döllner, J. Visualization of Tree-structured Data using Web Service Composition. In VISIGRAPP 2019: Computer Vision, Imaging and Computer Graphics Theory and Applications; Springer: Cham, Switzerland, 2020; pp. 227–252. [Google Scholar] [CrossRef]
- Heseding, F.; Scheibel, W.; Döllner, J. Tooling for Time- and Space-Efficient Git Repository Mining. In Proceedings of the 19th International Conference on Mining Software Repositories, Pittsburgh, PA, USA, 23–24 May 2022; ACM: New York, NY, USA, 2022; pp. 413–417. [Google Scholar] [CrossRef]
- D’Ambros, M.; Lanza, M.; Robbes, R. An extensive comparison of bug prediction approaches. In Proceedings of the 7th Working Conference on Mining Software Repositories, Cape Town, South Africa, 2–3 May 2010; IEEE: Piscataway, NJ, USA, 2010; pp. 31–41. [Google Scholar] [CrossRef]
- Reniers, D.; Voinea, L.; Ersoy, O.; Telea, A.C. The Solid* toolset for software visual analytics of program structure and metrics comprehension: From research prototype to product. Elsevier Sci. Comput. Program. 2014, 79, 224–240. [Google Scholar] [CrossRef]
- Dick, S.; Meeks, A.; Last, M.; Bunke, H.; Kandel, A. Data mining in software metrics databases. Fuzzy Sets Syst. 2004, 145, 81–110. [Google Scholar] [CrossRef]
- Ball, T.; Eick, S. Software visualization in the large. IEEE Comput. 1996, 29, 33–43. [Google Scholar] [CrossRef]
- Scheibel, W.; Trapp, M.; Limberger, D.; Döllner, J. A Taxonomy of Treemap Visualization Techniques. In Proceedings of the 15th International Joint Conference on Computer Vision, Imaging and Computer Graphics Theory and Applications, Valletta, Malta, 27–29 February 2020; SciTePress: Setúbal, Portugal, 2020; pp. 273–280. [Google Scholar] [CrossRef]
- Johnson, B.S.; Shneiderman, B. Tree-Maps: A Space-filling Approach to the Visualization of Hierarchical Information Structures. In Proceedings of the 2nd Conference on Visualization, San Diego, CA, USA, 22–25 October 1991; IEEE: Piscataway, NJ, USA, 1991; pp. 284–291. [Google Scholar] [CrossRef]
- Holten, D.; Vliegen, R.; van Wijk, J. Visual Realism for the Visualization of Software Metrics. In Proceedings of the 3rd International Workshop on Visualizing Software for Understanding and Analysis, Budapest, Hungary, 25 September 2005; IEEE: Piscataway, NJ, USA, 2005; pp. 1–6. [Google Scholar] [CrossRef]
- Wettel, R.; Lanza, M. Visualizing Software Systems as Cities. In Proceedings of the 4th International Workshop on Visualizing Software for Understanding and Analysis, Banff, Canada, 25–26 June 2007; IEEE: Piscataway, NJ, USA, 2007; pp. 92–99. [Google Scholar] [CrossRef]
- Steinbrückner, F.; Lewerentz, C. Understanding Software Evolution with Software Cities. SAGE Inf. Vis. 2013, 12, 200–216. [Google Scholar] [CrossRef]
- Kuhn, A.; Loretan, P.; Nierstrasz, O. Consistent Layout for Thematic Software Maps. In Proceedings of the 15th Working Conference on Reverse Engineering, Antwerp, Belgium, 15–18 October 2008; IEEE: Piscataway, NJ, USA, 2008; pp. 209–218. [Google Scholar] [CrossRef]
- Atzberger, D.; Cech, T.; Scheibel, W.; Limberger, D.; Döllner, J. Visualization of Source Code Similarity using 2.5D Semantic Software Maps. In VISIGRAPP 2021: Computer Vision, Imaging and Computer Graphics Theory and Applications; Springer: Cham, Switzerland, 2023; pp. 162–182. [Google Scholar] [CrossRef]
- Sokol, F.Z.; Aniche, M.F.; Gerosa, M.A. MetricMiner: Supporting researchers in mining software repositories. In Proceedings of the 13th International Working Conference on Source Code Analysis and Manipulation, Eindhoven, The Netherlands, 22–23 September 2013; IEEE: Piscataway, NJ, USA, 2013; pp. 142–146. [Google Scholar] [CrossRef]
- Dueñas, S.; Cosentino, V.; Gonzalez-Barahona, J.M.; San Felix, A.d.C.; Izquierdo-Cortazar, D.; Cañas-Díaz, L.; García-Plaza, A.P. GrimoireLab: A toolset for software development analytics. PeerJ Comput. Sci. 2021, 7, e601. [Google Scholar] [CrossRef] [PubMed]
- Archambault, D.; Purchase, H.; Pinaud, B. Animation, Small Multiples, and the Effect of Mental Map Preservation in Dynamic Graphs. IEEE Trans. Vis. Comput. Graph. 2011, 17, 539–552. [Google Scholar] [CrossRef] [PubMed]
- Ma, Y.; Dey, T.; Bogart, C.; Amreen, S.; Valiev, M.; Tutko, A.; Kennard, D.; Zaretzki, R.; Mockus, A. World of code: Enabling a research workflow for mining and analyzing the universe of open source VCS data. Empir. Softw. Eng. 2021, 26, 1–42. [Google Scholar] [CrossRef]
- Hoepman, J.H.; Jacobs, B. Increased Security through Open Source. Commun. ACM 2007, 50, 79–83. [Google Scholar] [CrossRef]
- Wermke, D.; Wöhler, N.; Klemmer, J.H.; Fourné, M.; Acar, Y.; Fahl, S. Committed to Trust: A Qualitative Study on Security & Trust in Open Source Software Projects. In Proceedings of the Symposium on Security and Privacy, San Francisco, CA, USA, 23–26 May 2022; IEEE: Piscataway, NJ, USA, 2022; pp. 1880–1896. [Google Scholar] [CrossRef]
- Mayer, P.; Bauer, A. An Empirical Analysis of the Utilization of Multiple Programming Languages in Open Source Projects. In Proceedings of the 19th International Conference on Evaluation and Assessment in Software Engineering, Nanjing, China, 27–29 April 2015; ACM: New York, NY, USA, 2015; pp. 4:1–4:10. [Google Scholar] [CrossRef]
- Li, D.; Wang, W.; Zhao, Y. Intelligent Visual Representation for Java Code Data in the Field of Software Engineering Based on Remote Sensing Techniques. Electronics 2023, 12, 5009. [Google Scholar] [CrossRef]
- Atzberger, D.; Cech, T.; de la Haye, M.; Söchting, M.; Scheibel, W.; Limberger, D.; Döllner, J. Software Forest: A Visualization of Semantic Similarities in Source Code using a Tree Metaphor. In Proceedings of the 16th International Joint Conference on Computer Vision, Imaging and Computer Graphics Theory and Applications, Virtual Event, 8–10 February 2021; SciTePress: Setúbal, Portugal, 2021; pp. 112–122. [Google Scholar] [CrossRef]
- Meirelles, P.; Santos, C., Jr.; Miranda, J.; Kon, F.; Terceiro, A.; Chavez, C. A Study of the Relationships between Source Code Metrics and Attractiveness in Free Software Projects. In Proceedings of the Brazilian Symposium on Software Engineering, Salvador, Bahia, Brazil, 27 September–1 October 2010; IEEE: Piscataway, NJ, USA, 2010; pp. 11–20. [Google Scholar] [CrossRef]
- Ray, B.; Posnett, D.; Filkov, V.; Devanbu, P. A large scale study of programming languages and code quality in GitHub. In Proceedings of the 22nd SIGSOFT International Symposium on Foundations of Software Engineering, Hong Kong, China, 16–21 November 2014; ACM: New York, NY, USA, 2014; pp. 155–165. [Google Scholar] [CrossRef]


Disclaimer/Publisher’s Note: The statements, opinions and data contained in all publications are solely those of the individual author(s) and contributor(s) and not of MDPI and/or the editor(s). MDPI and/or the editor(s) disclaim responsibility for any injury to people or property resulting from any ideas, methods, instructions or products referred to in the content. |
© 2024 by the authors. Licensee MDPI, Basel, Switzerland. This article is an open access article distributed under the terms and conditions of the Creative Commons Attribution (CC BY) license (https://creativecommons.org/licenses/by/4.0/).