Article

Cloud-Based Infrastructure and DevOps for Energy Fault Detection in Smart Buildings

TSYS School of Computer Science, Turner College of Business, Columbus State University, Columbus, GA 31907, USA
*
Authors to whom correspondence should be addressed.
Computers 2024, 13(1), 23; https://doi.org/10.3390/computers13010023
Submission received: 3 November 2023 / Revised: 2 December 2023 / Accepted: 5 December 2023 / Published: 16 January 2024
(This article belongs to the Special Issue Sensors and Smart Cities 2023)

Abstract

:
We have designed a real-world smart building energy fault detection (SBFD) system on a cloud-based Databricks workspace, a high-performance computing (HPC) environment for big-data-intensive applications powered by Apache Spark. By avoiding a Smart Building Diagnostics as a Service approach and keeping a tightly centralized design, the rapid development and deployment of the cloud-based SBFD system was achieved within one calendar year. Thanks to Databricks’ built-in scheduling interface, a continuous pipeline of real-time ingestion, integration, cleaning, and analytics workflows capable of energy consumption prediction and anomaly detection was implemented and deployed in the cloud. The system currently provides fault detection in the form of predictions and anomaly detection for 96 buildings on an active military installation. The system’s various jobs all converge within 14 min on average. It facilitates the seamless interaction between our workspace and a cloud data lake storage provided for secure and automated initial ingestion of raw data provided by a third party via the Secure File Transfer Protocol (SFTP) and BLOB (Binary Large Objects) file system secure protocol drivers. With a powerful Python binding to the Apache Spark distributed computing framework, PySpark, these actions were coded into collaborative notebooks and chained into the aforementioned pipeline. The pipeline was successfully managed and configured throughout the lifetime of the project and is continuing to meet our needs in deployment. In this paper, we outline the general architecture and how it differs from previous smart building diagnostics initiatives, present details surrounding the underlying technology stack of our data pipeline, and enumerate some of the necessary configuration steps required to maintain and develop this big data analytics application in the cloud.

1. Introduction

The proliferation of energy concerns globally mandates the implementation of quick and robust energy efficiency measures via the promotion of renewable energy integration and the deployment of Energy Management Systems (EMSs) [1]; a smart building fault detection system (BFD) is integral to this process. BFD continuously tracks energy consumption and production levels to create energy usage alerts and prevent energy incidents. This task requires the implementation of adequate data acquisition and ingestion mechanisms, as well as appropriate predictive data analytics [1].
The cloud-based management of smart building fault detection and other analytical processes concerned with building diagnostic data is not itself a novel concept. Nader Mohamed and Sanja Lazarova-Molnar propose a service-based architecture involving a distributed network of devices organized into a hierarchy of tiers, each responsible for a certain type of data load [2] (building management, perception, ingestion and storage, processing, and analytics). In this article, the authors present an architecture developed for managing smart buildings, perceiving parameters of interest, and finally, storing, processing, and analyzing smart building diagnostic data in the cloud. While their approach is vastly different, their motivations are the same: remove the need for energy-concerned entities to maintain in-house hardware and expensive network infrastructures. Their research is also primarily concerned with the detection and diagnosis of faults. The authors detail the Smart Building Diagnostics as a Service (SBDaaS) model, which consists of three tiers utilized to connect cloud-based services to smart buildings. A smart building itself encompasses the first tier, along with all the infrastructure therein. A distributed network of sensor nodes monitoring energy consumption and environmental conditions make up the topmost layer of the first tier. The second tier is the Cloud-Enabled Building Energy Management System (CE-BEMS). Each smart building houses one CE-BEMS, and all energy-consuming subsystems, sensor nodes, and actuators are connected to it via IoT technologies. Every CE-BEMS is a lower-power device connected to the SBDaaS provider, an endpoint on a cloud platform. This could be an Azure Data Factory or an AWS configuration. Here, more intensive resources are housed. This is the third tier, the internet. Mohamed suggests that the service provider should offer multiple basic maintenance functions for different smart buildings including command and control, software updates, and the addition of sensor nodes [2]. For smart building diagnostic functionality, the SBDaaS provider should provide data collection and storage for parameters monitored and perceived by the sensor networks (automated, if necessary), diagnostics reports to end-users (possible faults, the current status of sensor nodes), support for virtual aggregate sensors, and energy fault detection and diagnosis [2]. The most noteworthy feature of their architecture is the implementation of adaptive AI features in the cloud such as knowledge-based systems to provide a feedback loop into the analytics required to generate faults, making the cloud-based smart building infrastructure robust to vertical scaling. This SBDaaS approach aims to create a highly scalable, less specialized infrastructure for companies to manage and report on smart buildings.
Iulia Stamatescu, Valeria Bolbooaca and Grigore Stamatescu propose an architecture more similar to ours, lacking a robust lower tier of distributed sensor nodes or per-building management devices like the CE-BEMS. This architecture connects the network of sensor nodes straight to the cloud through a WSN gateway (wireless sensor network) and forwards parameters to a cloud-based event hub [3]. The parameters are moved from the event hub straight to Azure services such as Stream Analytics, Data Factory, and finally, the Azure App Service before being reported to users on a dashboard [3]. The primary difference between this model and the one proposed by Nader Mohamed and Sanja Lazarova-Molnar is the service-based theme. Here, there is a single service provided by the cloud platform, and the buildings are not managed independently. This model is better suited for specialized use cases that do not expect much scaling in the way of provided services. Its strength is in its simplicity.
The approach taken in this paper is similar to the architecture as proposed by Iulia Stamatescu [3]. Each building is profiled with diagnostics collected by a network of sensors to collect energy consumption aggregates for the smart building, as well as inputs from other energy subsystems within the building. Rather than having a robust lower tier of sensor nodes to collect more than energy data, environmental parameters such as climatic data are collected on a per-building basis from a third-party API. Our smart building fault detection architecture differs in that the supporting infrastructure exists almost entirely in the cloud, rather than having a CE-BEMS or other management devices in each building. Relevant parameters are collected by sensors or other third parties and forwarded directly to the primary cloud storage medium, the Azure Data Lake Storage. This contrasts with the more distributed, as-a-service approach taken by other researchers. Our processing is largely centralized, not lending itself well to vertical scaling or the addition of more data sources, a problem that will be solved in Phase 2. However, the taken approach to a smart building diagnostics architecture allows for easier horizontal scaling. In this case, this looks like the addition of more smart buildings without having to expand the sensor node networks or install management devices in each building. While other architectures are admittedly more robust, the BFD system proposed herein met the needs of the big data workload presented to the University and was more than satisfactory to the employer given its low cost. Additionally, keeping with a tightly centralized design and outsourcing the collection of environmental parameters such as weather data enabled rapid development and deployment.
A smart building fault detection system (SBFD) involving big data analytics requires high-performance computing runtimes and large distributed datasets [4]. Additionally, the development of a continuous pipeline of workflows that make up such a system requires scheduling strategies, collaboration, version control, and smart dependency management [5]. Each component in the technology stack is generally responsible for one of these core requirements. With minimal development operations and the use of a robust technology stack, we streamline the process of construction and deployment to focus on preparing analytic approaches that are effective and meet strict deadlines and variable specifications. For the high-performance computing runtime [6], Apache Spark takes the lead with around 80% of the Fortune 500 making use of this massive, distributed computing framework. Fortunately, Microsoft’s cloud platform, Azure, provides a workspace, Databricks, giving a uniform interface to Spark’s capabilities (namely multi-node compute clusters) through intuitive GUIs and Jupyter notebooks where developers can house primary pipeline functionality. Our system makes use of two Spark compute clusters, one for the data pipeline workflows and another for the analytics and machine learning workflows [7]. For large distributed datasets, our Databricks workspace came largely pre-configured with an Apache Hive data warehouse. Each component of our pipeline, the workflow notebooks, was able to seamlessly interact with its respective data hierarchy using Structured Query Language (SQL) queries on tables uniquely labeled to reflect their contents and position in the pipeline. Our team devised several scheduling strategies over the lifetime of the project due to variable specifications and changing requirements. All strategies were implemented via the Databricks workflow interface allowing us to focus on analytic approaches rather than the development of some primitive driver to orchestrate and automate various pipeline tasks (real-time ingestion, integration, cleaning, and analytics). A given Jupyter notebook in the Databricks workspace is fully collaborative for all permitted users specified in the permission matrix (Admin console functionality). In our system, dependencies (Python libraries) are version-frozen and pre-installed at the cluster level. For version control, the Databricks workspace was configured to interact with external repositories hosted by GitHub.

2. Infrastructure: Technology Stack

Various technologies actuate the cloud-based smart building fault detection system, composing our technology stack. The primary components are the cloud storage medium, the workspace platform built on with distributed compute, and the data warehousing technology. Integrating these components was challenging but achievable with the wealth of documentation and resources publicly available. Microsoft and Apache built these technologies targeting big data analytics use cases. Coherent APIs allow engineers to focus on the problem rather than the tool.

2.1. Primary Cloud Storage Medium

Microsoft Azure Data Lake Storage (ADLS) Gen2 is a huge cloud storage platform built on Azure BLOB storage capabilities optimized for big data analytics workflows. The hierarchical namespace feature enables the organization and structure (directories/files) that you would expect from local file systems with all the power of a distributed storage platform behind it. This allows ADLS to scale easily to big workloads. Access control is achieved via integration with the Azure Active Directory (AD), which manages authentication (for both users and developers’ applications), authorization, and encryption both at rest and en route to application endpoints. ADLS is capable of managing a robust array of data types including JSON, CSV, Parquet, DAT, plain text, and Binary Large Object files. In a project where data were dumped to ADLS by a third party, the data versioning functionality of ADLS allowed us to trace changes to data over time and revert to previous versions if needed. The common use case for ADLS is as a storage medium for the raw and unstructured part of the data lifecycle in an analytics pipeline. Our models would eventually train on pre-processed integrated representations of the very same data present in ADLS. We divided our data lake into namespaces called Storage Accounts (SAs). The SA acted as a sort of software context for access control and configuration. After configuring each SA to hold raw data for each relevant source (historic weather data, energy consumption data, hard sensor data, etc.), we were able to have finely tuned control over each source individually without the added complexity of multiple data lake resources. Stepping down from the SA, the BLOB container held different types of data. For example, after applying manual preprocessing steps to energy consumption, DAT files might be moved from the ‘reference’ container to the ‘output’ container. Generally, however, the BLOB container functioned one-to-one with the SA, as most of the data preparation would happen on the workspace/compute platform outputting to the data warehouse technology. The BLOB storage pattern is a cost-effective way to manage large amounts of unstructured data in these containers and is best applied to static applications. Since the most frequent writes to ADLS occurred roughly every 48 h, the BLOB pattern suits our use case. Additionally, reading the Binary Large Objects happens in near real-time once a copy is moved to the workspace file system (Databricks FS) or in-memory given that they are random access. Accessing ADLS from our workspace/compute platform was admittedly a challenge. To read our data from ADLS, we needed to mount the Gen2 BLOB storage containers as directories on the Databricks Distributed File System (DBFS) [8]. This involved three primary steps: booting a Spark context, authenticating with the SA via some secure protocol, and finally, using Databricks’ utilities to perform the FUSE (file system in user space) mount operation [9]. Given that Databricks is our primary compute workspace and provides APIs for accessing external resources such as data lakes, this was the best home for the ‘prepare_environment’ script responsible for pulling in the containers from all relevant Storage Accounts. See Figure 1.
As is shown in Figure 1, the ‘prepare_environment’ script authenticates with a SA endpoint, specifying BLOB containers of interest. In return, a BLOB transfer is completed. The notebook completes the data acquisition process by FUSE mounting the BLOB container as a directory on the Databricks File System (DBFS), a distributed file system accessible via all notebooks in a Databricks workspace given an active Spark context. Here, ‘prepare_environment’ has effectively given the entire pipeline local access to DAT files that were previously only available remotely. There are a variety of protocols made available to applications for transporting BLOB storage containers. The easiest of which to configure was the Azure BLOB File System Secure (ABFSS). ABFSS is the workhorse of the token-for-BLOB exchange between the workspace and ADLS, as illustrated in Figure 1. The ABFSS driver API provided by Databricks’ ‘dbutils’ is configured on all compute clusters by default. ADLS security policies demand some robust authentication before an application can make requests to an SA’s endpoint. We configured our primary SAs to use Shared Access Signature (SAS) strings, a token system that can be distributed among developers and passed to the endpoint URL from the application backend. This allowed each Storage Account to be configured with access expiration dates, IP address requirements (accomplished with the use of a virtual network) and basic access control permissions. As with a regular file system mount, you need only provide the ABFSS driver with a mount point (a directory on the Databricks File System, globally accessible to all clusters in the Resource group), and an ADLS endpoint as well as authentication information (SAS flags, strings, etc.). Performing the actual mount is done with ‘dbutils’. Only minimal configuration is required by the application script in order to access and mount ADLS storage objects. These parameters consist of ‘dbfs_mount_path’ (the destination directory on DBFS), ‘abfss_generic_endpoint’ (the remote Azure BLOB file system endpoint, resource locator for ADLS), ‘relevant_locations’ (relevant SAs and BLOB containers), and ‘keys’ (simply the SAS tokens for each SA). These parameters are packed into an authentication config structure to be passed to ‘dbutils.mount’. Before performing the actual mount, a local file system check is done to verify there are no pre-existing directories containing the BLOB containers to be mounted. Both global DBFS and the local virtual storage on each worker node is checked for the existence of the resource being fetched. Note that Spark configuration parameters are set again with each object mount. The Databricks File System will propagate changes in mounted objects in the data lake [10]. This is a powerful feature that requires the Spark context to be aware of the ABFSS parameters. After this script is run, bar any problems, the directories on the Databricks’ globally accessible storage will hold the most recent version of the hierarchical structure present in each BLOB container in ADLS. After an SAS token expires or more SAs are created, the script must be modified and re-run. Given that our data sources did not change for the duration of the development phase, this was not an issue. ‘!ls/mnt/<mount-path>’ can be issued to the shell interpreter present on the driver node of each cluster to enumerate the mounted BLOB containers. Note that each compute cluster, within the lifetime of its Spark context, has access to the FUSE mounts. Accordingly, every workflow notebook created and attached to a cluster was able to read and write data to the directories on DBFS. After these steps, the primary storage medium was fully connected with our workspace platform.

2.2. Workspace Platform and Compute Technology

Microsoft Azure Databricks is a workspace platform and compute-technology interface for the collaborative development and deployment of analytics workflows and the automated configuration of Apache Spark HPC clusters [11] with node-local storage and access to a global DBFS. Databricks comes prepared with an intuitive GUI for setting up Spark clusters, giving control to such properties as runtime software, support for several target languages including Python, Scala, and R, and hardware allocation. Each Azure subscription is bounded by compute core quotas. Consequently, the exact use case of each cluster must be thought out before allocation to avoid wasting resources. Each cluster was responsible for either data pipelining (real-time ingestion, integration, cleaning) or machine learning (analytics) workflows. Each compute cluster has local storage file systems present on each worker node. The virtual environment for managing your language runtime is stored on this local storage. see Figure 2. The most basic unit of the workspace platform is the interactive notebook, a dynamic way to quickly scale up a project by writing code in smaller steps called command cells. Each notebook had one purpose and would be attached to a compute cluster in order to perform its workloads. A lifetime value was set for each cluster, so that they would terminate on either of two cases: a programmer was not actively using any notebooks attached to that cluster, or there were no active jobs scheduled on that cluster. The aforementioned primary clusters shared the total pipeline workload. The specifications of each cluster are shown in appropriate detail in Table 1.
A high-level illustration of the inner workings of a Spark compute cluster reveals the distributed design. This enables efficiency and parallel computing capabilities, with a strong centralized management node dispatching tasks to workers, as seen in Figure 2. Most of what a programmer does in a given pipeline component (interactive notebooks) interfaces only with the Spark runtime running on a driver node. The driver node, along with the cluster manager, is responsible for provisioning real resources and dispatching worker nodes to complete tasks. For smart building fault detection, relevant workflows were written in Python 3. We can again explore the virtual environment system by issuing ‘!which python’ to the worker, which reveals that the location of the Python binary in use is cluster-local and that, consequently, the respective ‘site-packages’ folder is also cluster-local. This is where PyPi dependencies are stored for the lifetime of the Spark context. It should be noted that managing dependencies at this level requires the installation of packages from a ‘requirements.txt’ file every time you start up a cluster. In other words, when a cluster terminates, the local storage on each worker node is restored to a default state. It was determined early on that this Spark context-scoped method of dependency management would not suffice. However, upon initialization, every cluster had access to the Databricks FS where the BLOB containers are FUSE mounted by itself, creating a local mount. In addition to different storage mediums creating a challenging dependency management situation, quota restrictions also proved to be challenging throughout the lifetime of the development phase. With everchanging requirements, the Azure subscription was also subject to change. As more workflows were attached to our primary clusters, and with the use of certain high-performance analytics libraries (namely ‘xgboost’ and ‘pyspark’), the Spark runtime attempted to up-scale the number of cores required to complete certain tasks. Most roadblocks had technical solutions, but communication with subscription administrators was key in resolving the recurrent quota issue. After properly configuring the compute clusters on the workspace platform and integrating the primary storage medium with the DBFS, we were able to read and explore raw data.

2.3. Data Warehousing Technology

Apache Hive is a data warehousing technology (similar to a Database Management System, DBMS) primarily used for managing data tables in large-scale projects providing a high-level relational and non-relational abstract interface to reading/writing Resilient Distributed Datasets (RDDs) in the Hadoop distributed file system pattern [12]. The process of reading and writing to RDDs is conducted through the Spark API from a given notebook. See Figure 3.
The process of reading and writing to SQL tables in Hive is seamless and highly abstracted. Each notebook has an in-memory dataset (DataFrame) copy of the relevant table in the main memory of each worker node. This can be seen in Figure 3. Actions manipulate these in-memory copies. When calls to ‘pyspark’ are made to overwrite the corresponding Hive table, real IO takes place between the cluster and the Resilient Distributed Dataset (RDD) management system’s controller. Our workspace platform, Databricks, was designed to integrate well with Apache big data technologies. It follows that setting up the Hive warehouse is simple. The ‘pyspark’ library provides a clean interface to send read/write schemas to the default location inside Hive. All intermediary datasets and final output datasets were dumped to Hive. Generally, after any amount of pre-processing or real-time ingestion, intermediary datasets were written to Hive. The analytics workflows would pick up the clean integrated tables to perform machine learning before outputting the results to final datasets also in Hive [13]. The largest obstacle encountered with the data warehousing technology was a natural side effect of a big data project. With almost a dozen different table formats and various fields being added and removed at different stages of the BFD pipeline, the Spark schemas were constantly changing. Taking special note of what fields were required at each stage of the pipeline (actuated by a particular notebook) and their respective Spark data type (‘pyspark.sql.types’ members, namely ‘StructType’, ‘StructField’, ‘StringType’, ‘IntegerType’, ‘DoubleType’, ‘TimestampType’, etc.) was a manual solution that produced consistent results. Additionally, when writing to Hive with ‘pyspark.DataFrame.write’, we enabled the mode option ‘overwriteSchema’ which worked seamlessly, so long as the expected fields between the DataFrame and the destination RDD were consistent. Spark’s ability to infer data types is admittedly flawed, but these obstacles provided ample opportunity to familiarize ourselves with not only the Databricks environment, but the intricacies of the Apache Spark API. We were able to successfully build our own Spark schemas, override an old schema to an existing dataset, and finally, export the in-memory dataset to a persistent Hive-managed table.

3. Infrastructure: Pipeline of Workflows and Datasets

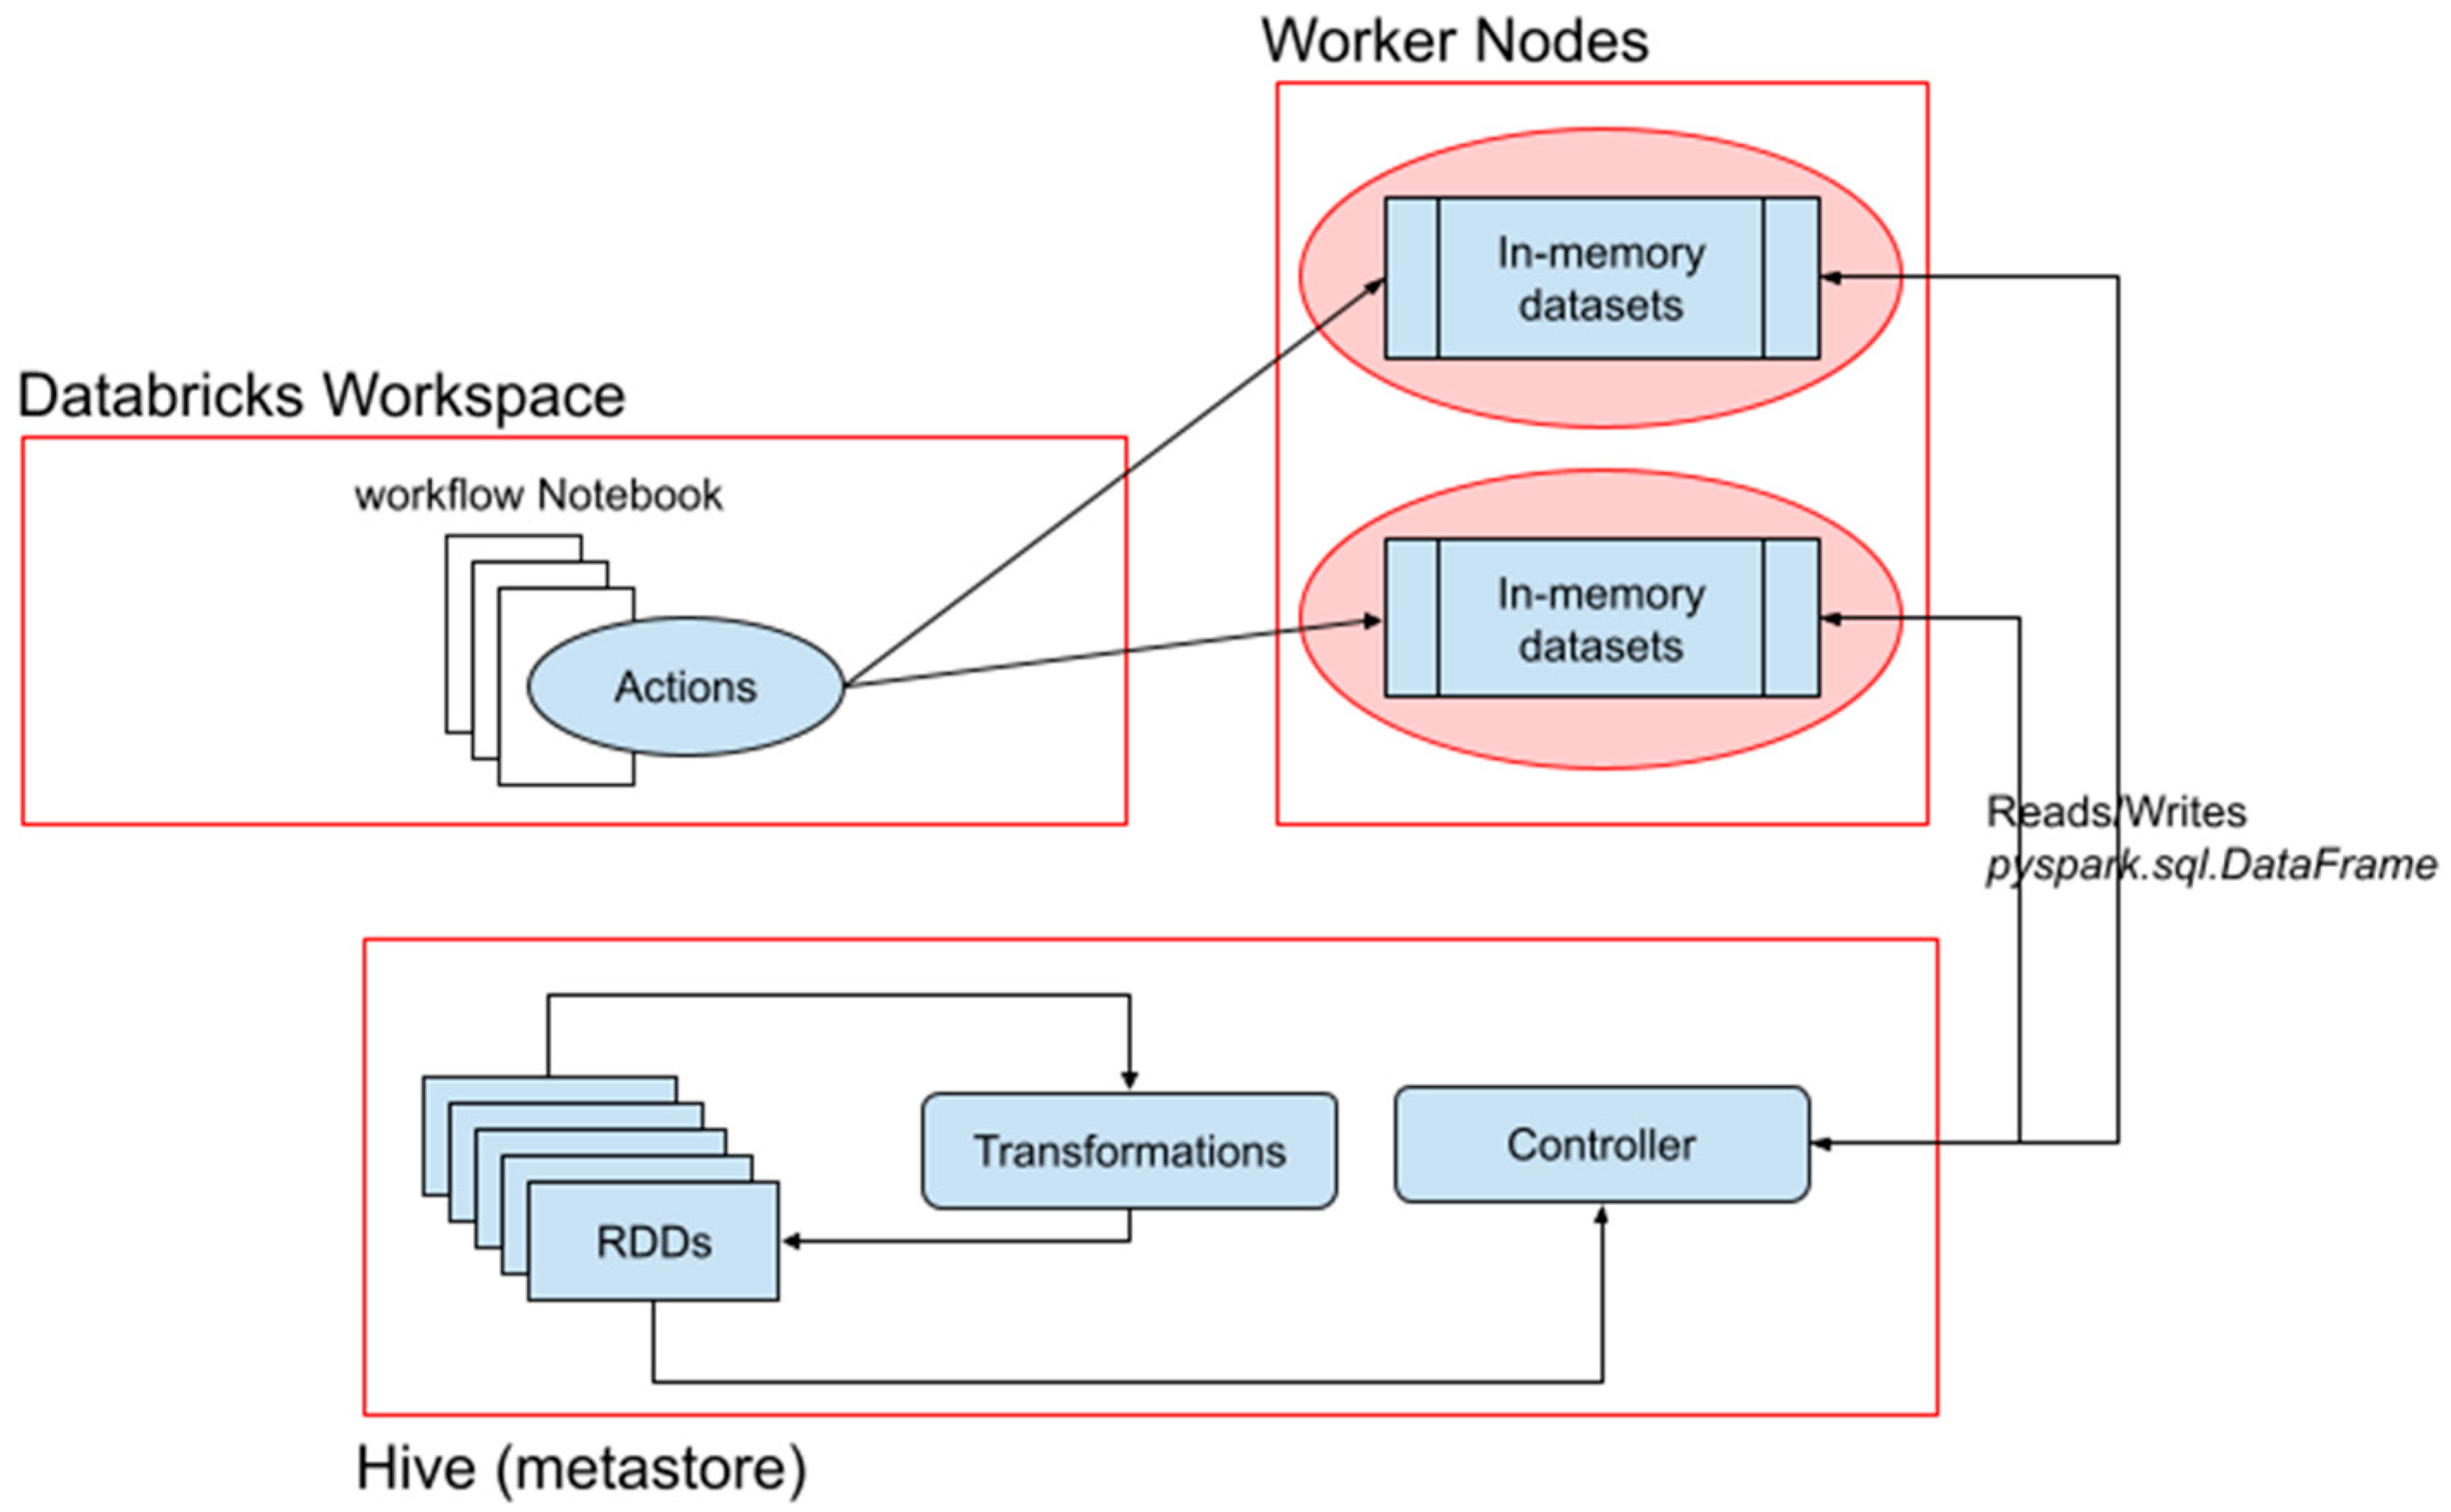
Each workflow in the pipeline (implemented as an interactive notebook specific to the target language) is responsible for the actuation of one of the following tasks: ingestion, integration, cleaning, or analytics. Creating a continuous pipeline between each component of the technology stack was an issue of interaction between the notebooks. For example, ‘prepare_integrated_datasets’ must proc before ‘outlier_detection_integrated_datasets’ in order for the later notebook to ingest the data required to complete that stage. The general architecture is as follows: each notebook read an RDD from Hive into memory as a ‘pyspark.DataFrame’. This enables both programmatic (using ‘PySpark’ API) and structured queries (SQL) to be executed over the dataset. Work is conducted and the resulting dataset is written back to Hive to a new table, tagged with various prefixes and suffixes denoting exactly what work was conducted to the data before being written to that table. This process is repeated N times until the late-stage workflows (analytics and machine learning) converge on results (energy consumption predictions, detected anomalies, etc.). Simply put, each notebook reads and writes to a storage resource that is accessible by the next notebook in the pipeline to take as its input. Therefore, most notebooks must be actuated synchronously.
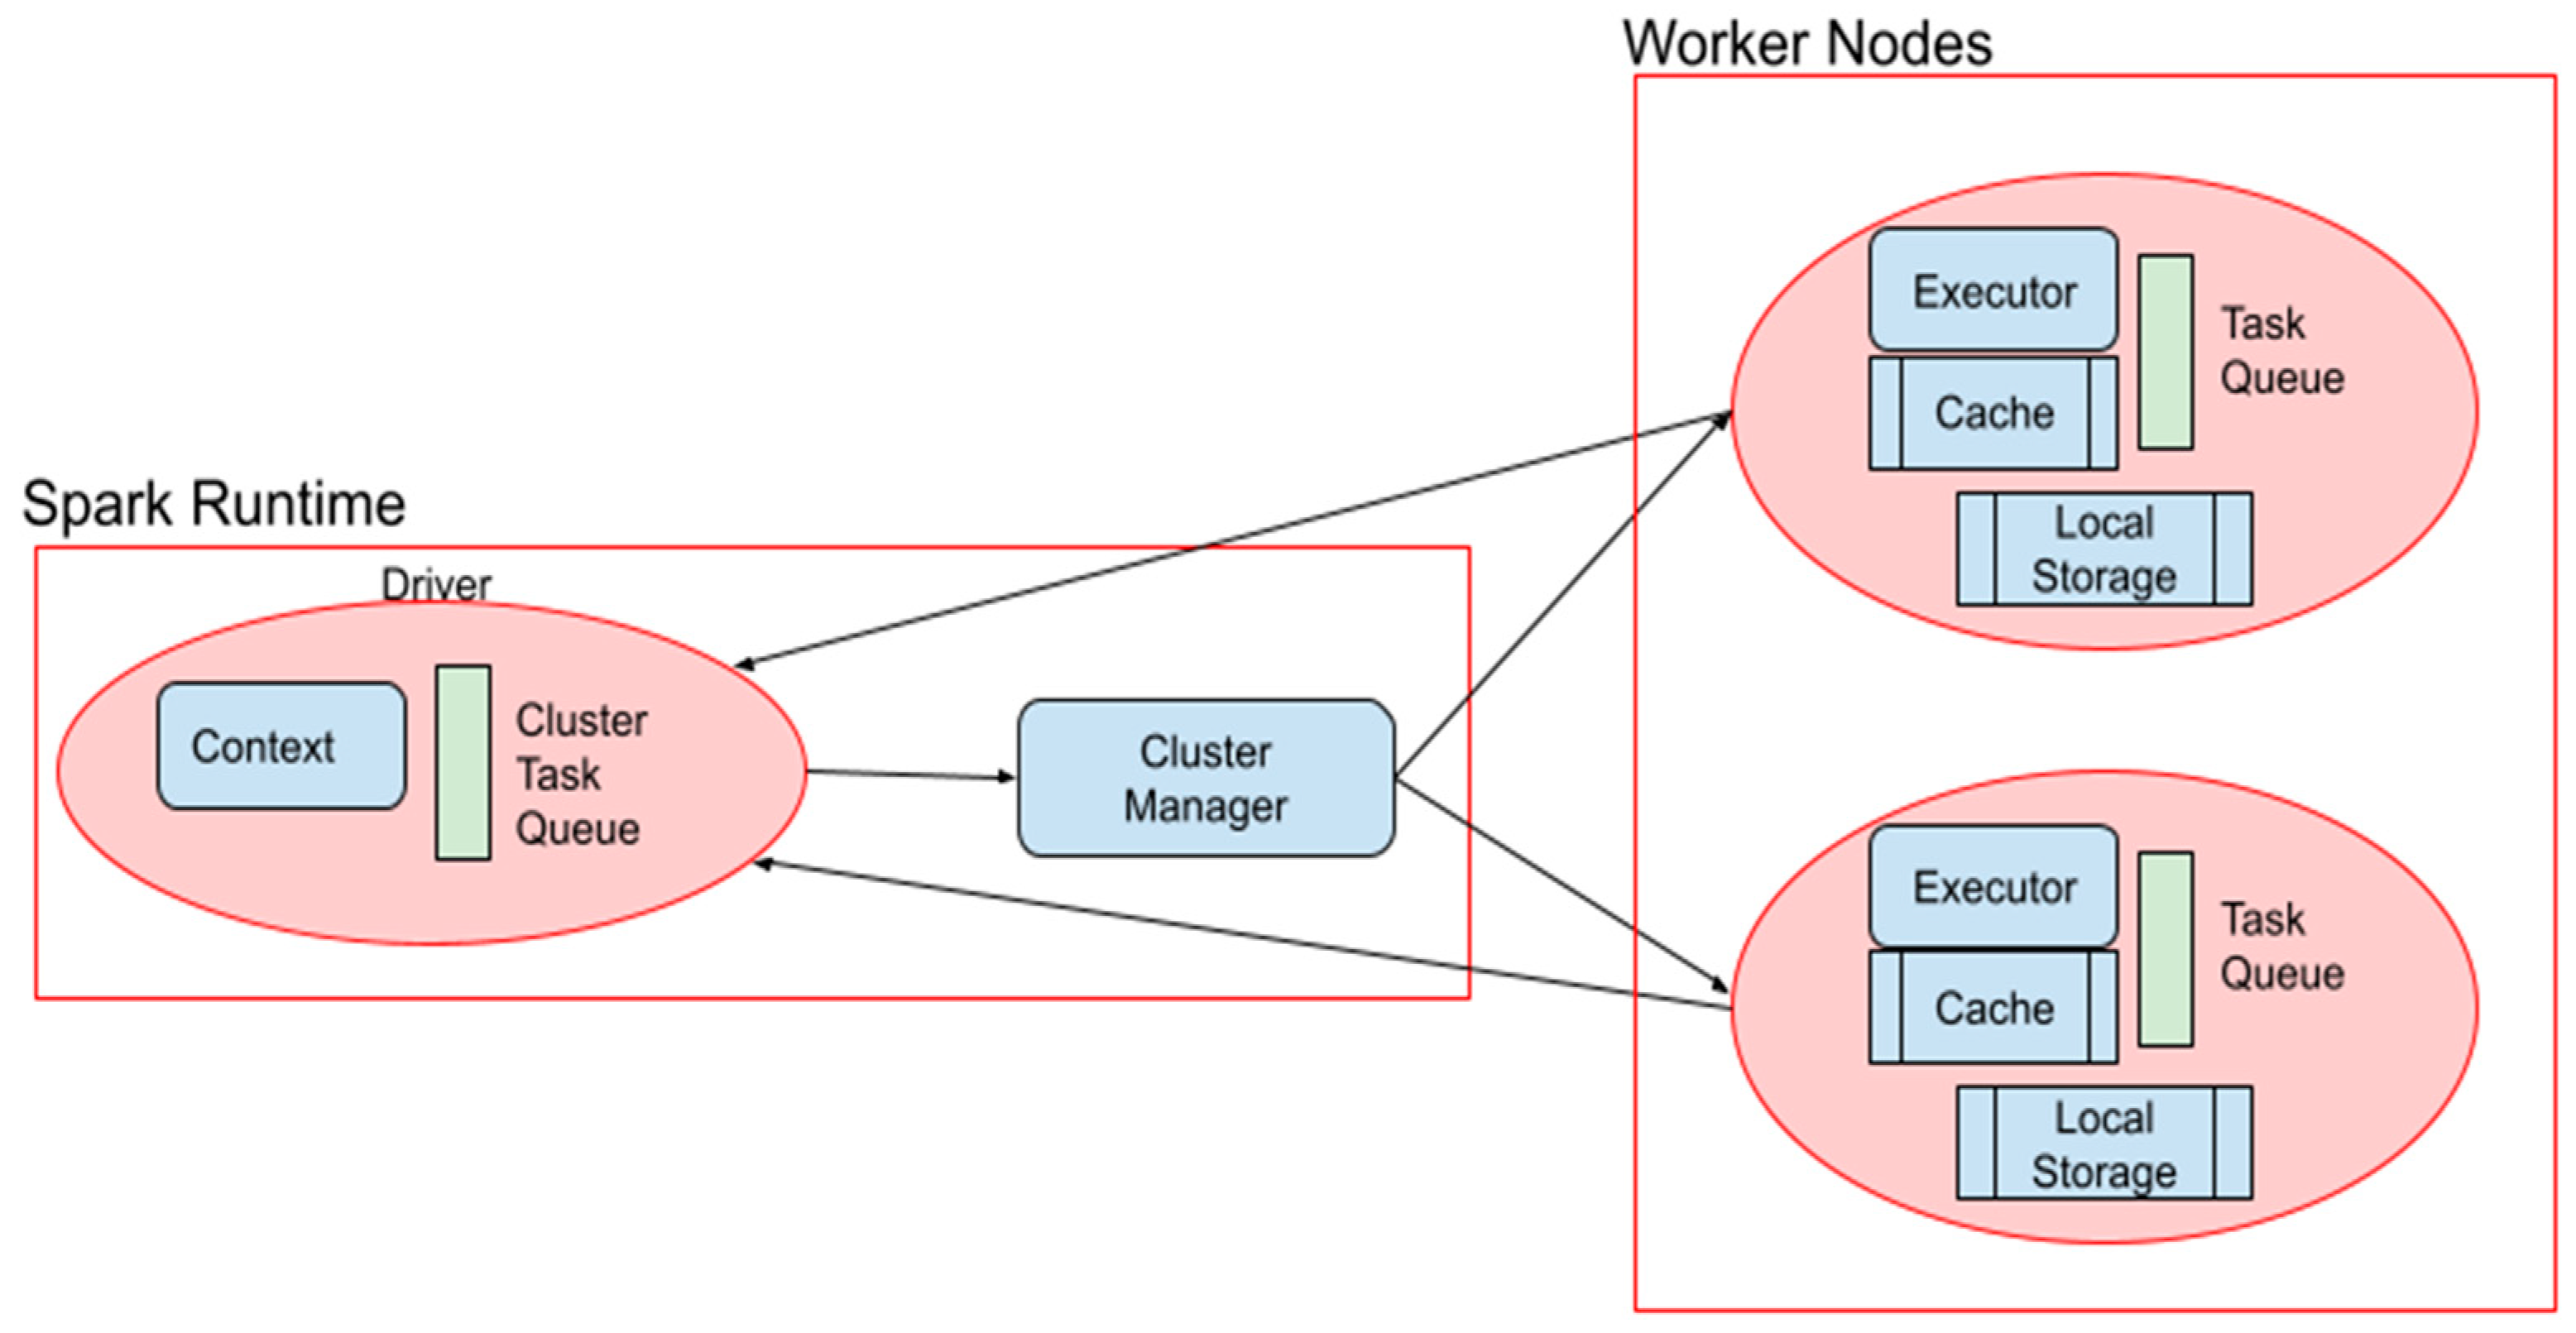
The synchronous nature of each workflow’s execution enables an element of fault tolerance. The scheduling system prevents the next workflow from being triggered if it has data dependencies with a previous failed run. The idea that each workflow has a responsibility to the next workflow limits opportunities for concurrency, but effectively controls for data hazards. Large analytic processes housed in individual notebooks are managed exclusively by Spark compute resources and do in fact execute in parallel as the cluster manager dispatches tasks to worker queues. 
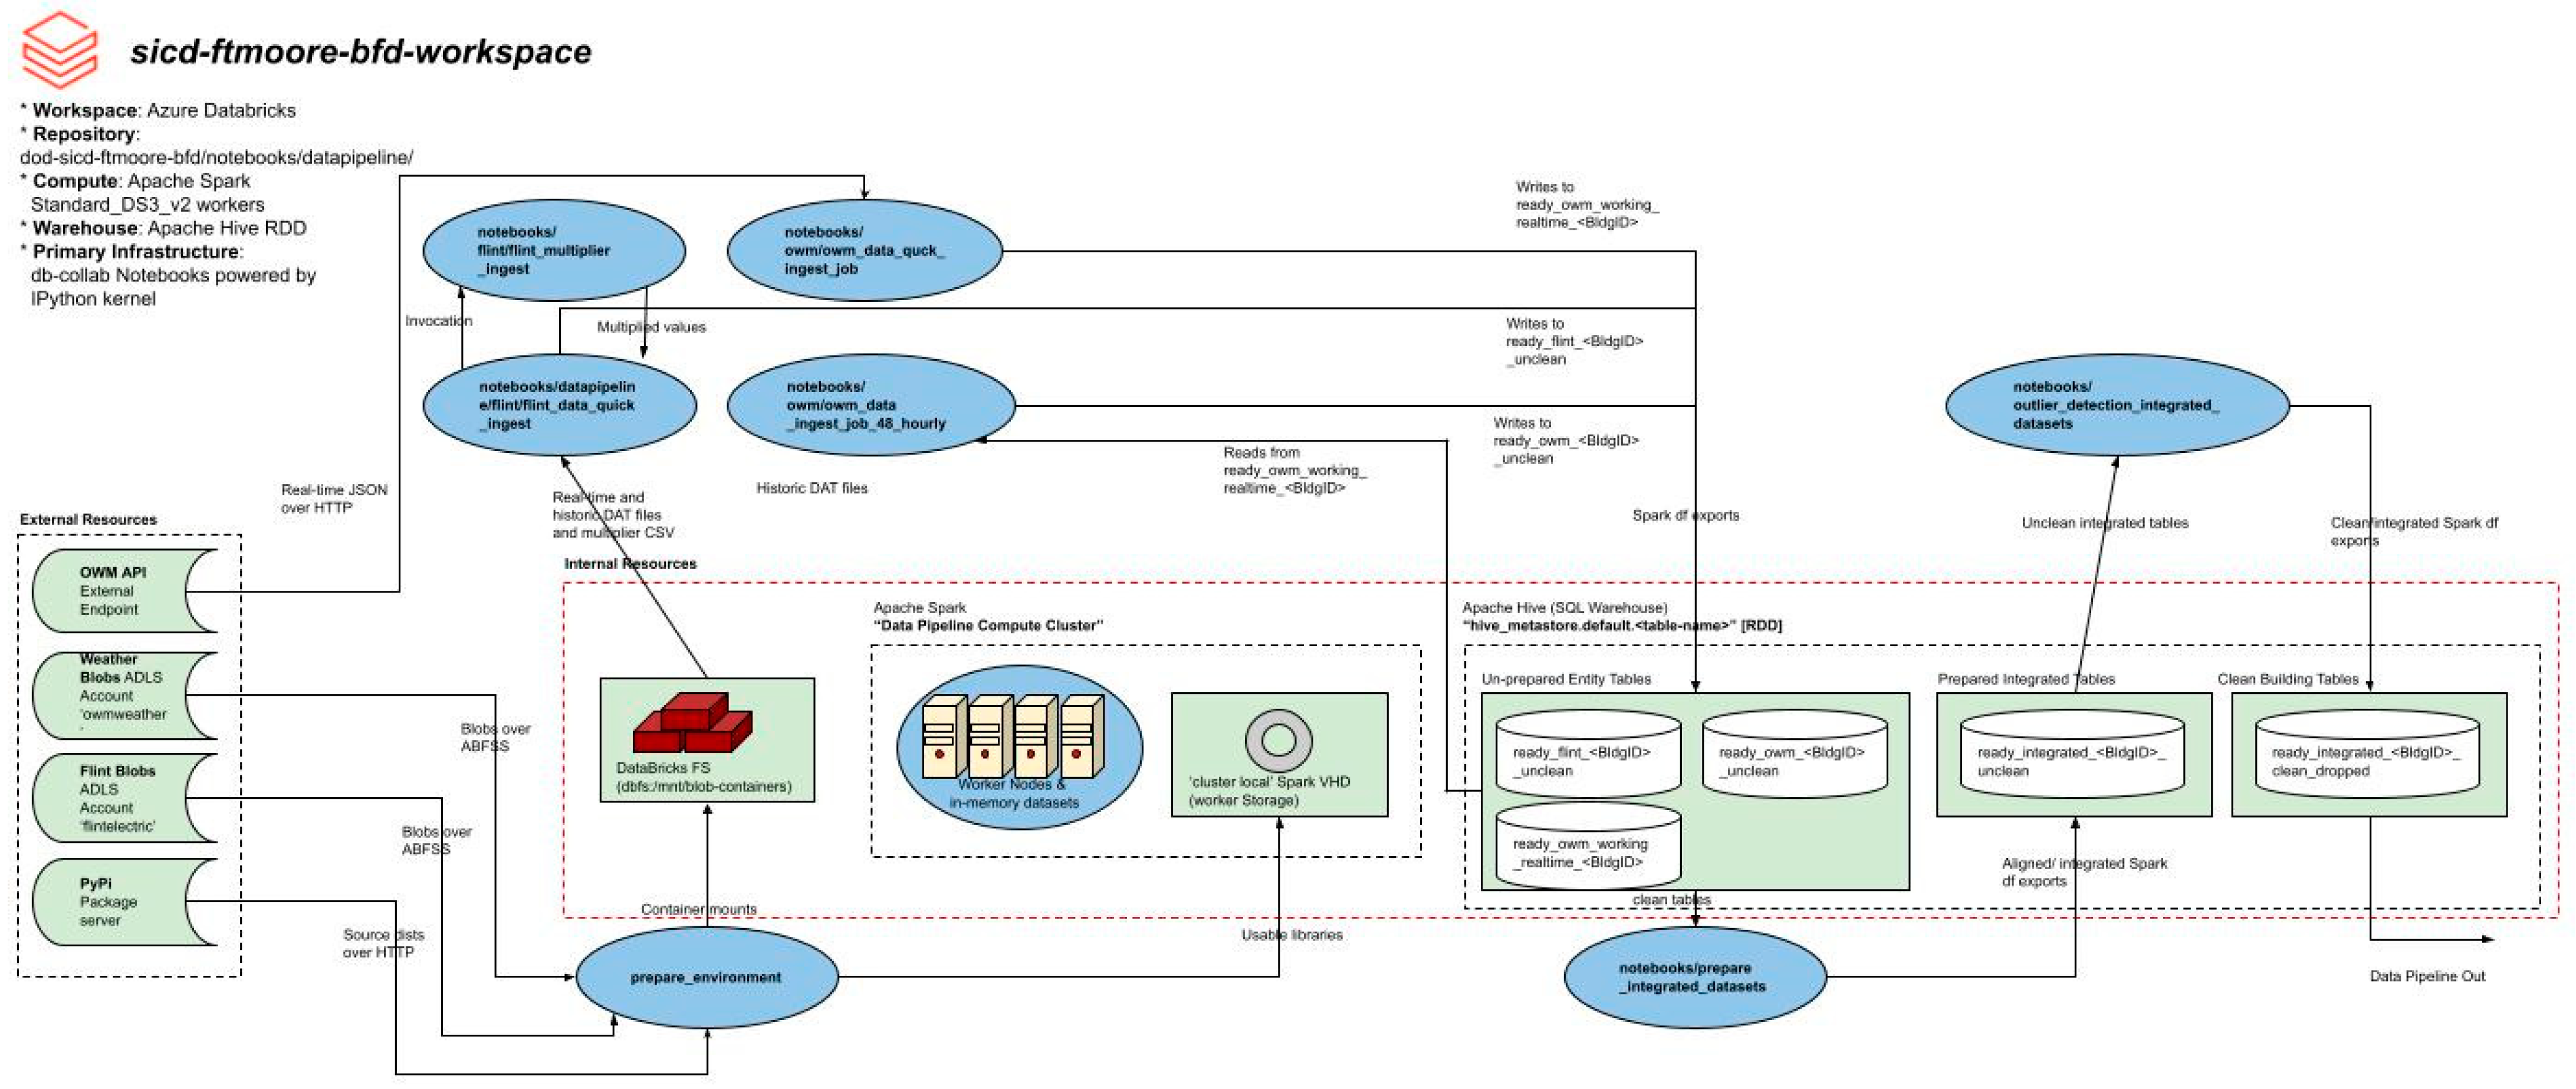
Figure 4 illustrates how every workflow has access to internal resources such as storage and compute, running through the heart of the pipeline.

4. Development Operations

Development Operations (DevOps) is a set of protocols and governing principles that target enhanced collaboration, automation, and efficacy amongst software modules and their developers [14]. The main objective of DevOps is to optimize and automate both the delivery and development of software infrastructure and maintenance [14]. Good DevOps practices enabled our team to rapidly deliver a scalable smart building fault detection product to a third party. To meet the needs of a big data analytics use case like our BFD system, a continuous pipeline of workflows was necessary. Here, the DevOps principles of focus were collaborative workflows and version control, dependency management, and scheduling strategies. Our workspace platform, Databricks, enabled us to apply these principles out of the box with minimal configuration.

4.1. Collaborative Workflows and Version Control

Microsoft Azure Databricks, our workspace platform, provides collaborative notebooks. By giving each developer permission to the workspace on the access control matrix through the Databricks Admin Console, multiple developers can program the same workflow in real-time. Cluster-scoped core quotas inhibited collaborative development at times, especially when two developers were programming different workflows attached to the same Spark cluster context. Via inner-team communication and calculated time management, we were able to overcome these issues and pipeline our efforts by allocating time for certain tasks bound to their respective cluster. Version control was outsourced to the Git versioning system, using GitHub as a provider. Databricks provides a way to connect a remote Git repository to a workspace directory. Here, we placed our relevant Version Control System (VCS) configuration files (.gitignore, etc.). Each developer has to identify himself with their Personal Access Token (PAT) in order to commit to the connected repository. This authentication process happens at the user level in Databricks. Once authenticated, Databricks will assume the developer has access to the remote repository. If this is not the case, the developer will be notified upon an unsuccessful commit. Throughout the lifetime of the project, several commits were made to ensure third parties had access to a clean working source tree. Git largely met our VCS needs for the construction of a building fault detection system. This approach to collaborative workflows allowed a team of four developers to concurrently modify notebooks and make version control commits throughout the development cycle of the SBFD system.

4.2. Dependency Management

Early on, we analyzed the architecture of the Apache Spark clusters and the runtime configuration. As mentioned in Section 2.2 (see output of ‘
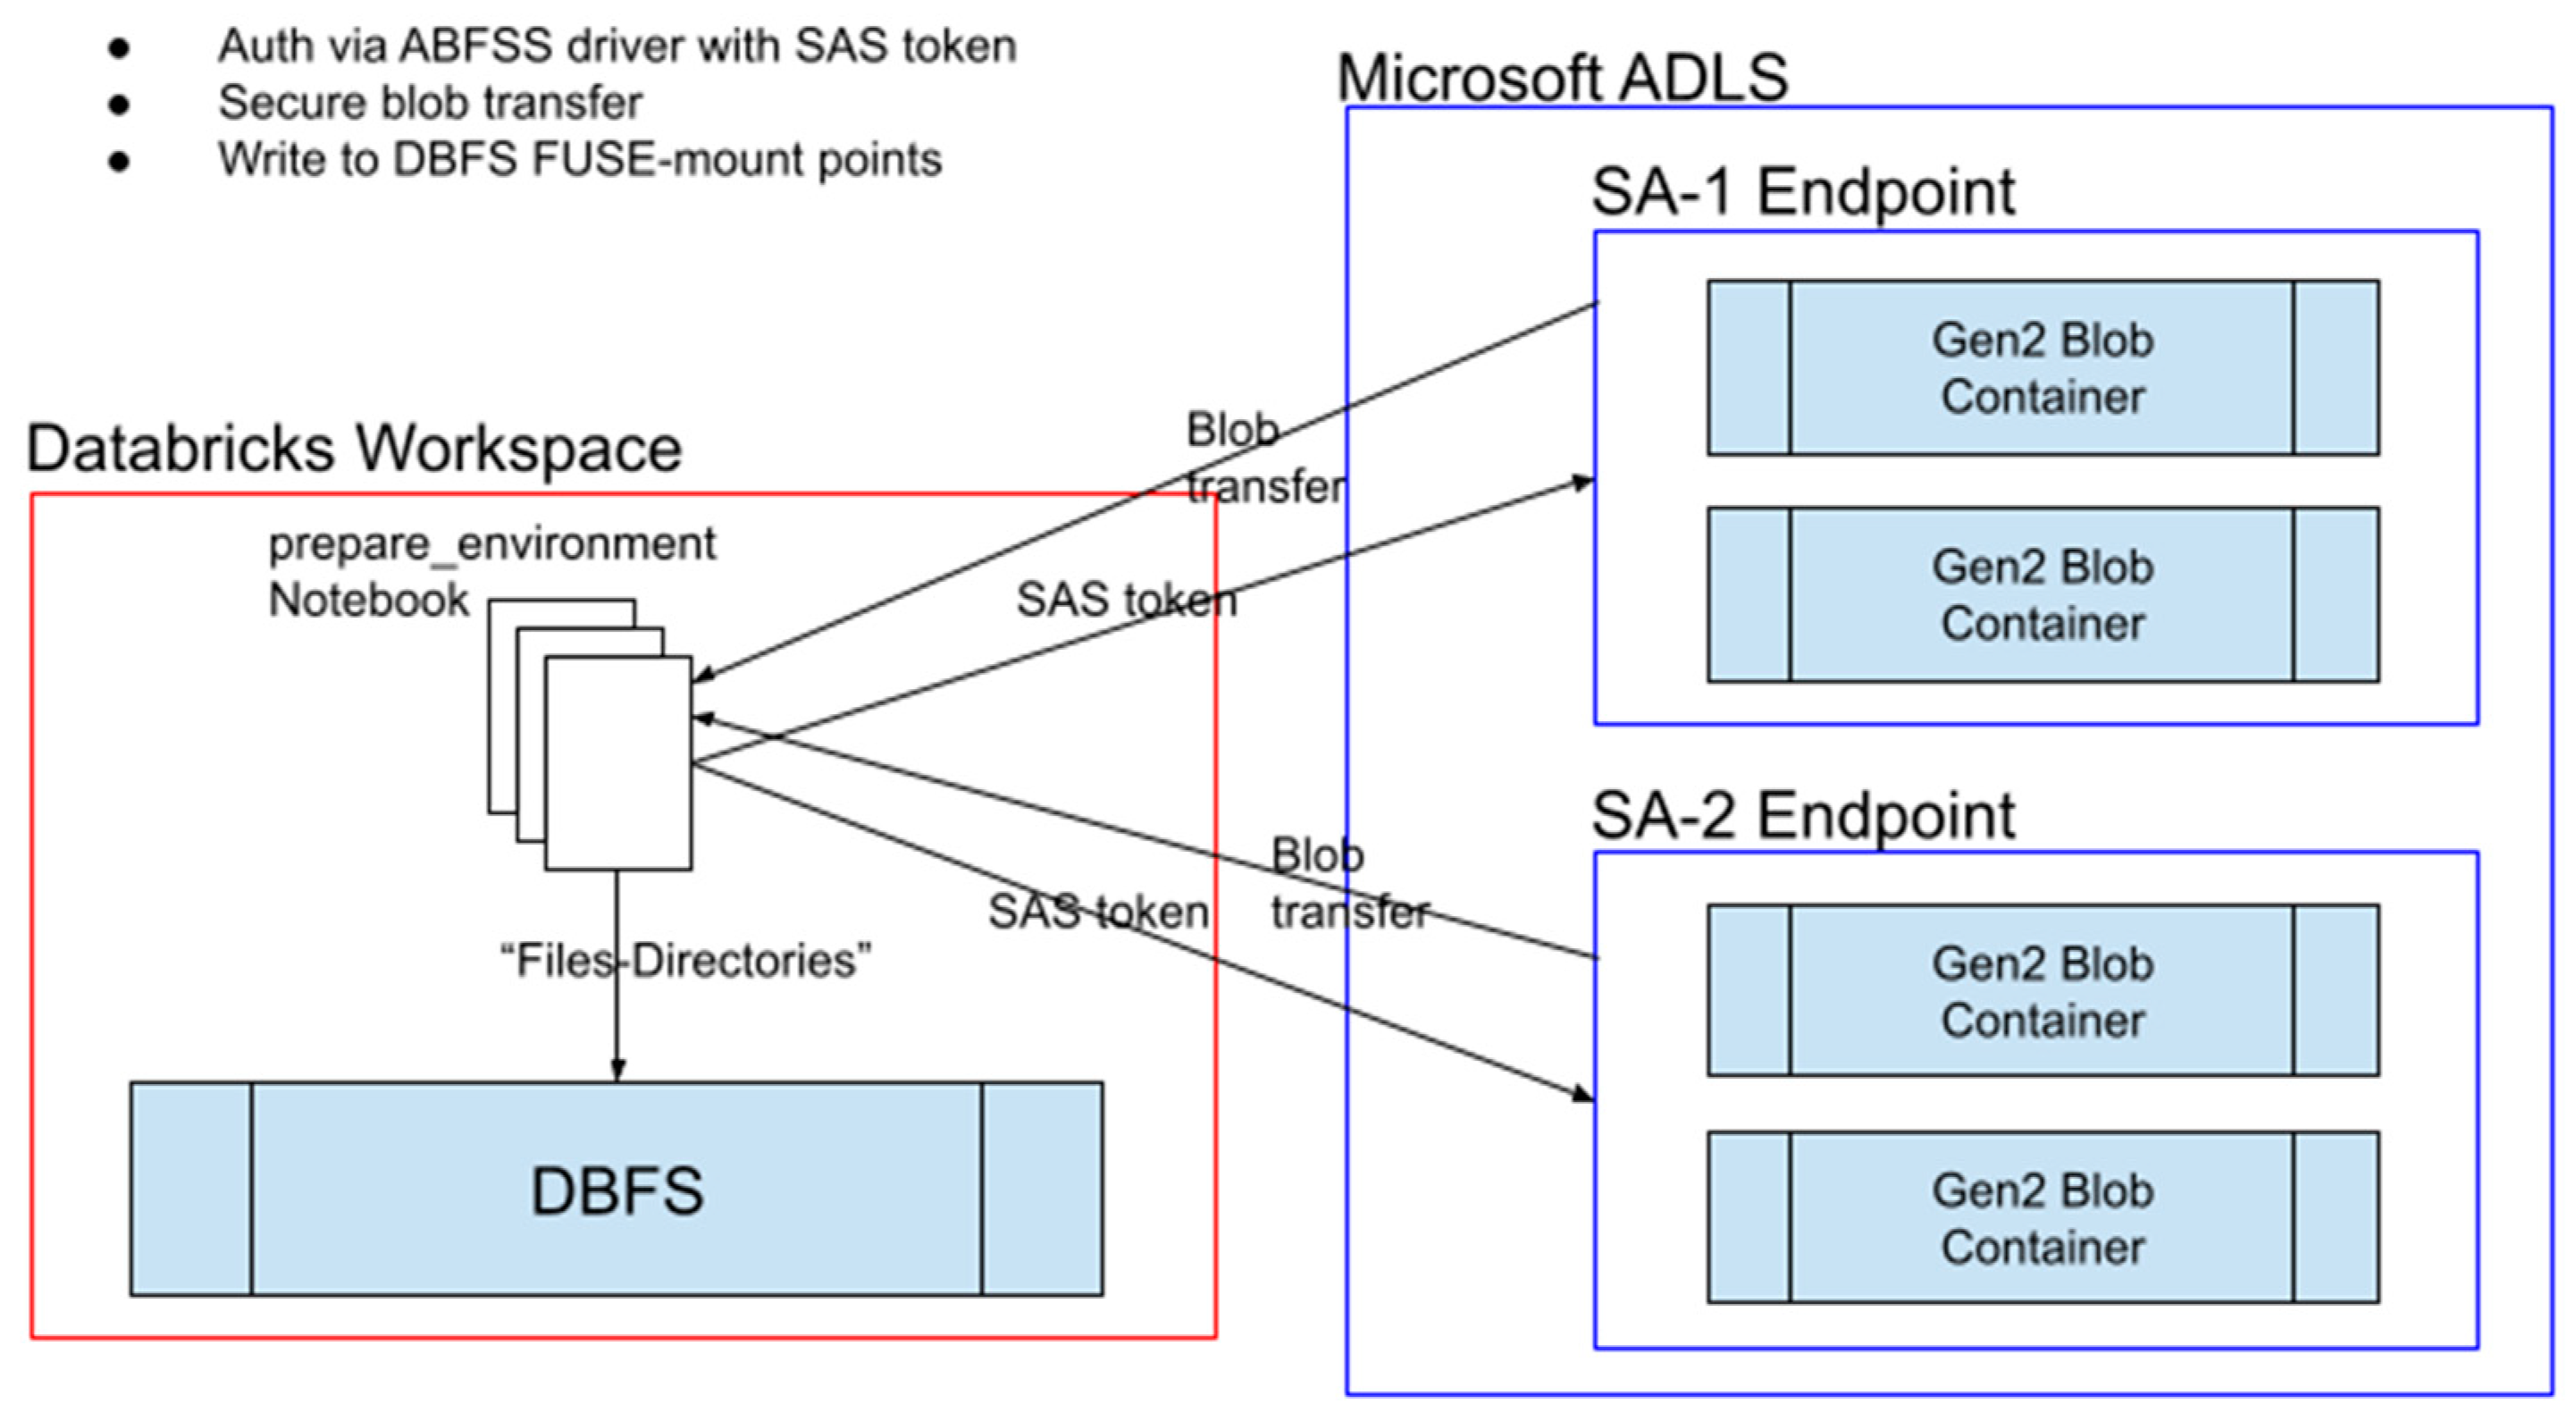
!which python’ command), each worker node in a cluster has local storage that houses a virtual environment (‘venv’) with frozen dedicated binaries for necessary utilities [15]. This is an environment-specific directory that is non-portable and directs all notebooks attached to that cluster to use those specific versions of binaries. In our case, as the selected language implementation on each cluster was Python, this was largely ‘python3′ and ‘pip’, the official PyPi package manager. A full Python 3 unpacked source distribution is present in this virtual environment, along with a site-packages folder where source wheels for Python libraries are installed. Early on, at the beginning of each notebook, there would be command cells dedicated to installing the required dependencies. This is because the persistence policy of the modified virtual environments is weak, i.e., the lifetime of the Spark context. When a cluster is terminated and rebooted, all changes made to the local worker storage are reverted. The work around is admittedly late-stage but simple: Databricks provides a cluster-scoped dependency management console where you can set packages and exact version numbers that you expect to be present on each cluster. The dependency manager applies the set versions to the site-packages folder present on the virtual environments of each of the cluster’s worker nodes. Currently, this meets our needs. The team is exploring the possibility of dedicated initialization scripts for global and cluster scopes using the ‘dbcli’ utility to have robust control over the configuration of Apache Spark including the dependencies made available to each cluster. None of the 3% of workflows that have been observed to generate runtime exceptions have been due to dependencies, displaying the efficacy of this management strategy.

4.3. Automation

Originally, the team had planned to write a primitive driver for the orchestration and automation of pipeline tasks, housed in one notebook that would itself be scheduled by the Databricks workflow scheduling interface. This proved to be unnecessary, as some perceived complexities in the automation simply did not exist. The actual timeline of which ingestion tasks needed to happen at what time and the order that various preparation and cleaning workflows needed to be in turned out to be quite simple. Consequently, the BFD system entirely relies on Databricks for task automation. Each notebook is scheduled to run at a certain time every so often according to the need. Ample time for each stage to complete is given between the scheduled runtime of the next workflow.
The only workflow that is scheduled daily is that which is responsible for the ingestion of open weather data. This happens every hour of every day in real-time to maintain an up-to-date record of observations for various climatic variables that aid in energy consumption predictions.
Three primary workflow jobs consisting of 6–12 notebooks each make up the automated portion of the deployed pipeline. This approach to automation has yielded successful results, with 100% of workflows triggering as scheduled. At the occurrence of Spark runtime exceptions, the fault-tolerant nature of the pipeline has shined. The offending workflows will proc on the next available compute time slice, with most exceptions occurring because of Spark misconfigurations that resolve themselves before the next attempt. These runtime exceptions have been observed to occur in less than 3% of job runs up to this point in deployment.

5. Results

The deployment of the code base yielded impressive results. The pipeline is currently providing energy consumption predictions and fault detection for over dozens of buildings on a military installation. Just as fast as consumption and climatic data is taken in, results are forwarded to a dashboard in real-time. The primary analytic pipeline currently ingests upwards of 2356 DAT files with building-level use data, along with climatic variables for each of the 96 relevant building locations, and produces results within 14 min on average. The pipeline is surely fault tolerant and resistant to runtime exceptions. Data has not failed to arrive on the expected resource at any time in deployment, and 100% of job runs that have been observed to generate runtime exceptions up to this point (3% of the total job runs) have successfully recovered after being automatically triggered for another run. Additionally, the pipeline’s ability to scale up is not in question, as we have seen very little growth in runtime as more locations (smart buildings) are added to the diagnostic system. The team accredits this fault tolerance to the simplicity of the proposed architecture. Approaches taken by other researchers including SBDaaS fault detection [2] and direct-to-cloud WSN fault detection [3] show that there are many different architectures that are capable of meeting the needs of a big data analytic workload. The approach taken should be selected according to project specifications, the most decisive of such are the number of data sources, the number of smart buildings, time constraints, and a future need for vertical scaling or lack thereof. The lack of numerous data sources in the SBFD use case lent itself well to the centralized approach and made rapid development and deployment possible. There is limited research involving not only a proposed smart building diagnostic architecture, but actual results from a real-world application. Comparing concrete results is difficult given this fact, but this adds to the novelty of our proposal in that it is actively deployed.

6. Conclusions

Using cutting-edge cloud technologies and tireless programmatic configurations of the pipeline components, a smart building fault detection system was developed and deployed in less than one calendar year. Understanding the need for collaboration and implementing the seamless interaction between components of the tech stack was crucial to the success of this project. Sticking to a tightly centralized design and outsourcing the ingestion of parameters on a per-building basis enabled rapid horizontal scaling. With big data on the rise, relying on distributed compute and distributed storage platforms is becoming a must. Knowing how to interface with these platforms and write fault-tolerant codes to drive the various workflows of a big data pipeline will soon be the only way to process large amounts of data and perform analytics efficiently. In the next phase of the project, several data sources will be added to the pipeline. This will introduce new challenges in the area of infrastructure solution and development operations, most notably, a distributed network of sensor data. Integrating these subsystem sensors into a centralized architecture will prove a unique challenge and likely force the creation of a new approach to smart building diagnostics.

Author Contributions

Conceptualization, M.R.A., Y.P. and S.K.; methodology, T.M., K.H. and R.Z.; software, T.M. and K.H.; validation, T.M. and K.H.; investigation, T.M. and K.H.; writing—original draft preparation, T.M.; visualization, T.M.; supervision, R.Z.; project administration, M.R.A., Y.P. and S.K.; funding acquisition, M.R.A. and S.K. All authors have read and agreed to the published version of the manuscript.

Funding

This work is funded in part by a Student Research and Creative Endeavors Grant from Columbus State University through US Ignite (Fund#: 30177).

Data Availability Statement

Restrictions apply to the availability of these data. Data was obtained from US Ignite and are available from the authors with the permission of US Ignite.

Acknowledgments

US Ignite, Inc. as part of the “Smart Installation Community Dashboard” (SICD) Project., the United States Army Corps of Engineers, other developers and contributors not listed.

Conflicts of Interest

The authors declare no personal conflicts of interest. The funder purchased Cloud resources used to implement the pipeline architecture proposed in this paper. The funder benefited only from the data processed by the pipeline and the analytics results, not from the study done in this paper (i.e., the architecture of the pipeline, the efficiency statistics of its performance). The funder was not involved in the design of this study, the collection and analysis of results, or the interpretation of the specific data presented in this paper. The funder was not involved in the writing of this article or the decision to submit it for publication, and the funder benefits in no way from the proliferation of this specific approach as proposed herein.

References

  1. Bourhnane, S.; Abid, M.R.; Lghoul, R.; Zine-dine, K.; Elkamoun, N.; Benhaddou, D. Machine learning for Energy Consumption Prediction and Scheduling in Smart Buildings. Spring Nat. Appl. Sci. J. 2020, 2, 297. [Google Scholar] [CrossRef]
  2. Mohamed, N.; Lazarova-Molnar, S.; Al-Jaroodi, J. SBDaaS: Smart Building Diagnostics as a Service on the Cloud. In Proceedings of the 2016 2nd International Conference on Intelligent Green Building and Smart Grid (IBSG), Prague, Czech Republic, 27–29 June 2016. [Google Scholar] [CrossRef]
  3. Stamatescu, I.; Bolboaca, V.; Stamatescu, G. Distributed Monitoring of Smart Buildings with Cloud Backend Infrastructure. In Proceedings of the 2018 International Conference on Control, Decision and Information Technologies (CoDIT’18), Orlando, FL, USA, 4–7 December 2018. [Google Scholar] [CrossRef]
  4. Benhaddou, D.; Abid, M.R.; Achahbar, O.; Khalil, N.; Rachidi, T.; Al Assaf, M. Big data processing for smart grids. IADIS Int. J. Comput. Sci. Inf. Syst. 2015, 10, 32–46. [Google Scholar]
  5. Munappy, A.R.; Bosch, J.; Olsson, H.H. Data Pipeline Management in Practice: Challenges and Opportunities. In Product-Focused Software Process Improvement; Morisio, M., Torchiano, M., Jedlitschka, A., Eds.; Lecture Notes in Computer Science; Springer: Berlin/Heidelberg, Germany, 2020; Volume 12562. [Google Scholar]
  6. Jannach, D.; Jugovac, M.; Lerche, L. Supporting the design of machine learning workflows with a recommendation system. ACM Trans. Interact. Intell. Syst. (TiiS) 2016, 6, 1–35. [Google Scholar] [CrossRef]
  7. Levy, E.; Silberschatz, A. Distributed file systems: Concepts and examples. ACM Comput. Surv. (CSUR) 1990, 22, 321–374. [Google Scholar] [CrossRef]
  8. Vangoor, B.K.R.; Tarasov, V.; Zadok, E. To FUSE or not to FUSE: Performance of User-Space file systems. In Proceedings of the 15th USENIX Conference on File and Storage Technologies (FAST’17), Santa Clara, CA, USA, 27 February–2 March 2017. [Google Scholar]
  9. Ravat, F.; Zhao, Y. Data lakes: Trends and perspectives. In Proceedings of the Database and Expert Systems Applications: 30th International Conference, DEXA 2019, Linz, Austria, 26–29 August 2019; Proceedings, Part I 30. Springer International Publishing: Berlin/Heidelberg, Germany, 2019; pp. 304–313. [Google Scholar]
  10. Chaimov, N.; Malony, A.; Canon, S.; Iancu, C.; Ibrahim, K.Z.; Srinivasan, J. Scaling Spark on HPC systems. In Proceedings of the 25th ACM International Symposium on High-Performance Parallel and Distributed Computing, Kyoto, Japan, 31 May–4 June 2016; pp. 97–110. [Google Scholar]
  11. Shvachko, K.; Kuang, H.; Radia, S.; Chansler, R. The hadoop distributed file system. In Proceedings of the 2010 IEEE 26th Symposium on Mass Storage Systems and Technologies (MSST), Incline Village, NV, USA, 3–7 May 2010; pp. 1–10. [Google Scholar]
  12. Camacho-Rodríguez, J.; Chauhan, A.; Gates, A.; Koifman, E.; O’Malley, O.; Garg, V.; Haindrich, Z.; Shelukhin, S.; Jayachandran, P.; Seth, S.; et al. Apache hive: From mapreduce to enterprise-grade big data warehousing. In Proceedings of the 2019 International Conference on Management of Data, Amsterdam, The Netherlands, 30 June–5 July 2019; pp. 1773–1786. [Google Scholar]
  13. Salloum, S.; Dautov, R.; Chen, X.; Peng, P.X.; Huang, J.Z. Big data analytics on Apache Spark. Int. J. Data Sci. Anal. 2016, 1, 145–164. [Google Scholar] [CrossRef]
  14. Erich, F.; Amrit, C.; Daneva, M. Report: DevOps Literature Review; National Institute of Advanced Industrial Science and Technology: Tokyo, Japan, 2014; pp. 5–7. [Google Scholar] [CrossRef]
  15. Zaharia, M.; Xin, R.S.; Wendell, P.; Das, T.; Armbrust, M.; Dave, A.; Meng, X.; Rosen, J.; Venkataraman, S.; Franklin, M.J.; et al. Apache Spark: A unified engine for big data processing. Commun. ACM 2016, 59, 56–65. [Google Scholar] [CrossRef]
Figure 1. A high-level overview of mounting remote ADLS objects as DBFS files/directories.
Computers 13 00023 g001
Figure 2. Apache Spark compute cluster architecture.
Computers 13 00023 g002
Figure 3. Interaction between Hive, in-memory datasets (Spark DataFrames) and the various workflow notebooks in the pipeline.
Computers 13 00023 g003
Figure 4. Actual production architectural diagram detailing the interaction between all resources and workflow notebooks in the pipeline. Note the fact that each workflow notebook interacts with a specific storage resource as both input and output, and the next notebook in the pipeline takes the previous notebook’s output as input. This process continues.
Computers 13 00023 g004
Table 1. Manifest of relevant clusters used to deploy the pipeline.
ClusterRuntimeNodesSpecs (Per Worker)
Data Pipeline ClusterDB Runtime 11.3
LTS
2 × Standard_D_S3_v214 GB, 4-cores
ML ClusterML Runtime 12.2 LTS2 × Standard_D_S3_v214 GB, 4-cores
Disclaimer/Publisher’s Note: The statements, opinions and data contained in all publications are solely those of the individual author(s) and contributor(s) and not of MDPI and/or the editor(s). MDPI and/or the editor(s) disclaim responsibility for any injury to people or property resulting from any ideas, methods, instructions or products referred to in the content.

