Abstract
The opinion dynamics literature argues that the way people perceive social influence depends not only on the opinions of interacting individuals, but also on the individuals’ non-opinion characteristics, such as age, education, gender, or place of residence. The current paper advances this line of research by studying longitudinal data that describe the opinion dynamics of a large sample (~30,000) of online social network users, all citizens of one city. Using these data, we systematically investigate the effects of users’ demographic (age, gender) and structural (degree centrality, the number of common friends) properties on opinion formation processes. We revealed that females are less easily influenced than males. Next, we found that individuals that are characterized by similar ages have more chances to reach a consensus. Additionally, we report that individuals who have many common peers find an agreement more often. We also demonstrated that the impacts of these effects are virtually the same, and despite being statistically significant, are far less strong than that of opinion-related features: knowing the current opinion of an individual and, what is even more important, the distance in opinions between this individual and the person that attempts to influence the individual is much more valuable. Next, after conducting a series of simulations with an agent-based model, we revealed that accounting for non-opinion characteristics may lead to not very sound but statistically significant changes in the macroscopic predictions of the populations of opinion camps, primarily among the agents with radical opinions (≈3% of all votes). In turn, predictions for the populations of neutral individuals are virtually the same. In addition, we demonstrated that the accumulative effect of non-opinion features on opinion dynamics is seriously moderated by whether the underlying social network correlates with the agents’ characteristics. After applying the procedure of random shuffling (in which the agents and their characteristics were randomly scattered over the network), the macroscopic predictions have changed by ≈9% of all votes. What is interesting is that the population of neutral agents was again not affected by this intervention.
    1. Introduction
Social influence is perhaps one of the most intriguing and fascinating phenomena that affect our daily lives. In so-called opinion formation models (also known as social influence models), the social influence effects are captured by specific mathematical rules that outline how agents’ opinions (operationalized as discrete or continuous quantities standing for agents’ choices or subjective attitudes toward predefined controversial issues) are changed after being exposed to peers’ opinions [,]. These models are able to explain a huge variety of macro-scale social phenomena, such as consensus, polarization, segregation, and the formation of echo chambers []. However, the empirical foundation behind opinion formation models is rather limited—the majority of models have never been tested against real data, with only a few of them being validated in empirical settings [,].
Over the past few years, the situation has slowly changed [,,,,,]. Partially, this becomes possible due to the large amount of open data available from online resources. In some situations, these data allow reconstructing opinion dynamics of Internet users—social media sites give a perfect opportunity to make unobtrusively repeated measurements of users’ communications with high resolution. After being carefully pretreated (for example, users’ opinions should be estimated using some opinion mining techniques), such information can be used to test hypotheses regarding social influence at both the qualitative and quantitative levels [,,,,,,,].
An extremely important issue in studies of social influence and information dissemination is to understand how influential a particular individual is (that is, how effectively they influence other people) and how strongly they are attached to their own opinion []. Empirical research suggests that individuals are not homogeneous in influence perception [], and the way they distribute trust over their communication networks may depend on many factors, both demographic (age, gender, education level, etc.) and structural (the number of friends, the number of common friends, betweenness centrality, etc.). Not to mention that the current opinion of an individual does also affect the individual’s level of confidence—more radical people tend to be more stubborn and less easily influenced [].
Despite our advantages in understanding the structure of trust in social networks, we still lack a systematic investigation and comparison of various factors affecting how effectively individuals influence each other. In this paper, we attempt to challenge this problem by studying empirical longitudinal data derived from an online social network. In these data, detailed information on users’ opinions (estimated based on users’ digital footprints), structural (social ties), and demographic (age and gender) attributes is provided. This gives us an opportunity to rigorously investigate and compare the effects of various factors, both opinion and non-opinion, that influence the way individuals distribute their trust across communication networks.
The rest of the paper is organized as follows. Section 2 reviews the relevant literature. Section 3 briefly describes the plan of our analysis. Section 4 introduces the empirical data. Section 5 outlines our notations and terminology. In Section 6, we investigate the data using regression analysis. Section 7 conducts a series of simulation experiments to test the results of the empirical analysis from Section 6. Section 8 discusses the results and makes concluding remarks. In the Appendix A, Appendix B and Appendix C, auxiliary information is provided.
2. Literature
We would like to start the review of the relevant literature from the classical DeGroot model []. In this model, agents’ opinions are represented on a continuous scale (for example, ), and an agent ’s opinion at the next time model  is defined as a convex combination of their current opinion  and the opinions of the agent’s peers at the previous time moment:


In Equation (1),  is the list of ’s peers, and  represents how strong is the influence directed from  to . In turn,  outlines how stubborn (self-confident) agent  is. The quantities  are usually called the influence weights; the weight  is sometimes referred to as the self-weight. The set of all influence weights defines the influence network—a directed weighted graph whose edges represent how individuals influence each other and how individuals’ trust is distributed among their peers. Despite this terminology usually being applied within the framework of the DeGroot model (and other models that are extensions of the DeGroot model []), we will use the term “influence network” in a broader context—to describe how open individuals are to the influences from their peers and how strong are their attachments to their own opinions (without assuming that opinions evolve in accordance with the DeGroot model).
Using this terminology, we paraphrase our main objective as follows: we will study how the users’ influence weights depend on the nodal and structural characteristics of the networked social system.
A large line of studies is dedicated to the extraction of the influence network from repeated measurements of individuals’ opinions []. A different line of research investigates how influence weights are linked to the intrinsic characteristics of people. At the moment, we already know a lot about how individuals perceive their peers’ opinions in information exchanges. For example, we know that individuals with radical opinions tend to be more stubborn [,]. Further, we know that the level of stubbornness may vary across ideological groups []. An important observation is that younger individuals are considered to be more vulnerable to social influence []. Next, according to Refs. [,,], females cooperate better than males, and thus we should hypothesize that females are more easily influenced. However, such differences may stem from status inequalities []—for example, according to empirical studies, males tend to have more friends and thus may perceive themselves as more valuable []. Further, we know that the perception of a message depends on how distant the message is from the focal individual in terms of the opinion space—too distant opinions may be less attractive [], a phenomenon referred to as bounded confidence [,,]. Next, empirical studies indicate that individuals that have common non-opinion features (such as age, place of residence, or culture) display more trust toward each other even if their opinions differ significantly []. In addition to this, structural similarity, measured, for example, as the number of common friends, fosters the propagation of opinions and ideas [].
Further, an individual’s perception of external information and openness to influence may depend on how influential the individual’s opinions were in previous discussions, even if these discussions were dedicated to completely different topics (the theory of reflected appraisals) []. According to this theory, individuals whose opinions contributed most to previous conversations will reinforce their self-confidence in the next conversation and so on.
In the current paper, we investigate various factors that may affect the organization of influence networks. We will consider not only the effect of individuals’ opinions but also demographic (age, gender) and structural (the number of friends, the number of common friends) effects. What is even more important, we will systematically compare the strength of these effects thus trying to figure out what factors have the greatest impact.
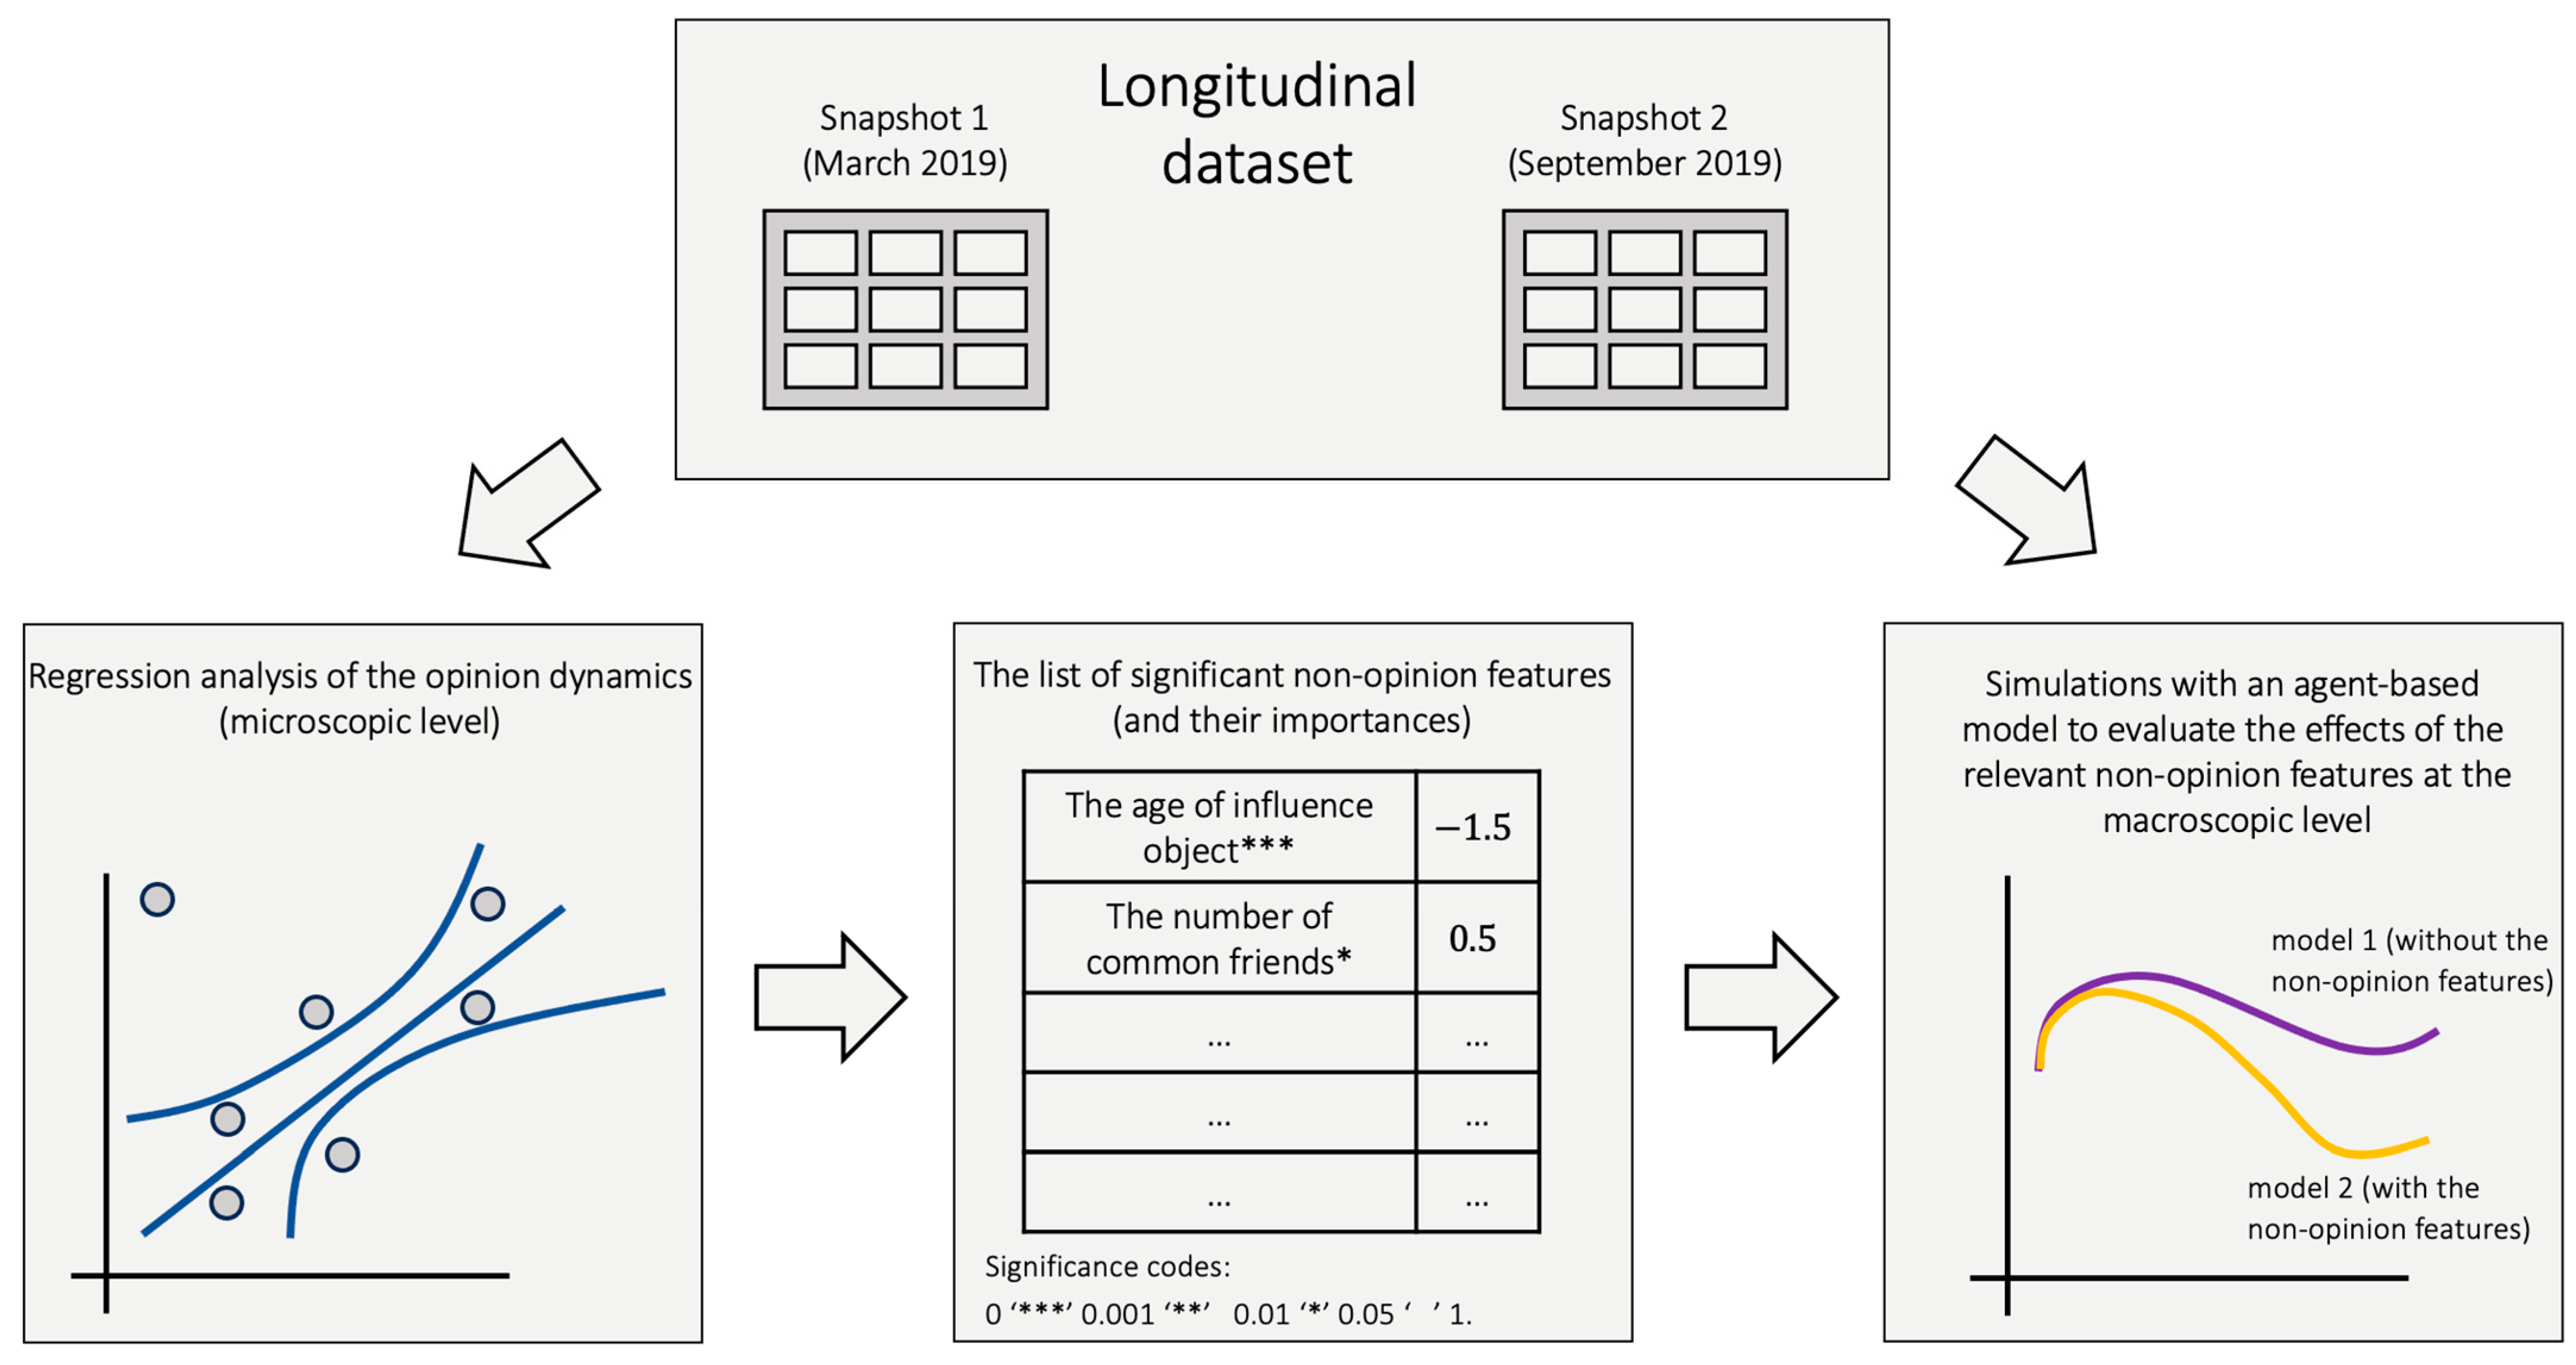
3. Overview of Our Analysis
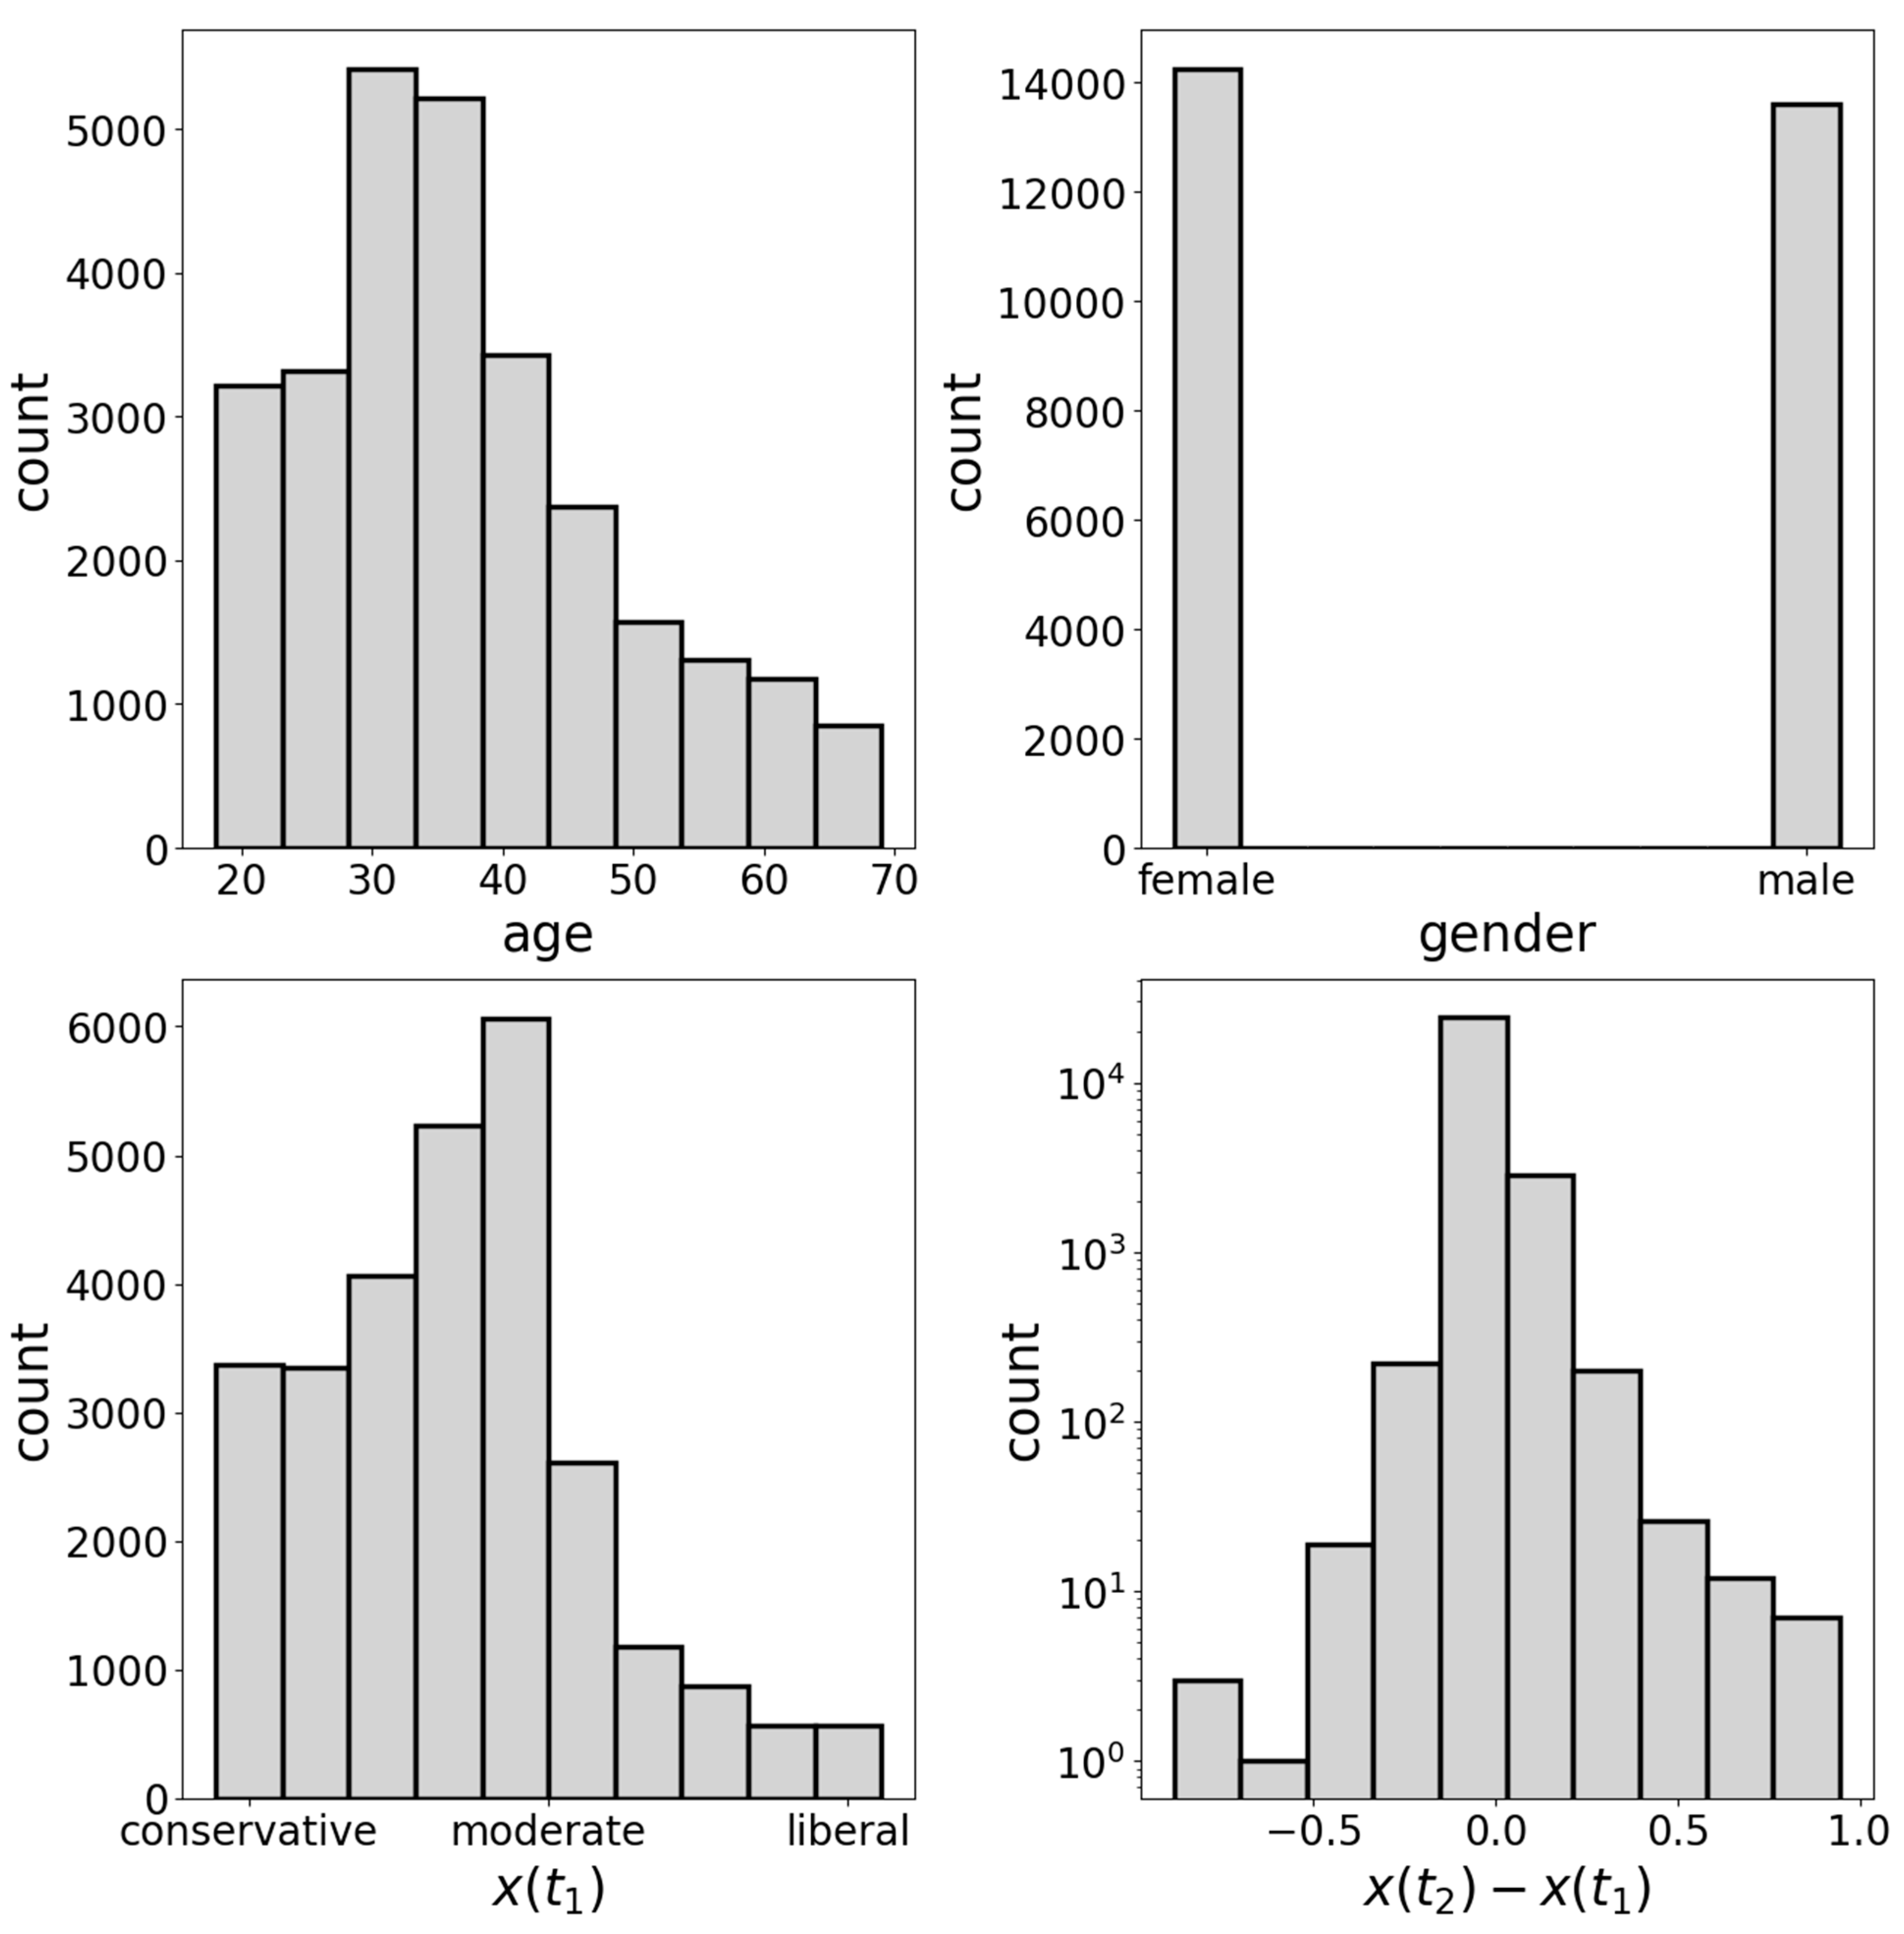
Our analysis builds upon a longitudinal dataset that describes the opinion dynamics of a sample of online social network users. We use this dataset to investigate what factors govern opinion dynamics at the microscopic level. Using regression analysis, we discern statistically significant covariates (paying specific attention to non-opinion ones) and compare their effects. Those factors that are estimated to be significant are then employed in simulations with an agent-based model. These experiments are focused on comparing two models: in the first one, the non-opinion features are not accounted for. In contrast, the second model includes the non-opinion features. Both models are calibrated on the empirical data. We check the outcomes of these two models at the macroscopic level—our main objective is the public opinion states predicted by the models. The schematic representation of our analysis is presented in Figure 1.
      
    
    Figure 1.
      The workflow of the analysis.
  
4. Data
We investigate the dataset introduced for the first time in Ref. []. That dataset includes two snapshots of the online network VKontakte (VK), describing friendship-type connections and the opinions of a sample of  VK users, all citizens of the same city. The snapshots were made in March and September 2019. Information regarding users’ ages and genders is also available. Users’ opinions (on a political issue) were measured on the scale  using information on users’ subscriptions to information sources (public pages and bloggers) with the help of the methodology from Ref. []. It is worth noting that the sample was cleaned of any accounts that were employed in the opinion estimation procedure (to facilitate the independence of estimated opinions). The sample comprises adults (age > 17) with open VK accounts that were active no less than one time per month during the observation period. One more filter restricts users to have no less than 10 and no more than 200 followers (this ensures the highest accuracy of the opinion estimations). However, similarly to Ref. [], we focus on the giant connected component that includes ~95% of all vertices. As a result, we end up with a sample of  users. For more information regarding the dataset, we refer the reader to Ref. [] (Section 4 and Section 5, and Appendix B). Further, Figure A10 (Appendix C in the current manuscript) presents some histograms that help the reader to understand the organization of the data.
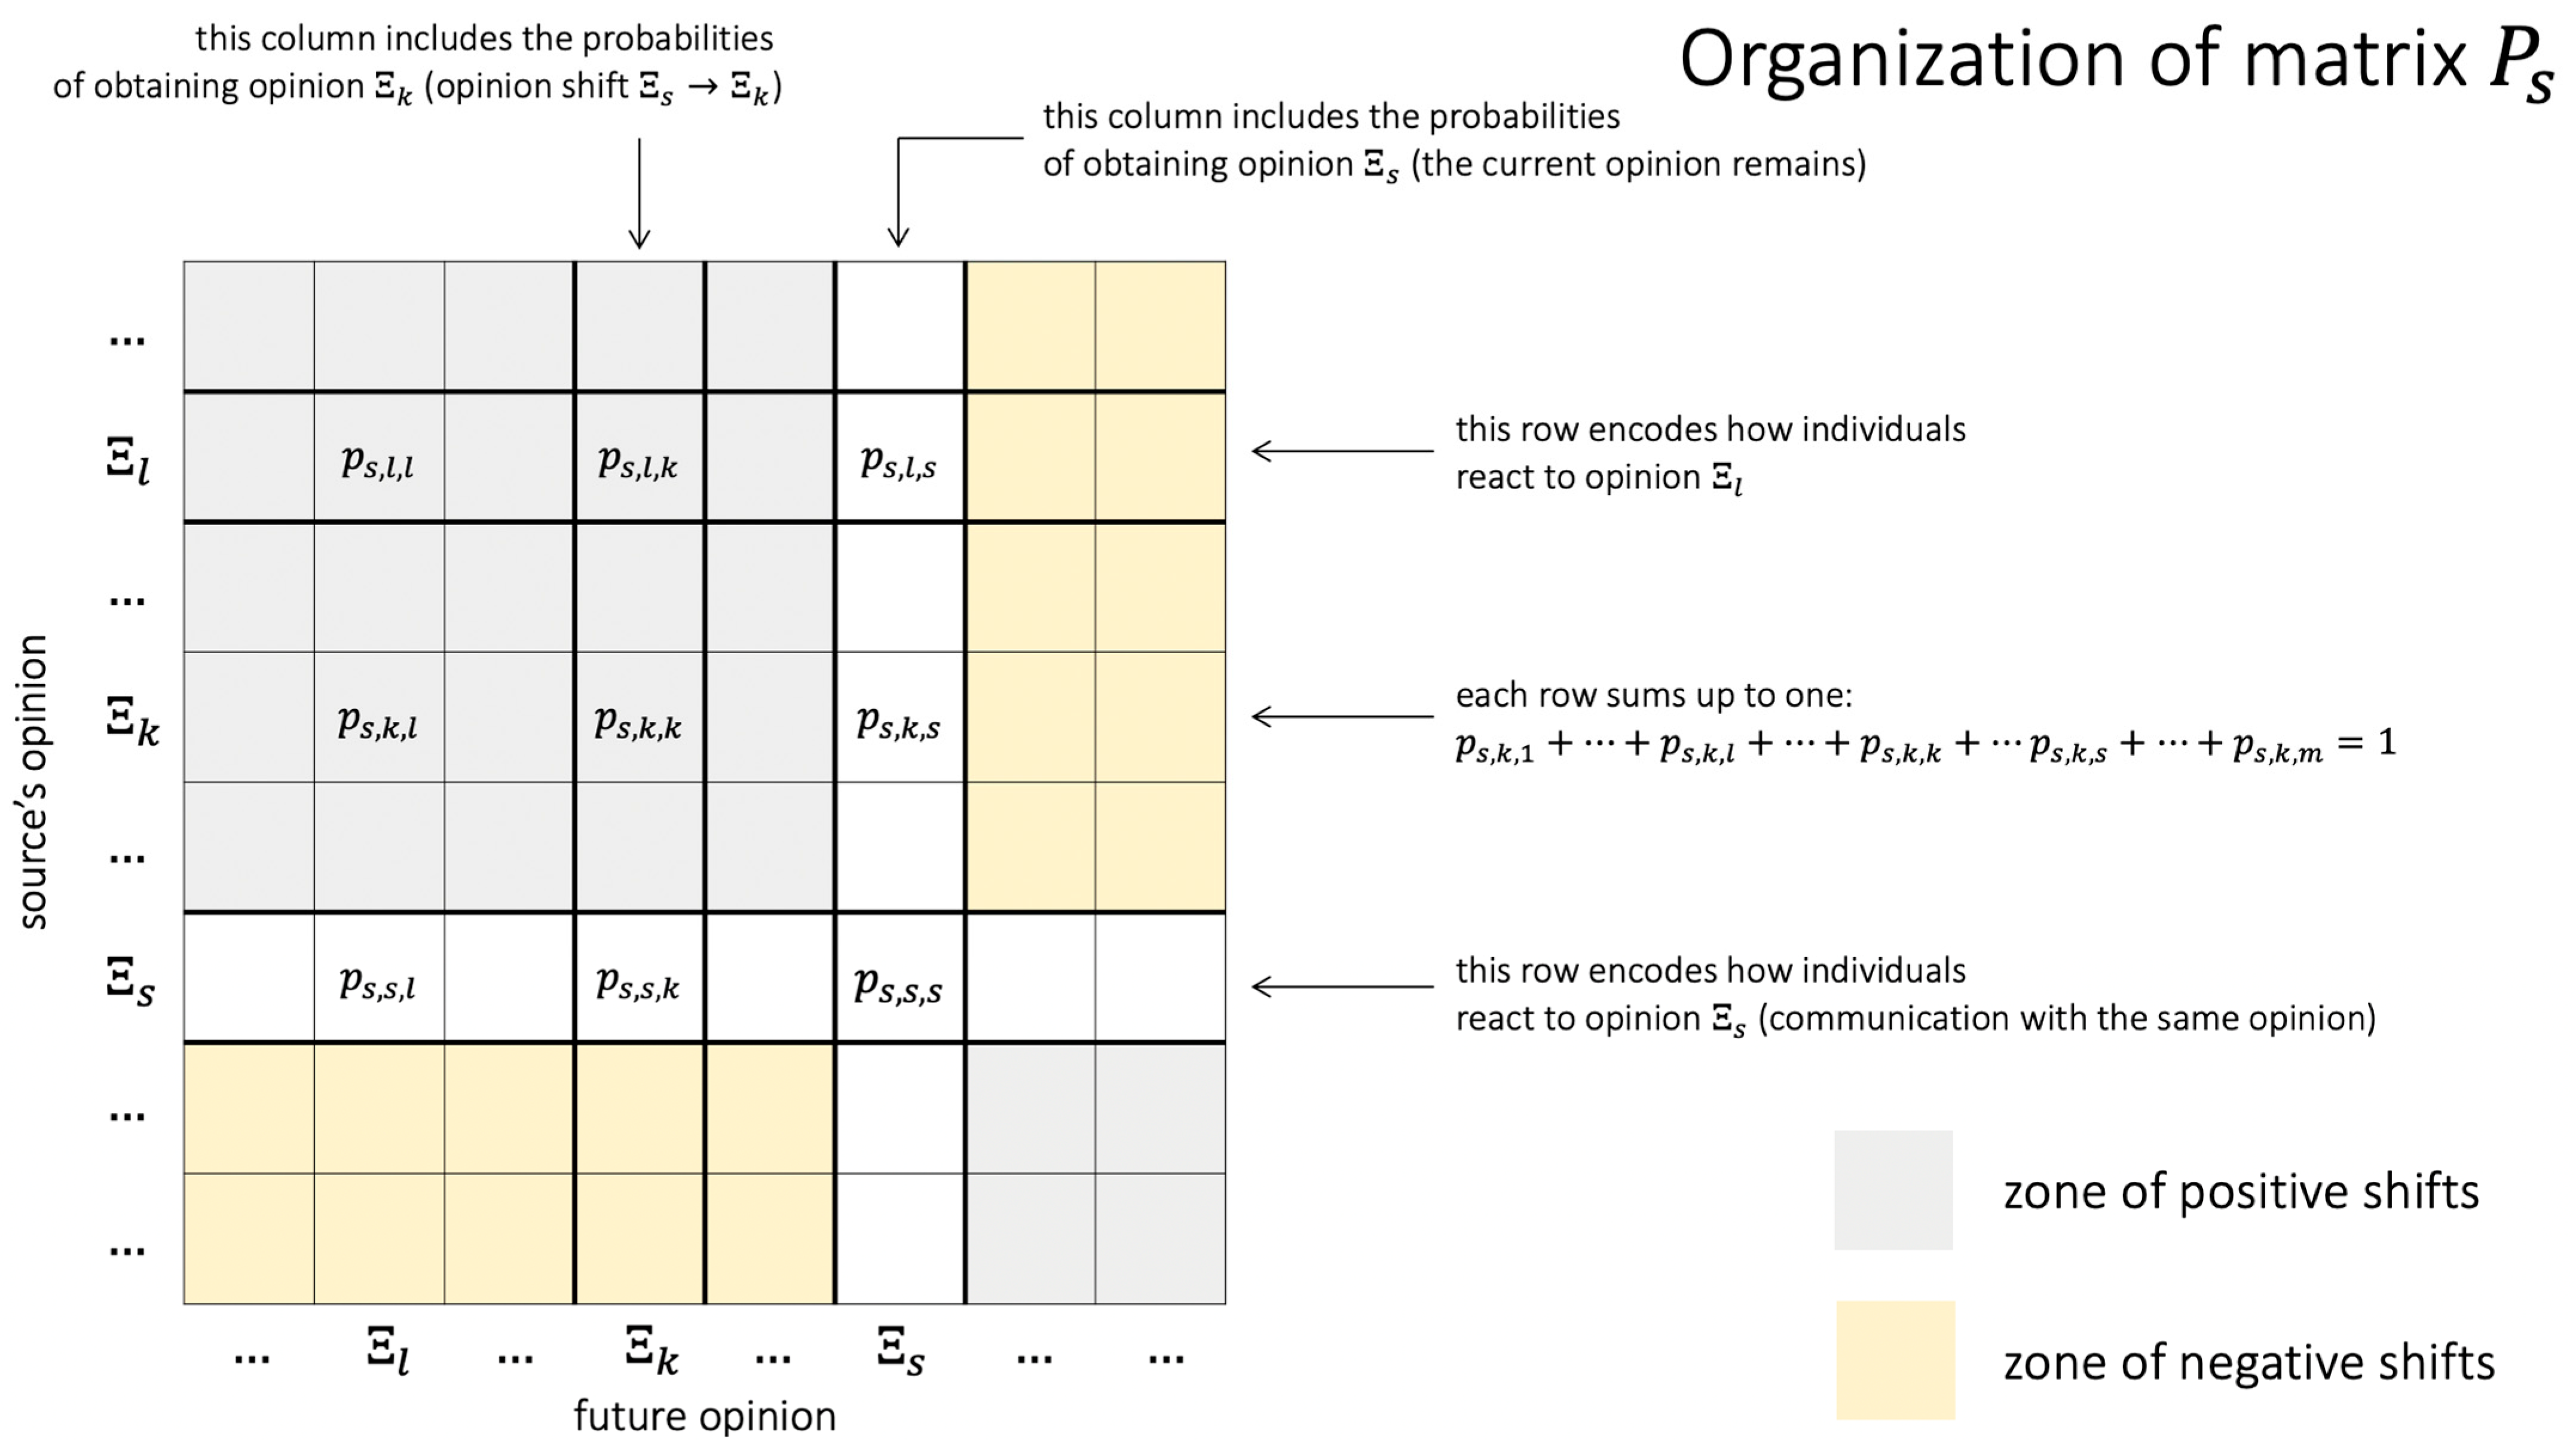
5. Notations and Terminology
We denot. the network snapshots by  and , where .  represents t. he sample users and  stand for edges between them at times  (March 2019) and  (September 2019). Correspondingly, the vectors  and  outline estimated users’ opinions. For a user , their opinion is denoted by , and their age and gender are signified as  and  (1–females, 2–males), respectively. Throughout the paper, the set of natural numbers from 1 to  is denoted by . To denote the cardinal number of a set, we use the notation . The number of the user ’s friends at time  is . The number of peers users  and  have in common at time  is presented by .
Following Ref. [], we will say that a positive opinion shift is undertaken if it is directed toward the opinion of the influence source. If an opinion shift is directed oppositely, then it is negative.
If an individual  influences an individual , then we will say that  is an influence object (focal individual) and  is an influence source.
6. Analysis of Opinion Dynamics
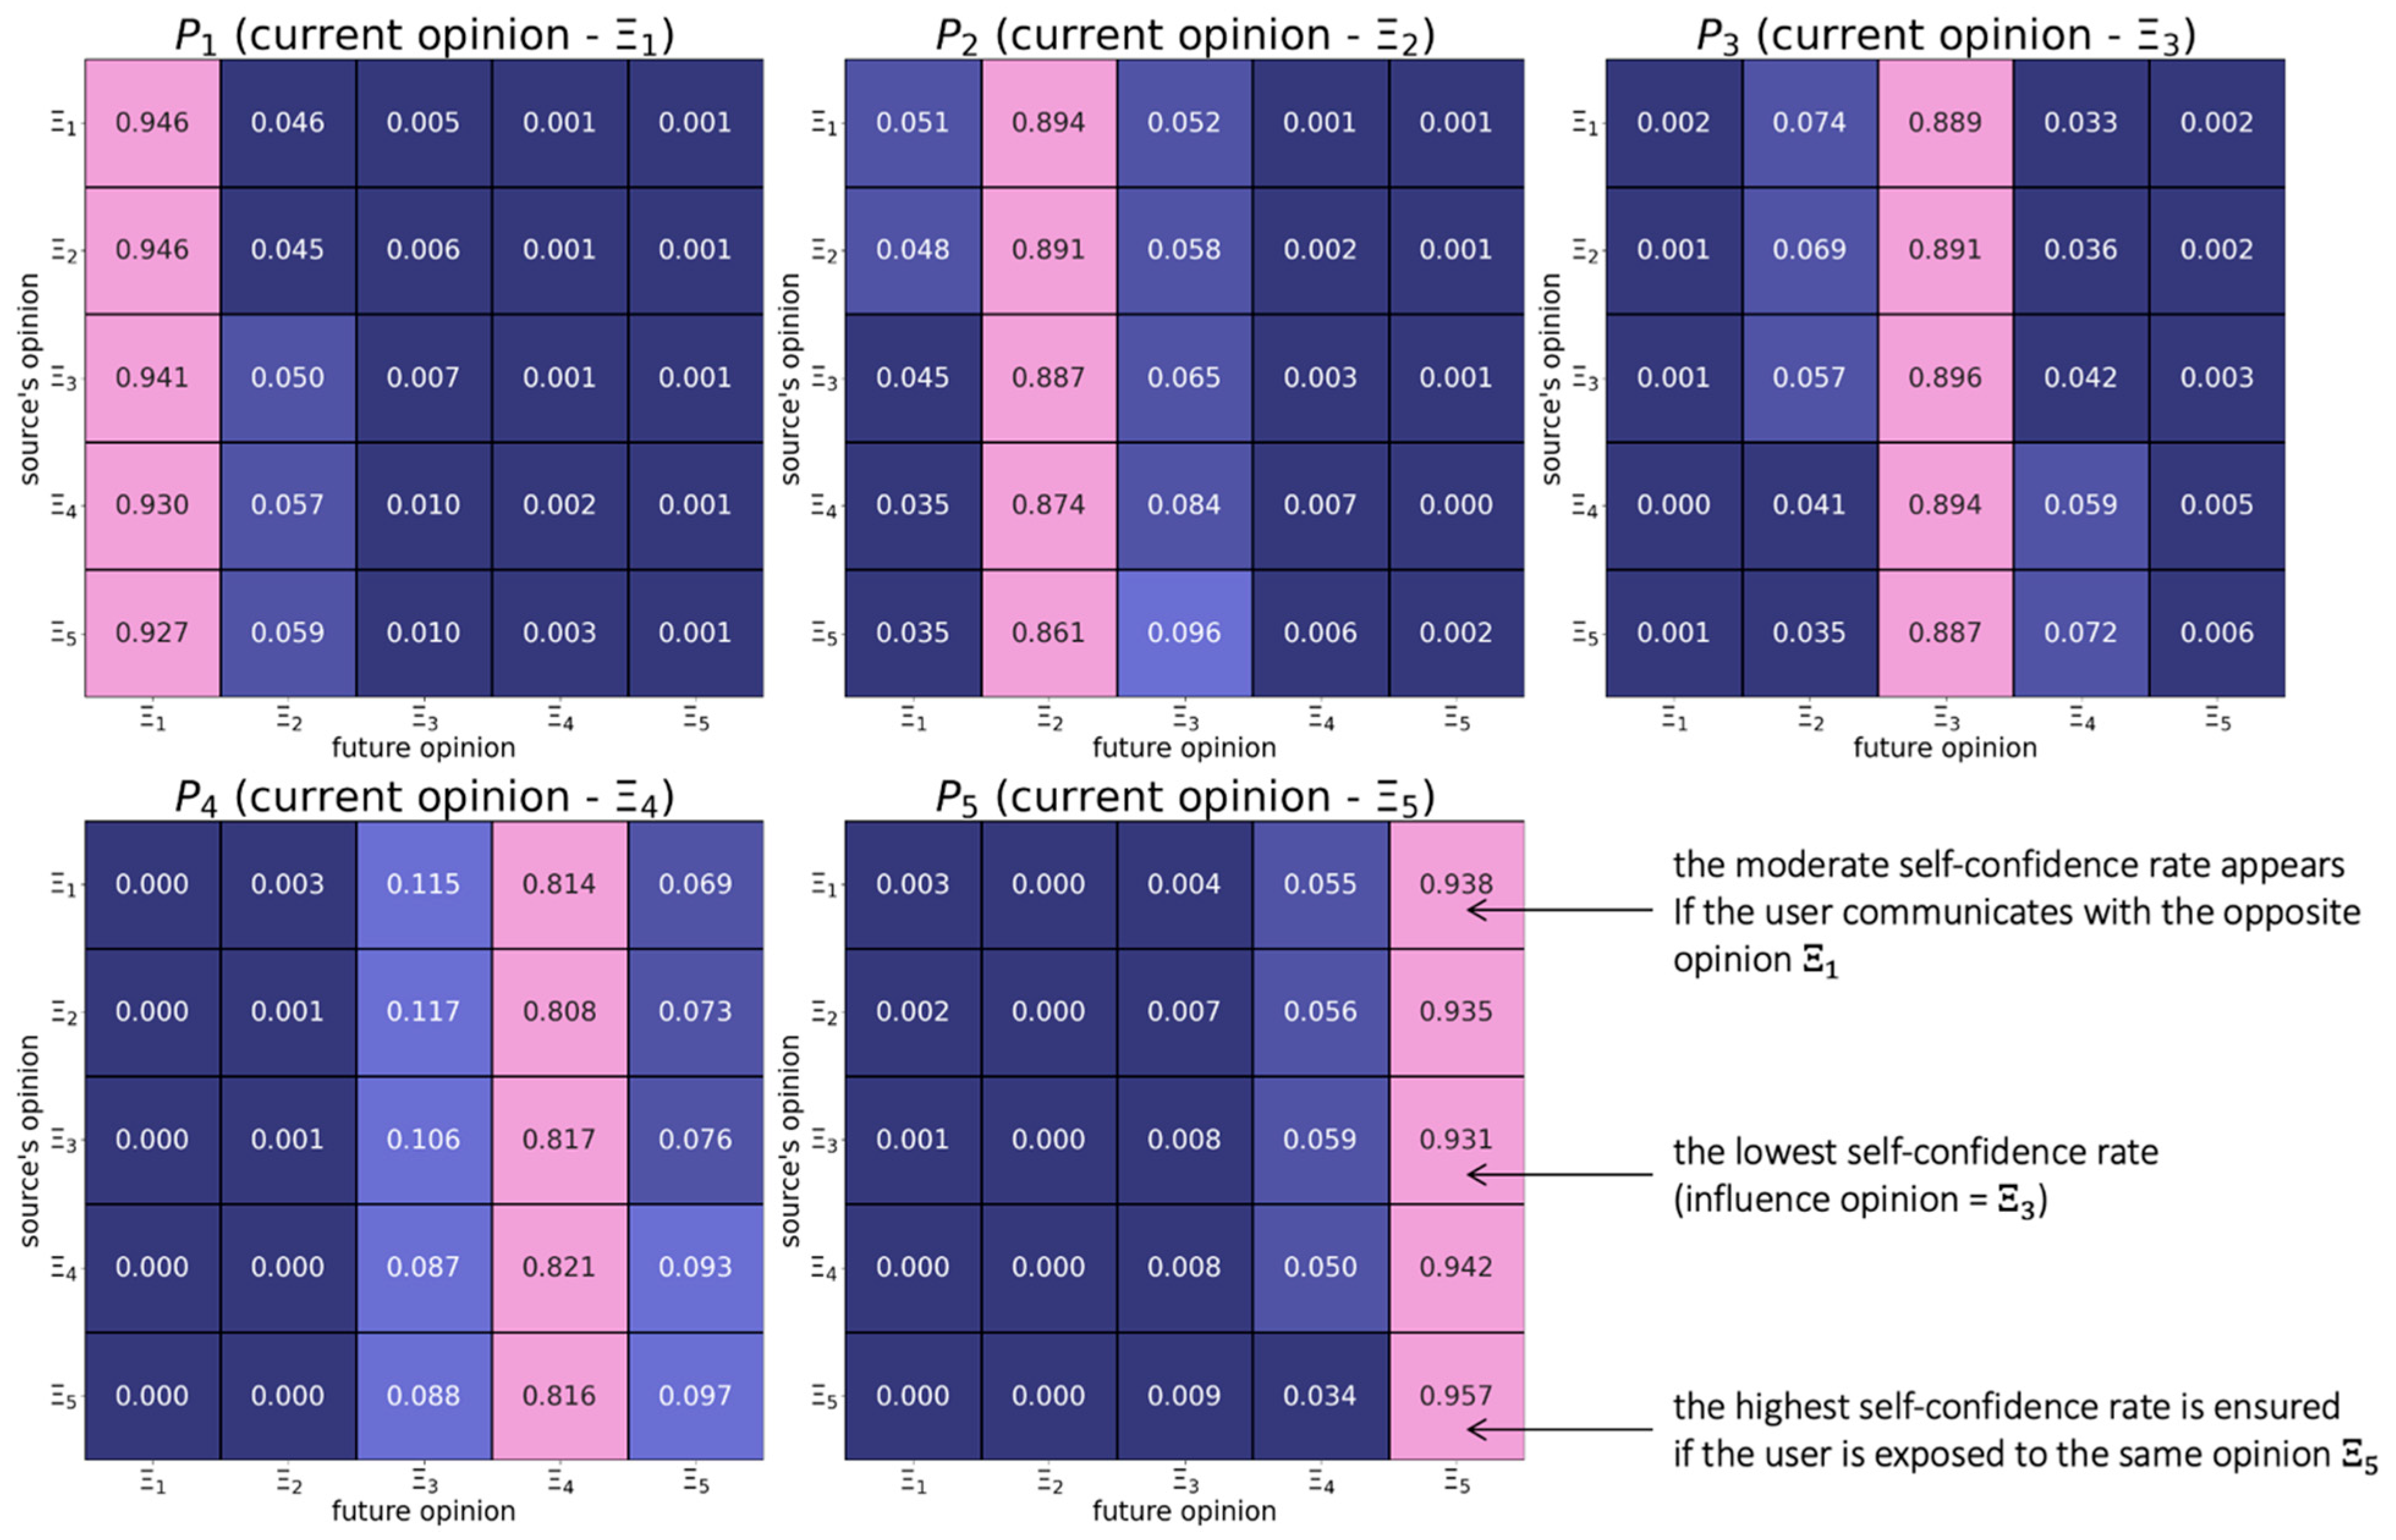
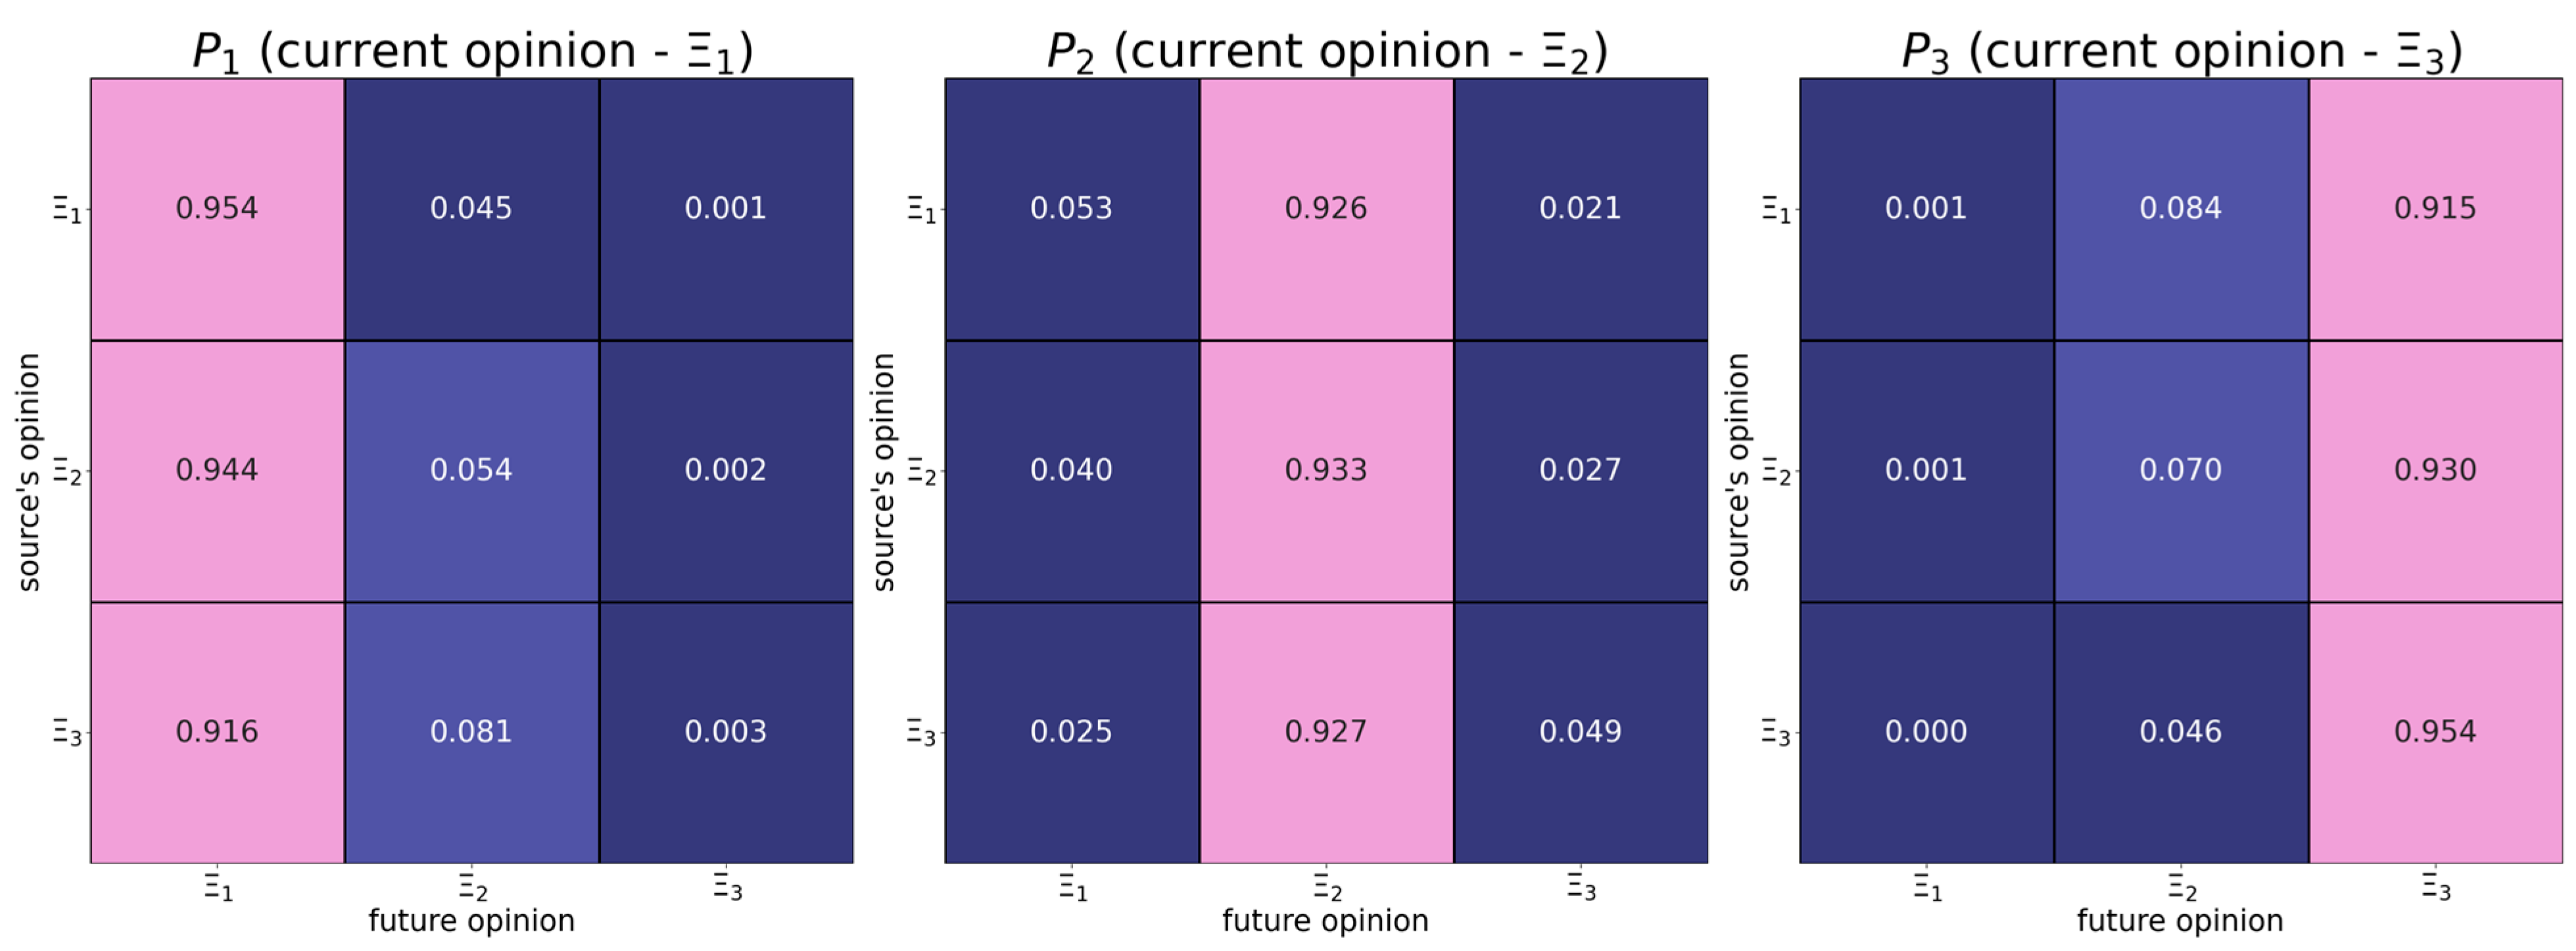
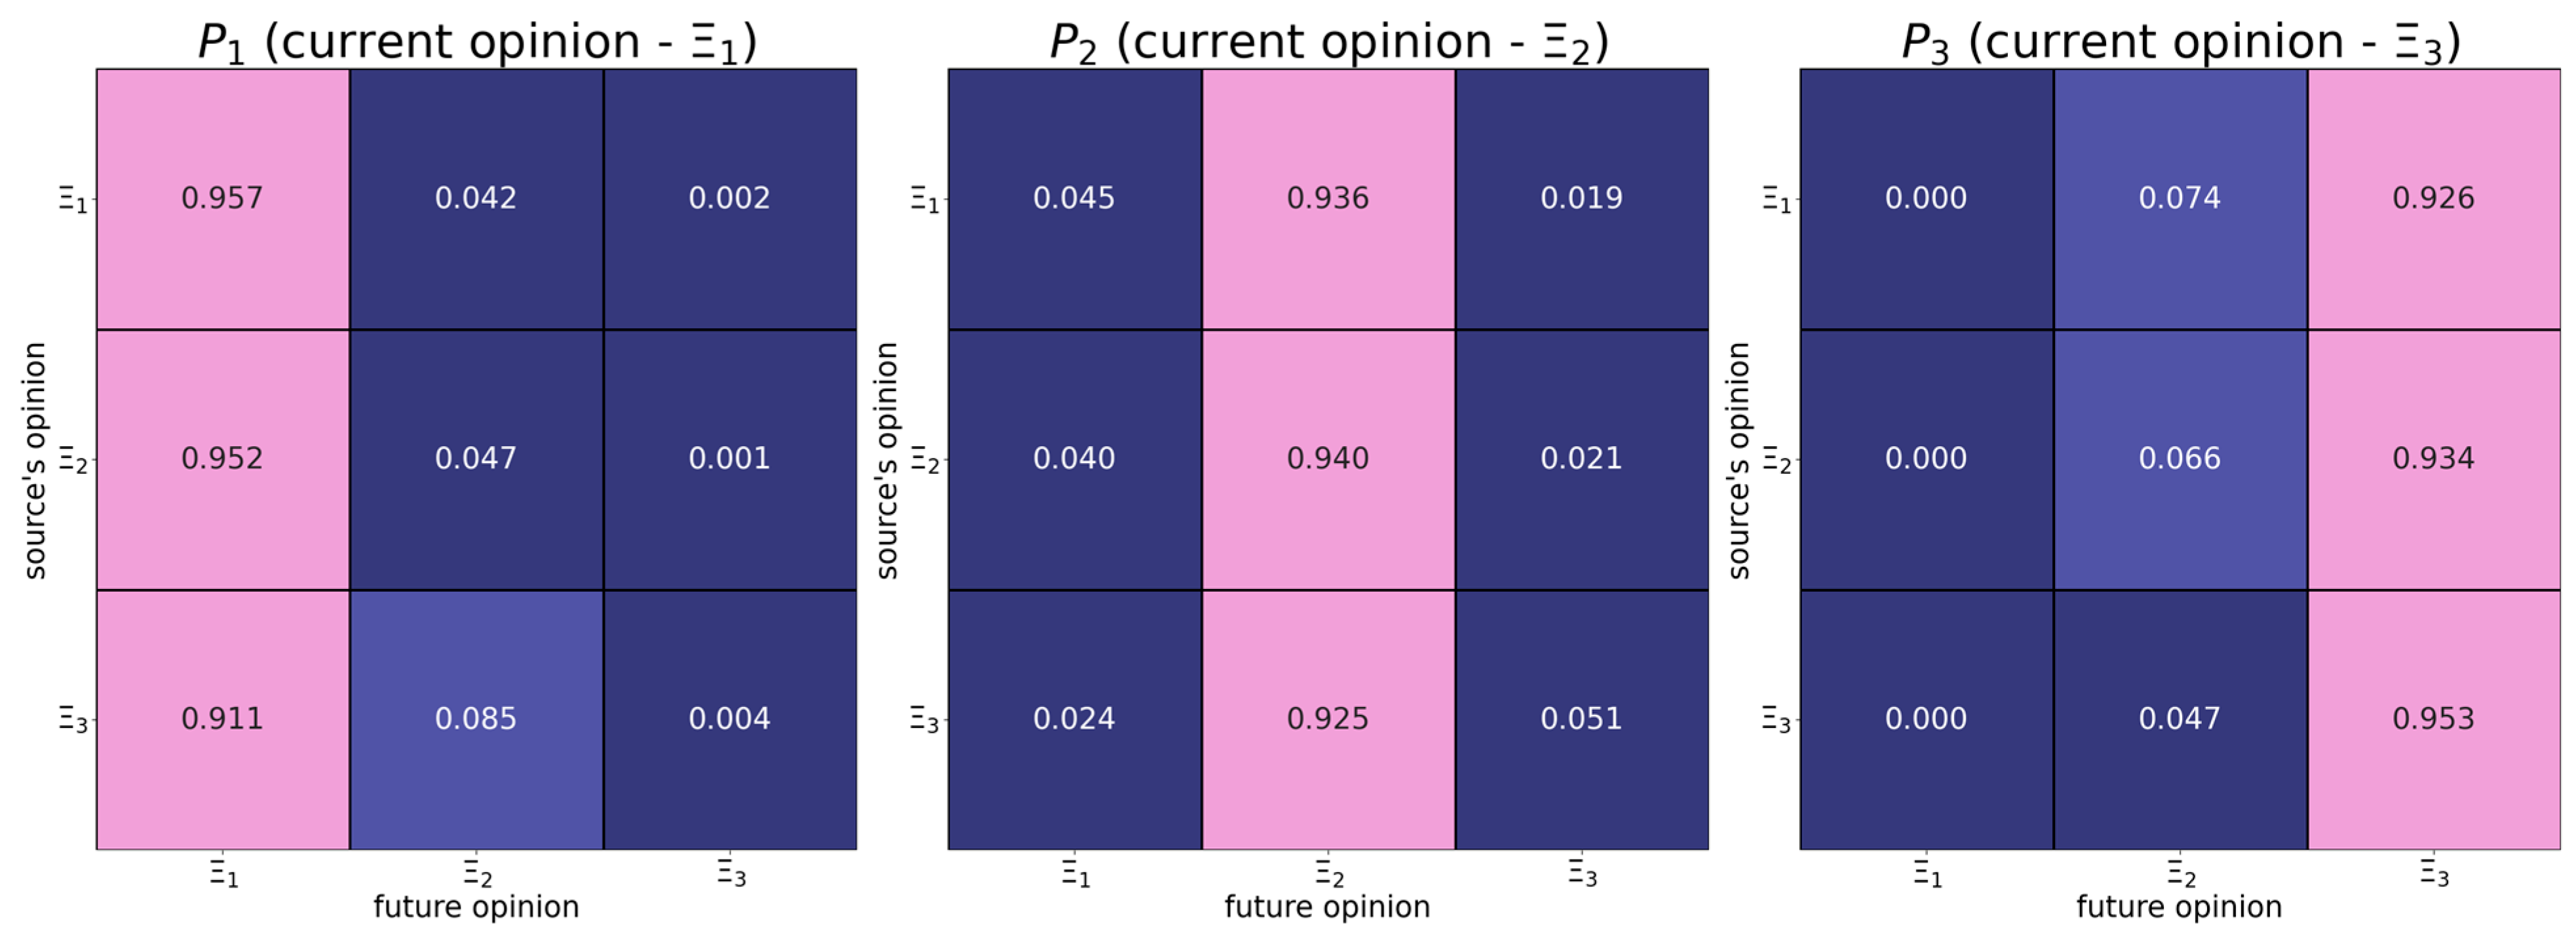
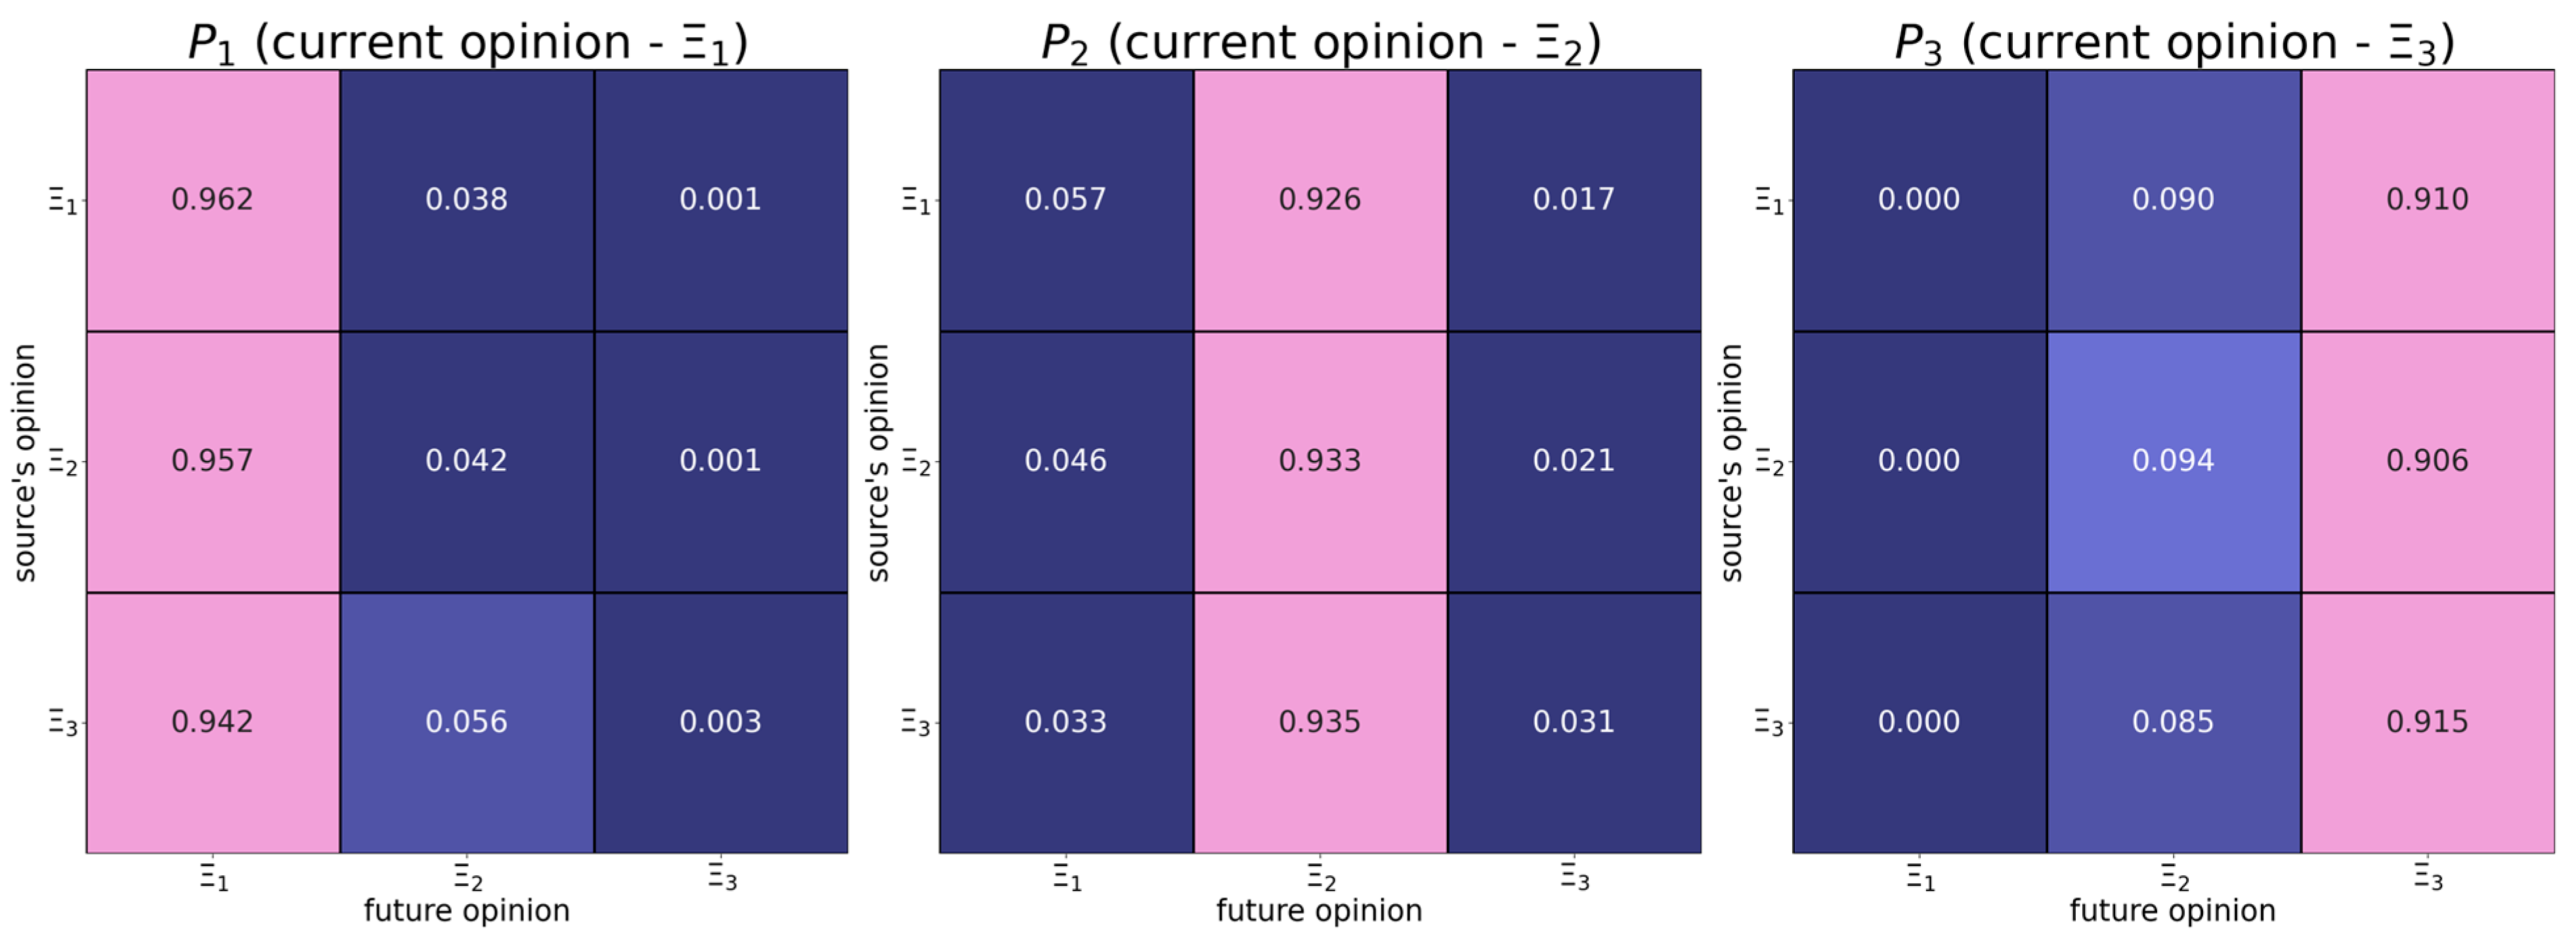
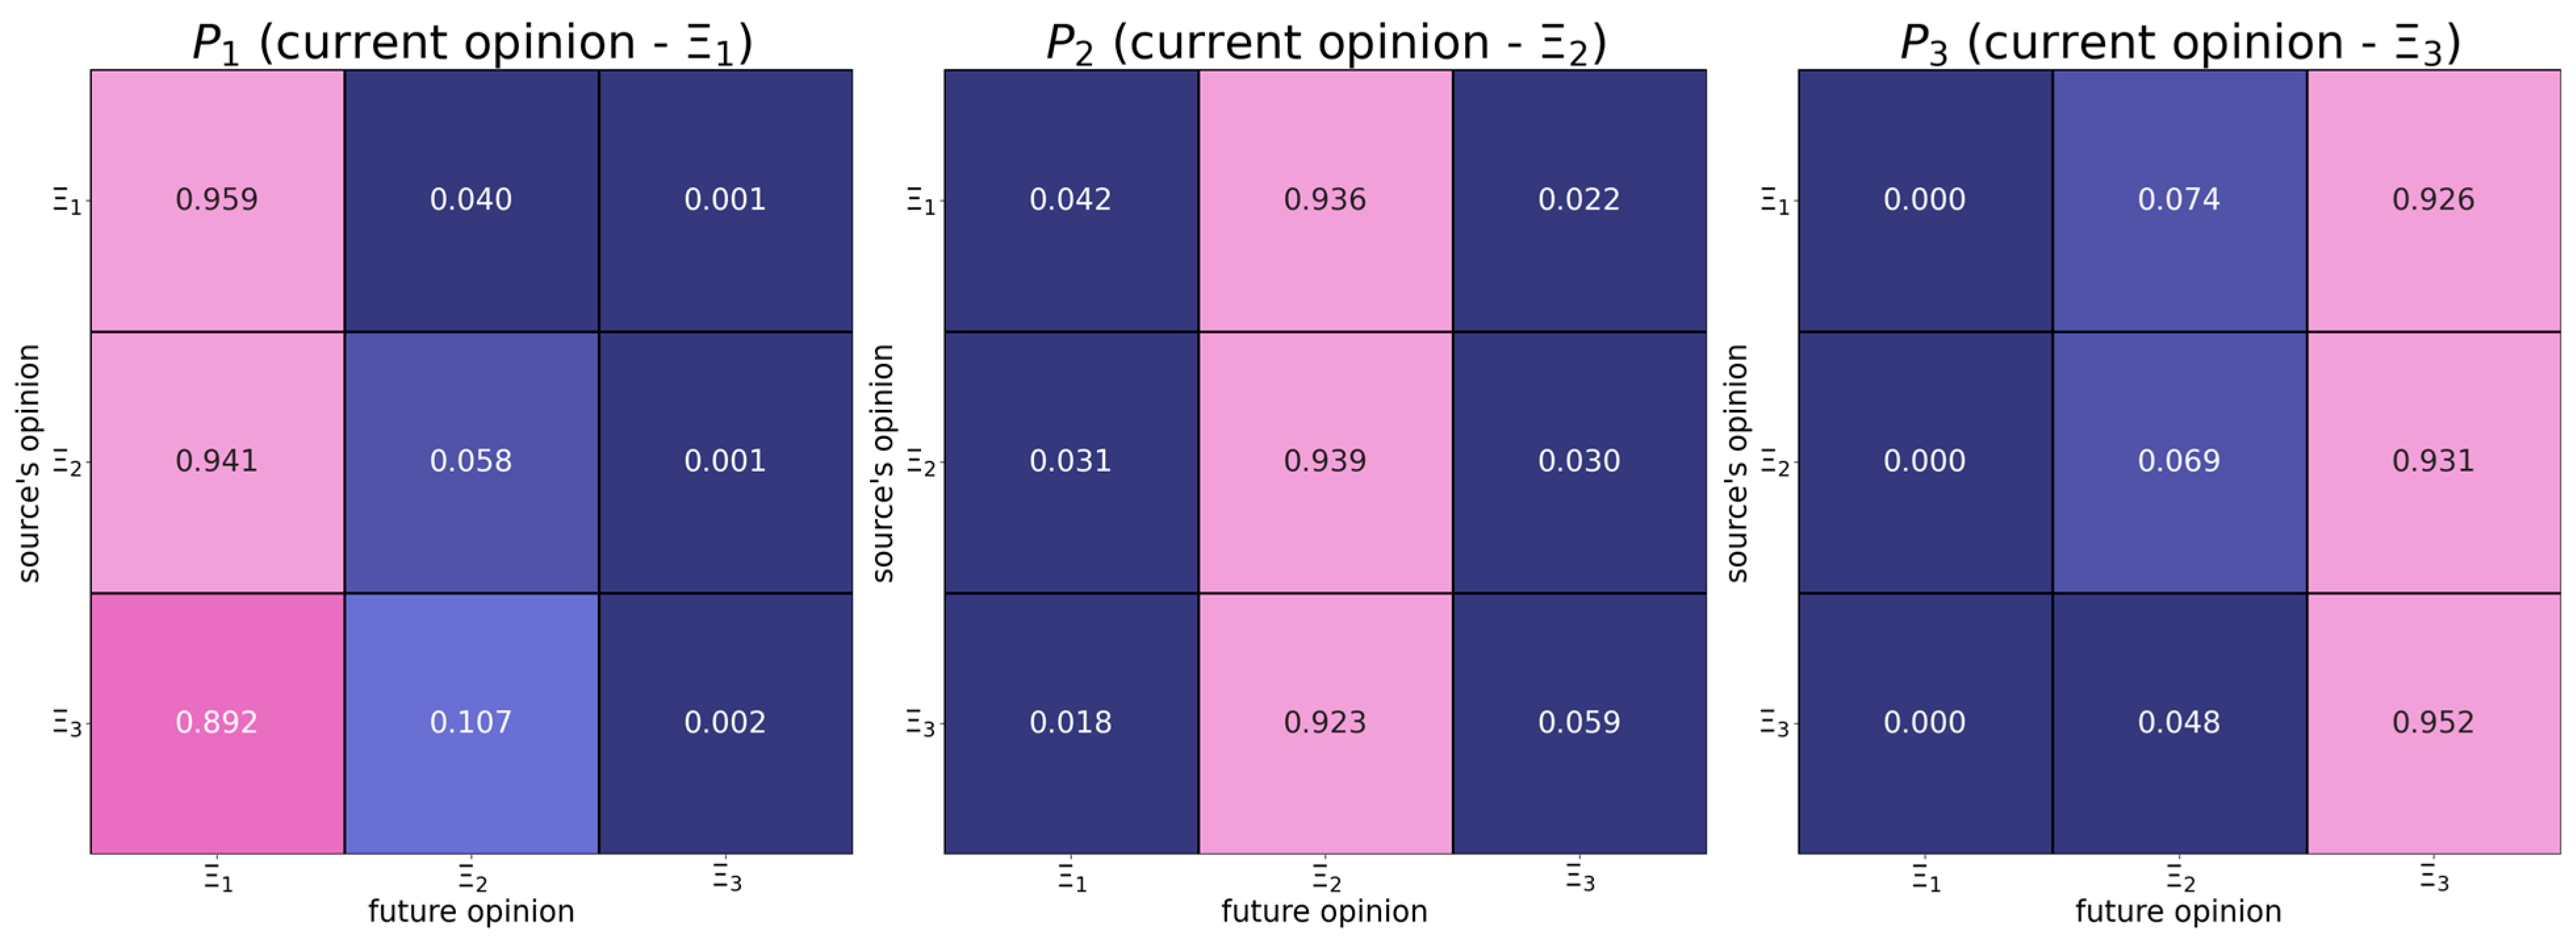
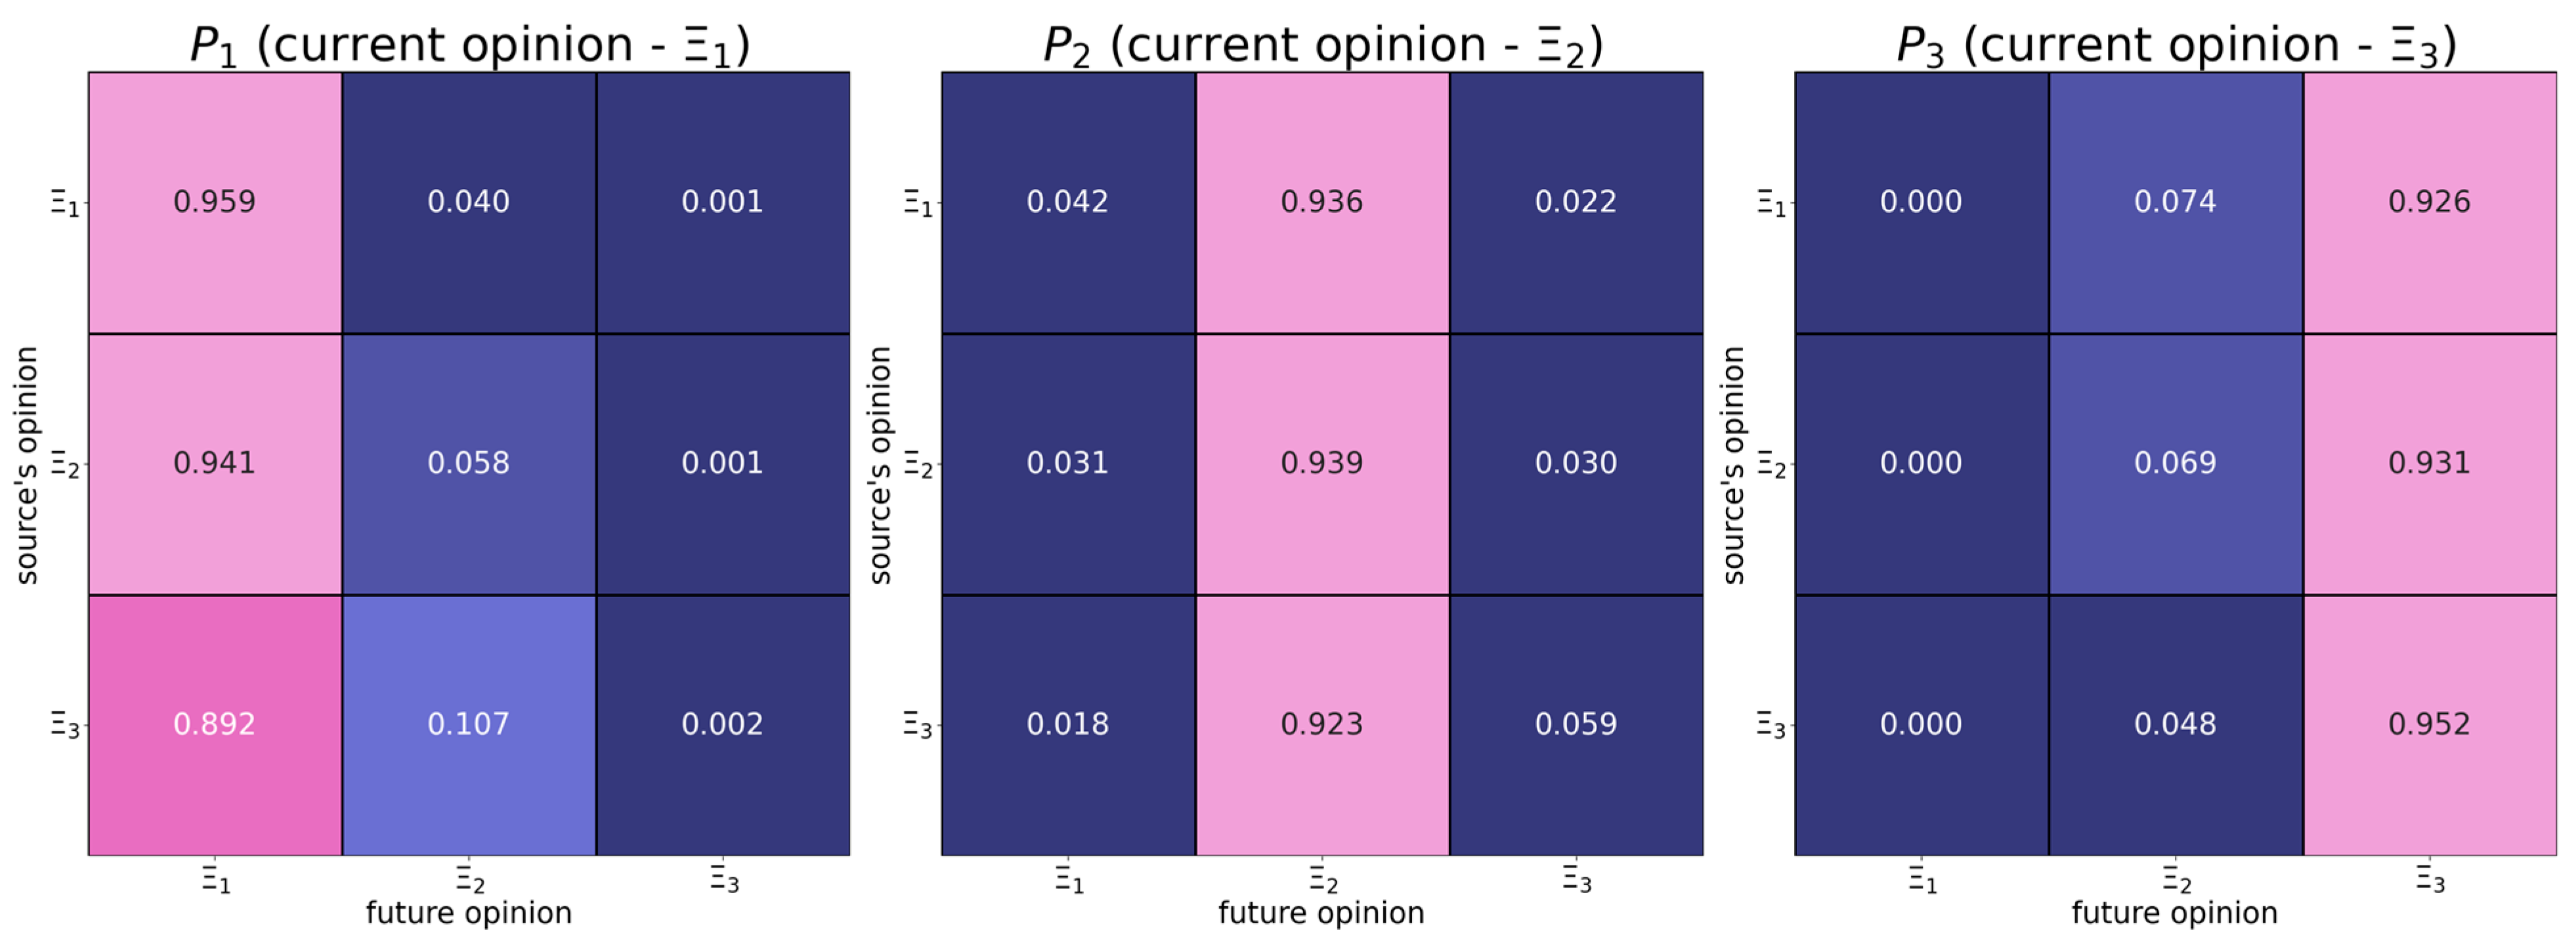
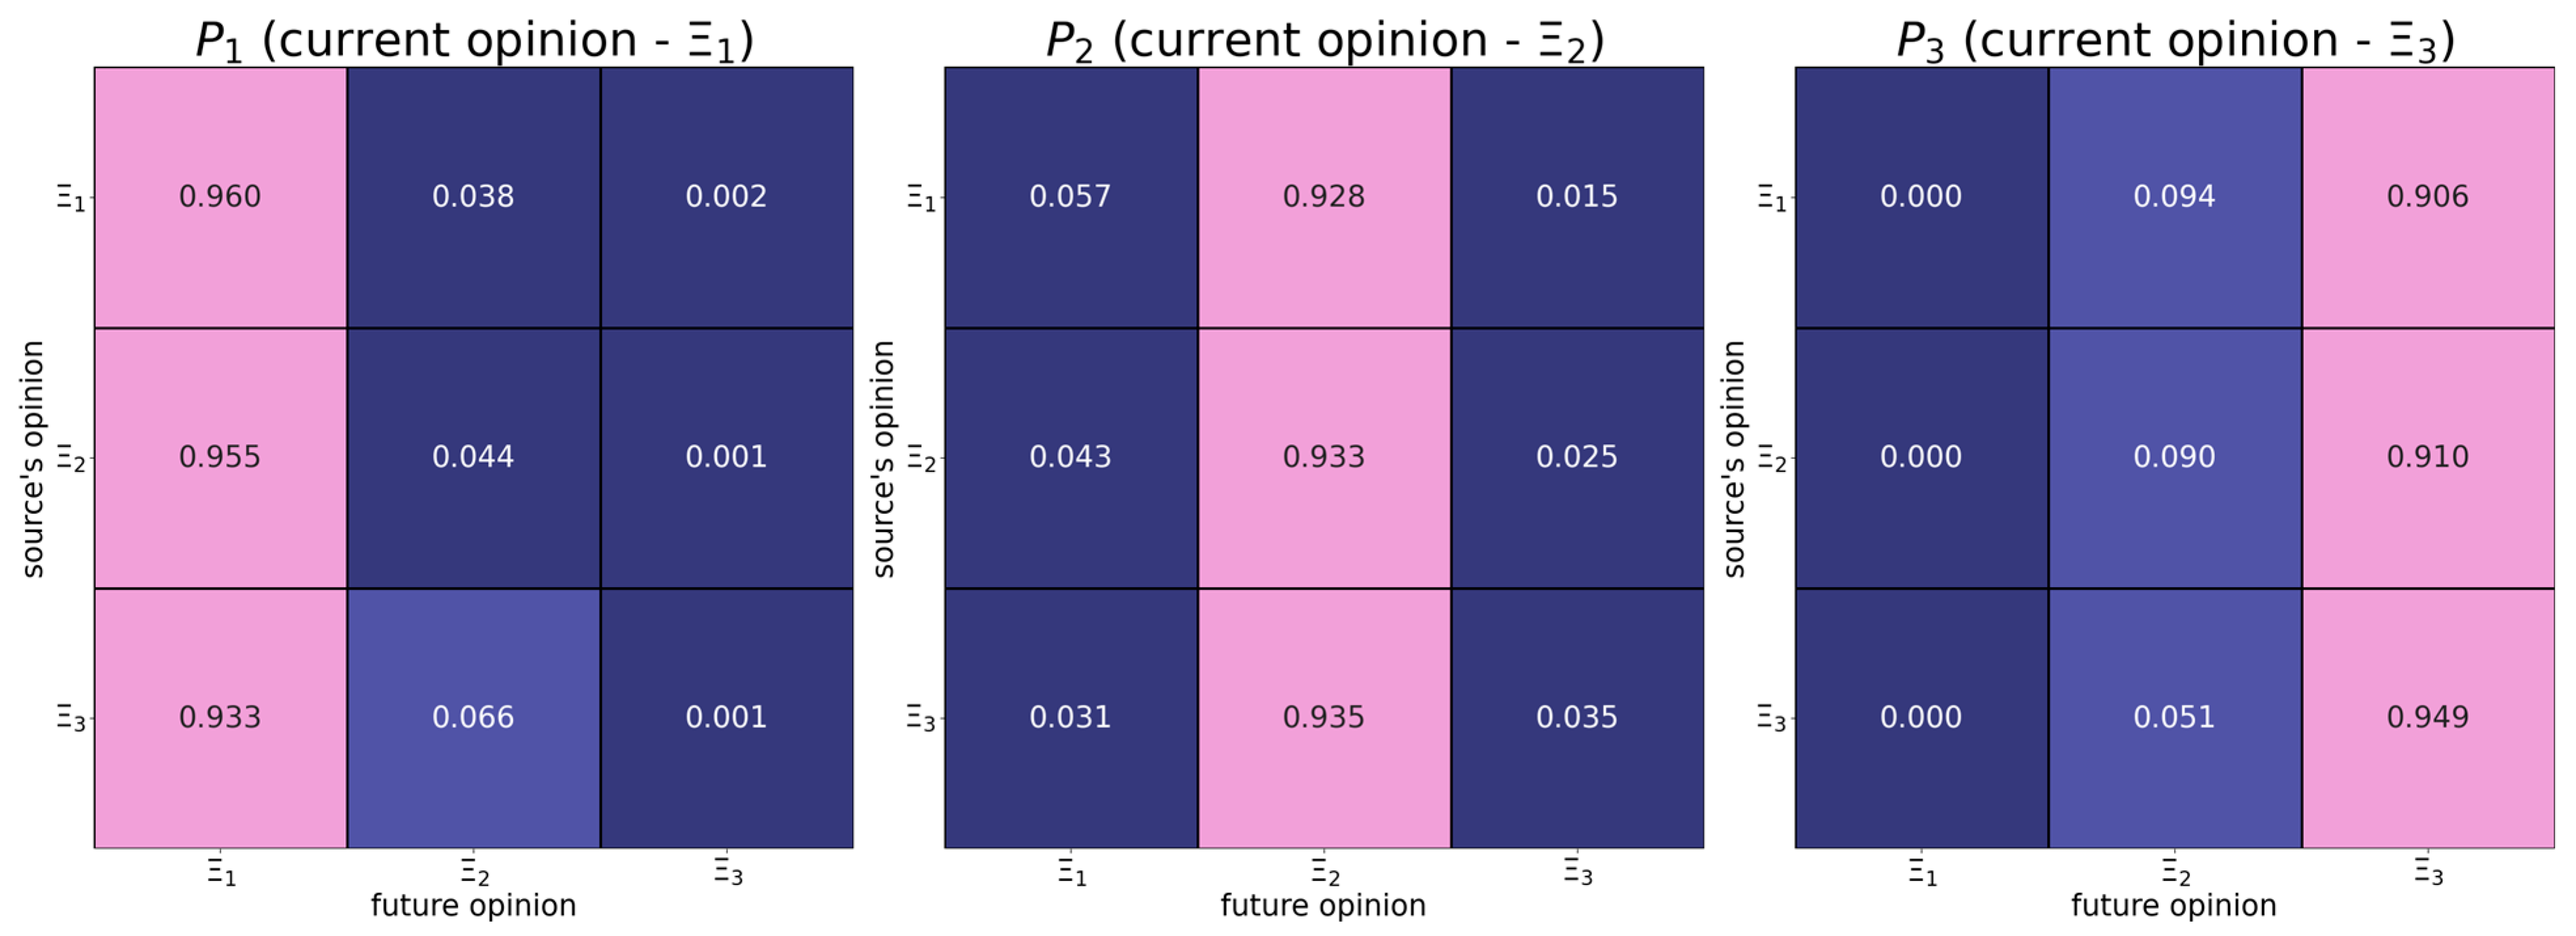
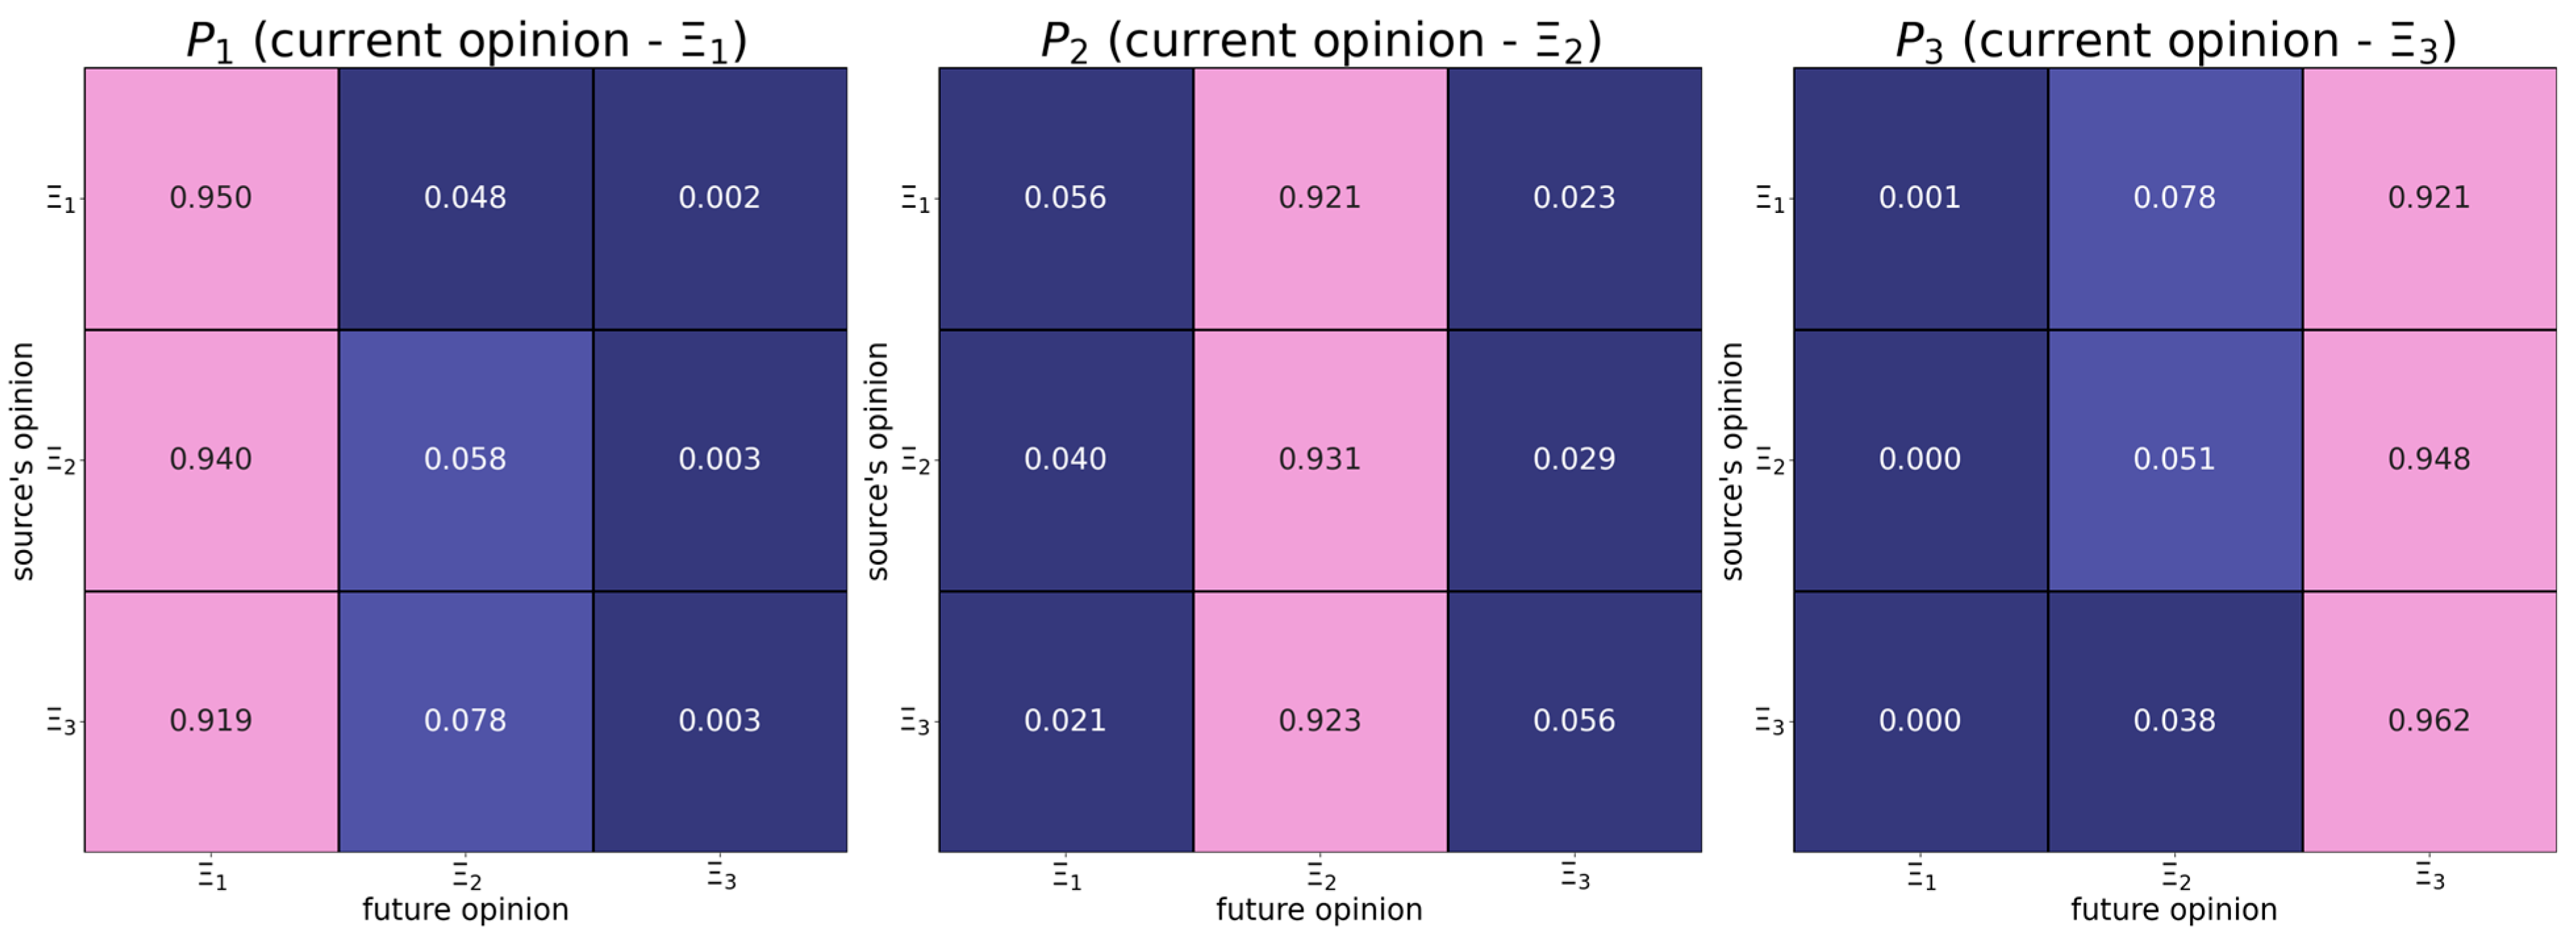
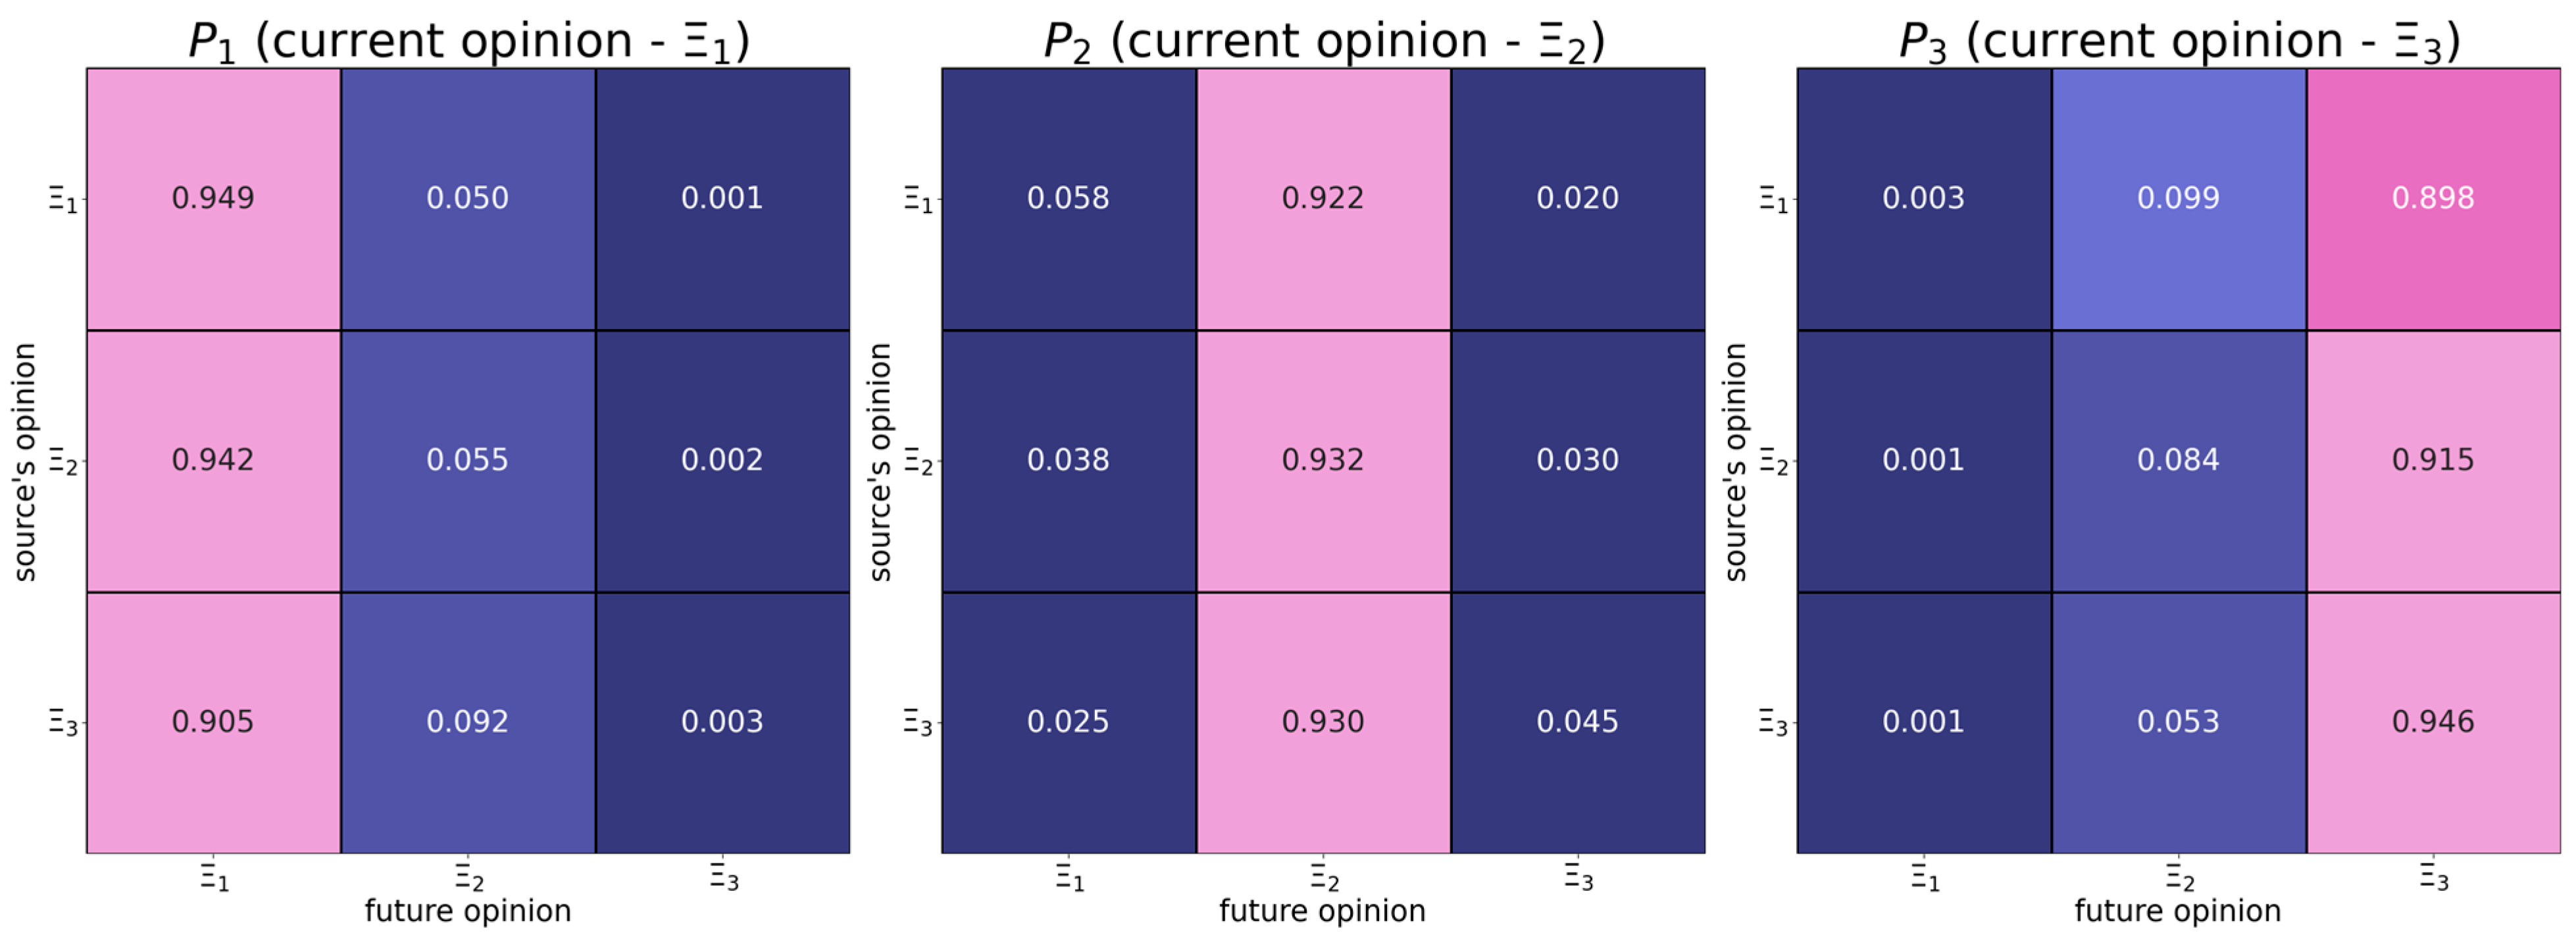
6.1. Map of Opinion Shifts
We first need to answer the following question: given the opinions of two befriended users at time , can their opinions at time  be predicted? To answer this question, we discretize the opinion scale  into aggregated opinion values , and then the probabilities of all possible opinion changes  (including static ones ) are computed across all possible influencing opinions . These probabilities are captured by the quantities , where for given  and , variable  measures the probability that opinion  will be changed to  after being influenced by opinion  (see Appendix A for details on their computation). The quantities  can be informatively grouped into  square row-stochastic matrices , where  for a fixed  showcases how users with opinion  react to peers’ opinions. Organization of matrix  is schematically presented in Figure 2. In Figure 3, we depict the values of  estimated from our empirical data. Within such an encoding strategy, in matrix , the -th column contains the self-confidence rates of users with opinion  across different values of the influence source opinion. From Figure 3, we conclude that:
      
    
    Figure 2.
      We demonstrate the organization of the matrix  for a fixed . Each of its rows sums up to one as it covers all possible alternatives. Let us consider the -th row that outlines how individuals with opinion  react to opinion . Overall, there are  possible alternatives: . The resulting estimated probabilities of these alternatives are described by the quantities . Other rows are elaborated analogously. We would like to emphasize that row  stands for the situations when the influence comes from the coherent opinion , whereas column  contains the probabilities of holding the current opinion . In this regard, the elements of the -th column (the quantities ) represent how stubborn are individuals with opinion . According to the previous empirical research [,,], we should expect that this column will dominate the others. In matrix , the components standing for positive and negative opinion shifts are easily located. The zone of positive shifts is defined as follows: , where  and  are the row and column indices, respectively. In other words,  is the union of the second and fourth “quadrants”, given that the origin of coordinates is located at  (the component ). Correspondingly, the zone of negative shifts is the union of the first and third “quadrants”: .


    Figure 3.
      These heatmaps represent the estimated matrices  that were computed after the opinion scale  had been discretized into five subintervals . The values are presented to three decimal places.
  
- -
 - Individuals change their positions relatively rarely.
 - -
 - Users with radical positions are more stubborn.
 - -
 - Both positive and negative opinion shifts can happen, but positive shifts occur more often.
 - -
 - Positive shifts tend to feature the assimilative influence mechanism, whereby more distant opinions induce positive responses with larger probabilities.
 - -
 - Individuals with the right radical opinion (see the matrix in Figure 1) display a tendency to distrust too distant opinions (also known as moderated bounded confidence).
 
It is worth noting that all these observations are in line with the previous empirical studies on opinion dynamics [,,,,,].
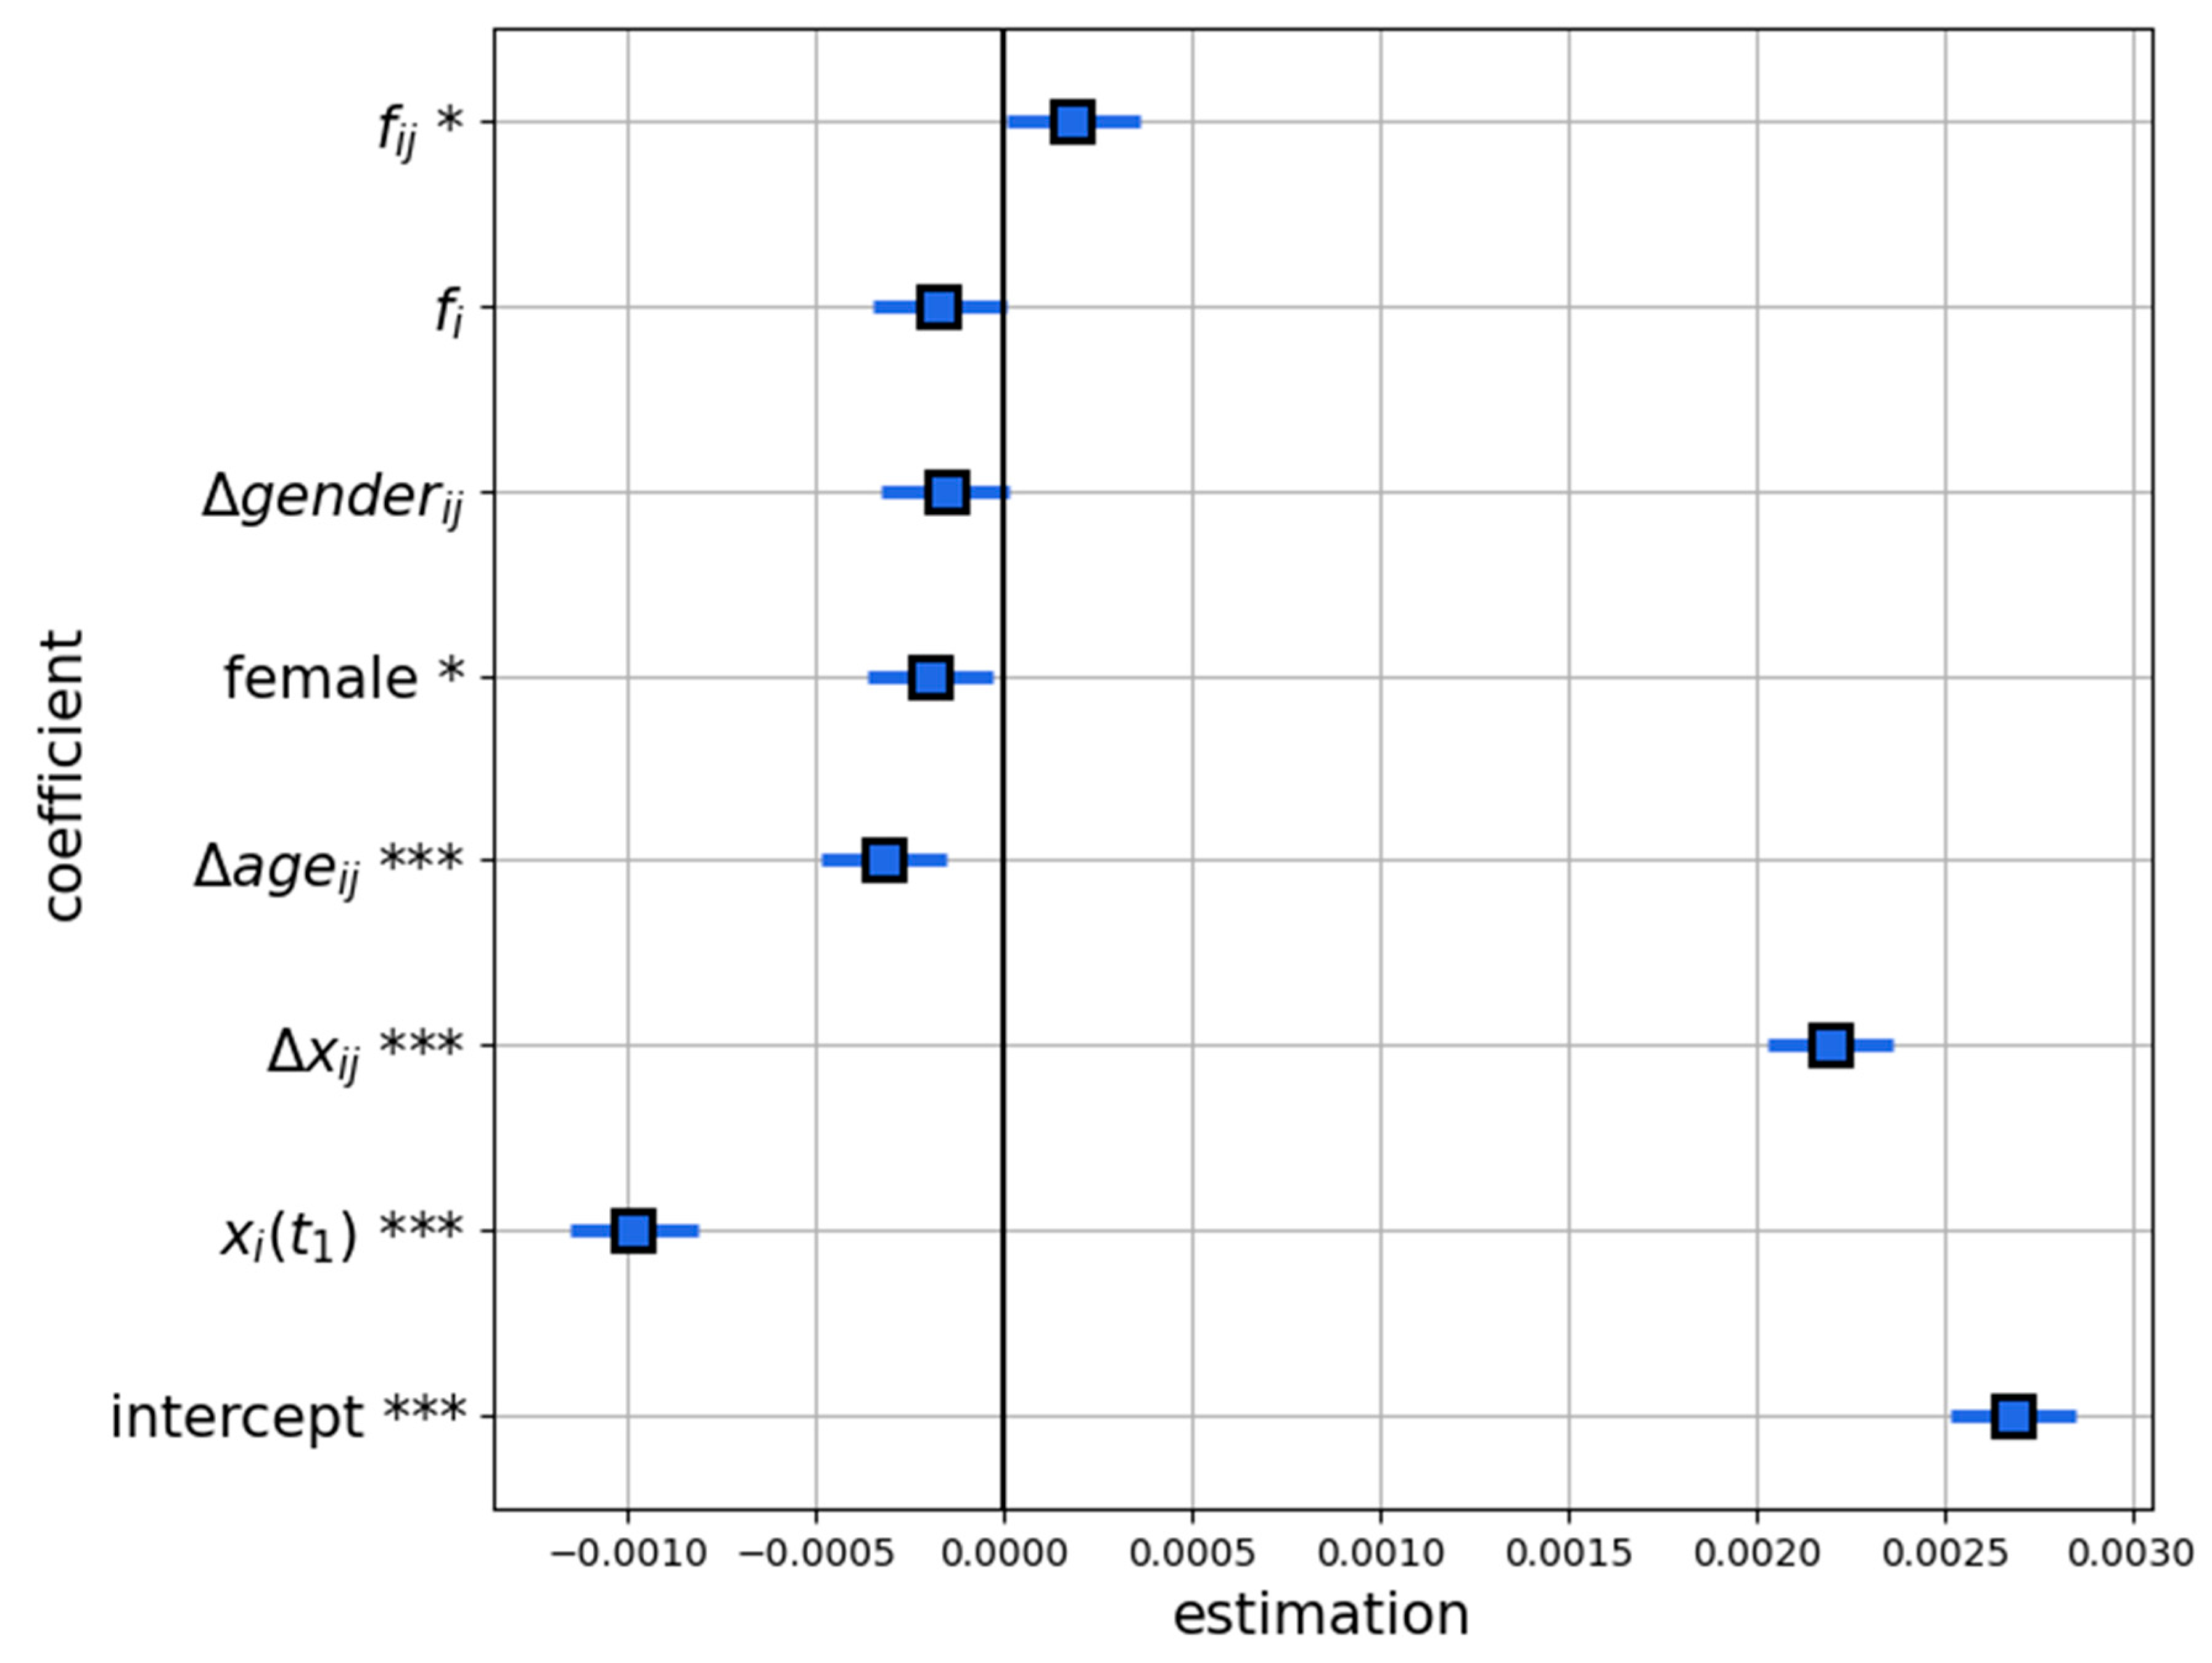
6.2. Effects of Non-Opinion Characteristics on Opinion Shifts
In the previous analysis, we completely ignored the possible effects of non-opinion characteristics on opinion changes. As we said in Introduction, the way individuals perceive information could largely depend on the non-opinion characteristics of the interacting agents, such as age, gender, or the common number of friends. Let us now shed light on this issue. For this purpose, we employ the quantity


        as a dependent variable. It measures the magnitude of an opinion shift  subject to its direction: if the shift is pointing towards the source’s opinion , then the dependent variable is positive. Otherwise,  is negative. By doing so, we want to find out what conditions facilitate the likelihood that the opinion stimuli will receive a positive response (will induce a positive opinion shift).
The list of independent variables is presented in Table 1. At the same place, we provide our intuition regarding the effects of these covariates on the dependent variable. Apart from the covariates that measure different sorts of similarity (structural one—as in the case of the common number of friends, or demographic one—as in the case of the differences in age or gender), we also control for various characteristics of the focal node  (influence object). This allows us to discern any specific nodal-level effects.
       
    
    Table 1.
    Independent variables (—influence object, —influence source).
  
To develop a corpus of observations, we take each edge  and then calculate the quantities introduced above by considering first  as an influence object and  as an influence source and then reverse. As a result, each user  may potentially appear in  observations (due to the filters specified below, not all observations will participate in the further analysis). The weakness of such an approach is that each edge  is considered (twice) in isolation, thus ignoring potential influence from the rest of the peers of  and . However, the influences of these peers are also added to the corpus as independent observations (we will return to this confounding factor in Section 6). As in the case of the computation of the probabilities of opinion changes presented in Figure 1, this approach silently assumes that during the observation period, each user was influenced by each of their friends strictly one time, with all these influences being independent of each other. In fact, such a sort of interactions (also known as one-to-one) is widely adopted in opinion formation models—see Refs. [,,,]. However, the assumption that each pairwise interaction has happened is quite strict. We will return to this point in Section 6.
To facilitate the comparability of the covariates’ effects, we standardize the data by making a zero mean and unit variance for each factor. Further, we exclude from our analysis those observations  that violate the following restrictions:
- -
 - (the tie should remain unchanged).
 - -
 - (the number of common friends should be constant as it could have an effect on opinion dynamics).
 - -
 - (the influence source’s opinion should not undergo significant changes during the observation period—otherwise, we cannot precisely locate its value). (In fact, if in a pair of connected vertices , one vertex (say, ) has changed its opinion for more than 0.05, then the inverse pair will not appear in the corpus of observations. Further, if both the vertices have substantially modified their opinions, then the tie is completely ignored).
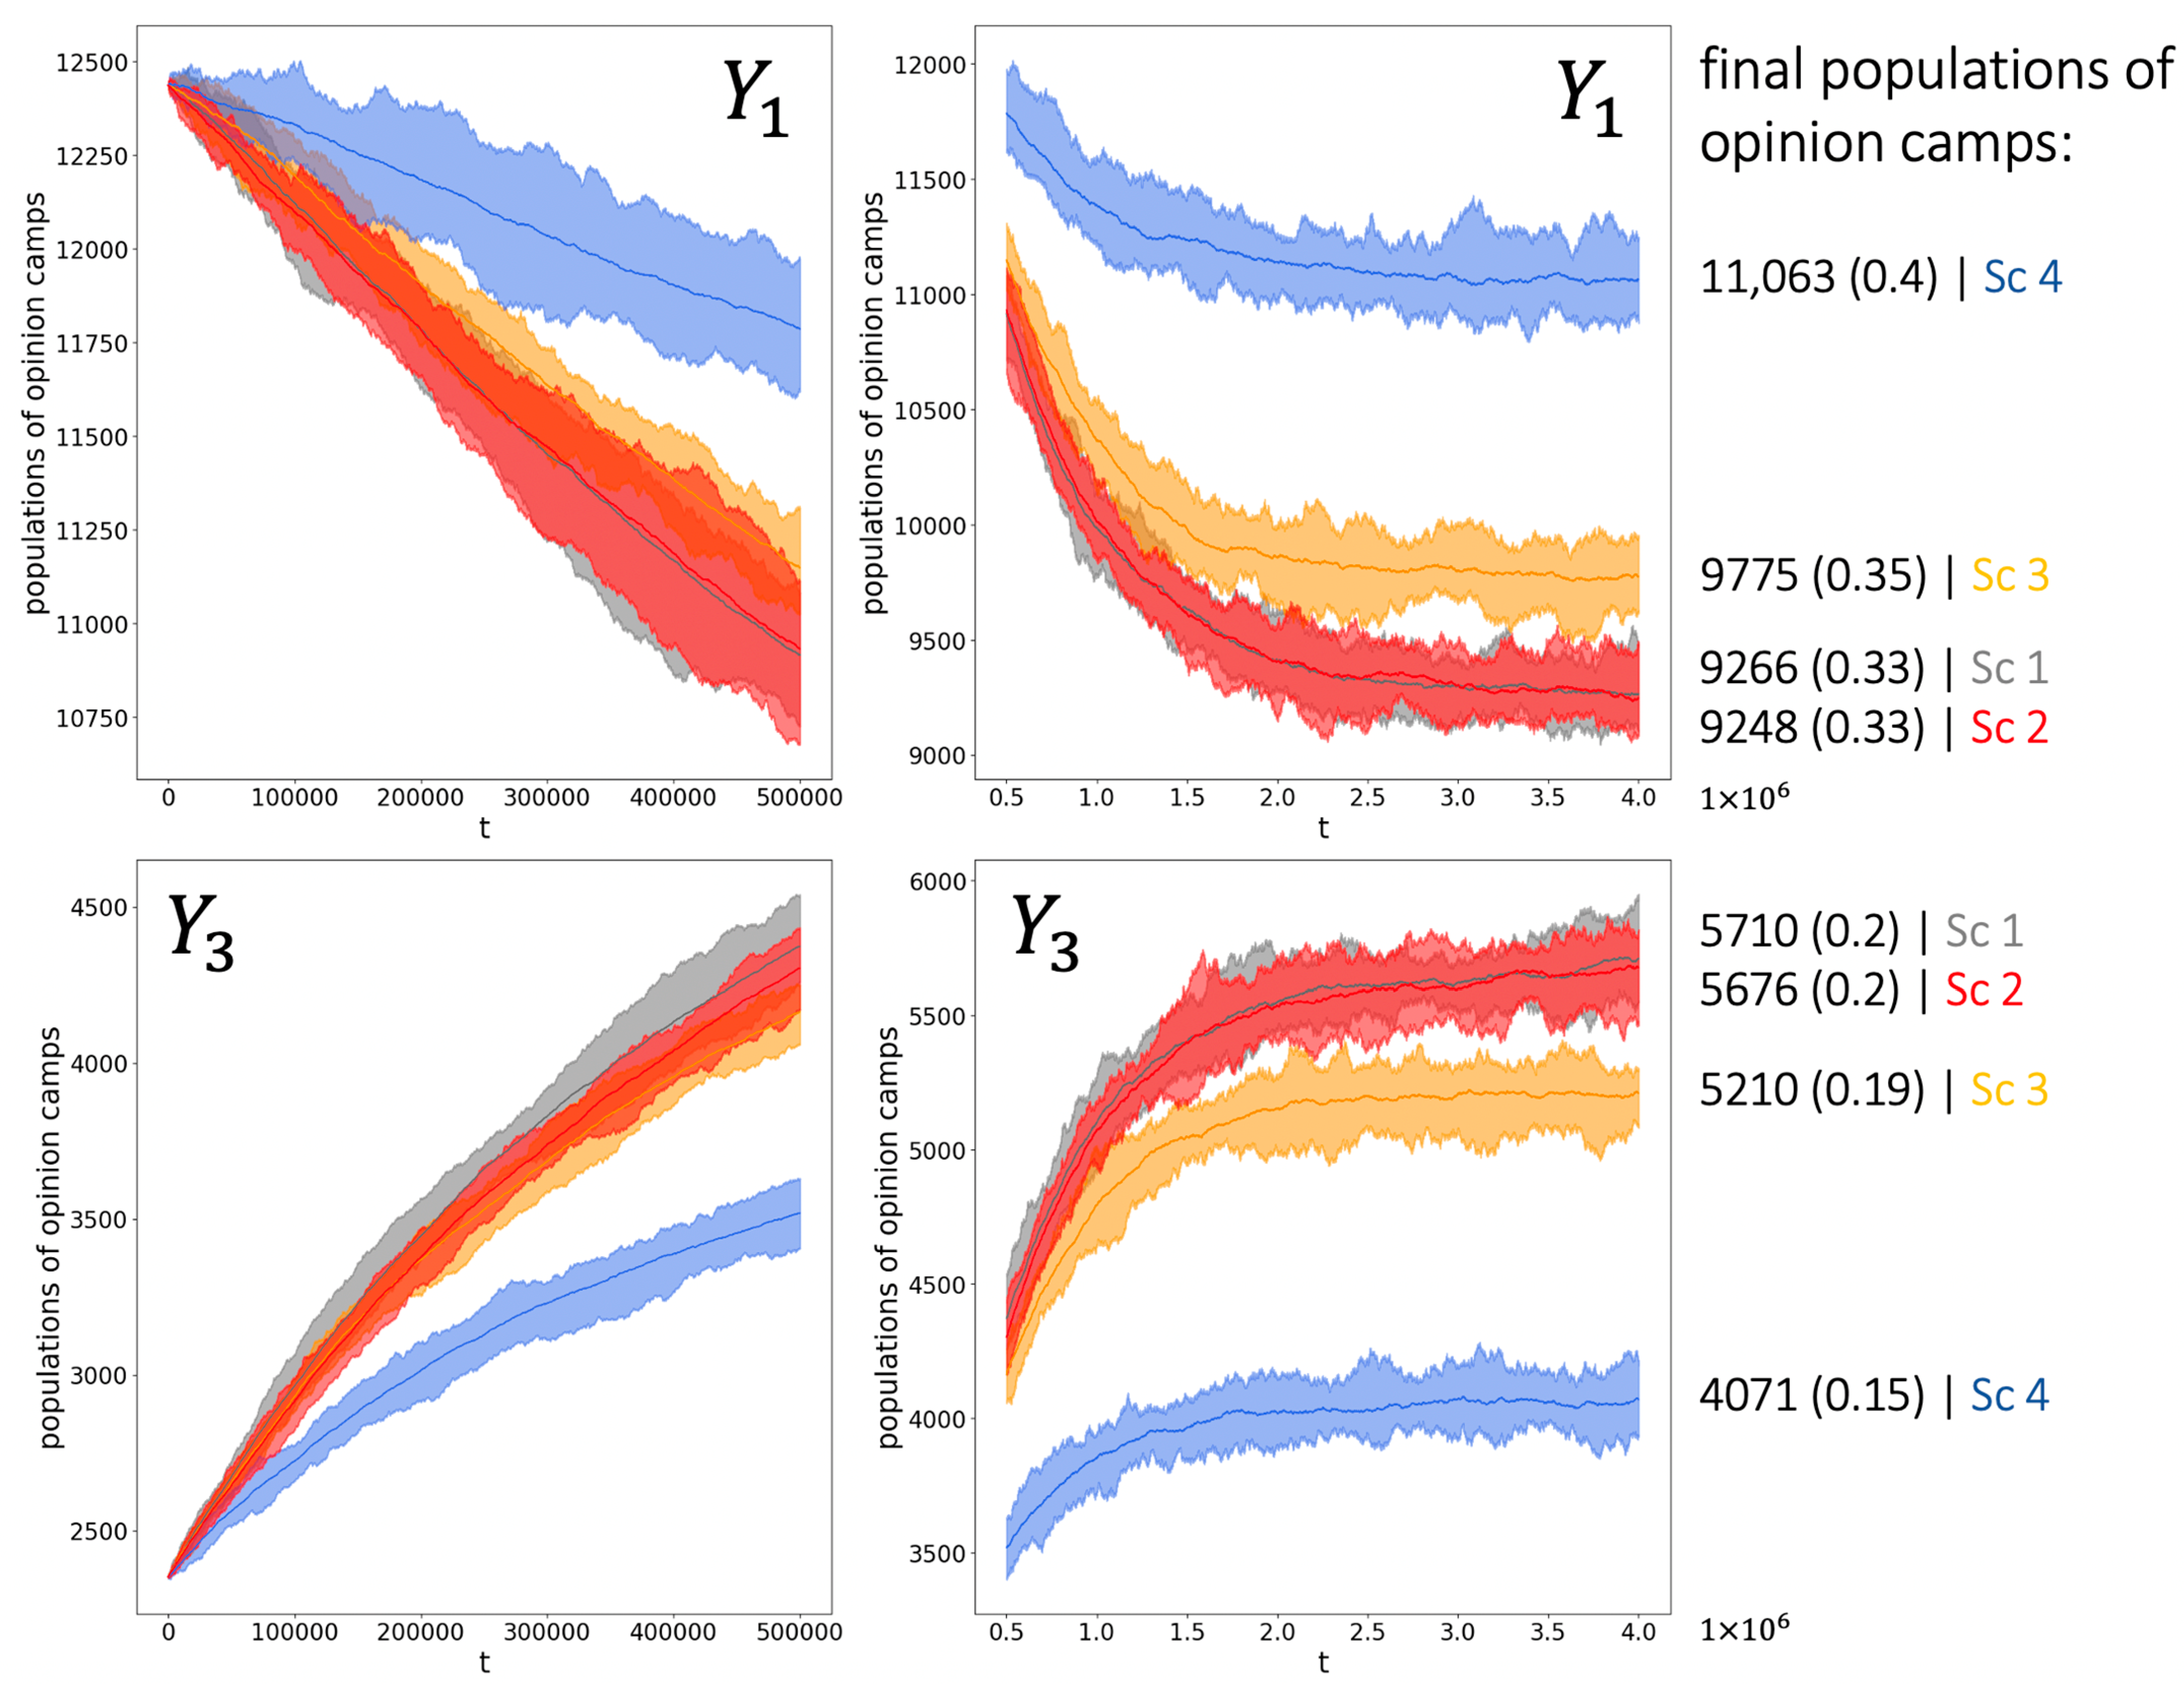
 
As a result of such filtering, we end up with a corpus of 390,149 observations.
However, preliminary analysis (see Table 2) revealed that age is highly correlated with other covariates. On this basis, we decided to exclude it from the list of independent variables. To investigate the effects of the independent variables on , we run Ordinary Least Squares (OLS) regression. Table 3 shows the results of OLS regression, and Figure 4 depicts the estimated values of the regression coefficients. We see that all the covariates, except the absolute difference in gender and the nodal degree, appear to have significant effects on the dependent variable. Further, the effects of those covariates that were estimated to be significant (at the level of 0.05) coincide with our prior intuition (see Table 1). A surprising exception is that females appeared to be less easily influenced than males, other things being equal. From Figure 4, we conclude that the opinion-related covariates ( and ) have the highest effects on the opinion formation processes (the highest effect is provided by ). The contributions of other covariates are far less strong and, additionally, roughly similar. The small values of the estimated coefficients stem largely from the fact that for most observations, the dependent variable is zero or small (see Figure A10 in Appendix C).
       
    
    Table 2.
    The variance inflation factor computed for the covariates in two cases: (1) the age covariate is accounted for (the upper row); (2) the age covariate is omitted (the bottom row).


    Table 3.
    The results of OLS regression.


    Figure 4.
      The values of the estimated OLS regression coefficients (see Table 3) plotted with the corresponding 95% confidence intervals. Significance codes: 0 ‘***’ 0.001 ‘**’ 0.01 ‘*’ 0.05 ‘ ’ 1.
  
7. Simulations
7.1. Motivation
The results presented in the previous section indicate that despite some non-opinion features having significant effects on the way opinions change at the microscopic level, their impacts are not very sound. As such, the question arises if accounting for these features will change the macro-level behavior of the social system at stake. To answer this question, we perform auxiliary simulations with an agent-based opinion dynamics model using the empirical data from the dataset (see Section 2) to calibrate the model’s parameters.
7.2. Agent-Based Models
As a workhorse model, we employ the one from Ref. []. That model was specially designed to investigate and simulate the patterns of opinion dynamics of empirical systems. In this model, agents connected by a social network are initially endowed with opinions from an abstract opinion alphabet . At each moment , a randomly chosen agent  communicates with one of their neighbors  in the social network (which is also chosen by chance). Let us assume that the opinions of  and  are  and , respectively. As a result of the communication, the agent ’s opinion stochastically updates according to the distribution , in which the quantity  stands for the probability that the opinion shift  will occur (the low indices are synchronized with the indices of the underlying opinions , and ). After that, the next iteration begins and so on.
The quantities  form a 3D mathematical object  that is called the transition matrix. In some cases, it is convenient to represent the transition matrix as a list of 2D row-stochastic matrices , where . In fact, previously, we have already worked with this kind of object—see Figure 2 and Figure 3. However, on that occasion, we used such a construction to investigate the already existing opinion dynamics. For now, we employ the transition matrix to develop our own opinion dynamics with the aim of predicting the further evolution of the empirical system at stake.
The macroscopic behavior of the model can be captured by the variables  that describe the populations of opinion camps  at time . Further, we will employ the normalized versions of these quantities: .
Below, the model introduced above will be referred to as the Basic Model.
However, in its current form, the Basic Model assumes that the outcome of an interaction depends on the interacting agents’ opinions only, thus ignoring the effects of non-opinion covariates, which, as reported in Section 6.2, have some impact on opinion dynamics. To account for this issue, instead of applying a single transition matrix, we will use several ones, with each transition matrix dedicated to the description of its own specific combination of non-opinion characteristics of the interacting agents.
To be more specific, motivated by the results obtained in Section 6.2, we introduce two new features of agents (we use the same notations as in Section 5): (i)  and (ii)  (1–females, 2–males). For now, the opinion dynamics protocol is organized as follows. Similar to the Basic Model, at each time moment , a randomly chosen agent  is influenced by one of their friends  (chosen by chance). Let us assume that the opinions of  and  are  and , respectively. For now, we postulate that the outcome of this interaction depends not only on the opinions of the communicating agents but also on (i) how different the agents are in terms of age (), (ii) the number of friends  and  have in common (denoted by ), and, finally, (iii) the gender of the influence object (agent ). Depending on the values of these variables, each pair of interacting agents is assigned to one of the eight possible types (see Table 4). For each type , a specific transition matrix  is recruited (which has the same properties as the transition matrix in the Basic Model).
       
    
    Table 4.
    Definition of the types of agent pairs.
  
The resulting model is called the Advanced Model.
7.3. Simulation Design
Now, we compare the macroscopic predictions (captured by variables ) of the Basic and Advanced Models. We use the empirical data from the dataset to calibrate the models’ parameters: (i) initial characteristics of agents, (ii) the social network, and (iii) the transition matrices. To project the opinion scale  (on which the empirical opinions were estimated) to the opinion alphabet , we discretize the range  into three subintervals  standing for a three-element opinion alphabet  (). Next, we use the dataset snapshots to calibrate the transition matrices by replicating the algorithm presented in Appendix A. In the case of the Basic Model, non-opinion covariates are not accounted for, and we end up with one transition matrix (see Appendix B, Figure A1). For the Advanced Model, eight transition matrices are constructed (see Appendix B, Figure A2, Figure A3, Figure A4, Figure A5, Figure A6, Figure A7, Figure A8 and Figure A9).
For each model, we conduct 20 independent simulations. Each simulation starts from the same state defined by the first snapshot of the dataset (). The network structure and the agents’ characteristics are delicately inherited from the empirical data. To isolate the effect of the correlations between the network and agents’ features ([] revealed that the underlying networked system is assortative with respect to the opinion, age, and gender covariates), we also randomly shuffle the nodes of the network (keeping the nodes’ characteristics fixed) so that all the correlations between the nodal characteristics and the network disappear. (It is worth noting that this procedure does not suppress the correlations at the nodal level—for example, even after applying the shuffling, younger agents will be biased towards the right opinion ). As a result, we end up with four possible Scenarios (see Table 5). Each simulation lasts 4,000,000 iterations: pilots revealed that this time ensures that the system reaches equilibrium in terms of the populations of the opinion camps. (To be more specific, equilibrium is reached at . To understand what this time span stands for, one should recall that in our case, one Monte Carlo step (30,000 iterations) corresponds to the observational period (6 months). From this perspective, according to the model, the empirical social system should reach an equilibrium in ≈33.5 years. Of course, such estimations are unlikely applicable to the description of real-life processes because the underlying empirical system is not closed and is subject to external affairs that affect its development).
       
    
    Table 5.
    Simulation scenarios.
  
7.4. Results
Figure 5 compares the aggregated results of simulations across Scenarios 1–4. We see that if ignoring the non-opinion covariates, then the shuffle procedure does not affect the macroscopic behavior of the model—in both cases, the system finds itself in the equilibrium state . However, simulations with the Advanced Model revealed two important observations. First, we report that if not applying random shuffling (Scenario 3), then the Advanced Model stabilizes around the distribution , which differs from the prediction of the Basic Model by 1000 agents (4% of all votes). However, topologies with suppressed assortativity lead to even larger deviations: simulations within Scenario 4 tend to end up in the state —the advantage of leftists over rightists has increased by  of all votes, if compared to Scenario 3. In all Scenarios, the population of the neutral opinion camp at the equilibrium remains virtually the same (). Of course, one should keep in mind that all these differences in opinion distributions appear in the long run.
      
    
    Figure 5.
      The figure demonstrates the averaged dynamics of the populations of leftists (upper panels) and rightists (bottom panels) across Scenarios 1–4 (marked with different colors). For each Scenario, the colored area is formed by the upper and lower contours of the corresponding simulations, and the curve represents the trajectory averaged over simulations. The left panels depict the time span ; the right panels investigate the range . The final populations of leftists and rightists are depicted on the right side of the figure in absolute and normalized (in brackets) values.
  
8. Discussion and Conclusions
In this paper, using longitudinal data from an online social network, we systematically analyzed how individuals’ opinion and non-opinion characteristics affect opinion dynamics. We revealed that females are harder to convince than males. Next, we found that individuals that are characterized by similar ages have more chances to reach a consensus. Finally, we report that individuals who have many common peers find agreement more often.
In general, these results align with the literature (perhaps, the effect of gender is somewhat novel). We believe that our contribution here is that we demonstrated that the impacts of these effects are virtually the same. Further, our analysis indicates that the effects of non-opinion characteristics, despite being statistically significant, are far less strong than those of opinion characteristics: knowing the current opinion of an individual and, what is even more important, the distance in opinions between this individual and the person that attempts to influence the individual is much more valuable than information regarding their ages, genders, and the number of peers they have in common.
To gain a better understanding of this issue, we conducted a series of agent-based experiments using the underlying empirical data to calibrate the agents’ characteristics and the way they interact with each other. We revealed that accounting for non-opinion characteristics leads to not very sound but statistically significant changes in the macroscopic predictions of the populations of opinion camps in the long run, primarily among the agents with radical opinions ( of all votes). In turn, predictions for the populations of neutral individuals are virtually the same. In addition, we demonstrated that the effect of non-opinion features is seriously moderated by whether the underlying social network correlates with the agents’ characteristics. After applying the procedure of random shuffling (in which the agents and their characteristics were randomly scattered over the network), the macroscopic predictions have changed by  of all votes. What is interesting is that the population of neutral agents was not affected by this intervention.
The main disadvantage of our analysis is that it draws upon the data from the natural experiment, so we have no opportunity to control for many confounding factors. For example, we completely dismiss external effects []. In fact, we do not know the history of users’ interactions during the observational period. Likely not all users were active in promoting their views to their friends. Usually, individuals with radical opinions are those who translate their opinions more often []. In turn, our assumption was that each user influenced each of their friends. Further, we considered each pair of befriended users  and  as two independent observations, sequentially changing the roles of the agents (influence object and influence source). This approach is weakened by the following confounding factors: it ignores the possibility that the dynamics of the opinions of  and  may be subject to some external effects, such as opinions of the ’s and ’s peers (external stimuli). Despite this possibility being partially suppressed by the fact that we also considered the influences of ’s and ’s peers as independent observations, the assumption of independent observations is likely violated on this occasion, so our regression analysis, as well as our algorithm for the calibration of the transition matrices, may lead to inaccurate estimations. In Refs. [,], this issue was controlled to some extent because the influence directed on a user  was estimated as the mean of the opinions of the user ’s friends. However, in our case, this approach is questionable because apart from opinions, we attempt to consider other users’ characteristics. For a given user, the joint distribution of these characteristics among the user’s friends may be quite complex and nontrivial, and simple averaging may suppress some important information.
In the end, we would like to highlight that in our analysis, we concentrated on the role of observable and easily recoverable user characteristics in opinion formation processes. Indeed, ages, genders, and the numbers of users’ peers can be promptly retrieved from the Web using Application Programming Interface (API) facilities with a relatively small investment in resources. Of course, using more detailed information can lead to more precise predictions. For example, Ref. [] reported that the allocation of a user’s trust is highly correlated with how intensively the user likes their peers, with more likes indicating more trust. However, this sort of information requires employing API facilities that were unavailable to us on this occasion. Nevertheless, it would be a promising direction for further research.
Author Contributions
Conceptualization, I.V.K.; Methodology, I.V.K.; Software, V.N.G. and I.V.K.; Validation, I.V.K.; Formal analysis, V.N.G. and I.V.K.; Investigation, V.N.G. and I.V.K.; Resources, I.V.K.; Data curation, I.V.K.; Writing—original draft preparation, I.V.K.; Writing—review and editing, I.V.K.; Visualization, V.N.G. and I.V.K.; Supervision, I.V.K.; Project administration, I.V.K.; Funding acquisition, I.V.K. All authors have read and agreed to the published version of the manuscript.
Funding
The research was supported by a grant of the Russian Science Foundation (project no. 22-71-00075).
Data Availability Statement
All of the data and codes can be obtained upon a reasonable request.
Acknowledgments
The authors are grateful to anonymous reviewers for their invaluable comments.
Conflicts of Interest
The authors declare no conflict of interest.
Appendix A
The quantities  were computed via the following formula:


It is worth noting that in formula (A1), each edge  appears two times: (i) when  is an influence object and  is an influence source; (ii) when  is an influence source and  is an influence object. (This approach silently assumes that during the observation period, each user was influenced by each of their friends strictly one time, with all these influences being independent of each other. In fact, such a sort of interactions (also known as one-to-one) is widely adopted in opinion formation models—see Refs. [,,]. However, the assumption that each pairwise interaction has happened is quite strict). Next, to control for the confounding factors conditioned by the dynamics of ties and possible changes in the opinion of the influence source, we discard those observations from our analysis that violate the following restrictions:
		
- -
 - (the focal tie should remain unchanged).
 - -
 - (the number of common friends should be constant as it could have an effect on opinion dynamics).
 - -
 - (the influence source’s opinion should not undergo significant changes during the observation period—otherwise, we cannot precisely locate its value).
 
The transition matrix for the Basic Model (see Figure A1 in Appendix B) is constructed using the same approach. The transition matrices for the Advanced Model are calculated in a similar fashion. For example, the components of the transition matrix that describe interactions of type 1 (see Figure A2 in Appendix B) are defined as follows:


Appendix B
      
    
    Figure A1.
      This transition matrix was estimated based on the empirical data (non-opinion covariates are ignored).


    Figure A2.
      This transition matrix was estimated based on the empirical data (type 1—see Table 4 and formula (A2)).


    Figure A3.
      This transition matrix was estimated based on the empirical data (type 2—see Table 4).


    Figure A4.
      This transition matrix was estimated based on the empirical data (type 3—see Table 4).


    Figure A5.
      This transition matrix was estimated based on the empirical data (type 4—see Table 4).


    Figure A6.
      This transition matrix was estimated based on the empirical data (type 5—see Table 4).


    Figure A7.
      This transition matrix was estimated based on the empirical data (type 6—see Table 4).


    Figure A8.
      This transition matrix was estimated based on the empirical data (type 7—see Table 4).


    Figure A9.
      This transition matrix was estimated based on the empirical data (type 8—see Table 4).
  
Appendix C
      
    
    Figure A10.
      These histograms show the structure of the dataset. The histograms that represent the age, gender, and opinion distributions are borrowed from the Ref. [].
  
References
- Flache, A.; Mäs, M.; Feliciani, T.; Chattoe-Brown, E.; Deffuant, G.; Huet, S.; Lorenz, J. Models of Social Influence: Towards the Next Frontiers. J. Artif. Soc. Soc. Simul. 2017, 20. [Google Scholar] [CrossRef]
 - Proskurnikov, A.V.; Tempo, R. A tutorial on modeling and analysis of dynamic social networks. Part I. Annu. Rev. Control 2017, 43, 65–79. [Google Scholar] [CrossRef]
 - Friedkin, N.E.; Proskurnikov, A.V.; Bullo, F. Group dynamics on multidimensional object threat appraisals. Soc. Netw. 2021, 65, 157–167. [Google Scholar] [CrossRef]
 - Friedkin, N.E.; Bullo, F. How truth wins in opinion dynamics along issue sequences. Proc. Natl. Acad. Sci. USA 2017, 114, 11380–11385. [Google Scholar] [CrossRef]
 - Carpentras, D.; Maher, P.J.; O’Reilly, C.; Quayle, M. Deriving an Opinion Dynamics Model from Experimental Data. J. Artif. Soc. Soc. Simul. 2022, 25. [Google Scholar] [CrossRef]
 - Clemm von Hohenberg, B.; Maes, M.; Pradelski, B. Micro Influence and Macro Dynamics of Opinion Formation (SSRN Scholarly Paper ID 2974413). Soc. Sci. Res. Netw. 2017. Available online: https://drive.google.com/file/d/1V11jIMqPIkfxmzin0jn_msiThtZtWrWe/view (accessed on 8 May 2023).
 - Liu, C.C.; Srivastava, S.B. Pulling Closer and Moving Apart: Interaction, Identity, and Influence in the U.S. Senate, 1973 to 2009. Am. Sociol. Rev. 2015, 80, 192–217. [Google Scholar] [CrossRef]
 - Moussaïd, M.; Kaemmer, J.E.; Analytis, P.P.; Neth, H. Social Influence and the Collective Dynamics of Opinion Formation. PLoS ONE 2013, 8, e78433. [Google Scholar] [CrossRef]
 - Pansanella, V.; Morini, V.; Squartini, T.; Rossetti, G. Change my Mind: Data Driven Estimate of Open-Mindedness from Political Discussions. arXiv 2022, arXiv:2209.10470. [Google Scholar]
 - Takács, K.; Flache, A.; Mäs, M. Discrepancy and Disliking Do Not Induce Negative Opinion Shifts. PLoS ONE 2016, 11, e0157948. [Google Scholar] [CrossRef]
 - Barbera, P. Birds of the Same Feather Tweet Together: Bayesian Ideal Point Estimation Using Twitter Data. Political Anal. 2015, 23, 76–91. [Google Scholar] [CrossRef]
 - Barberá, P. How Social Media Reduces Mass Political Polarization. Evidence from Germany, Spain, and the US; Job Market Paper; New York University: New York, NY, USA, 2014; p. 46. [Google Scholar]
 - Bond, R.M.; Fariss, C.J.; Jones, J.J.; Kramer, A.D.I.; Marlow, C.; Settle, J.E.; Fowler, J.H. A 61-million-person experiment in social influence and political mobilization. Nature 2012, 489, 295–298. [Google Scholar] [CrossRef] [PubMed]
 - Corradini, E.; Nocera, A.; Ursino, D.; Virgili, L. Investigating negative reviews and detecting negative influencers in Yelp through a multi-dimensional social network based model. Int. J. Inf. Manag. 2021, 60, 102377. [Google Scholar] [CrossRef]
 - Kozitsin, I.V. Formal models of opinion formation and their application to real data: Evidence from online social networks. J. Math. Sociol. 2020, 46, 120–147. [Google Scholar] [CrossRef]
 - Kozitsin, I.V. Opinion dynamics of online social network users: A micro-level analysis. J. Math. Sociol. 2021, 47, 1–41. [Google Scholar] [CrossRef]
 - Stöckli, S.; Hofer, D. Susceptibility to social influence predicts behavior on Facebook. PLoS ONE 2020, 15, e0229337. [Google Scholar] [CrossRef]
 - Xiong, F.; Liu, Y.; Cheng, J. Modeling and predicting opinion formation with trust propagation in online social networks. Commun. Nonlinear Sci. Numer. Simul. 2017, 44, 513–524. [Google Scholar] [CrossRef]
 - Bonifazi, G.; Cauteruccio, F.; Corradini, E.; Marchetti, M.; Pierini, A.; Terracina, G.; Ursino, D.; Virgili, L. An approach to detect backbones of information diffusers among different communities of a social platform. Data Knowl. Eng. 2022, 140, 102048. [Google Scholar] [CrossRef]
 - DeGroot, M.H. Reaching a consensus. J. Am. Stat. Assoc. 1974, 69, 118–121. [Google Scholar] [CrossRef]
 - Friedkin, N.E.; Proskurnikov, A.V.; Tempo, R.; Parsegov, S.E. Network science on belief system dynamics under logic constraints. Science 2016, 354, 321–326. [Google Scholar] [CrossRef]
 - Ravazzi, C.; Dabbene, F.; Lagoa, C.; Proskurnikov, A.V. Learning Hidden Influences in Large-Scale Dynamical Social Networks: A Data-Driven Sparsity-Based Approach, in Memory of Roberto Tempo. IEEE Control Syst. 2021, 41, 61–103. [Google Scholar] [CrossRef]
 - Sears, D.O. College sophomores in the laboratory: Influences of a narrow data base on social psychology’s view of human nature. J. Pers. Soc. Psychol. 1986, 51, 515–530. [Google Scholar] [CrossRef]
 - Peshkovskaya, A.; Myagkov, M.; Babkina, T.; Lukinova, E. Do women socialize better? Evidence from a study on sociality effects on gender differences in cooperative behavior. CEUR Workshop Proceeding 2017, 1968, 41–51. [Google Scholar]
 - Peshkovskaya, A.; Babkina, T.; Myagkov, M. Social context reveals gender differences in cooperative behavior. J. Bioecon. 2018, 20, 213–225. [Google Scholar] [CrossRef]
 - Peshkovskaya, A.; Babkina, T.; Myagkov, M. In-group cooperation and gender: Evidence from an interdisciplinary study. In Global Economics and Management: Transition to Economy 4.0; Kaz, M., Ilina, T., Medvedev, G.A., Eds.; Springer International Publishing: Cham, Switzerland, 2019; pp. 193–200. [Google Scholar] [CrossRef]
 - Eagly, A.H. Gender and social influence: A social psychological analysis. Am. Psychol. 1983, 38, 971–981. [Google Scholar] [CrossRef]
 - Kozitsin, I.V.; Gubanov, A.V.; Sayfulin, E.R.; Goiko, V.L. A nontrivial interplay between triadic closure, preferential, and anti-preferential attachment: New insights from online data. Online Soc. Netw. Media 2023, 34, 100248. [Google Scholar] [CrossRef]
 - Deffuant, G.; Neau, D.; Amblard, F.; Weisbuch, G. Mixing beliefs among interacting agents. Adv. Complex Syst. 2000, 3, 87–98. [Google Scholar] [CrossRef]
 - Hegselmann, R.; Krause, U. Opinion dynamics and bounded confidence models, analysis, and simulation. J. Artif. Soc. Soc. Simul. 2002, 5, 1–33. [Google Scholar]
 - Kurahashi-Nakamura, T.; Mäs, M.; Lorenz, J. Robust Clustering in Generalized Bounded Confidence Models. J. Artif. Soc. Soc. Simul. 2016, 19. [Google Scholar] [CrossRef]
 - Balietti, S.; Getoor, L.; Goldstein, D.G.; Watts, D.J. Reducing opinion polarization: Effects of exposure to similar people with differing political views. Proc. Natl. Acad. Sci. USA 2021, 118, e2112552118. [Google Scholar] [CrossRef]
 - Aral, S.; Walker, D. Tie Strength, Embeddedness, and Social Influence: A Large-Scale Networked Experiment. Manag. Sci. 2014, 60, 1352–1370. [Google Scholar] [CrossRef]
 - Friedkin, N.E. A Formal Theory of Reflected Appraisals in the Evolution of Power. Adm. Sci. Q. 2011, 56, 501–529. [Google Scholar] [CrossRef]
 - Kozitsin, I.V.; Chkhartishvili, A.; Marchenko, A.M.; Norkin, D.O.; Osipov, S.D.; Uteshev, I.; Goiko, V.L.; Palkin, R.V.; Myagkov, M.G. Modeling Political Preferences of Russian Users Exemplified by the Social Network Vkontakte. Math. Model. Comput. Simul. 2020, 12, 185–194. [Google Scholar] [CrossRef]
 - Clifford, P.; Sudbury, A. A model for spatial conflict. Biometrika 1973, 60, 581–588. [Google Scholar] [CrossRef]
 - Mäs, M.; Flache, A. Differentiation without Distancing. Explaining Bi-Polarization of Opinions without Negative Influence. PLoS ONE 2013, 8, e74516. [Google Scholar] [CrossRef] [PubMed]
 - Kozitsin, I.V. A general framework to link theory and empirics in opinion formation models. Sci. Rep. 2022, 12, 5543. [Google Scholar] [CrossRef]
 - Petrov, A.; Akhremenko, A.; Zheglov, S. Dual Identity in Repressive Contexts: An Agent-Based Model of Protest Dynamics. Soc. Sci. Comput. Rev. 2023. [Google Scholar] [CrossRef]
 - Preoţiuc-Pietro, D.; Liu, Y.; Hopkins, D.; Ungar, L. Beyond binary labels: Political ideology prediction of twitter users. In Proceedings of the 55th Annual Meeting of the Association for Computational Linguistics, Vancouver, BC, Canada, 30 July–4 August 2017; pp. 729–740. [Google Scholar] [CrossRef]
 
Disclaimer/Publisher’s Note: The statements, opinions and data contained in all publications are solely those of the individual author(s) and contributor(s) and not of MDPI and/or the editor(s). MDPI and/or the editor(s) disclaim responsibility for any injury to people or property resulting from any ideas, methods, instructions or products referred to in the content.  | 
© 2023 by the authors. Licensee MDPI, Basel, Switzerland. This article is an open access article distributed under the terms and conditions of the Creative Commons Attribution (CC BY) license (https://creativecommons.org/licenses/by/4.0/).