You are currently viewing a new version of our website. To view the old version click .
Computers
  • Article
  • Open Access

22 February 2023

Understanding Quality of Products from Customers’ Attitude Using Advanced Machine Learning Methods

,
,
and
1
Department of Computer Science, University of Science & Technology, Bannu 28100, Pakistan
2
Department of Computer Science, Government Postgraduate College, Bannu 28100, Pakistan
*
Author to whom correspondence should be addressed.

Abstract

The trend of E-commerce and online shopping is increasing rapidly. However, it is difficult to know about the quality of items from pictures and videos available on the online stores. Therefore, online stores and independent products reviews sites share user reviews about the products for the ease of buyers to find out the best quality products. The proposed work is about measuring and detecting product quality based on consumers’ attitude in product reviews. Predicting the quality of a product from customers’ reviews is a challenging and novel research area. Natural Language Processing and machine learning methods are popularly employed to identify product quality from customer reviews. Most of the existing research for the product review system has been done using traditional sentiment analysis and opinion mining. Going beyond the constraints of opinion and sentiment, such as a deeper description of the input text, is made possible by utilizing appraisal categories. The main focus of this study is exploiting the quality subcategory of the appraisal framework in order to predict the quality of the product. This paper presents a quality of product-based classification model (named QLeBERT) by combining quality of product-related lexicon, N-grams, Bidirectional Encoder Representations from Transformers (BERT), and Bidirectional Long Short Term Memory (BiLSTM). In the proposed model, the quality of the product-related lexicon, N-grams, and BERT are employed to generate vectors of words from part of the customers’ reviews. The main contribution of this work is the preparation of the quality of product-related lexicon dictionary based on an appraisal framework and automatically labelling the data accordingly before using them as the training data in the BiLSTM model. The proposed model is evaluated on an Amazon product reviews dataset. The proposed QLeBERT outperforms the existing state-of-the-art models by achieving an F1macro score of 0.91 in binary classification.

1. Introduction

Online shopping and the Internet have dramatically changed traditional offline businesses into web-based ones using platforms like social media, search engines, and e-commerce sites like Amazon, Shopify, eBay, Etsy, WooCommerce, etc. Customers can effortlessly place their orders to purchase products and receive them at home. Online shopping has many advantages, e.g., fast access to various items, a better selection of items, detailed information about products, etc. The problem that arises in such shopping is that customers need to learn about the actual quality of the products. Business proprietors have created review or feedback systems for prior customers to cope with such issues. Feedback from customers is collected in different ways, e.g., through surveys on the social web, live chat, offering incentives to customers on their responses, creating a feedback system on the website, etc. The focus of this study is to identify product quality from customers’ attitude using advanced machine learning methods. Attitude is a somewhat durable organization of beliefs, thoughts, and behavior proclivities in connection with critical social elements, groups, occurrences, or symbols []. The appraisal framework examines the attitude of people in a written text. The attitude system in the appraisal framework has three main subdomains: appreciation, affect, and judgment. Affects are emotion-based; judgment deals with the evaluation of persons to extract their opinions, and appreciation deals with the extraction of opinions related to physical things, processes, etc. Appreciation is further divided into three main categories, i.e., reaction, composition, and valuation. Impact and quality are associated with the reaction. The impact is associated with opinions regarding the attractiveness and unattractiveness of things. Quality is related to the liking and disliking of things, e.g., beautiful, elegant, hideous, etc. Composition is further divided into two main parts, i.e., complexity and balance. Complexity is about opinions containing complications and the simplicity of things. Balance deals with ideas like balance and unbalanced things. Valuation, as its name implies, contains opinions related to concepts like the innovativeness, uselessness, cost, shoddiness, etc., of things []. Quality means the features of a particular product that satisfy customers’ needs. Quality assessment enables stakeholders to improve the standard of their products and make them more marketable, compete more effectively, gain market share, and generate sales revenue. Higher quality enables businesses to lower error rates, rework, field failures, warranty costs, customer unhappiness, and other costs. It also reduces the time to launch new products []. This study exploits an appraisal framework to prepare the quality of the product-based lexicon dictionary and then employs a BERT word embedding model and BiLSTM model to detect the quality of the product from customers’ attitudes in product reviews.
The main contributions of this study are the following:
  • The development of annotation guidelines for a lexicon dictionary to identify product quality based on an appraisal framework.
  • To the best of our knowledge, the proposed model is the first to identify the quality of a product from customers’ attitude based on an appraisal framework using a lexicon approach with N-grams and the utilization of a pre-trained BERT word embeddings model in combination with BiLSTM.
This paper is organized as follows: Section 2 concerns related work. Section 3 consists of the methodology. Section 4 is about the experiment. Section 5 comprises the results and discussion, while Section 6 contains the conclusions and future work.

3. Methodology

This section comprises text preprocessing, description of proposed model, proposed pseudo code for the generation of vectors, and the BiLSTM model.

3.1. Text Proprocessing

Preprocessing of text is concerned with eliminating unimportant features and extracting important features from the text so that a machine learning model can be built efficiently and accurately. Amazon customers’ product reviews datasets were preprocessed by the help of the following steps:

3.1.1. Tokenization

Tokens were created for each sentence in the customer review by using delimiters like a semicolon, colon, comma, dot, etc. Each token is independent of the others and has a separate meaning.

3.1.2. Text Conversion into Lower Case

To ensure that both upper- and lower-case text convey the same meaning, we converted all review text into lower case [].

3.1.3. Removal of Punctuations

Reduction of punctuation is an important task when working with natural language processing activities because punctuation symbols do not have a lot of semantic meaning and may introduce noise into the data. Therefore, we omitted punctuation symbols from product reviews.

3.1.4. Removal of Stop Words

The stop words were eliminated since they did not significantly add meaning to the data. By eliminating stop words, the emphasis is transferred to the significant words, which decreases the text’s dimension and makes it simpler to identify patterns and semantics in the text.

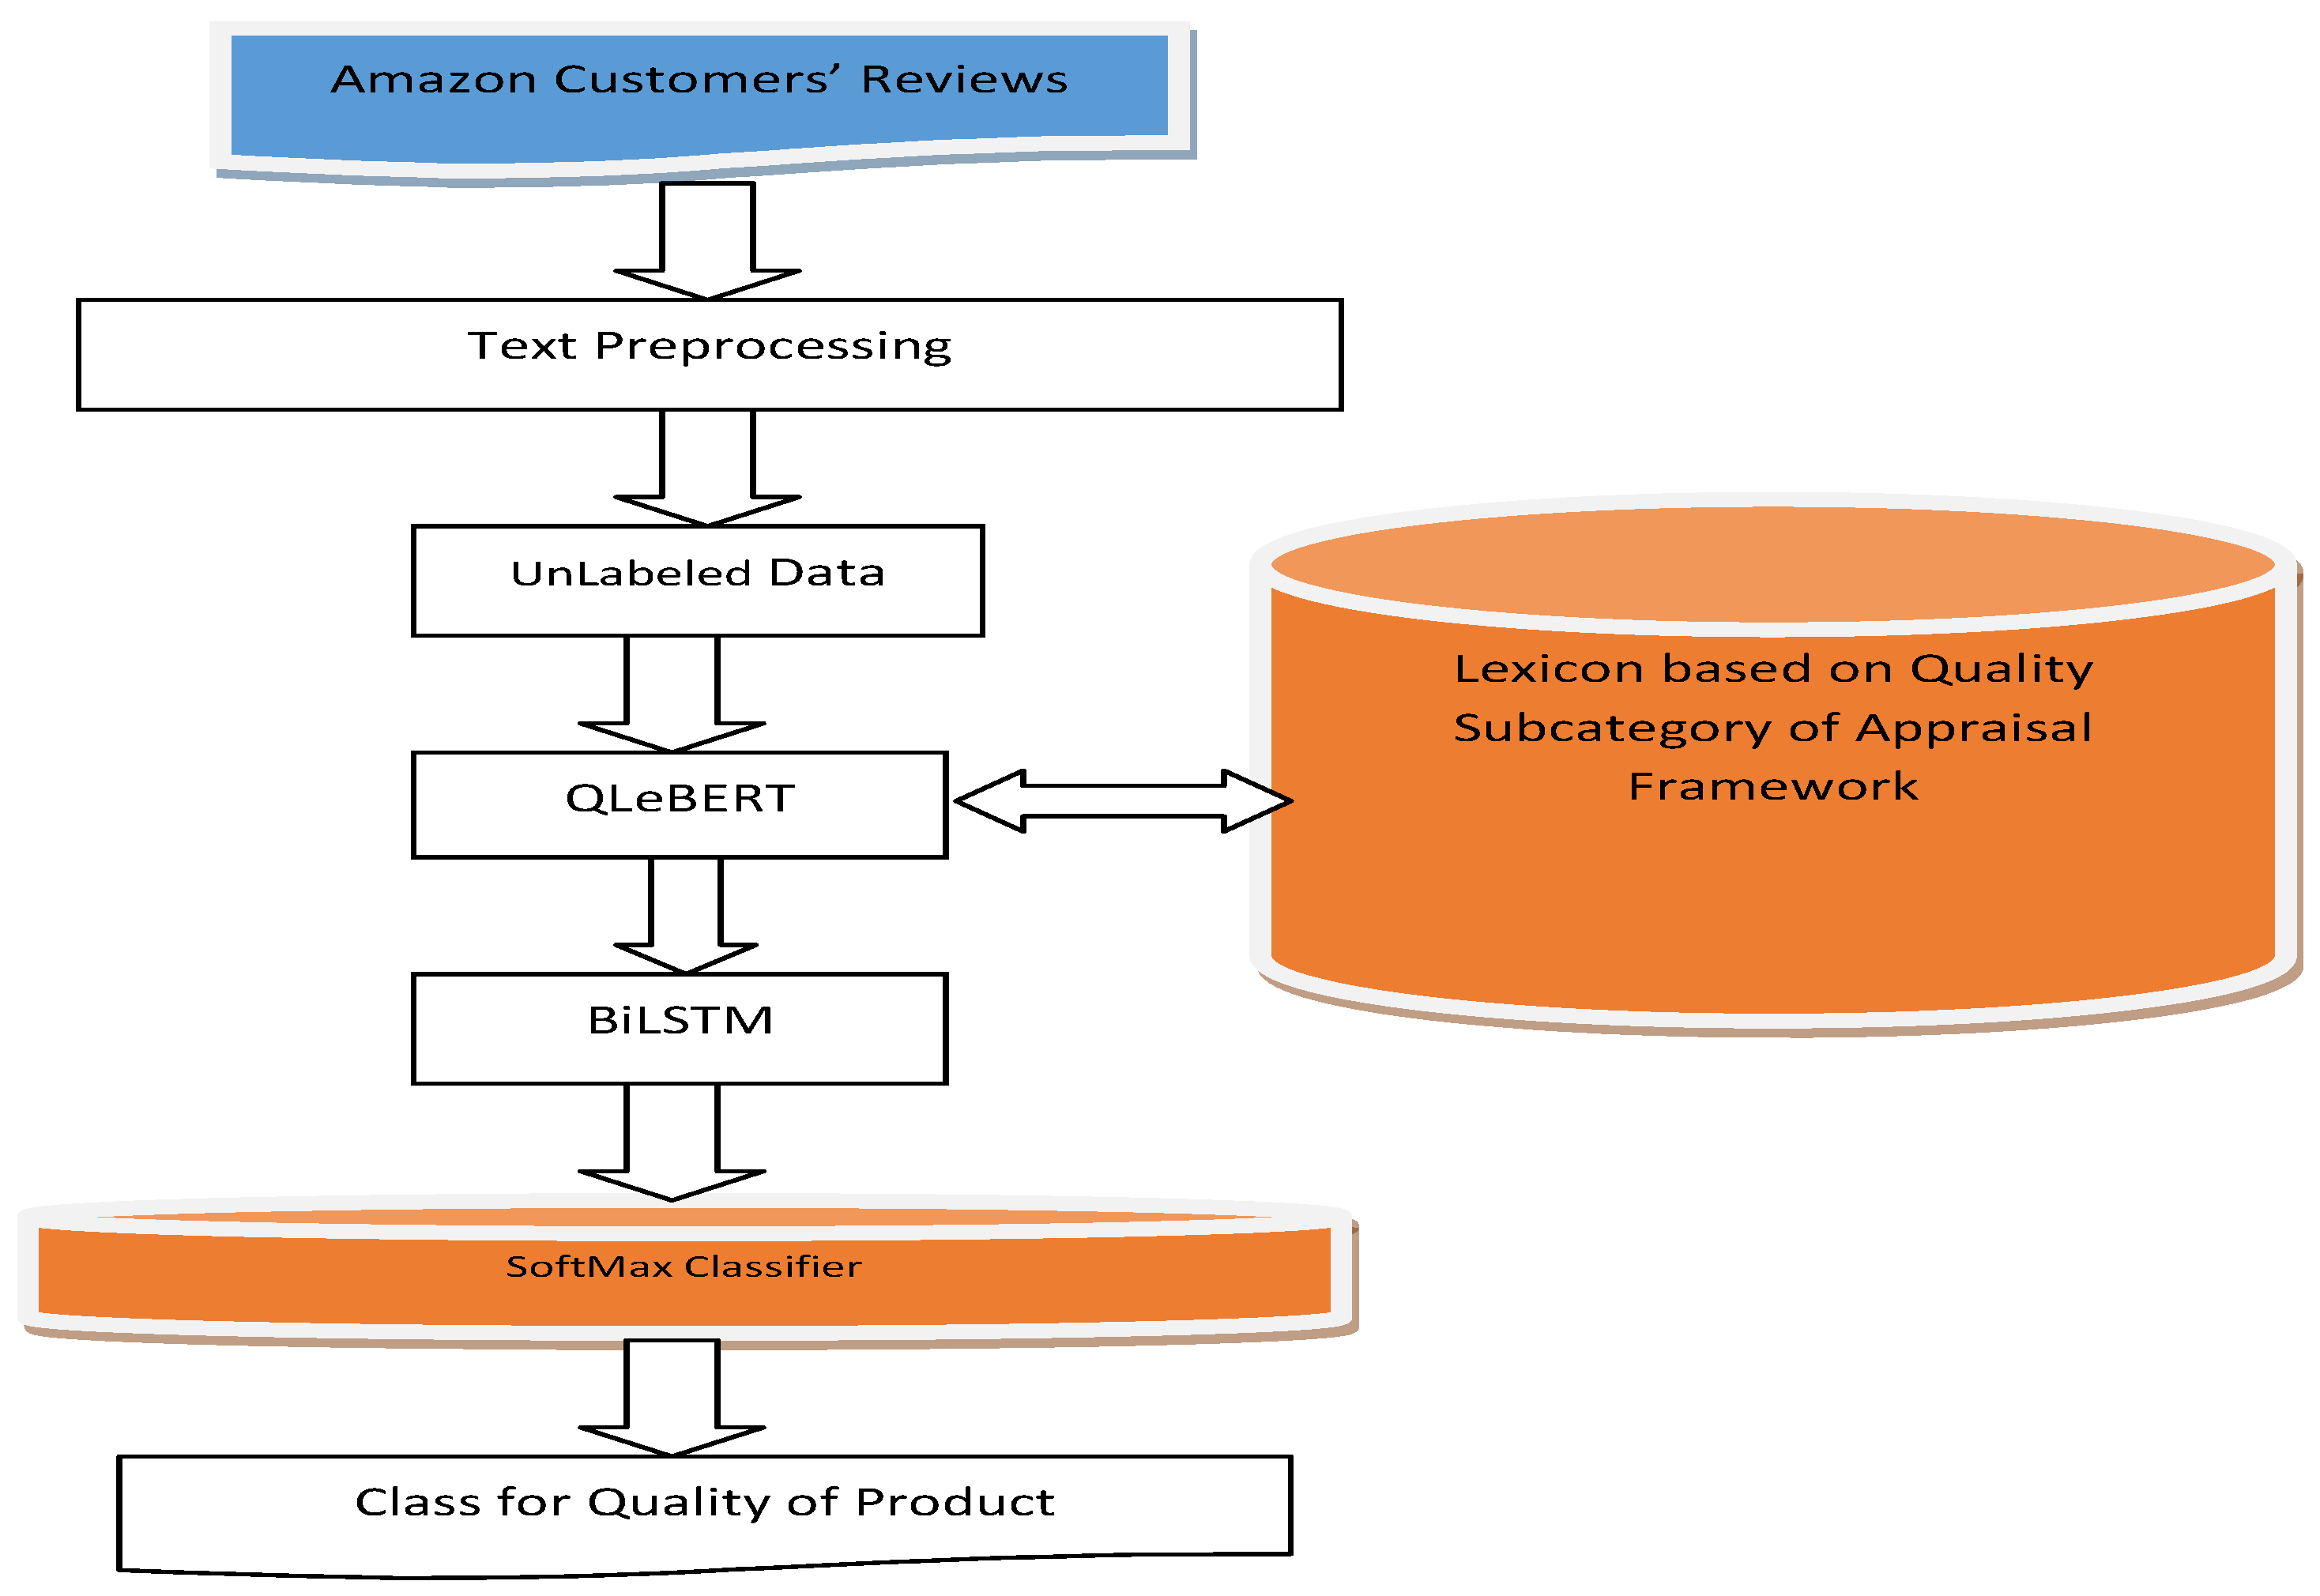
3.2. Description of Proposed QLeBERT Model

The BERT model is a word embedding model that reads series of words of the input text in a bidirectional manner. It comprises an attention mechanism to allocate words to its vectors based on nearby words []. Even though BERT takes a word’s context into account when allocating the vector, it does so for every word in the input text, resulting in a high-dimensional vector. Second, word vectors produced by BERT lack semantic information, which is crucial for text classification. Conventional sentiment analysis uses a sentiment lexicon to identify sentimental terms in a text and then assign sentiment polarity to the words. However, this technique does not generate word vectors, which will lead to data sparsity. This research presents the QLeBERT model as shown in Figure 1. It combines a lexicon based on a quality subcategory of the attitude system in the appraisal framework, N-grams, and the BERT algorithm to improve conventional sentiment categorization. The main goal of QLeBERT is to segment the input text using N-grams methods by using lexicon-based methods to identify segments of the input text related to the quality subcategory words of the attitude system in the appraisal framework, subsequently converted into vectors by the BERT algorithm. A BiLSTM model is then run on the resulting vector to extract contextual features. The resultant features are analyzed by the Softmax function to predict the quality of the product.
Figure 1. Schematic Representation of Proposed QLeBERT Model.
In our proposed model, N-grams are used to incorporate the two most popular methods for creating text vectors for sentiment analysis: word embedding-based methods and a lexicon-based approach. N-grams are used to predict the subsequent word in a string of words, and they also generate a co-occurrence of words, which is an important element to identify sentiment in a text. Lexicons exhibiting the quality of a product are discovered by word N-grams comprising lexicon words based on the quality subcategory in an attitude system of the appraisal framework, then the BERT model is used to build vectors from N-grams words. In this research work, we employ N-grams to divide the customers’ review into different segments that represent the whole customers’ review. This is due to the fact that N-grams provide a text’s word co-occurrence in a more thorough manner than a bag of words.

3.3. Algorithm: QLeBERT Model

The pseudocodes of the proposed QLeBERT model are presented below as Algorithm 1:
Algorithm 1: Psecudocodes of the QLeBERT model
//This algorithm takes customer reviews CRi having words Wi and generates high
//quality and low products h and l, respectively.
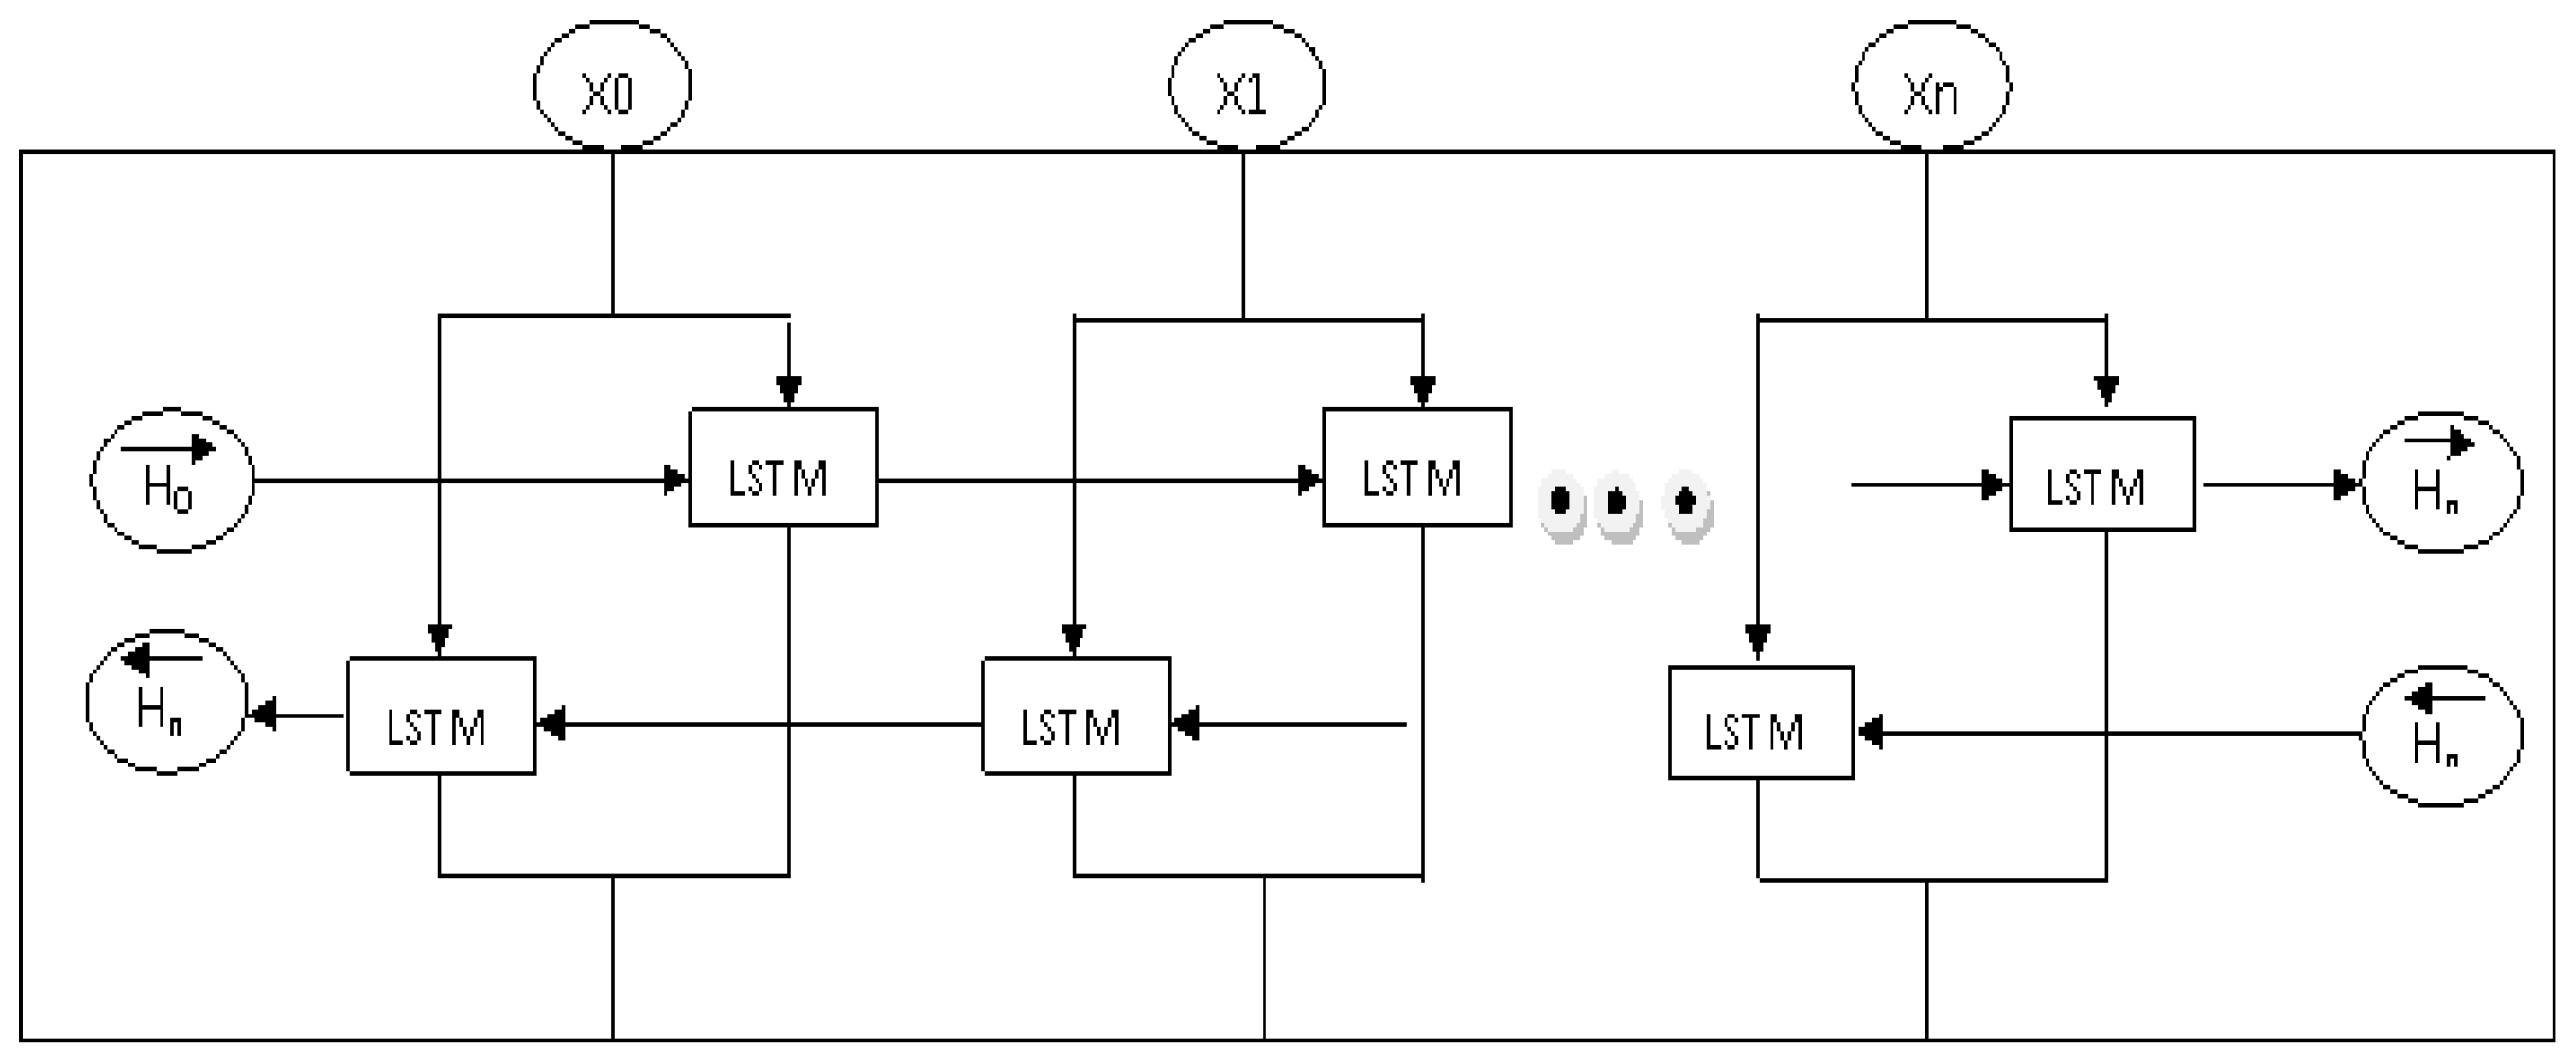
  • Input: Customer Reviews CRi having words Wi
  • Output: Customers’ Attitude toward Product as h or l
  • Set N-gram value to N = 2
  • for all CRi ∈ Repi containing n tokens //Repository of customers’ reviews
  • display Bigram Word
  • apply QLeBERT model
  • end for
  • for all bigram_words
  • if bigram_words exists in Quality Appraisal Category
  • display bigram_words
  • else
  • discard bigram_words
  • end if
  • end for
  • for each Wi
  • read Wi from B_Wi   // B_Wi represents bag of words
  • apply BERT model
  • generate and update Wvec
  • end for
  • apply BiLSTM (Wvec)   // to classify the product as h or l
  • exit

3.4. BiLSTM

A forward and a backward LSTM make up the BiLSTM model, and the LSTM in this model is a variant of a recurrent neural network (RNN). A gating unit in LSTM is used to solve the vanishing gradients problem. This gives the LSTM a stronger ability to counter issues like long-term dependencies and empowers the RNN to exploit the dependencies that exist in long-distance data in a better and more effective way. The authors in [] proposed BiLSTM to obtain backward and forward features in a specific amount of time. Using the input sequence data, the BiLSTM model extracts contextual information. As shown in Figure 2, [], H 0 , H 1 , H 2 , H 3 , . H n show the forward hidden layer state of BiLSTM whereas H 0 ,   H 1 , H 2 , H 3 , .. H n indicate the backward/reverse hidden layer state of BiLSTM. Equations (1) and (2) display the state equations for each moment of the model while Equation (3) jointly represents the final state of the BiLSTM model.
H i = L S T M ( x i ,   H i 1 )
xi shows input vector at time I, H i 1 denotes the forward hidden layer vector at time i − 1, and H i 1 denotes the reverse hidden layer vector at time i − 1, respectively. Output vector vi as shown in Equation (3) combines both forward and backward hidden layers vectors.
V i = H i + H i  
Figure 2. Architecture of BiLSTM Model.

3.5. Focal Loss Function

In machine learning, class imbalance occurs when one class has a disproportionately smaller number of samples compared to the other class [,,]. Only 11% of the customer reviews in our problem are classified as low quality. Under-fitting and over-fitting problems are raised when we under-sample the majority class or over-sample the minority class, respectively, while resolving the issues of class imbalance. Over-sampling the minority class or under-sampling the majority class are the methods for determining the issue of class imbalance []. The disadvantage of these approaches is that they could result in either under-fitting (for the minority class) or over-fitting (for the majority class). In imbalance classes, training is ineffective because the majority of samples are simple instances with no relevant learning signal; the simple examples might overwhelm training and build defective models. The employment of a loss function is an additional tactic. Loss functions are mathematical formulas used to measure the degree to which predictions differ from the actual values, while smaller loss values suggest that the predictions are quite accurate, higher loss values imply that the model is making a substantial error. The Huber Loss function, Log-Cosh Loss function, Quantile Loss function, Cross-Entropy Loss function are the types of Loss function. A solution to the issue of class imbalance can be found in the Loss function. In particular, the Focal Loss function has been employed in object detection and image analysis []. Focal Loss function uses a method known as “Down Weighting” to address the issue of class imbalance. Down weighting is a method to add modulating factors to the Cross-entropy Loss function by giving emphasis on hard examples and by lessening the impact of easy examples.
F L ( p t ) = α ( 1 p t ) γ l o g ( p t )
p ( t ) = { p ,     i f   y = 1 1 p ,     O t h e r w i s e
Let p be the logit probability for the classification of the quality of a product as high or low (y = 1 or 0). Alpha (α) and Gamma (γ) are hyper parameters to enhance binary cross entropy— log ( p t ) .   Factor   ( 1 p t ) γ is added by Focal Loss function to the standard cross entropy, as shown in Equation(4). Due to this method, the model is saved from overfitting and can differentiate between classes efficiently. The setting   γ 0 reduces a relative loss for well-classified samples (pt > 0.5), putting more focus on hard samples which are difficult to classify.

4. Experiment

This section includes a description of datasets, evaluation metrics, experiment findings, and discussions. There is also a discussion of the methods and techniques used in the creation and assessment of models.

4.1. Datasets

In this study, the proposed model QLeBERT is implemented in the Jupyter Notebook using Datafiniti_Amazon_Consumer_Reviews_of_Amazon_Products taken from [] comprising 28,332 customers’ reviews and nine benchmark Amazon product review datasets []: Linksys, Hitachi Routers, Creative Zen MicroMP3 Player, Canon Power Shot SD500, Canon S100, Diaper Champ, IPod, Nokia 6600, and Norton Antivirus, containing 2656 customer reviews, which were originally created for sentiment analysis.

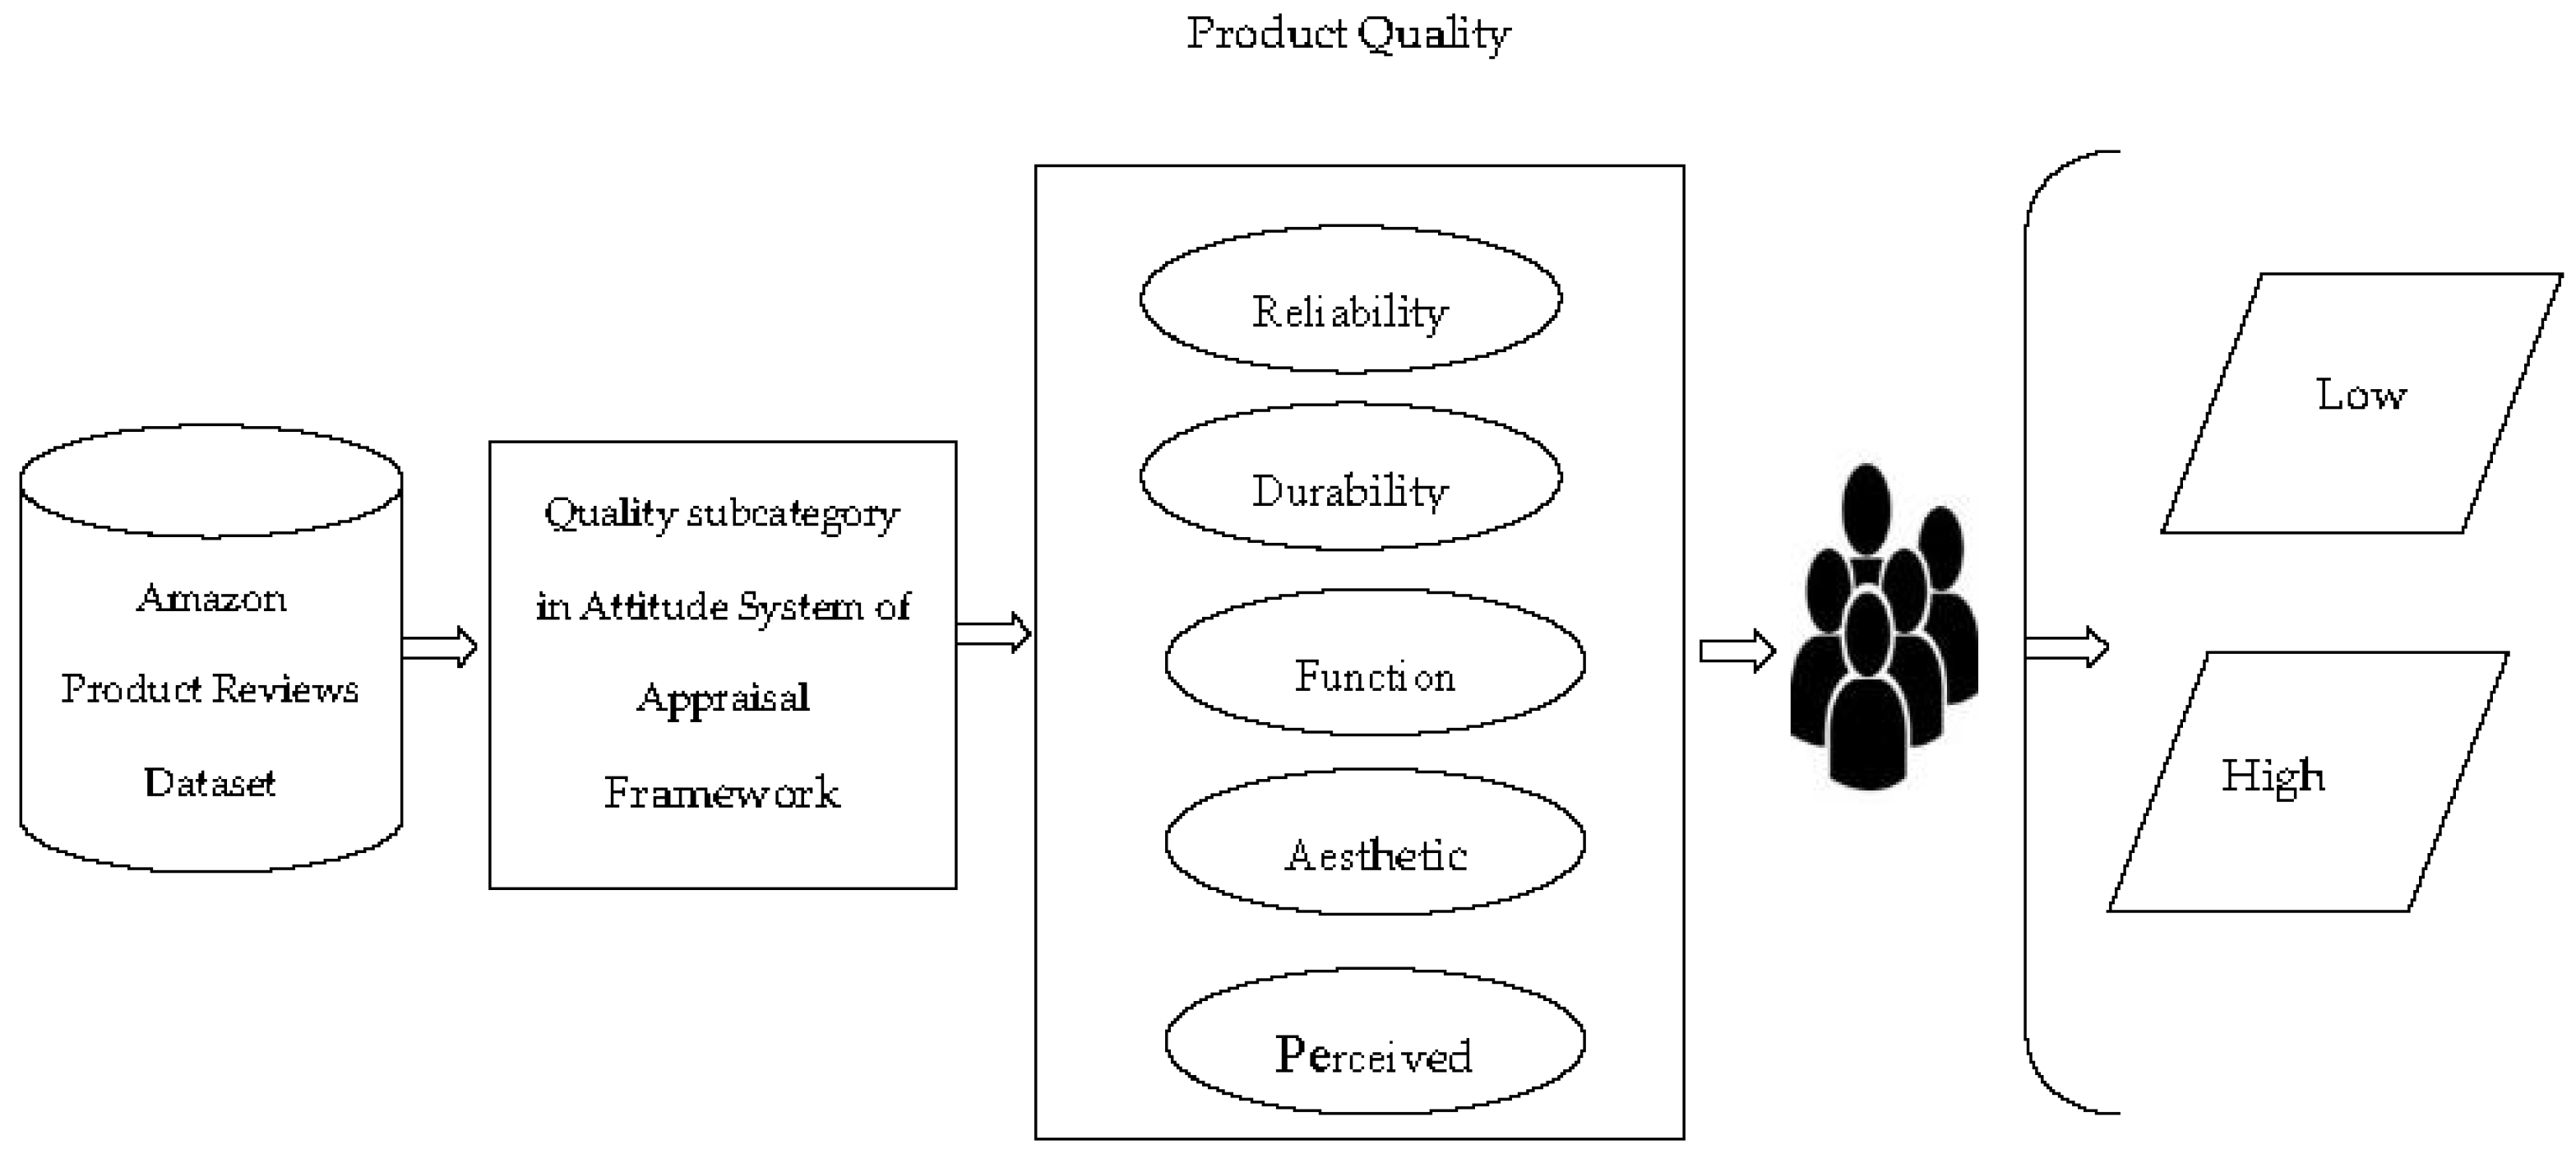
4.2. Lexicon-Based Customers’ Attitude Analysis to Predict Product’ Quality Using Appraisal Framework

According to the language perspective, the appraisal framework presents the emotional state of the author toward a given event and the level of participation through linguistic terms [].
Each word in the customer review is labeled as high quality and low quality based on the quality subcategory of the appraisal framework. We derived an overall quality of the product score by counting the numbers of high quality product-related words and low quality of product-related words, combining these values mathematically by using Equation (5):
QScore = High   quality   of   the   product   related   words Low   quality   of   the   product   related   words Total   number   of   words
The customers’ attitude toward product quality is that it is one of the low-quality products if the quality score is less than 0. Therefore, high quality is indicated by a score greater than 0. In the customer review, for example, “Software that came with MicroMP3 is awful”, the terms “awful” falls in the quality subcategory of the attitude system in the appraisal framework. The reviewers’ attitude is shown as negative toward the quality of the product, and the valence dictionary would label the same as low quality. Similarly, in a review sentence like “the picture quality of the camera is good in automatic mode”, the term “good” also belongs to the quality subcategory of the attitude system in an appraisal framework. It represents a positive attitude toward the picture quality of the camera and the valence dictionary would label it as high quality.
Product features—reliability, durability, function, aesthetics, and perception based on the quality subcategory of the attitude system in the appraisal framework—are extracted and the lexicon-based labeling is assigned to each feature, as given in Table 1. Figure 3 depicts customers’ attitudes toward product features and are classified as high or low quality using an appraisal framework.
Table 1. Details about the features of products as high quality and low quality.
Figure 3. Evaluation of Product Quality based on Appraisal Framework.

4.3. Experiment Setup

The reviews included in the dataset were preprocessed by doing tokenization, conversion of all the text of reviews into lower case for extraction of the same meaning for both upper and lower cases, and omission of punctuations and removal of stop words in the reviews. After preprocessing, the creation of a text vector through the BERT word embedding model and the design BiLSTM layers were done in Python language by using the Jupyter Notebook of Anaconda. The text vectors were divided into training and testing sets with a ratio of 80:20, respectively. The BiLSTM model was trained using 80% of the dataset, while 20% of the dataset was utilized to evaluate the model’s performance. Multiple sentences were included in each review; hence, the BERT embedding method used a pooled output.
The resultant vectors were then transmitted to the fully connected layer through the Relu function. In the end, the Softmax function was used to classify the product quality into low and high based on the attitude system of the appraisal framework.

4.4. Evaluation Metrics

The researcher classified sentences based on the appraisal theory to evaluate the quality of products. The combined dataset of Amazon product reviews is highly imbalanced, and high accuracy is predicted based on the majority class. [] used different metrics to assess the performance regarding model prediction, involving F1_micro, F1_macro, F1_weighted, accuracy, and confusion matrix. These metrics are regularly used to handle problems related to unbalanced data.
The F1_micro refers to computing the global average F1 score. The researcher computed the overall True Positive, False Positive, and False Negative and then fed it into the F1 equation to achieve a micro F1 score.
  F 1   micro = T r u e   P o s i t i v e T r u e   P o s i t i v e + 0.5 ( F a l s e   P o s i t i v e + F a l s e   N e g a t i v e )
The F1_weighted score is computed by taking into account each class’s support with a mean of F1 scores of each class. The formula to calculate the F1_weighted score is shown in Equation (7).
F1 weighted = F1label1 × W1 + F1label2 × W2 + F1label3 × W3……………………….F1labeln × Wn
The main theme of the precision is to minimize false positives, and the main focus of the recall is to minimize false negatives. The main goal of the imbalanced learning is to increase the recall score without hurting precision. F1-score combines the properties of recall and precision. F1_macro represents the arithmetic mean of per-class F1-scores. F1-macro is a commonly used metric for learning from imbalanced data and evaluating the performance of the classification model. The formula to compute the F1-macro score is shown as Equation (8).
F1-macro = Arithmetic Mean (F1-scores of n classes)

5. Results and Discussion

This section comprises the results of experiments. We test the proposed model on benchmark Amazon customers’ reviews datasets. In this research study, we employed the 100-dimensions Glove word embedding model which is pre-trained on the English Wikipedia Giga-word 5th Edition dataset and the 100-dimensions word2vec word embedding model which is pre-trained on Google news. We reduced 768 dimensions of the BERT model to 128 dimensions to reduce the storage requirement. In training, we employed tensor flow to implement and evaluate the model. Smaller numbers of reviews were used to validate our model. We first check the effect of the lexicon-based approach on the input data and vector as shown in Table 2.
Table 2. Description of Dataset Before and After using the Lexicon-based approach.
Table 2 shows that the lexicon-based method was applied to take out a portion of the input text, considerably reducing the size of the text as a whole and thereby decreasing the computational time for the model. We then carried out an experiment with BiLSTM to assess the performance of the QLeBERT model to predict the quality of a product.
The embedding shape and preprocessing for the BERT model are represented by the Keras layer. Due to the lack of computational resources, BERT small was employed to initialize the word embedding. The word embedding’s dimension was set to 128. The default settings for the baseline models, Glove and Word2Vec word embeddings with 100 dimensions each, were used. The Keras Layer is an input layer that comprises input vectors generated by word embedding models.
We first conducted an experiment to investigate the impact of the size of N-grams on the QLeBERT model using the BiLSTM model. The datasets about customers’ reviews of Amazon products were employed in the experiment. Table 3 displays the experimental outcomes for N = 1, 2, and all words.
Table 3. Performance measurement of QLeBERT- BiLSTM by using N-grams.
For N = 1, it shows that the lexicon-based approach selected only one word to predict the quality of a product based on the quality subcategory of the attitude system in the appraisal framework. Only one word cannot represent the entire customer’ review. Therefore, a poor result was achieved. N = 2 demonstrated the best outcome by arriving the F1-macro score of 0.91. We checked the performance of the model up to N = 4. In the case of the entire text of the review, the lexicon-based approach was not applied, hence this return back to the BERT model.
Table 4 demonstrates the performance results of the Glove word embedding approach with the BiLSTM model using N-grams. For N = 3, the Glove word embedding technique with the BiLSTM model achieved the best result, having an F1 macro score of 0.78 among different N-gram words with Glove word embedding and the BiLSTM model.
Table 4. Performance measurement of Glove-BiLSTM by using N-grams.
Table 5 depicts the performance measurement of Word2Vec model with the BiLSTM model using N-grams. For N = 2, the Word2Vec word embedding technique with the BiLSTM model achieved a better result, with an F1-macro score of 0.80 among different N-grams with the Word2Vec word embedding approach and the BiLSTM model.
Table 5. Performance measurement of Word2Vec-BiLSTM by using N-grams.

5.1. Performance Measurement of QLeBERT Model in Comparison to Different Models

An experiment was conducted on the Amazon Customers’ Reviews Dataset to validate the performance of QLeBERT with Bigram (N = 2) compared to other pre-trained word embedding models: Glove, Word2Vec, and BERT with theBiLSTM model. The experiment was carried out with and without a lexicon-based approach, as shown in Table 6.
Table 6. Comparative Analysis of QLeBERT with different models.
The proposed QLeBERT outclassed different models with and without a lexicon-based approach to predicting the quality of a product from the quality subcategory of the attitude system in the appraisal framework. F1-macro is an excellent performance assessment metric where classes are imbalanced.

5.2. Comparison of Proposed QLeBERT with Baseline Model

Finally, we compared our proposed QLeBERT model with the baseline model as reported by the authors in []. They used a sentiment lexicon and BERT via word N-grams to classify the sentiments using a convolutional network. In this research study, we used the lexicon approach based on the quality subcategory of the appraisal framework and BERT via word N-grams to classify the quality of the product using BiLSTM. The proposed QLeBERT, when tested on the Amazon product reviews dataset, achieved the highestF1-macro score of 0.91 as compared to the baseline approach to predicting the quality of a product from customers’ attitude using an appraisal framework.

6. Conclusions and Future Work

In this study, advance machine learning techniques are used to determine product quality from the customers’ attitude based on the quality subcategory of the attitude system in an appraisal framework. We proposed the QLeBERT model, comprising a lexicon-based approach, N-grams, BERT word embedding model, and BiLSTM. In the proposed model, a segment of a sentence where the quality of the product-related lexicon based on an appraisal framework using N-grams is selected and then the BERT word-embedding model was employed for vectorization. In the end, the BiLSTM classifier is used to classify the quality of the product as low or high. Glove, Word2vec, and BERT word-embedding models were considered as baseline models on a benchmark dataset of Amazon product reviews. As shown in the experiment results, QLeBERT had a high predictive F1-macro score of 0.91 as compared to baseline models. In future work, our QLeBERT model could be used with resource-poor languages, and evaluation of the model with other languages except for the English language will be a promising study.

Author Contributions

Conceptualization, A.U.; Methodology, A.U.; Software, A.U.; Validation, A.U.; Formal analysis, A.U.; Investigation, A.U. and S.U.; Resources, A.U. and A.K.; Data curation, A.U.; Writing—original draft, A.U.; Writing—review & editing, A.U.; Visualization, A.U.; Supervision, K.K. All authors have read and agreed to the published version of the manuscript.

Funding

This research study received no outside funding.

Data Availability Statement

Not Applicable.

Conflicts of Interest

The authors certify that they have no financial or other competing interests to disclose with regard to the current research.

References

  1. Hogg, M.V. Social Psychology, 4th ed.; Prentice Hall: London, UK, 2005; Chapter 5. [Google Scholar]
  2. Liu, B. Sentiment Analysis: Mining Opinions, Sentiments, and Emotions; Cambridge University Press: Cambridge, UK, 2020. [Google Scholar]
  3. Khoja, S.S.; Prajapati, A.M.; Khoja, S.S.; Panjwani, K.R.; Ray, J. A review on quality aspects, evolution of quality, dimension of quality and action plan for enhancing quality culture. Pharma Sci. Monit. 2017, 8, 335–352. [Google Scholar]
  4. Litvin, S.W.; Goldsmith, R.E.; Pan, B. Electronic word-of-mouth in hospitality and tourism management. Tour. Manag. 2008, 29, 458–468. [Google Scholar] [CrossRef]
  5. Yoo, K.-H.; Gretzel, U. Influence of personality on travel-related consumer-generated media creation. Comput. Hum. Behav. 2010, 27, 609–621. [Google Scholar] [CrossRef]
  6. von Helversen, B.; Abramczuk, K.; Kopeć, W.; Nielek, R. Influence of consumer reviews on online purchasing decisions in older and younger adults. Decis. Support Syst. 2018, 113, 1–10. [Google Scholar] [CrossRef]
  7. Zhao, S. Thumb Up or Down? A Text-Mining Approach of Understanding Consumers through Reviews. Decis. Sci. 2019, 52, 699–719. [Google Scholar] [CrossRef]
  8. Reichheld, F.F. The one number you need to grow. Harv. Bus. Rev. 2003, 81, 46–54. [Google Scholar]
  9. Socher, R.; Perelygin, A.; Wu, J.; Chuang, J.; Manning, C.D.; Ng, A.Y.; Potts, C. Recursive deep models for semantic composi-tionality over a sentiment treebank. In Proceedings of the 2013 Conference on Empirical Methods in Natural Language Processing, Seattle, WA, USA, 18–21 October 2013; pp. 1631–1642. [Google Scholar]
  10. Cambria, E.; Havasi, C.; Hussain, A. Senticnet 2: A semantic and affective resource for opinion mining and sentiment analysis. In Proceedings of the Twenty-Fifth International FLAIRS Conference, Marco Island, FL, USA, 16 May 2012. [Google Scholar]
  11. Senecal, S.; Nantel, J. The influence of online product recommendations on consumers’ online choices. J. Retail. 2004, 80, 159–169. [Google Scholar] [CrossRef]
  12. Jun Lee, S.; Siau, K. A review of data mining techniques. Ind. Manag. Data Syst. 2001, 101, 41–46. [Google Scholar] [CrossRef]
  13. Hoontrakul, P.; Sahadev, S. Application of data mining techniques in the on-line travel industry: A case study from Thailand. Mark. Intell. Plan. 2008, 26, 60–76. [Google Scholar] [CrossRef]
  14. Mishra, D.K.; Kumar, J.; Chaudhary, J.K.; Upadhyay, A.K.; Sharma, S. Role of Text Mining to Enhance the Quality of Product Using an Unsupervised Machine Learning Approach. ECS Trans. 2022, 107, 12553–12560. [Google Scholar] [CrossRef]
  15. Xu, H.; Wei, R.; Degroof, R.; Carberry, J. Evaluating Online Products Using Text Mining: A Reliable Evidence-Based Approach. Int. J. Semantic Comput. 2022, 16, 585–611. [Google Scholar] [CrossRef]
  16. Suresh, P.; Gurumoorthy, K. Mining of Customer Review Feedback Using Sentiment Analysis for Smart Phone Product. In International Conference on Computing, Communication, Electrical and Biomedical Systems; EAI Springer: Cham, Switzerland, 2022; pp. 247–259. [Google Scholar]
  17. Garvin, D.A. Managing Quality: The Strategic and Competitive Edge; Simon and Schuster: New York, NY, USA, 1988. [Google Scholar]
  18. Udeh, C.; Ifekanandu, C.; Idoko, E.; Ugwuanyi, C.; Okeke, C. Pay TV Product quality and customer satisfaction: An investigation. Int. J. Inf. Syst. Inform. 2022, 3, 25–35. [Google Scholar] [CrossRef]
  19. Mostafa, M.M. More than words: Social networks’ text mining for consumer brand sentiments. Expert Syst. Appl. 2013, 40, 4241–4251. [Google Scholar] [CrossRef]
  20. Lee, T.Y.; Bradlow, E.T. Automated Marketing Research Using Online Customer Reviews. J. Mark. Res. 2011, 48, 881–894. [Google Scholar] [CrossRef]
  21. Netzer, O.; Feldman, R.; Goldenberg, J.; Fresko, M. Mine Your Own Business: Market-Structure Surveillance Through Text Mining. Mark. Sci. 2012, 31, 521–543. [Google Scholar] [CrossRef]
  22. Ghose, A.; Ipeirotis, P.G.; Li, B. Designing Ranking Systems for Hotels on Travel Search Engines by Mining User-Generated and Crowdsourced Content. Mark. Sci. 2012, 31, 493–520. [Google Scholar] [CrossRef]
  23. Ghose, A.; Ipeirotis, P.G. Estimating the Helpfulness and Economic Impact of Product Reviews: Mining Text and Reviewer Characteristics. IEEE Trans. Knowl. Data Eng. 2010, 23, 1498–1512. [Google Scholar] [CrossRef]
  24. He, L.; Zhang, N.; Yin, L. Research on the evaluation of product quality perceived value based on text mining and fuzzy comprehensive evaluation. In Proceedings of the 2016 International Conference on Identification, Information and Knowledge in the Internet of Things (IIKI), Beijing, China, 20–21 October 2016; pp. 563–566. [Google Scholar]
  25. Güneş, S. Extracting Online Product Review Patterns and Causes: A New Aspect/Cause Based Heuristic for Designers. Des. J. 2020, 23, 375–393. [Google Scholar] [CrossRef]
  26. Rangu, C.; Chatterjee, S.; Valluru, S.R. Text mining approach for product quality enhancement:(improving product quality through machine learning). In Proceedings of the 2017 IEEE 7th International Advance Computing Conference (IACC), Hyderabad, India, 5–7 January 2017; pp. 456–460. [Google Scholar]
  27. Cruz, A.V. Relationship between Product Quality and Customer Satisfaction. Ph.D. Thesis, Walden University, Minneapolis, MN, USA, 2015. [Google Scholar]
  28. Martin, J.R.; White, P.R. The Language OF Evaluation; Springer: Berlin/Heidelberg, Germany, 2003; Volume 2. [Google Scholar]
  29. Liu, B. Sentiment analysis and opinion mining. Synth. Lect. Hum. Lang. Technol. 2012, 5, 1–167. [Google Scholar]
  30. Nasukawa, T.; Yi, J. Sentiment analysis: Capturing favorability using natural language processing. In Proceedings of the 2nd International Conference on Knowledge Capture, Beijing, China, 20–21 October 2016; pp. 70–77. [Google Scholar]
  31. Dave, K.; Lawrence, S.; Pennock, D.M. Mining the peanut gallery: Opinion extraction and semantic classification of product reviews. In Proceedings of the 12th International Conference on World Wide Web, Budapest, Hungary, 20 May 2003; pp. 519–528. [Google Scholar]
  32. Argamon, S.; Bloom, K.; Esuli, A.; Sebastiani, F. Automatically Determining Attitude Type and Force for Sentiment Analysis. In Proceedings of the Language and Technology Conference, Poznan, Poland, 5–7 October 2007; pp. 218–231. [Google Scholar]
  33. Whitelaw, C.; Garg, N.; Argamon, S. Using appraisal groups for sentiment analysis. In Proceedings of the 14th ACM International Conference on Information and Knowledge Management, Bremen, Germany, 5 October 2005; pp. 625–631. [Google Scholar]
  34. Lyu, K.; Kim, H. Sentiment Analysis Using Word Polarity of Social Media. Wirel. Pers. Commun. 2016, 89, 941–958. [Google Scholar] [CrossRef]
  35. Liu, Y.; Liu, B.; Shan, L.; Wang, X. Modelling context with neural networks for recommending idioms in essay writing. Neurocomputing 2018, 275, 2287–2293. [Google Scholar] [CrossRef]
  36. Baharudin, A.K.A.B. Sentiment classification using sentence-level semantic orientation of opinion terms from blogs. In Proceedings of the National Postgraduate Conference, Perak, Malaysia, 19–20 September 2011; pp. 1–7. [Google Scholar]
  37. Aisopos, F.; Papadakis, G.; Varvarigou, T.A. Sentiment analysis of social media content using N-Gram graphs. In Proceedings of the WSM’11, Scottsdale, AZ, USA, 30 November 2011. [Google Scholar]
  38. Jain, D.K.; Boyapati, P.; Venkatesh, J.; Prakash, M. An Intelligent Cognitive-Inspired Computing with Big Data Analytics Framework for Sentiment Analysis and Classification. Inf. Process. Manag. 2021, 59, 102758. [Google Scholar] [CrossRef]
  39. Araque, O.; Corcuera-Platas, I.; Sánchez-Rada, J.F.; Iglesias, C.A. Enhancing deep learning sentiment analysis with ensemble techniques in social applications. Expert Syst. Appl. 2017, 77, 236–246. [Google Scholar] [CrossRef]
  40. Mudinas, A.; Zhang, D.; Levene, M. Combining lexicon and learning based approaches for concept-level sentiment analysis. In Proceedings of the First International Workshop on Issues of Sentiment Discovery and Opinion Mining, Beijing, China, 12 August 2012; pp. 1–8. [Google Scholar]
  41. Rezaeinia, S.M.; Rahmani, R.; Ghodsi, A.; Veisi, H. Sentiment analysis based on improved pre-trained word embeddings. Expert Syst. Appl. 2018, 117, 139–147. [Google Scholar] [CrossRef]
  42. Mikolov, T.; Sutskever, I.; Chen, K.; Corrado, G.S.; Dean, J. Distributed representations of words and phrases and their com-positionality. Adv. Neural Inf. Process. Syst. 2013, 26, 3136. [Google Scholar]
  43. Mikolov, T.; Chen, K.; Corrado, G.; Dean, J. Efficient estimation of word representations in vector space. arXiv 2013, arXiv:1301.3781. [Google Scholar]
  44. Pennington, J.; Socher, R.; Manning, C.D. Glove: Global vectors for word representation. In Proceedings of the 2014 Conference on Empirical Methods in Natural Language Processing (EMNLP), Doha, Qatar, 25–29 October 2014; pp. 1532–1543. [Google Scholar]
  45. Bojanowski, P.; Grave, E.; Joulin, A.; Mikolov, T. Enriching word vectors with subword information. Trans. Sociation Comput. Linguist. 2017, 5, 135–146. [Google Scholar] [CrossRef]
  46. Devlin, J.; Chang, M.-W.; Lee, K.; Toutanova, K. Bert: Pre-training of deep bidirectional transformers for language under-standing. arXiv 2018, arXiv:1810.04805. [Google Scholar]
  47. Prottasha, N.J.; Sami, A.A.; Kowsher, M.; Murad, S.A.; Bairagi, A.K.; Masud, M.; Baz, M. Transfer Learning for Sentiment Analysis Using BERT Based Supervised Fine-Tuning. Sensors 2022, 22, 4157. [Google Scholar] [CrossRef]
  48. Jain, P.K.; Quamer, W.; Saravanan, V.; Pamula, R. Employing BERT-DCNN with sentic knowledge base for social media sentiment analysis. J. Ambient. Intell. Humaniz. Comput. 2022, 1–13. [Google Scholar] [CrossRef]
  49. Mutinda, J.; Mwangi, W.; Okeyo, G. Lexicon-pointed hybrid N-gram Features Extraction Model (LeNFEM) for sentence level sentiment analysis. Eng. Rep. 2021, 3, e12374. [Google Scholar] [CrossRef]
  50. Garg, S.B.; Subrahmanyam, V. Sentiment analysis: Choosing the right word embedding for deep learning model. In Advanced Computing and Intelligent Technologies: Proceedings of ICACIT 2021; Springer: Berlin/Heidelberg, Germany, 2021; pp. 417–428. [Google Scholar]
  51. Giatsoglou, M.; Vozalis, M.G.; Diamantaras, K.; Vakali, A.; Sarigiannidis, G.; Chatzisavvas, K.C. Sentiment analysis leveraging emotions and word embeddings. Expert Syst. Appl. 2016, 69, 214–224. [Google Scholar] [CrossRef]
  52. Chen, Y. Convolutional Neural Network for Sentence Classification; University of Waterloo: Waterloo, NSW, Canada, 2015. [Google Scholar]
  53. Wang, Y.; Huang, M.; Zhu, X.; Zhao, L. Attention-based LSTM for aspect-level sentiment classification. In Proceedings of the 2016 Conference on Empirical Methods in Natural Language Processing, Austin, TX, USA, 1 November 2016; pp. 606–615. [Google Scholar]
  54. Liu, J.; Zheng, S.; Xu, G.; Lin, M. Cross-domain sentiment aware word embeddings for review sentiment analysis. Int. J. Mach. Learn. Cybern. 2020, 12, 343–354. [Google Scholar] [CrossRef]
  55. D’Silva, J.; Sharma, U. Automatic text summarization of konkani texts using pre-trained word embeddings and deep learning. Int. J. Electr. Comput. Eng. IJECE 2022, 12, 1990–2000. [Google Scholar] [CrossRef]
  56. Mutinda, J.; Mwangi, W.; Okeyo, G. Sentiment Analysis of Text Reviews Using Lexicon- Enhanced Bert Embedding (LeBERT) Model with Convolutional Neural Network. Appl. Sci. 2023, 13, 1445. [Google Scholar] [CrossRef]
  57. Rathi, M.; Malik, A.; Varshney, D.; Sharma, R.; Mendiratta, S. Sentiment analysis of tweets using machine learning approach. In Proceedings of the 2018 Eleventh International Conference on Contemporary Computing (IC3), Noida, India, 2–4 August 2018; pp. 1–3. [Google Scholar]
  58. Yang, H. Network Public Opinion Risk Prediction and Judgment Based on Deep Learning: A Model of Text Sentiment Analysis. Comput. Intell. Neurosci. 2022, 2022, 1–9. [Google Scholar] [CrossRef] [PubMed]
  59. Xu, G.; Meng, Y.; Qiu, X.; Yu, Z.; Wu, X. Sentiment Analysis of Comment Texts Based on BiLSTM. IEEE Access 2019, 7, 51522–51532. [Google Scholar] [CrossRef]
  60. Li, X.; Lei, Y.; Ji, S. BERT-and BiLSTM-Based Sentiment Analysis of Online Chinese Buzzwords. Future Internet 2022, 14, 332. [Google Scholar] [CrossRef]
  61. Chen, E.; Lin, Y.; Xiong, H.; Luo, Q.; Ma, H. Exploiting probabilistic topic models to improve text categorization under class imbalance. Inf. Process. Manag. 2011, 47, 202–214. [Google Scholar] [CrossRef]
  62. Liu, Y.; Yu, X.; Huang, J.X.; An, A. Combining integrated sampling with SVM ensembles for learning from imbalanced datasets. Inf. Process. Manag. 2011, 47, 617–631. [Google Scholar] [CrossRef]
  63. Vinodhini, G.; Chandrasekaran, R. A sampling based sentiment mining approach for e-commerce applications. Inf. Process. Manag. 2017, 53, 223–236. [Google Scholar] [CrossRef]
  64. Laza, R.; Pavón, R.; Reboiro-Jato, M.; Fdez-Riverola, F. Evaluating the effect of unbalanced data in biomedical document classification. J. Integr. Bioinform. 2011, 8, 105–117. [Google Scholar] [CrossRef]
  65. Lin, T.-Y.; Goyal, P.; Girshick, R.; He, K.; Dollár, P. Focal loss for dense object detection. In Proceedings of the IEEE International Conference on Computer Vision, Venice, Italy, 22–29 October 2017; pp. 2980–2988. [Google Scholar]
  66. Consumer Reviews of Amazon Products. Available online: https://www.kaggle.com/datasets/datafiniti/consumer-reviews-of-amazon-products (accessed on 20 September 2019).
  67. Rahmath, P.H.; Ahmad, T. Fuzzy based Sentiment Analysis of Online Product Reviews using Machine Learning Techniques. Int. J. Comput. Appl. 2014, 99, 9–16. [Google Scholar] [CrossRef]
  68. Dragos, V.; Battistelli, D.; Kelodjoue, E. Beyond sentiments and opinions: Exploring social media with appraisal categories. In Proceedings of the 2018 21st International Conference on Information Fusion (FUSION), Cambridge, UK, 10–13 July 2018; pp. 1851–1858. [Google Scholar]
  69. Guo, H.; Li, Y.; Shang, J.; Gu, M.; Huang, Y.; Gong, B. Learning from class-imbalanced data: Review of methods and applications. Expert Syst. Appl. 2017, 73, 220–239. [Google Scholar] [CrossRef]
Disclaimer/Publisher’s Note: The statements, opinions and data contained in all publications are solely those of the individual author(s) and contributor(s) and not of MDPI and/or the editor(s). MDPI and/or the editor(s) disclaim responsibility for any injury to people or property resulting from any ideas, methods, instructions or products referred to in the content.

Article Metrics

Citations

Article Access Statistics

Multiple requests from the same IP address are counted as one view.