1. Introduction
Monkeypox (MPX) is a zoonotic infection caused by the monkeypox virus. While smallpox-like signs and symptoms characterize it, it is less contagious than smallpox [
1]. The virus, an enveloped double-stranded DNA, is a part of the Orthopoxvirus genus of the Poxviridae family, including the Variola (smallpox) virus and Vaccinia virus (smallpox vaccine) [
2]. Initially discovered in 1958 in monkeys, the disease spread across different regions of Africa and the USA. Recently, in May 2022, several cases of the monkeypox virus were reported by as many as twelve non-endemic countries, some of which were Australia, Belgium, Spain, Portugal, the United Kingdom, and the USA. The maximum number of cases was reported in Spain, Portugal, and the UK. Recent studies show that Austria, Israel, Switzerland, Taiwan, and India also have monkeypox cases.
The case fatality ratio of monkeypox is significantly lower than smallpox, and the incubation period can last up to three weeks. The major symptoms are headache, fever, muscle aches, respiratory symptoms, chills, etc. The infection spreads through contact, body fluids (saliva, secretions, droplets), and contaminated objects [
3]. While there are limited studies to understand the epidemiology, transmission, sources, and patterns, the re-emerging nature of the disease demands more information for implementing strategies to prevent and cure the zoonotic disease. While researchers and practitioners worldwide are investigating the disease, the source of the ongoing outbreak information on the natural animal reservoir for monkeypox is yet to be confirmed. Clinical studies show that the disease may spread through human-to-human and or animal-to-human transmission of MPV [
4]. There is active research on epidemiological investigations, genome sequencing, and travel links between countries [
5].
As the disease has spread to more than seventy countries, the World Health Organization (WHO) declared monkeypox a global emergency, demanding a coordinated response due to the limited supply of vaccines. Smallpox vaccines have been observed to be effective against monkeypox if administered promptly. With the infection spreading rapidly and the limited supply of vaccines, it is imperative to analyze the burden and impact of the disease on the population, epidemiology, trend, patterns, etc. The 2019 novel coronavirus was declared a global emergency days after it was first identified and claimed millions of lives worldwide [
6]. A combination of treatments and lockdown restrictions across the globe contained the spread and saved many lives. As experts warn that monkeypox may potentially become a pandemic in the future, it is necessary to take timely action to monitor the spread and analyze the trends [
7].
While previous studies have highlighted the causes, comparisons, potential treatments, etc., for monkeypox, there is still a need to perform an extensive analysis of the spread. The analysis could perform epidemiological investigations, genome sequencing, and phylogenetic analysis. It may assist in understanding the transmission patterns and essentially guide policymakers to define effective policies and strategies to curb the spread further.
In this study, we analyze the spread and pattern of monkeypox using machine learning algorithms. Traditional machine learning methods, such as linear regression, decision trees, random forests, elastic net regression, and neural networks, such as artificial neural networks and convolutional neural networks, have been used to perform the analysis. We have relied on statistical parameters, such as mean absolute error, mean squared error, mean absolute percentage error, and R-squared error, to evaluate these models’ performance. To understand the trends and systematic patterns over time, we have performed a time series analysis using autoregressive integrated moving average (ARIMA) and seasonal auto-regressive integrated moving average (SARIMA).
We performed an extensive data visualization to infer patterns and trends and make observations. To the best of our knowledge, this is the first article to have explored monkeypox using a two-fold approach. The novelty and main contributions are as follows:
We combined the traditional machine learning methods and deep learning techniques to explore the spread of monkeypox;
We performed a time series analysis for the monkeypox using the ARIMA and SARIMA models.
The rest of the article is arranged as follows.
Section 2 highlights materials and methods in which we focus on the related works and the overall methodology of the study.
Section 3 describes the experimental analysis concerning the datasets used and the evaluation parameters.
Section 4 includes results depicting observations, comparative analysis, and discussions. Finally,
Section 5 highlights the overall conclusion of the study.
2. Related Works
This section presents the related works and methodology. In the Related Works Section, we include some recent works that focus on the analysis and spread of monkeypox, followed by the Methodology Section, where we present the overall methodology of the study and the techniques involved in the analysis.
Sharma et al. [
8] presented a study on how the monkeypox outbreak is the new zoonotic alert after the COVID-19 pandemic. The study presents an analysis of the cumulative confirmed cases of monkeypox across the world as of July 2022. The total number of cases is more than fifteen thousand, with an increase of 383.94% within a month. The United States of America (USA), parts of South America, and Europe seem to be most affected by the spread of the disease. The study also asserts that Tecovirimat-based treatment may be administered orally and intravenously.
Lai et al. [
9] highlighted how monkeypox is an emerging global threat while the world is battling COVID-19. July 2022 witnessed nearly ten thousand laboratory-confirmed cases, mainly from non-endemic countries. The primary transmission mode was observed to be human-to-human, and the symptoms could persist for up to four weeks. The study asserts that nucleic acid amplification testing via the polymerase chain reaction method can be used to diagnose the disease along with antiviral therapy for the treatment. It is necessary to detect the spread and perform contact tracing to prevent it.
Another interesting study was performed on the monkeypox outbreak [
10] due to mutations in the virus. Following multiple reports, the cases were linked to international travel and animal imports. The study asserts that the virus has two clads phylogenetically, one that emerged from West Africa and the other from the Congo Basin of Central Africa. Moreover, rodents are suspected as intermediate hosts. Antivirals have been observed to slow monkeypox spread, and Imvanex may be used to prevent infection. As the number of cases rises worldwide, monkeypox may become an international threat.
Bhattacharya et al. [
11] presented a study on the transmission and spread of the monkeypox virus during COVID-19. A global public health threat, monkeypox, has been linked to air travel as the cases increase internationally. The study depicts statistical models of confirmed cases concerning the number of air travelers per year to establish how air travel is directly linked to the spread of the disease. The results show the possibility of an indirect association with air travel, thereby demanding strong evidence; this report aims to assist clinical researchers in analyzing the epidemiology and transmission patterns of the disease.
Minhaj et al. [
12] conducted an extensive study to analyze the spread of monkeypox across multiple states in the United States. Based on the investigations, several observations were recorded. The infected people were identified as gay or bisexual in the United Kingdom. In Massachusetts, a patient was administered the orthopoxvirus vaccine to prevent and control the disease. In New York, after a patient was diagnosed with monkeypox disease, the NYC Department of Health and Mental Hygiene (NYC DOHMH) analyzed the contacts, exposure risks, etc. Nine other states in the US reported seventeen patients with infection, out of which fourteen patients were found to have traveled internationally.
Alshahrani et al. [
13] performed a web-based study on the monkeypox viral infection in the general population in Saudi Arabia. The study was conducted as a survey regarding participants’ knowledge of monkeypox on a given scale. The knowledge level was compared using Pearson’s chi-square test, and it was observed that 48% of the participants had high knowledge about the disease. People obtained information about the disease through social media (75%), television and radio (45.6%), family or friends (15.6%), and healthcare providers (13.8%). The overall knowledge about the disease was not high in Saudi Arabia, making public education imperative for promoting awareness.
Yang et al. [
14] reported and analyzed the first case of monkeypox detected in Taiwan. The study used global epidemiological data from the World Health Organization (WHO), US Centers for Disease Control and Prevention, and Taiwan’s Centers for Disease Control. The report incorporates phylogenic tree analysis and sequence alignment to identify single nucleotide polymorphism (SNP) characterization. Phylogenic analysis asserted that the virus belonged to the West African clade and has been clustered with isolates from the European outbreak. Based on the sequence analysis, it is observed that the virus has 51 SNPs and multiple variants.
Vouga et al. [
15] presented yet another interesting study concerning the monkeypox risk in children and pregnant women. Due to the sustained transmission of the virus, the laboratory-confirmed infections are more than twice the number of cases reported two weeks earlier. The actual number of cases may be even more considering the incubation period and clinical strategies. The re-emergence of the virus suggests improved viral adaptation, and the outbreak may become uncontrolled with increasing travel and social gatherings. Epidemiological data suggest that the secondary attack rate could be more than ten percent in smallpox unvaccinated populations. The study asserts that complications may be significantly higher in children, although the effect of monkeypox could be scarce in pregnant women.
In their research, Gong et al. [
16] emphasized that monkeypox is a re-emergent threat to humans, as there is no specific drug to combat it. While the virus was first identified in the 1970s, it has recently surfaced outside Africa and has been identified in the UK, USA, Singapore, etc., in 2022. The smallpox vaccine provides almost 85% protection against the disease, and few anti-smallpox drugs have been approved to treat monkeypox. The study extensively reviews diagnosis, pathogenicity, epidemiology, biological features, and prevention and treatment strategies for the monkeypox virus. Diagnosis is usually performed using nuclein acid tests, serological testing, and electron microscope observation, while pathogenicity mainly discusses modes of transmission and clinical features.
Altindis et al. [
17] recommended a longitudinal clinical course on monkeypox and viral dynamics to analyze antiviral therapies. The study was conducted on seven patients, and the findings were reported as case reviews. The patients were managed in high-consequence infectious disease (HCID) centers coordinated through a network. The virus transmission for these patients was nosocomial and through household contact, and the features were viremia, virus detection in the upper respiratory tract, deep tissue abscess, etc. The patients were isolated and treated with Brincidofovir, which led to elevated liver enzymes, before terminating the dosage. Tecevirimat administration showed no adverse effects.
Dashraath et al. [
18] presented some guidelines on monkeypox exposure for pregnant individuals using a clinical management algorithm. The algorithm maintains a high index of suspicion for cases with lymphadenopathy and vesiculopustular rash and diagnosis using nucleic acid amplification testing and PCR (polymerase chain reaction). Fetal ultrasound monitoring and assessment of viral load in the umbilical cord are a few other guidelines highlighted in the study.
Quarleri et al. [
19] presented a study on the containment of the monkeypox virus in non-endemic countries. The study asserts that the virus can be diagnosed using molecular techniques and tackled with approved drugs. The study also discusses the transmission routes, the change in reproduction number, and clinical characteristics associated with the spread.
Gruber [
20] performed a study on the status of the monkeypox virus and asserted that there is a shortage concerning anticipated needs, and manufacturing the vaccines may be time-consuming. Hence, dose-sparing approaches may be considered, along with the emergency use of certain other vaccines. Along the same lines, Kriss et al. [
21] presented a study on the receipt of the JYENNOS vaccine for the prevention of monkeypox. The study was performed across forty-nine states in the United States, and the doses were administered between May 2022 and October 2022. The study asserts that most vaccine recipients are males between twenty-five and forty-nine years old.
McCarthy [
22] suggested therapeutic methods for addressing the monkeypox spread as there are no specific treatments. The potential treatments include tecovirimat and brincidofovir, which are provided to the patient in multiple phases. Tarin-Vicente et al. [
23] performed a cohort study in Spain by enrolling patients from 11 May 2022. The study included PCR tests along with case reports from interviews. The study considered risk factors, signs, symptoms, virological results, travel, mass gatherings, etc. The study asserted that most patients were bisexual, with a median age of thirty-seven. Likewise, Mailhe et al. [
24] performed another cohort study on 21 May 2022, 5 July 2022, with 264 patients, of whom 262 were men. Fever, adenopathy, and skin lesions were the most common symptoms.
There have been several studies analyzing the outbreak of monkeypox in various countries. While Català et al. [
25] presented a study on the outbreak of the epidemic in Spain, Miura et al. [
26] performed a similar study for the Netherlands. The analysis focuses on cross-sectional studies in medical facilities. In Spain, 185 patients were considered for the study, out of which four were hospitalized. In the Netherlands, 31 cases were confirmed by PCR within the age range of 23–64.
Harapan et al. [
27] presented a comprehensive review of the monkeypox outbreak, while Poland et al. [
28] presented a review of vaccine prevention. The comprehensive review highlighted worldwide confirmed cases, virology and genomic classification, Pathophysiology, Immune Evasion, and some laboratory findings. Vaccine prevention studies incorporate concerns and hypotheses and non-human primate studies.
Kmiec and Kirchhoff [
29] analyzed how monkeypox could be a new epidemic threat. The study highlights monkeypox outbreak history, virus classification, morphology, transmission and replication cycle, mutation and adaption, clinical features, and treatment. Wang et al. [
30] studied the molecular evolution of monkeypox using phylogenetic analysis. The study incorporated various strains, mutations, and proteins, asserting that ten virus proteins are prone to mutation.
Shafaati and Zandi [
31] performed a study describing the clinical and neurological complications associated with monkeypox infection and the diagnosis. The neurological symptoms following monkeypox infection are anorexia, fever, weakness, adenopathy, and headache. Although the smallpox vaccine has been suggested for monkeypox infection, side effects may include eczema vaccinatum and progressive vaccinia. De Baetselier et al. [
32] performed a study to assess if monkeypox infection occurred in men attending a sexual health clinic in Belgium. The study was performed on 224 samples using PCR, showing that certain cases may remain undiagnosed.
Farahat et al. [
33] presented an overall study on the outbreak of the monkeypox virus. The study highlights information on the worldwide confirmed cases, incubation period, treatment, transmission rate, severity, and how the outbreak compares to coronavirus [
34]. Likewise, Lum et al. [
35] presented a study on the clinical, epidemiological, and immunological features of the monkeypox infection. This study also highlights the genetic changes in the virus along with pathogenesis and immunity.
Manjurul et al. [
36] suggested a transfer learning approach to detect monkeypox, using deep learning models such as VGG-16, ResNet50, ResNet101, VGG-19, etc. The study depicts that modified InceptionResNetV2 and MobileNetV2 outperform other models by achieving accuracy between 93% and 99%.
Recent studies show that monkeypox is a fast-spreading disease and can be transmitted easily through human contact and fluids. While most of the research works conducted in the past focus on clinical trials, it is necessary to understand the pattern of spread to take appropriate preventive measures across the globe. Trends and patterns may suggest a bigger outbreak in the future for which an adequate amount of vaccines and preventive measures need to be in place. Hence, we performed an analysis of the outbreak using machine learning techniques. Our research is backed by multiple machine learning models and a time series analysis of the monkeypox outbreak events in time.
3. Methodology
The overall methodology is divided into two sections. We analyze the first section using traditional machine learning and deep learning models. In the second section, we perform a time series analysis of the monkeypox data using two different models.
3.1. Analysis Using Machine Learning Models
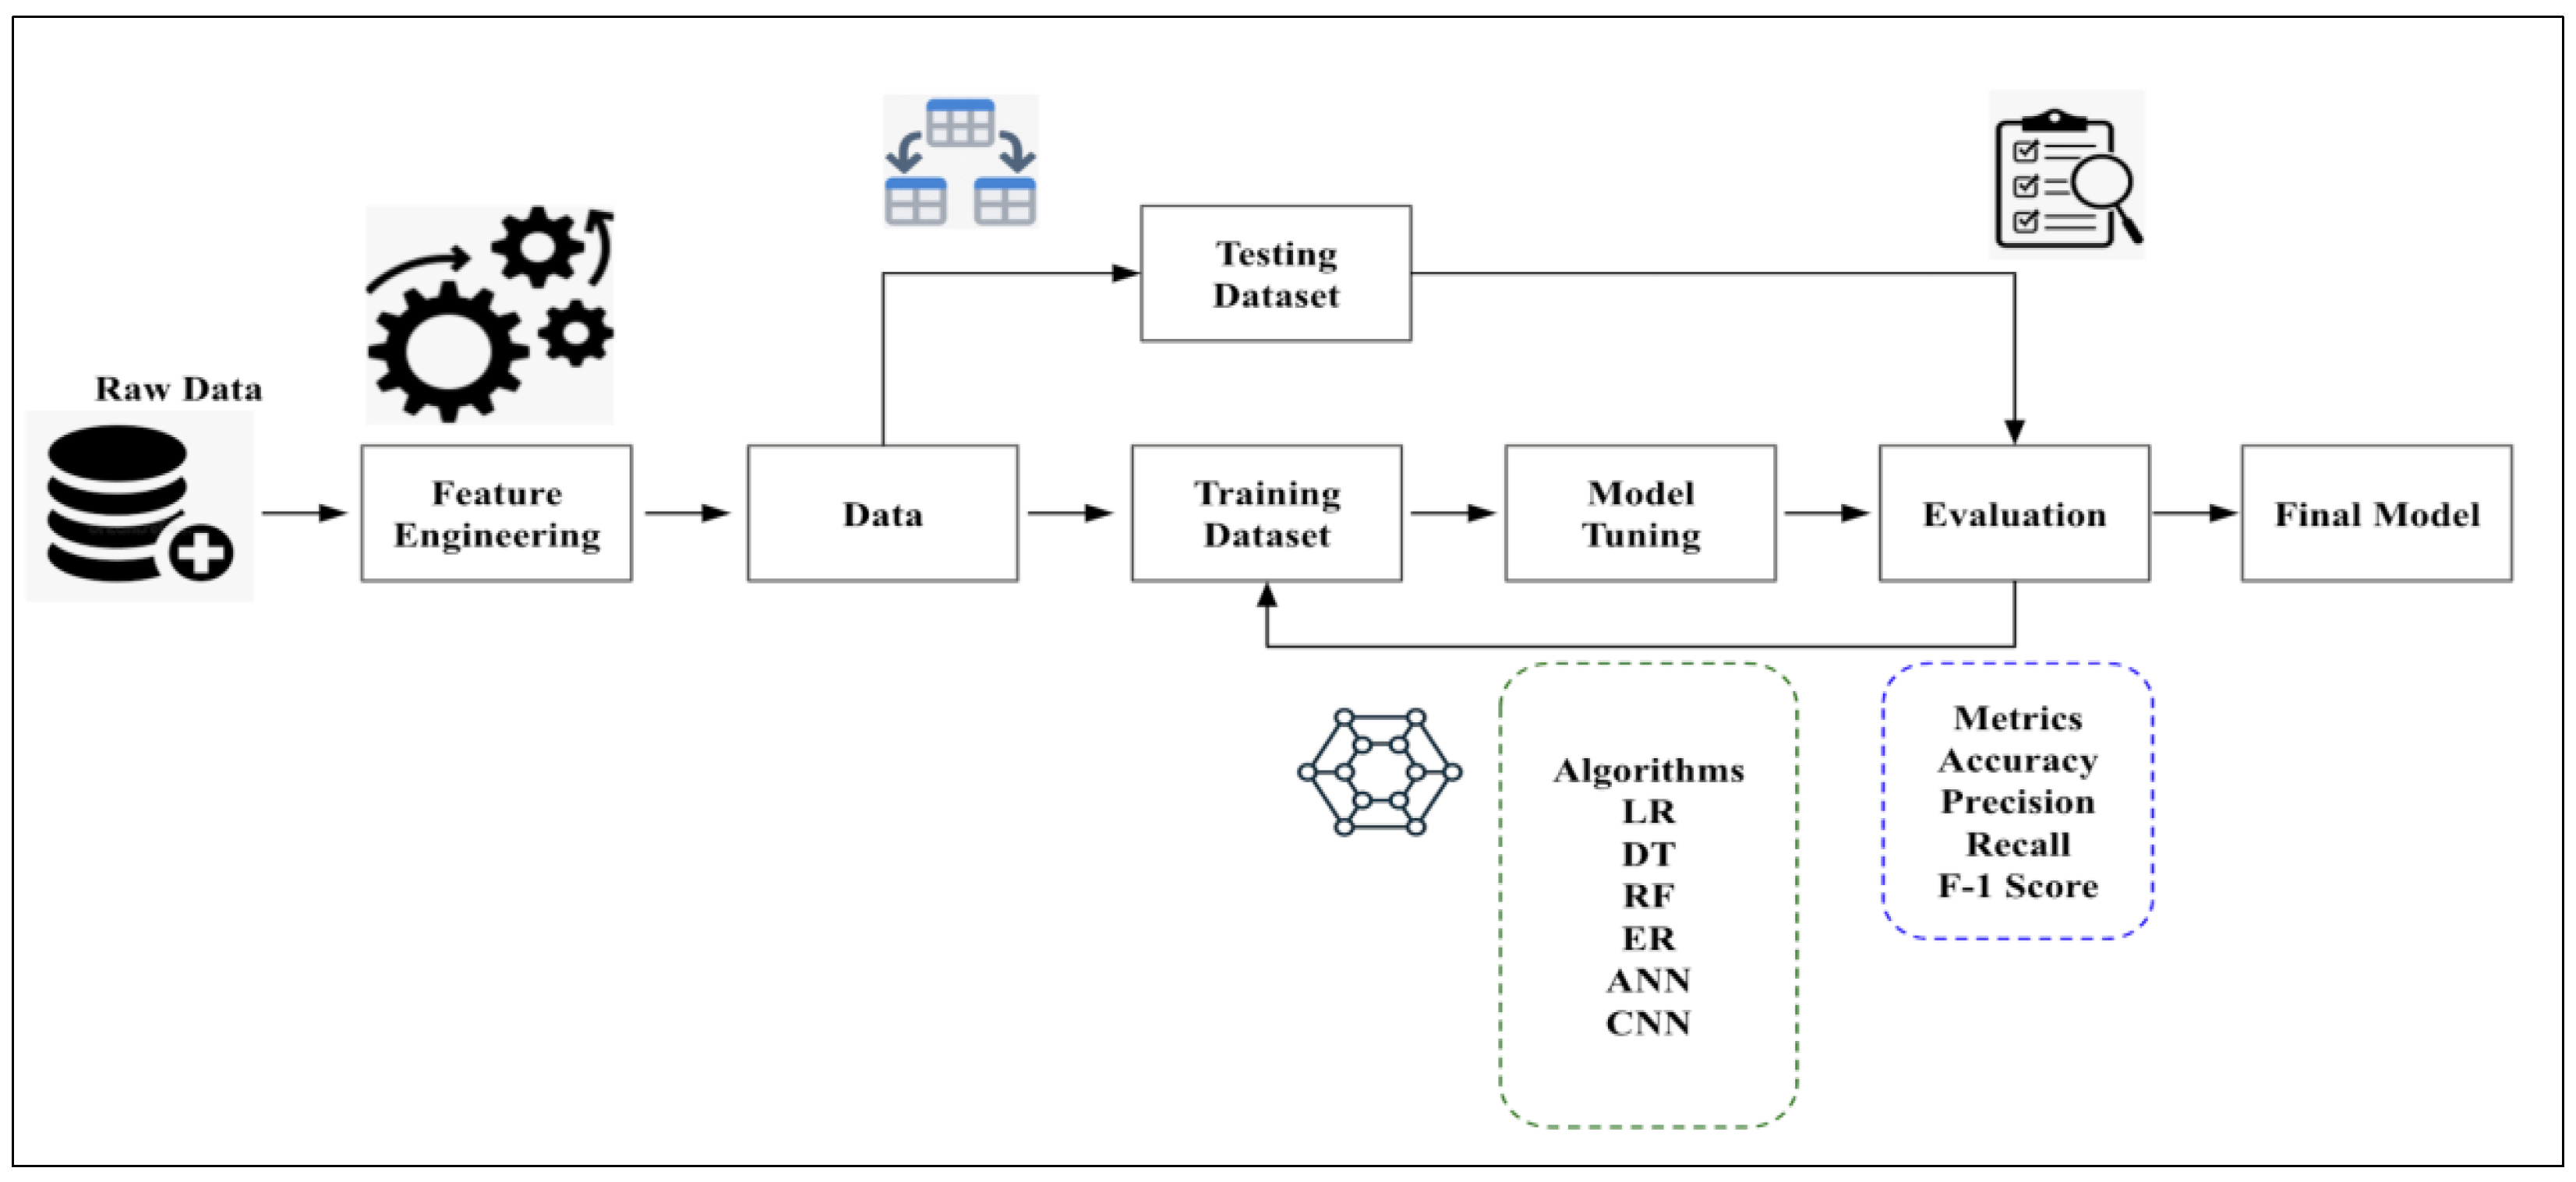
Machine learning is heavily used in epidemiology to identify trends and patterns associated with the spread of infection. We conducted this study over a defined population to find established patterns of infection in specific groups to suggest potential solutions that would be appropriate concerning the outbreak. We processed and analyzed data from a sample population and observed how certain factors (features) affect the outcome of the operations. We start with the process of data collection (
Figure 1).
As data quality determines the model’s accuracy, it is necessary to ensure that the data are reliable, as irrelevant and incorrect data may lead to misclassifications. Once the data are collected, the next step is to preprocess them, which includes randomizing them and cleaning them to remove unwanted values or handle missing and duplicate data. It is advised to visualize the data, which aids in understanding the overall structure and relationships between variables and classes. Once the visualization is performed, the data are split into training and test sets. Here, we split the data into 80% training and 20% test data. The training set is set for the model to learn, while the test set checks the model’s performance. Once the data have been split, the next step is to choose appropriate machine learning models to run the algorithm on the processed data. In this study, we have used a combination of traditional machine learning algorithms and deep learning algorithms:
The traditional machine learning algorithms considered for the study are linear regression (LR), decision trees (DT), random forests (RF), and elastic net regression (EN).
The deep learning algorithms used in the study are convolutional neural networks (CNN) and artificial neural networks (ANN).
The aim is to deduce which model among these makes the best prediction of the monkeypox outbreak. The training step results in model learning and is used to find patterns and make predictions. Once training is complete, the model is evaluated on the test set, which includes unseen data. The model performance is evaluated using several statistical parameters. We can compare the model most suited for the analysis based on the results. As parameters influence machine learning models, the goal is to provide an optimum value to the parameter so that the model’s performance increases. We perform hyperparameter-tuning to tune the hyperparameters to minimize the loss function. The process is automated and is used to achieve the maximum possible accuracy of the algorithm. While several methods can be used to tune parameters, in this study, we rely on the grid search technique, which builds a model for every combination of hyperparameters specified and evaluates each model. The hyperparameter-tuning process has been applied to the deep learning algorithms used in the study, i.e., ANN and CNN. We have considered the hyperparameters for tuning to be neurons, activation function, optimizer, learning rate, batch size, and epochs for both algorithms.
The grid search process involves obtaining output from the final pooling layer, flattened and fed into the fully connected layer, thereby becoming input to the fully connected layer, and applying grid search to the overall procedure. The output generated was used to deduce which model predicts the outbreak most accurately. Hyperparameter-tuning, or optimization, includes finding a set of optimal hyperparameters initially set before the model training. The most common methods are grid search and ransom search techniques. In the grid search technique, all combinations use a preset list of hyperparameters values. The best combination is chosen depending on the cross-validation score. On the other hand, in the random search technique, the model is trained based on random combinations such that the number of parameters can be controlled and tuned. This can lead to a wide range of values due to fast combination; however, it may not guarantee the best combination of parameters. On the contrary, grid search may take a significant amount of time but will exhibit the best combination of parameters. The
Table 1 shows the hyperparameters employed in the study.
The following hyperparameters have been used in the analysis:
The batch size represents the number of samples used in tuning before the parameters are updated;
The number of epochs estimates how frequently the algorithm works on the data. One epoch includes each sample in the training dataset, updating the internal model parameters. There may be multiple batches in an epoch, which determines the time taken by the training dataset for training the neural network. Multiple epochs lead to frequent updates in the weight during the training process. While fewer epochs may lead to underfitting, an excessive number of epochs may lead to overfitting;
The optimization algorithm is used to bridge the gap between updating model parameters and loss functions, which may be caused due to overall poor performance of the model. Root mean square propagation (RMSprop), stochastic gradient descent (SGD), Adam, Adamax, etc., are optimizers used during the hyperparameter-tuning process;
Dropout is responsible for selectively choosing neurons that can be dropped during the training process. When neurons are dropped, the corresponding weights are not applied,
Neurons in a hidden layer represent the number of neurons in a layer. Inputs are fed from the initial layers to the next layers, and the final layer presents the output. The overall network performance depends on the number of neurons in a layer.
3.2. Time Series Analysis
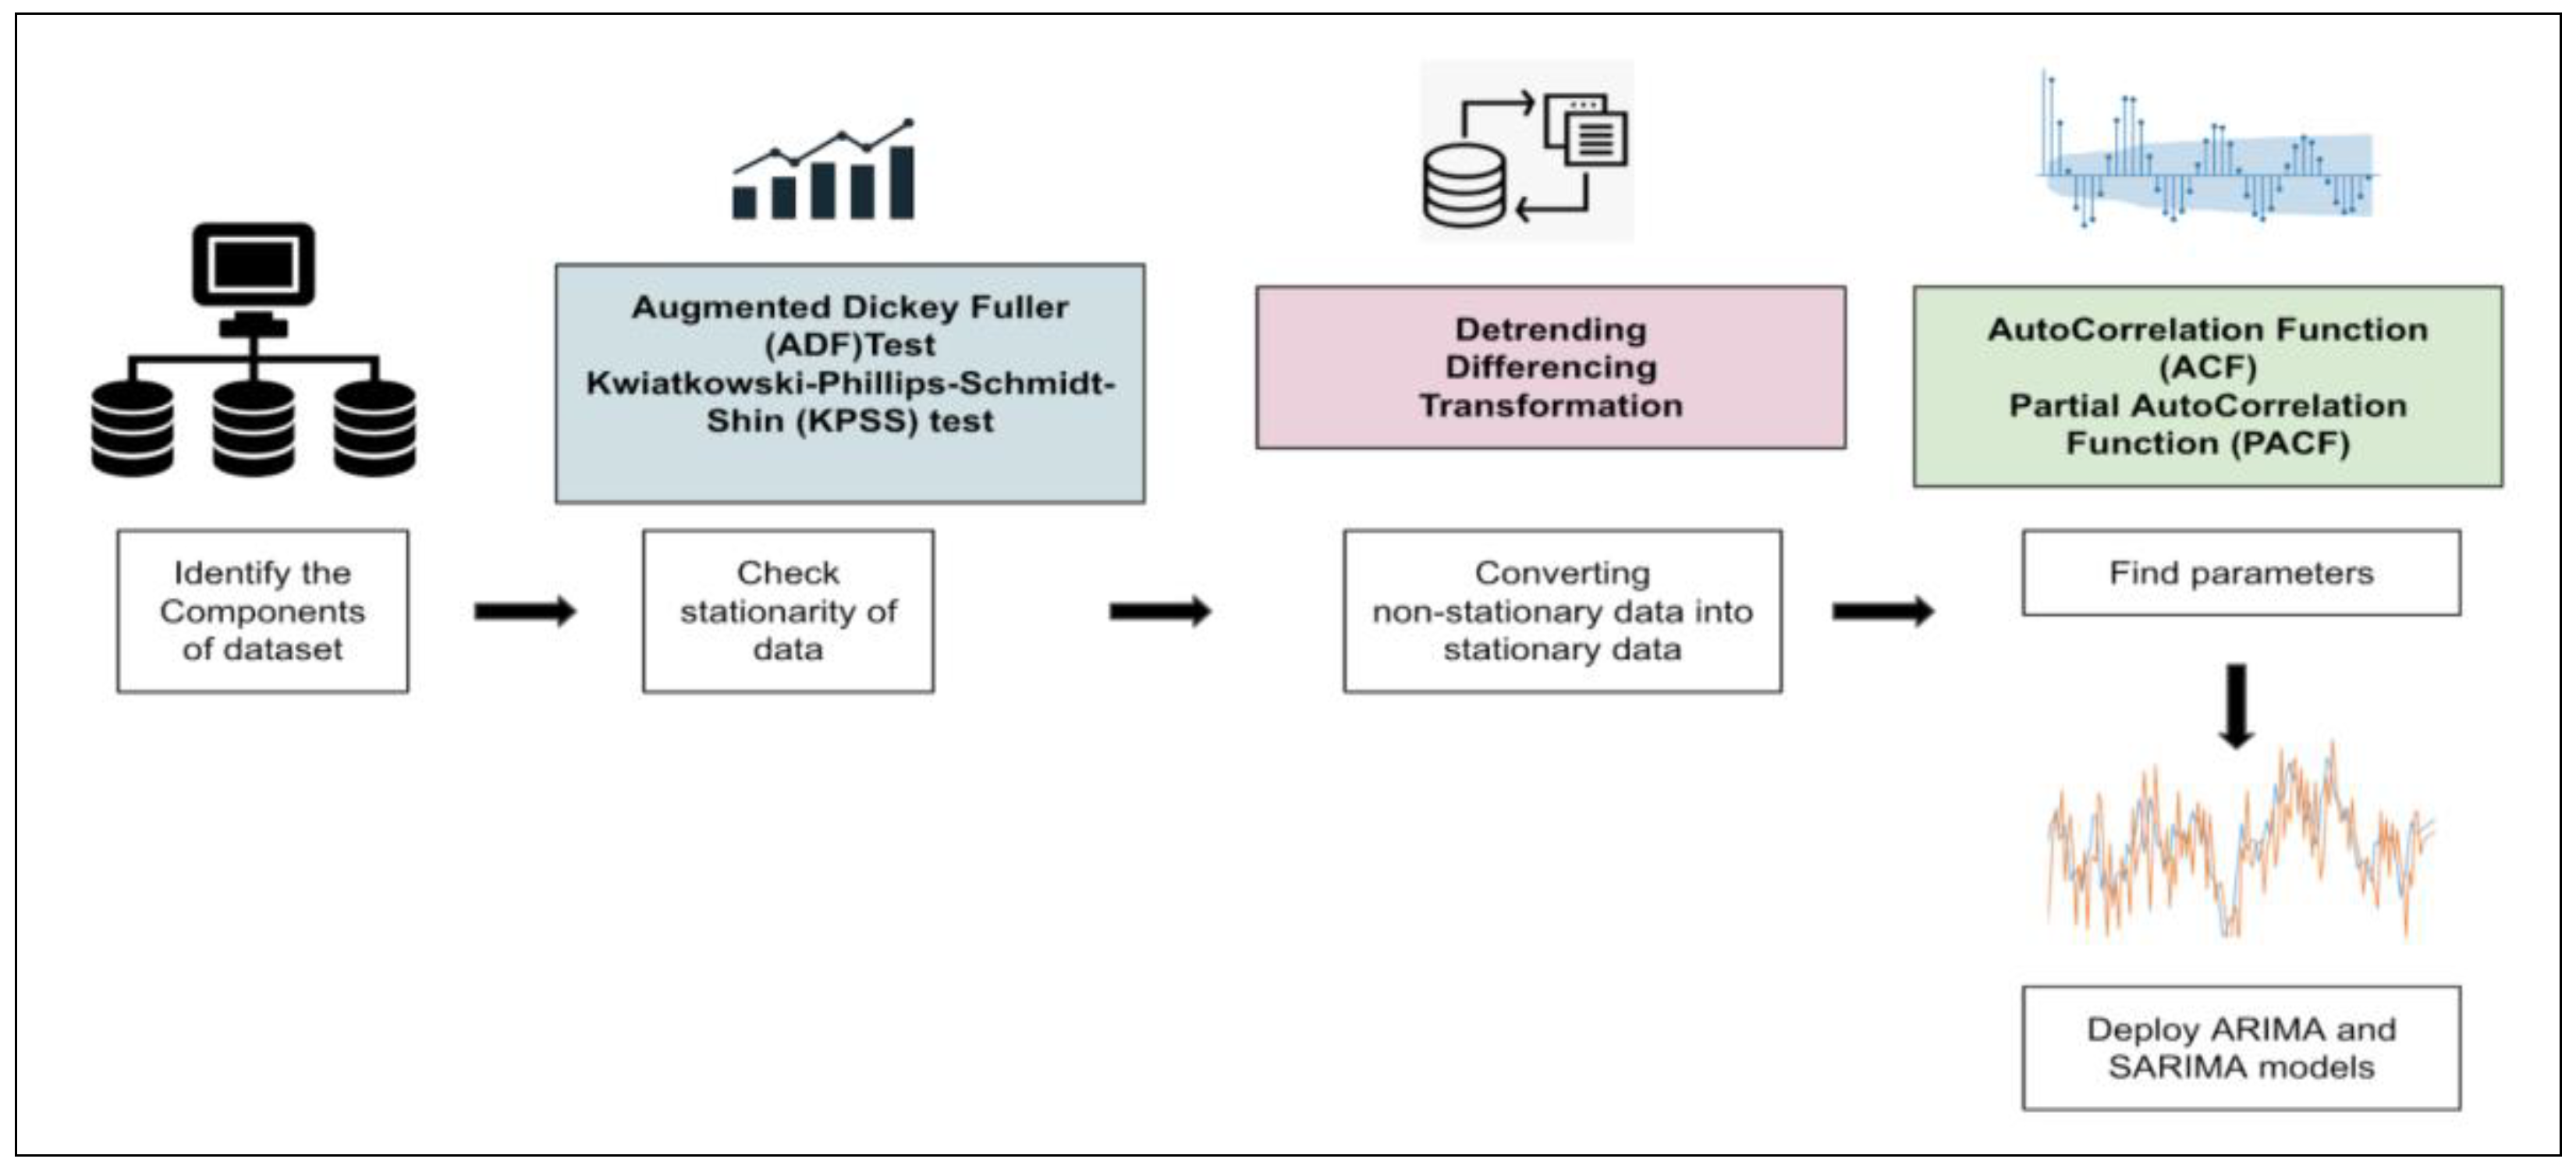
Time series incorporates time-based orders over a given period. It is an observation from a sequence of discrete-time of successive intervals. Time series are used in epidemiology to investigate associations between variables and outcomes. The time variable can be used as a reference point to estimate the target variable during forecasting [
37]. Different factors affect a certain variable at different points in time. It is assumed to be stationary, i.e., the origin of time should not affect the properties under statistical factors. Once data are collected and cleaned, they may be visualized concerning time (
Figure 2).
The stationarity of the series may be observed, followed by model building. We rely on two models for the study, i.e., autoregressive integrated moving average (ARIMA) and seasonal auto-regressive integrated moving average (SARIMA). Time series may be rending, seasonal, cyclical, or irregular, depending on the intervals in the series. In the case of stationary time series data, the mean and variance should be constant, while the covariance should measure the relationship between variables. Statistical tests and the augmented Dickey–Fuller (ADF) Test can be used to check data stationarity.
In this study, we perform the ADF test, which asserts that for the null hypothesis, the series is non-stationary. For the alternate hypothesis, the series is stationary, i.e., if the p-value is greater than 0.05, it fails to reject the null hypothesis. However, if the p-value is less than or equal to 0.05, it accepts the hypothesis. If the time series data are non-stationary, they may be converted to stationary using specific methods. For this study, we use the technique of differencing, which is a simple transformation of the existing series into an altogether new series. Here, we eliminate the series dependence on time and stabilize the mean. This leads to a significant decrease in the trend and seasonality during transformation. Once the data are converted into stationary, we can implement ARIMA and SARIMA models to perform the analysis.
3.3. Datasets
The dataset has been taken from Kaggle (Monkeypox Dataset Daily Updated) and incorporates three different files, i.e., daily country-wise confirmed cases, monkeypox cases worldwide, and worldwide case detection timeline. The data were collected from January 2022 to August 2022. The first file incorporates a daily number of confirmed cases for all countries where cases have been identified. The second file includes confirmed cases, suspected cases, the number of people hospitalized, travel history, etc. The third file includes information such as date, city, age, gender, isolation, etc. We rely on all the files for carrying out the extensive analysis.
The first part of our analysis incorporates data visualization, observations, and inferences based on the data patterns. This is followed by applying machine learning models to the data to analyze which model performs the best using statistical parameters. Finally, we perform a time series analysis using ARIMA and SARIMA models and observe the results from the forecast.
4. Experimental Analysis
In this section, we discuss the evaluation parameters and results following the experimental analysis performed for the study.
4.1. Evaluation Parameters
The evaluation parameters used in the study are as follows:
MAE: mean absolute error or MAE defines the average magnitude of the errors given a set of predictions. It may also be defined as the average over the test sample of the absolute differences between prediction and actual observation such that all individual differences have equal weight.
MSE: mean squared error or MSE defines the proximity between a regression line and its corresponding data points. It is calculated by taking the distance between the points and the regression line and squaring the values.
MAPE: mean absolute percentage error (MAPE) defines a forecast system’s accuracy. The accuracy is measured as a percentage. It can measure the performance of regression models.
R2: R-squared value or R2 determines how close data are to the fitted regression line. Additionally, known as the coefficient of determination, it can find the strength of the relationship between the linear model and dependent variables.
4.2. Results
This section presents the observations, comparative analysis, and discussions. Based on the analysis performed, we present data visualization graphs, machine-learning-model-based analysis, and time series graphs in the observations section. The comparative analysis section compares our proposed work and similar related works. Finally, we discuss the results and key takeaways in the Discussions Section.
4.2.1. Initial Observations
In this section, we present our initial observations. These include total confirmed cases by country, travel history, symptom analysis, cases worldwide, correlation using the Pearson method, and the number of cases by age group.
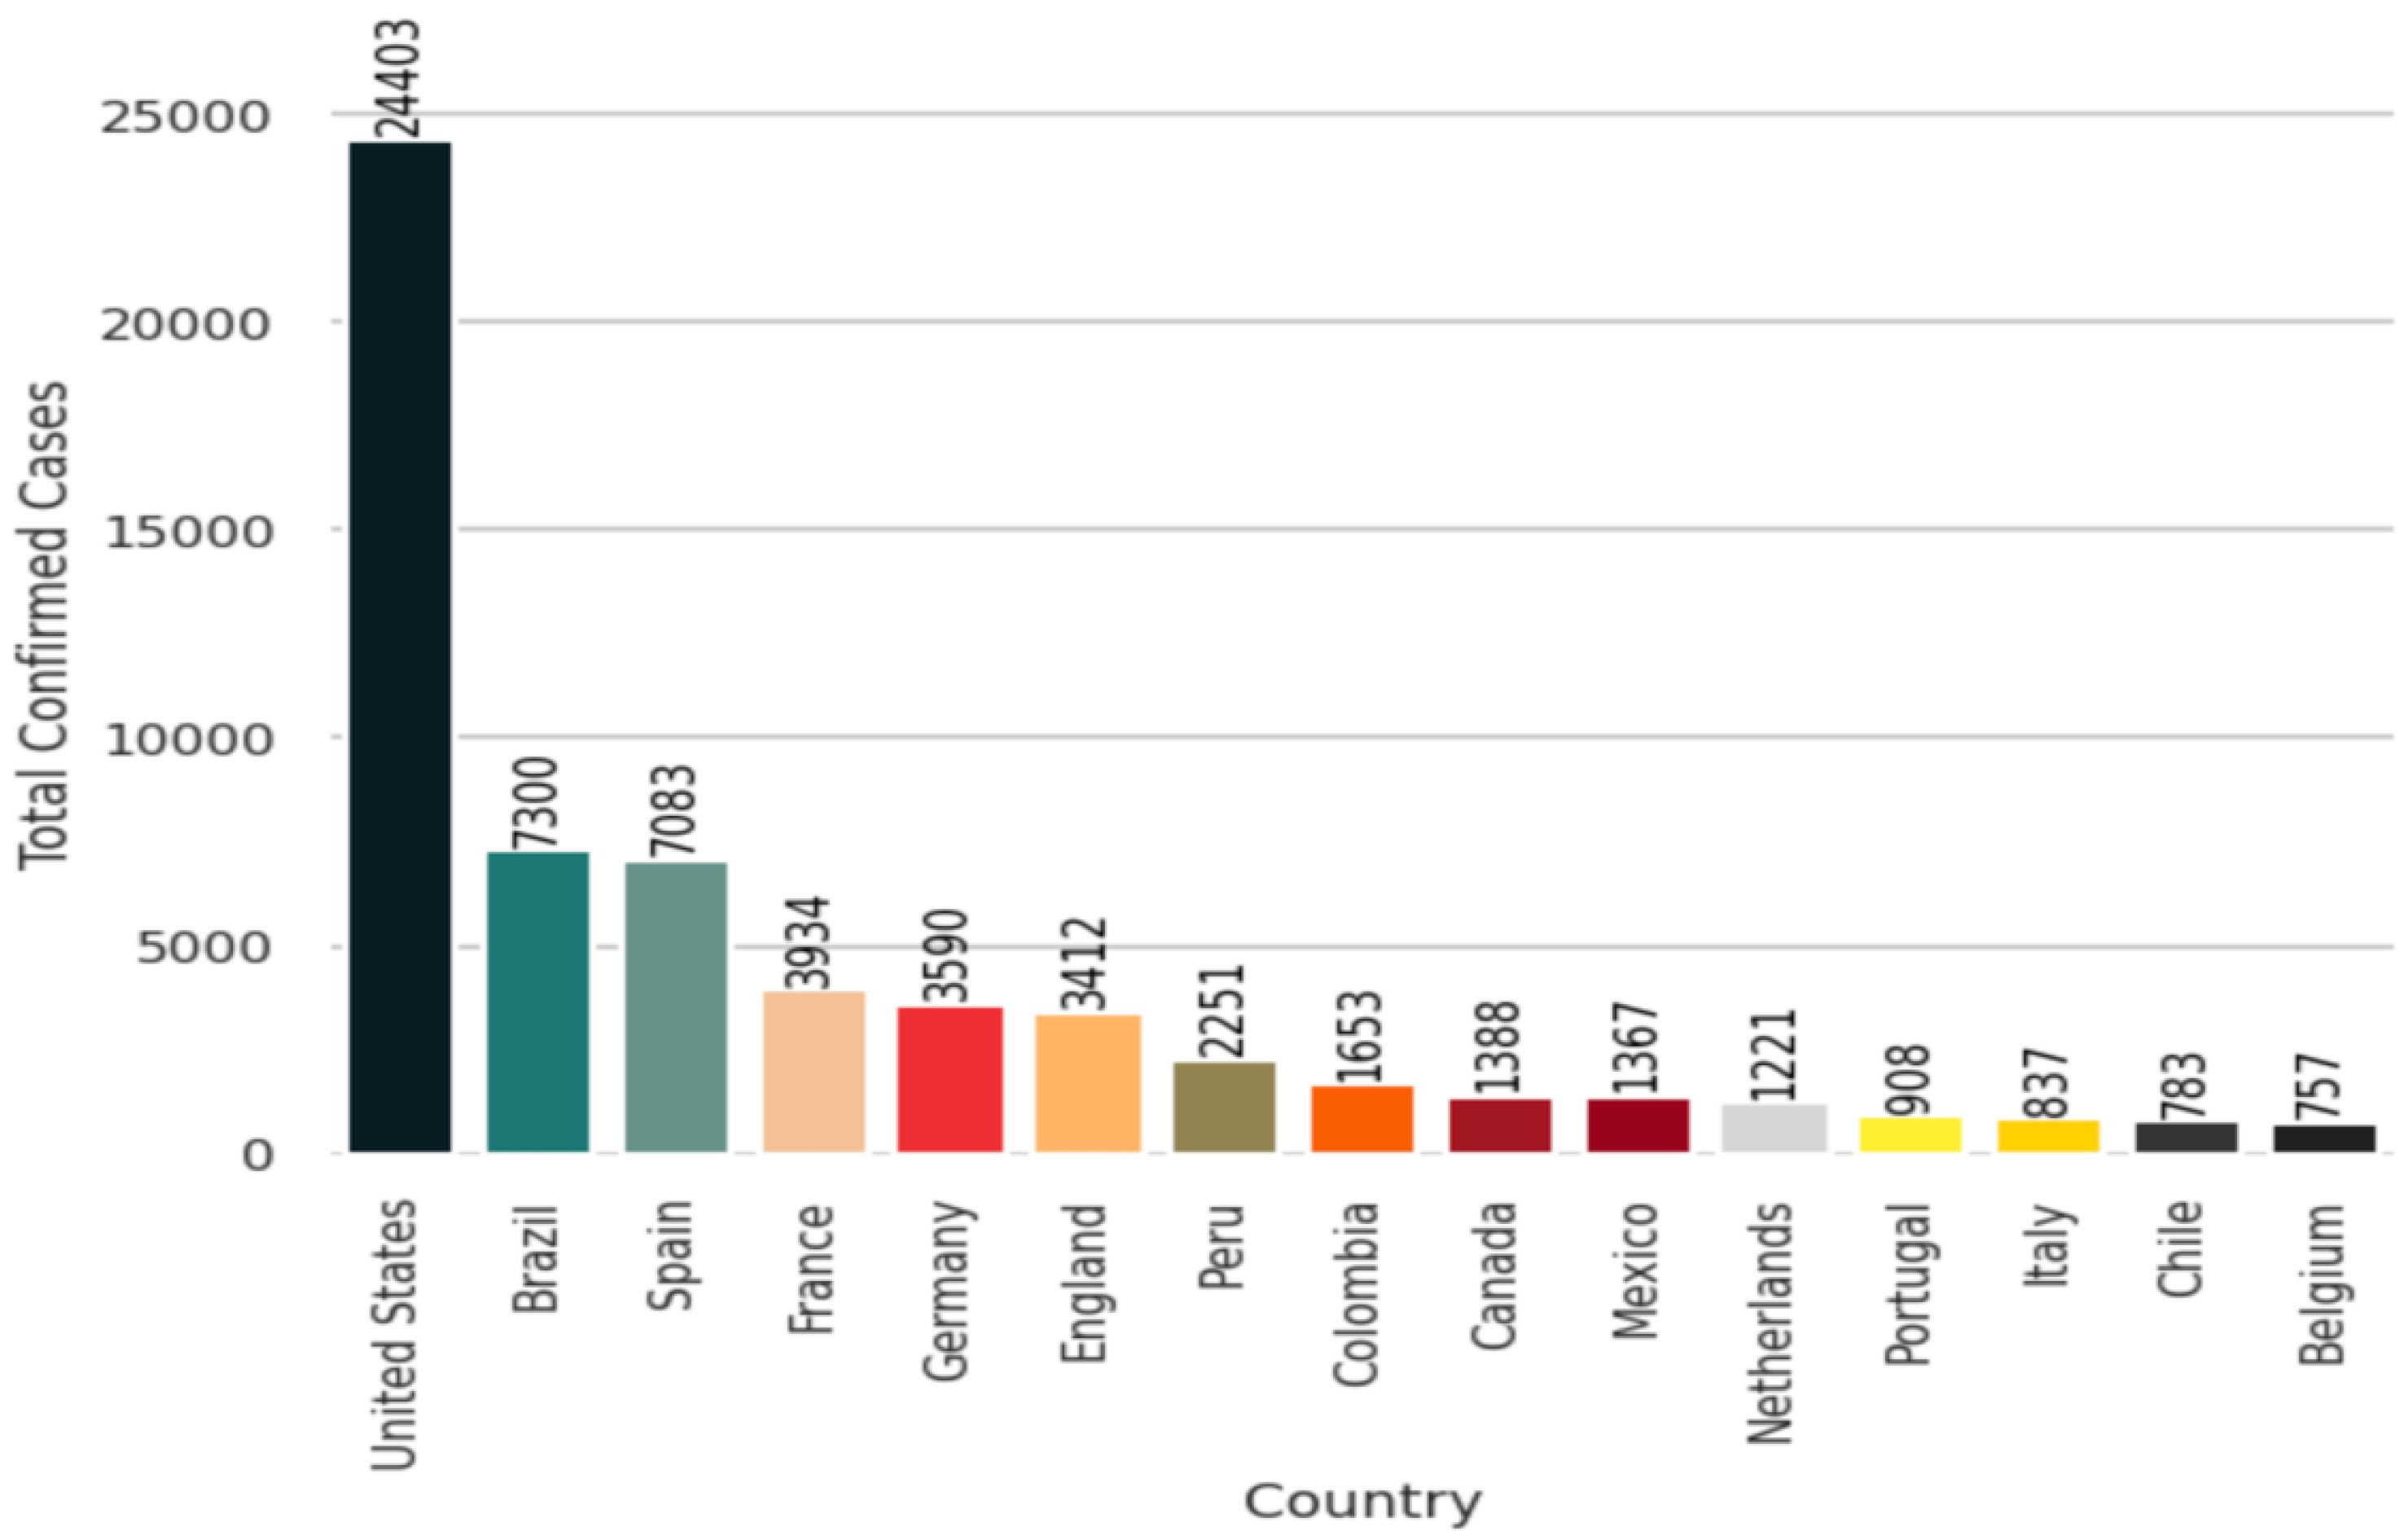
Figure 3 shows the trend across the top fifteen countries, although the spread is beyond these countries (see
Figure 3). The United States has the highest number of confirmed cases, followed by Spain, Germany, England, and Brazil, which all have nearly the same cases, while there is a significant difference in the number of cases for Switzerland, Austria, and Israel.
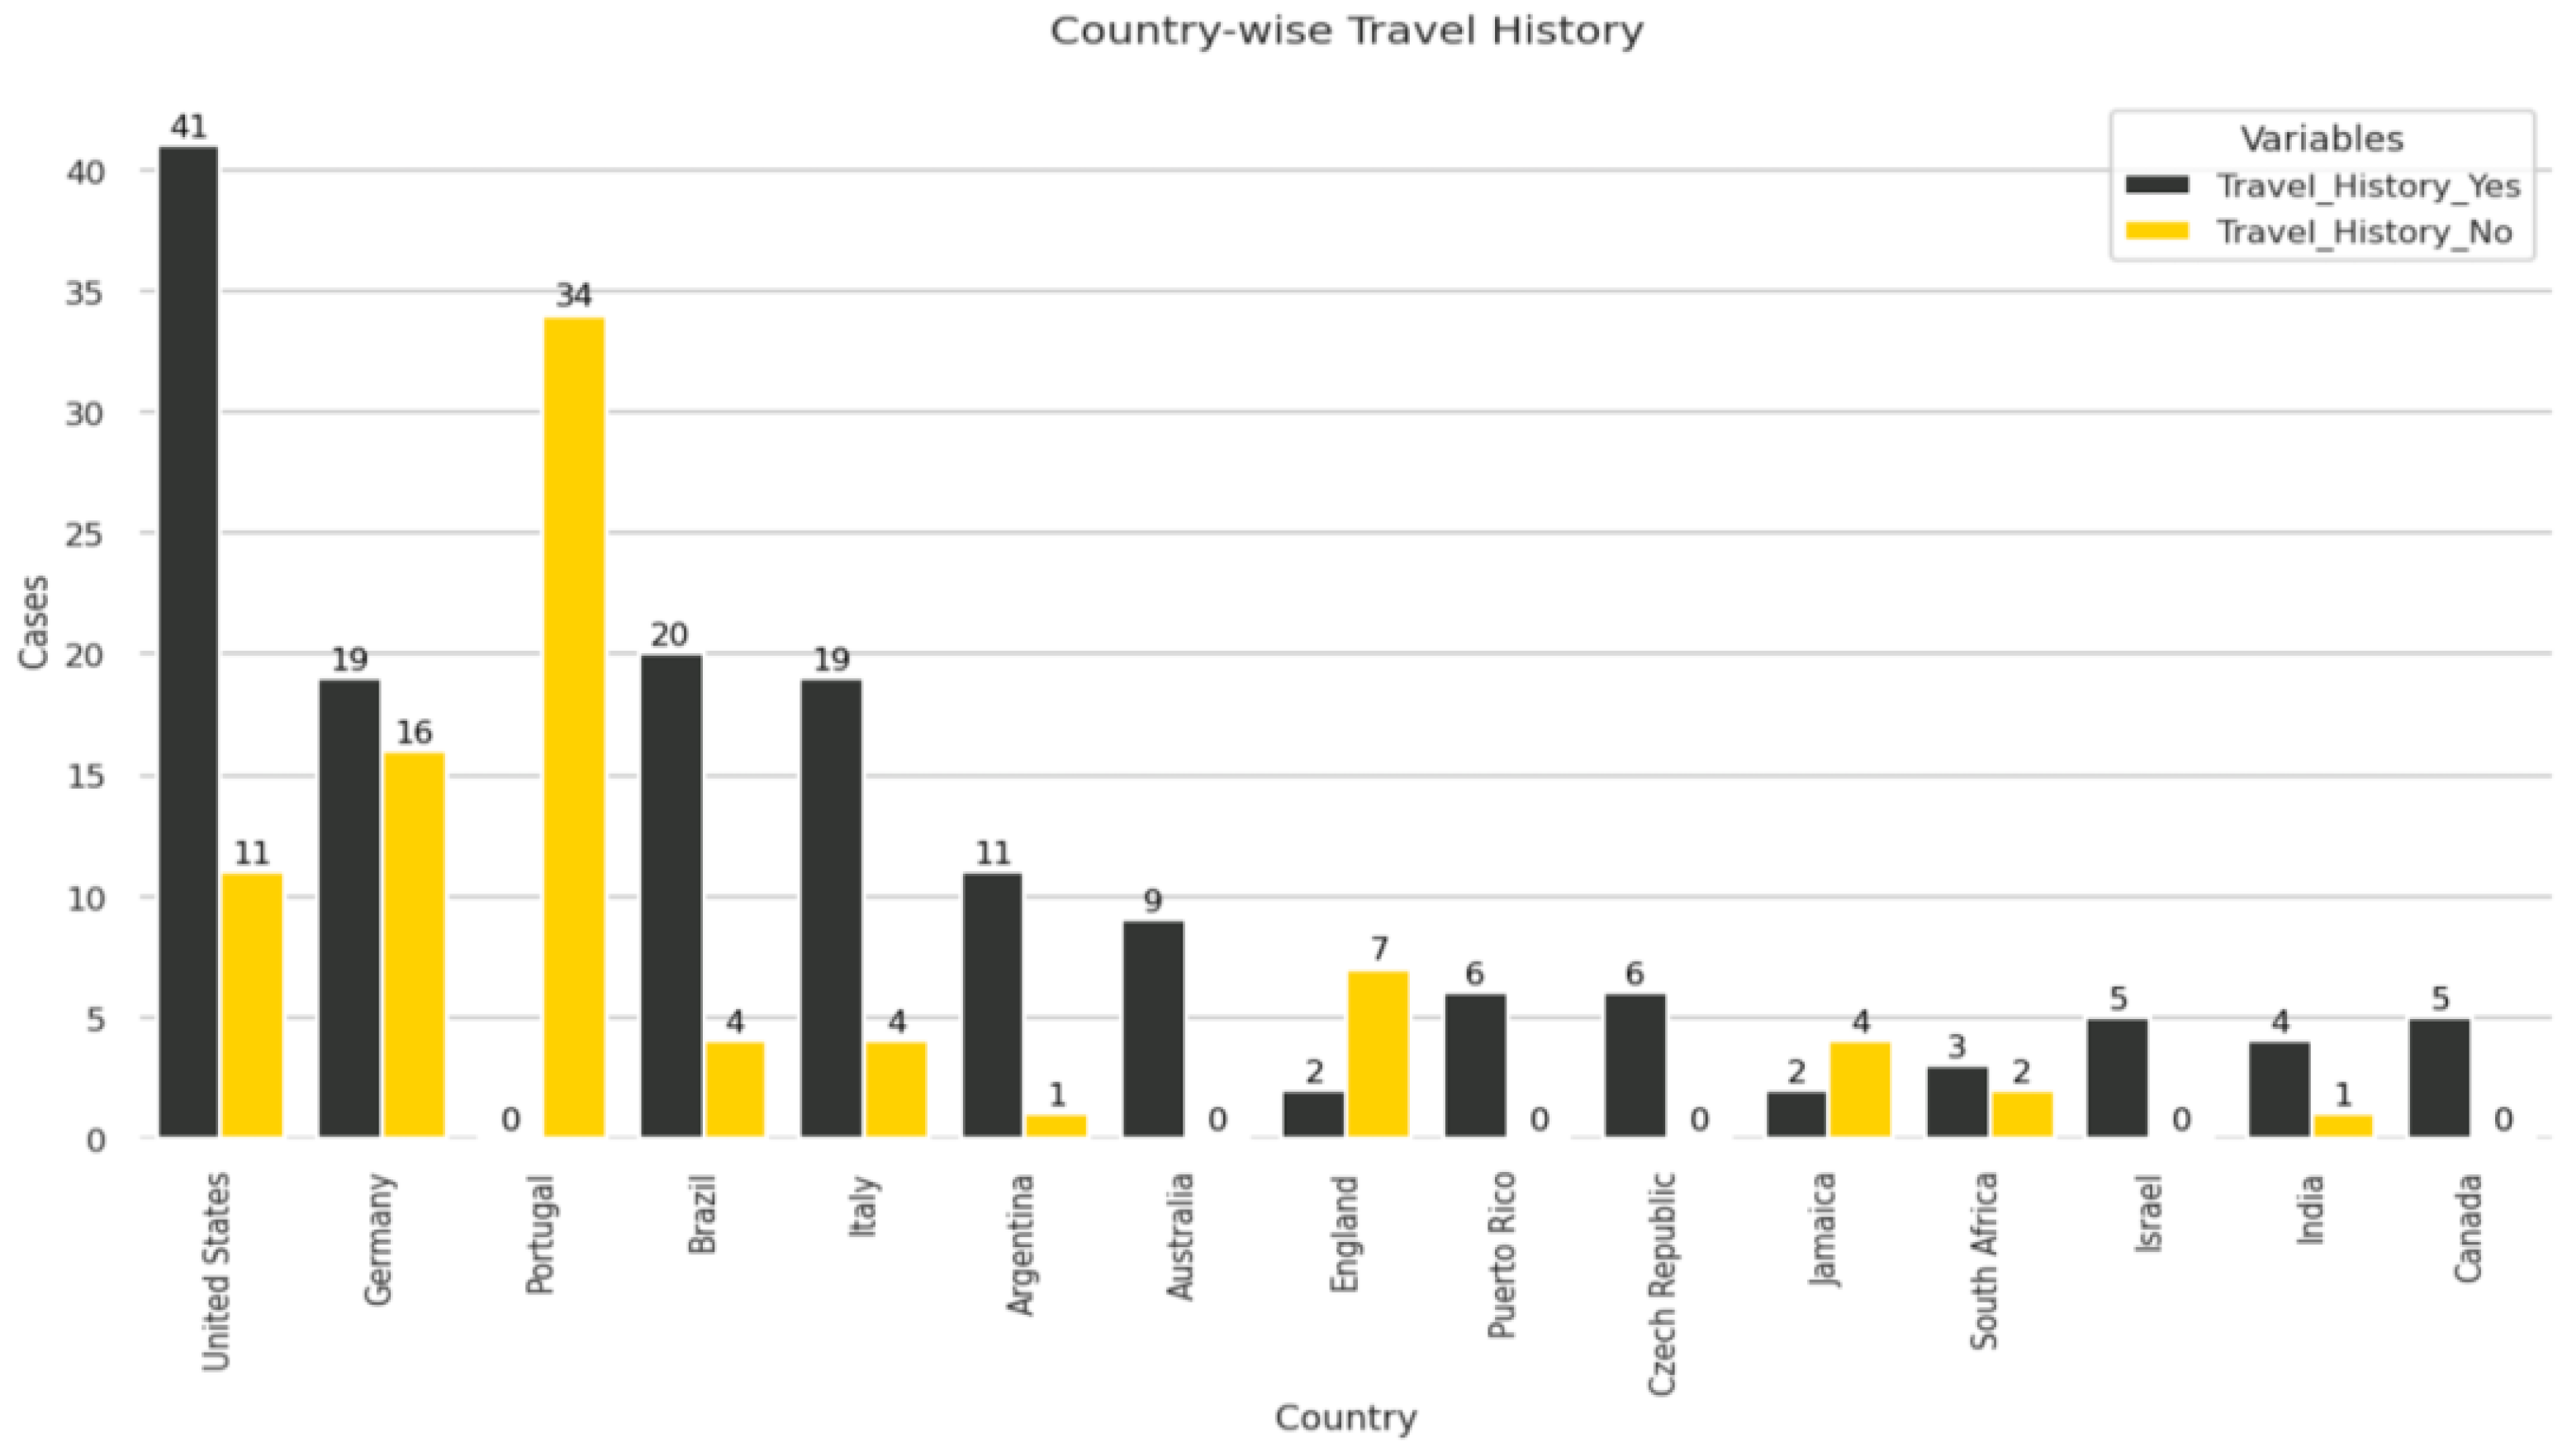
From
Figure 4, we observed that the United States has the maximum number of patients with travel history, followed by Brazil, Italy, and Germany. Countries such as India, Singapore, and South Africa have fewer cases. We also observe that Portugal has the highest number of cases with no travel history, i.e., Travel_History_No is zero for Portugal. This increases the chance that Portugal might be the origin of the outbreak.
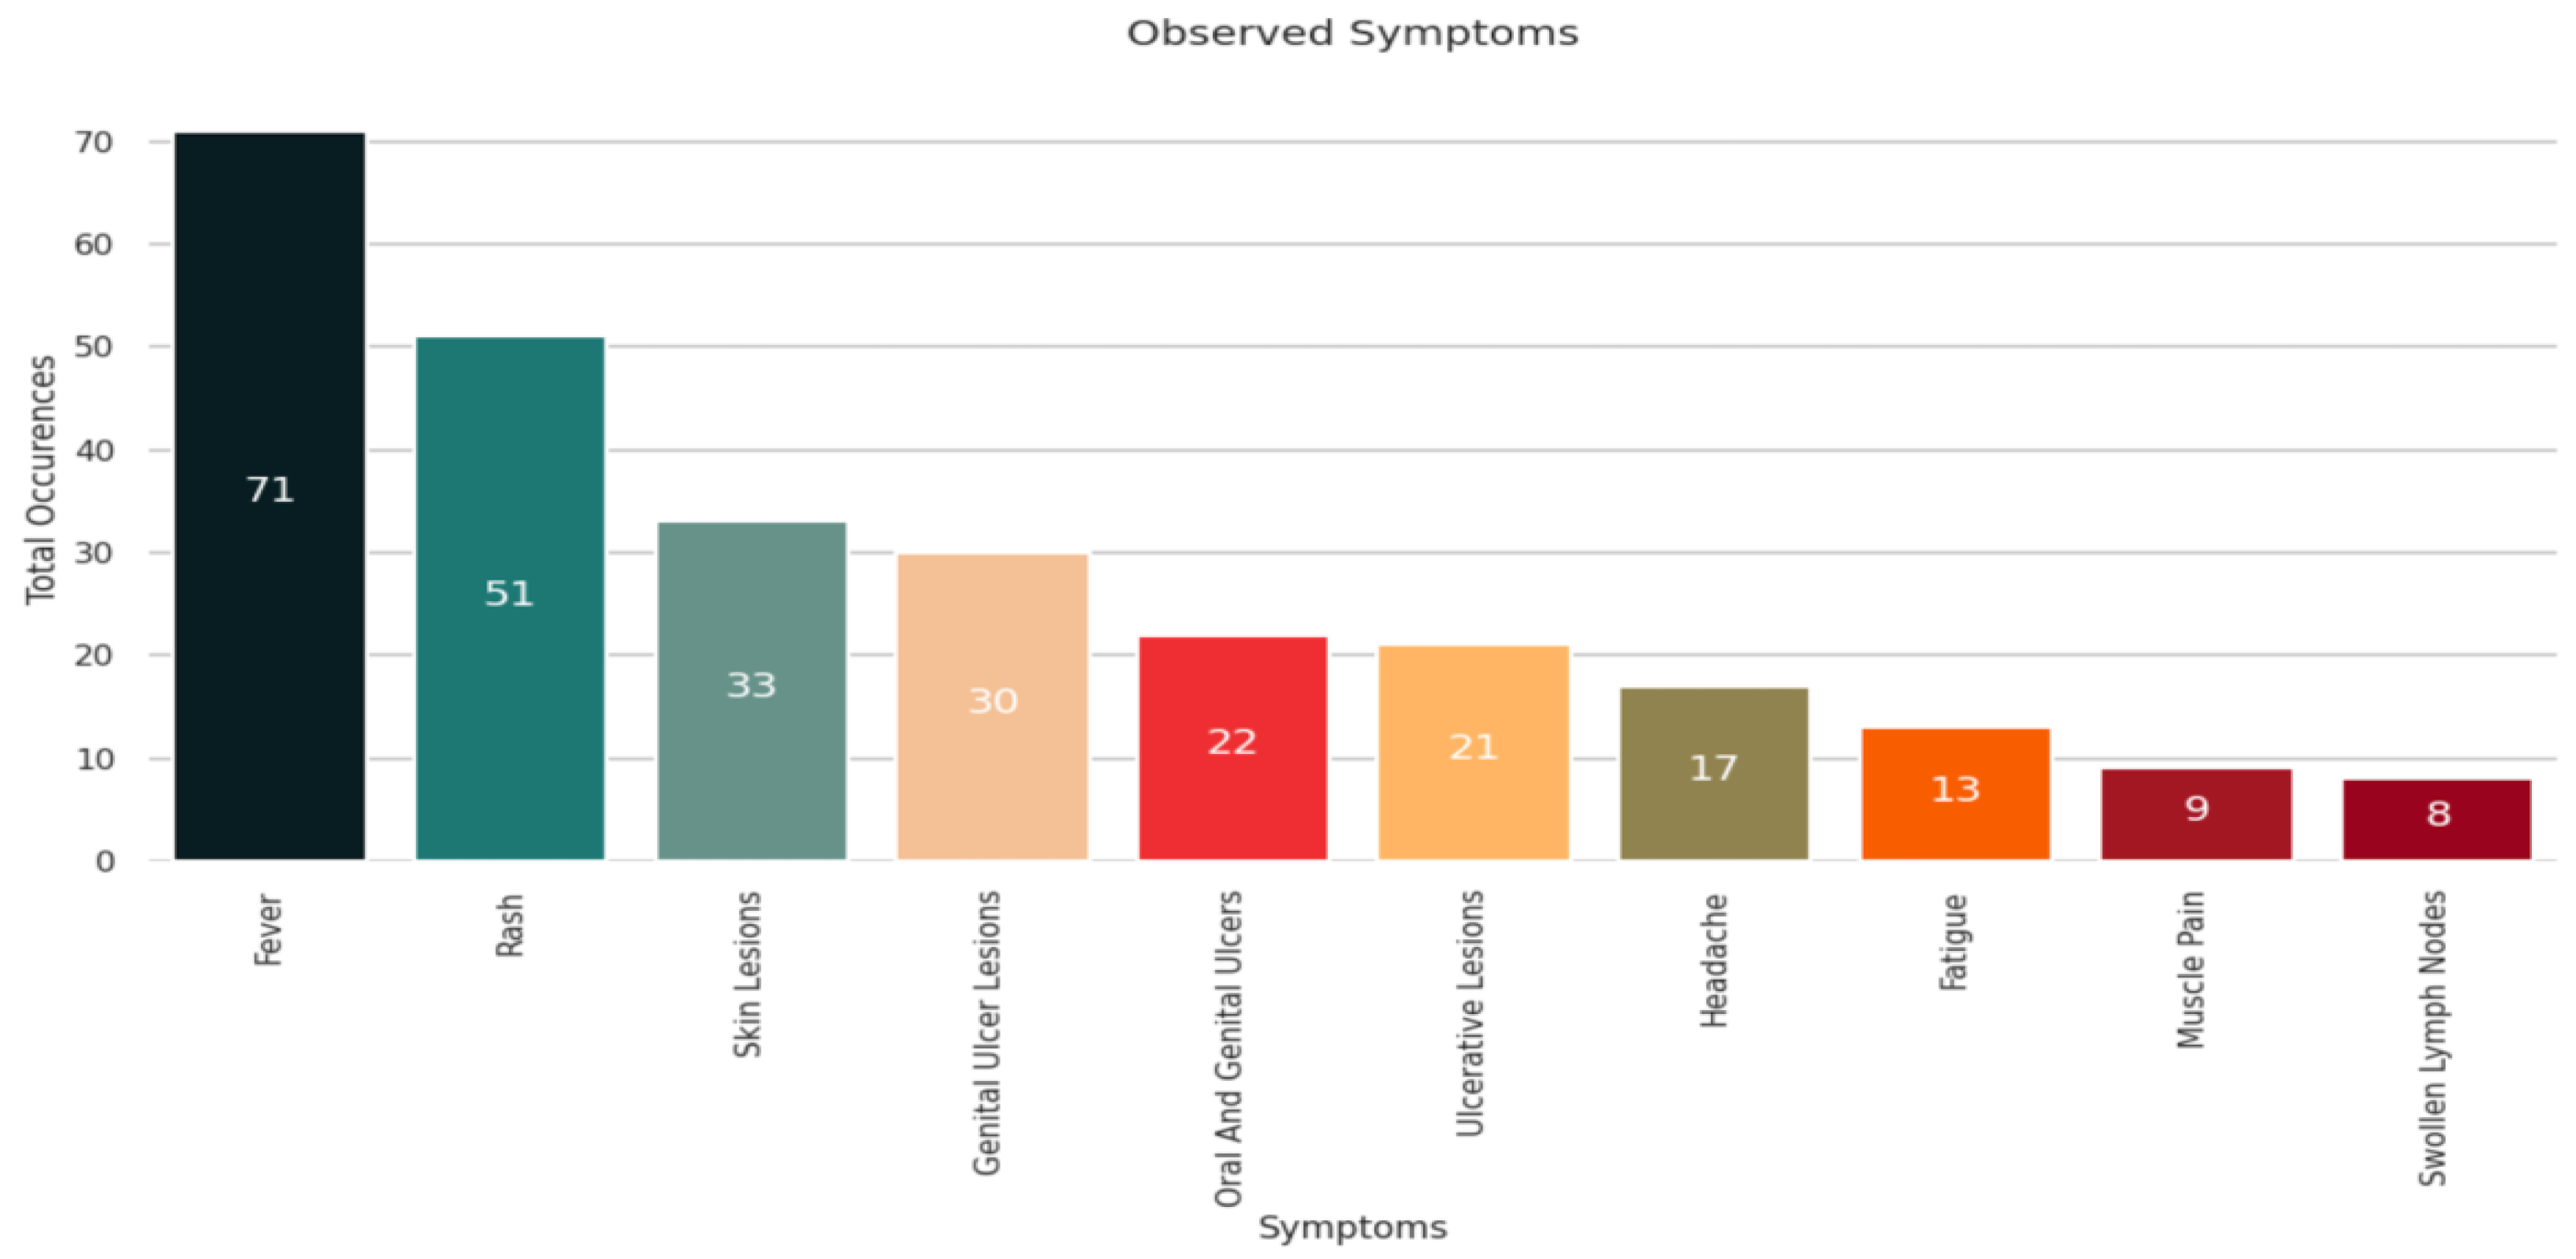
The common symptoms of monkeypox disease are muscle pain, fatigue, chills, respiratory discomfort, etc. Based on the analysis shown in
Figure 5, we observed that most patients exhibited signs of fever followed by rashes and skin lesions. Some patients developed genital ulcer lesions, headaches, and fatigue. Few patients suffered from swollen lymph nodes and muscle pain.
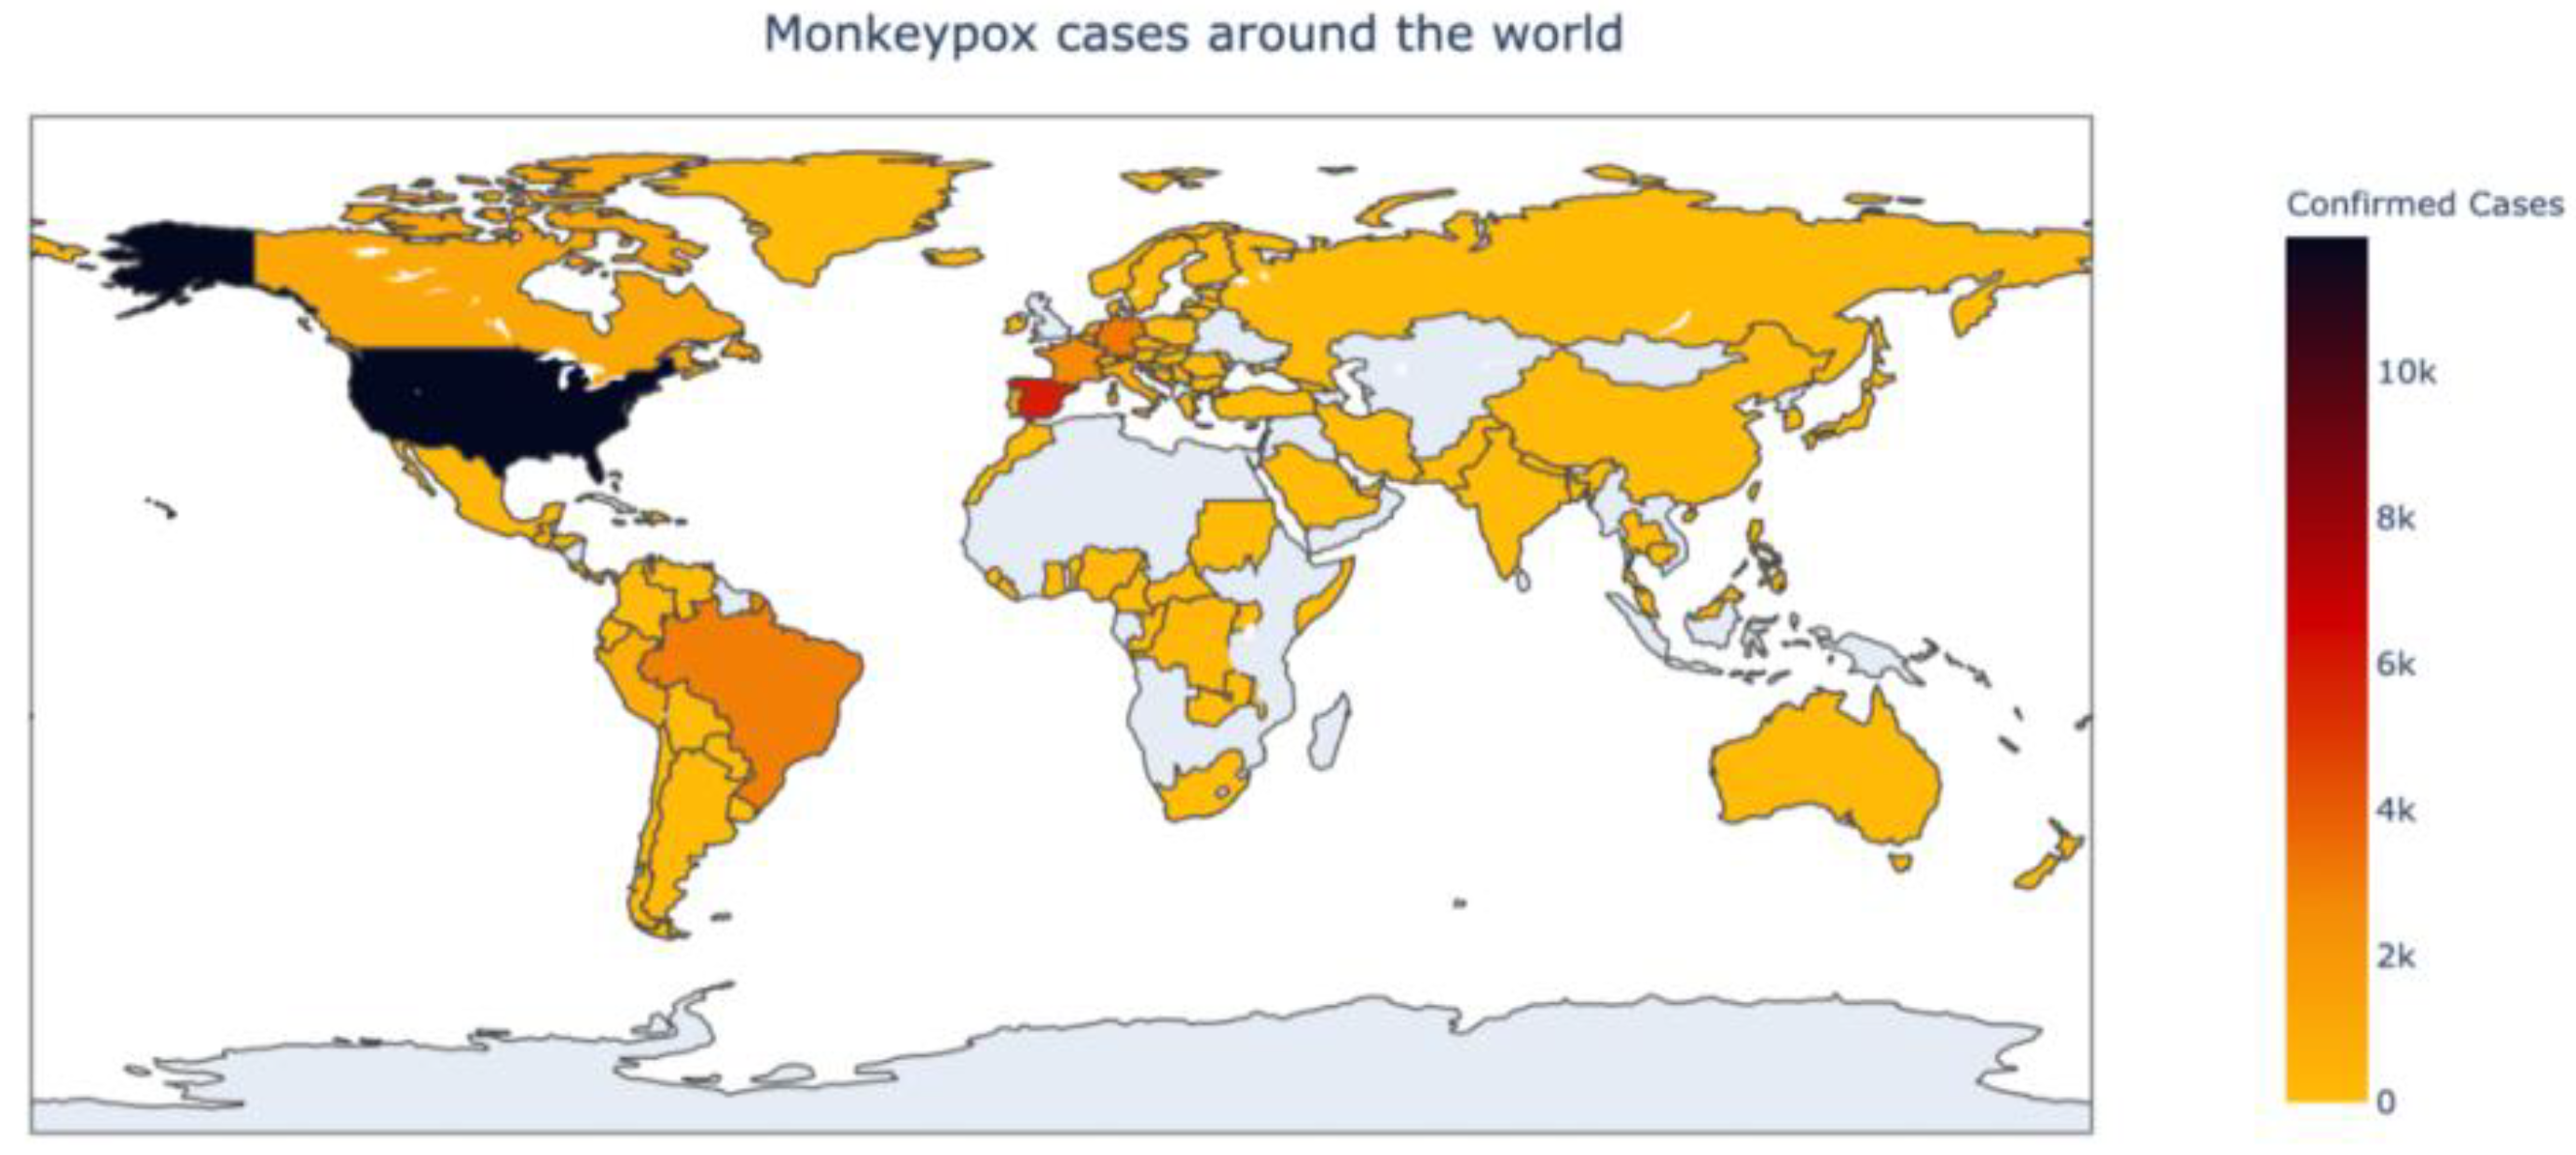
Figure 6 depicts a heatmap of the global outbreak. As is evident in
Figure 3 and the heat map, the United States has the maximum number of monkeypox cases, followed by Europe. Countries such as India, Australia, and China have fewer confirmed cases.
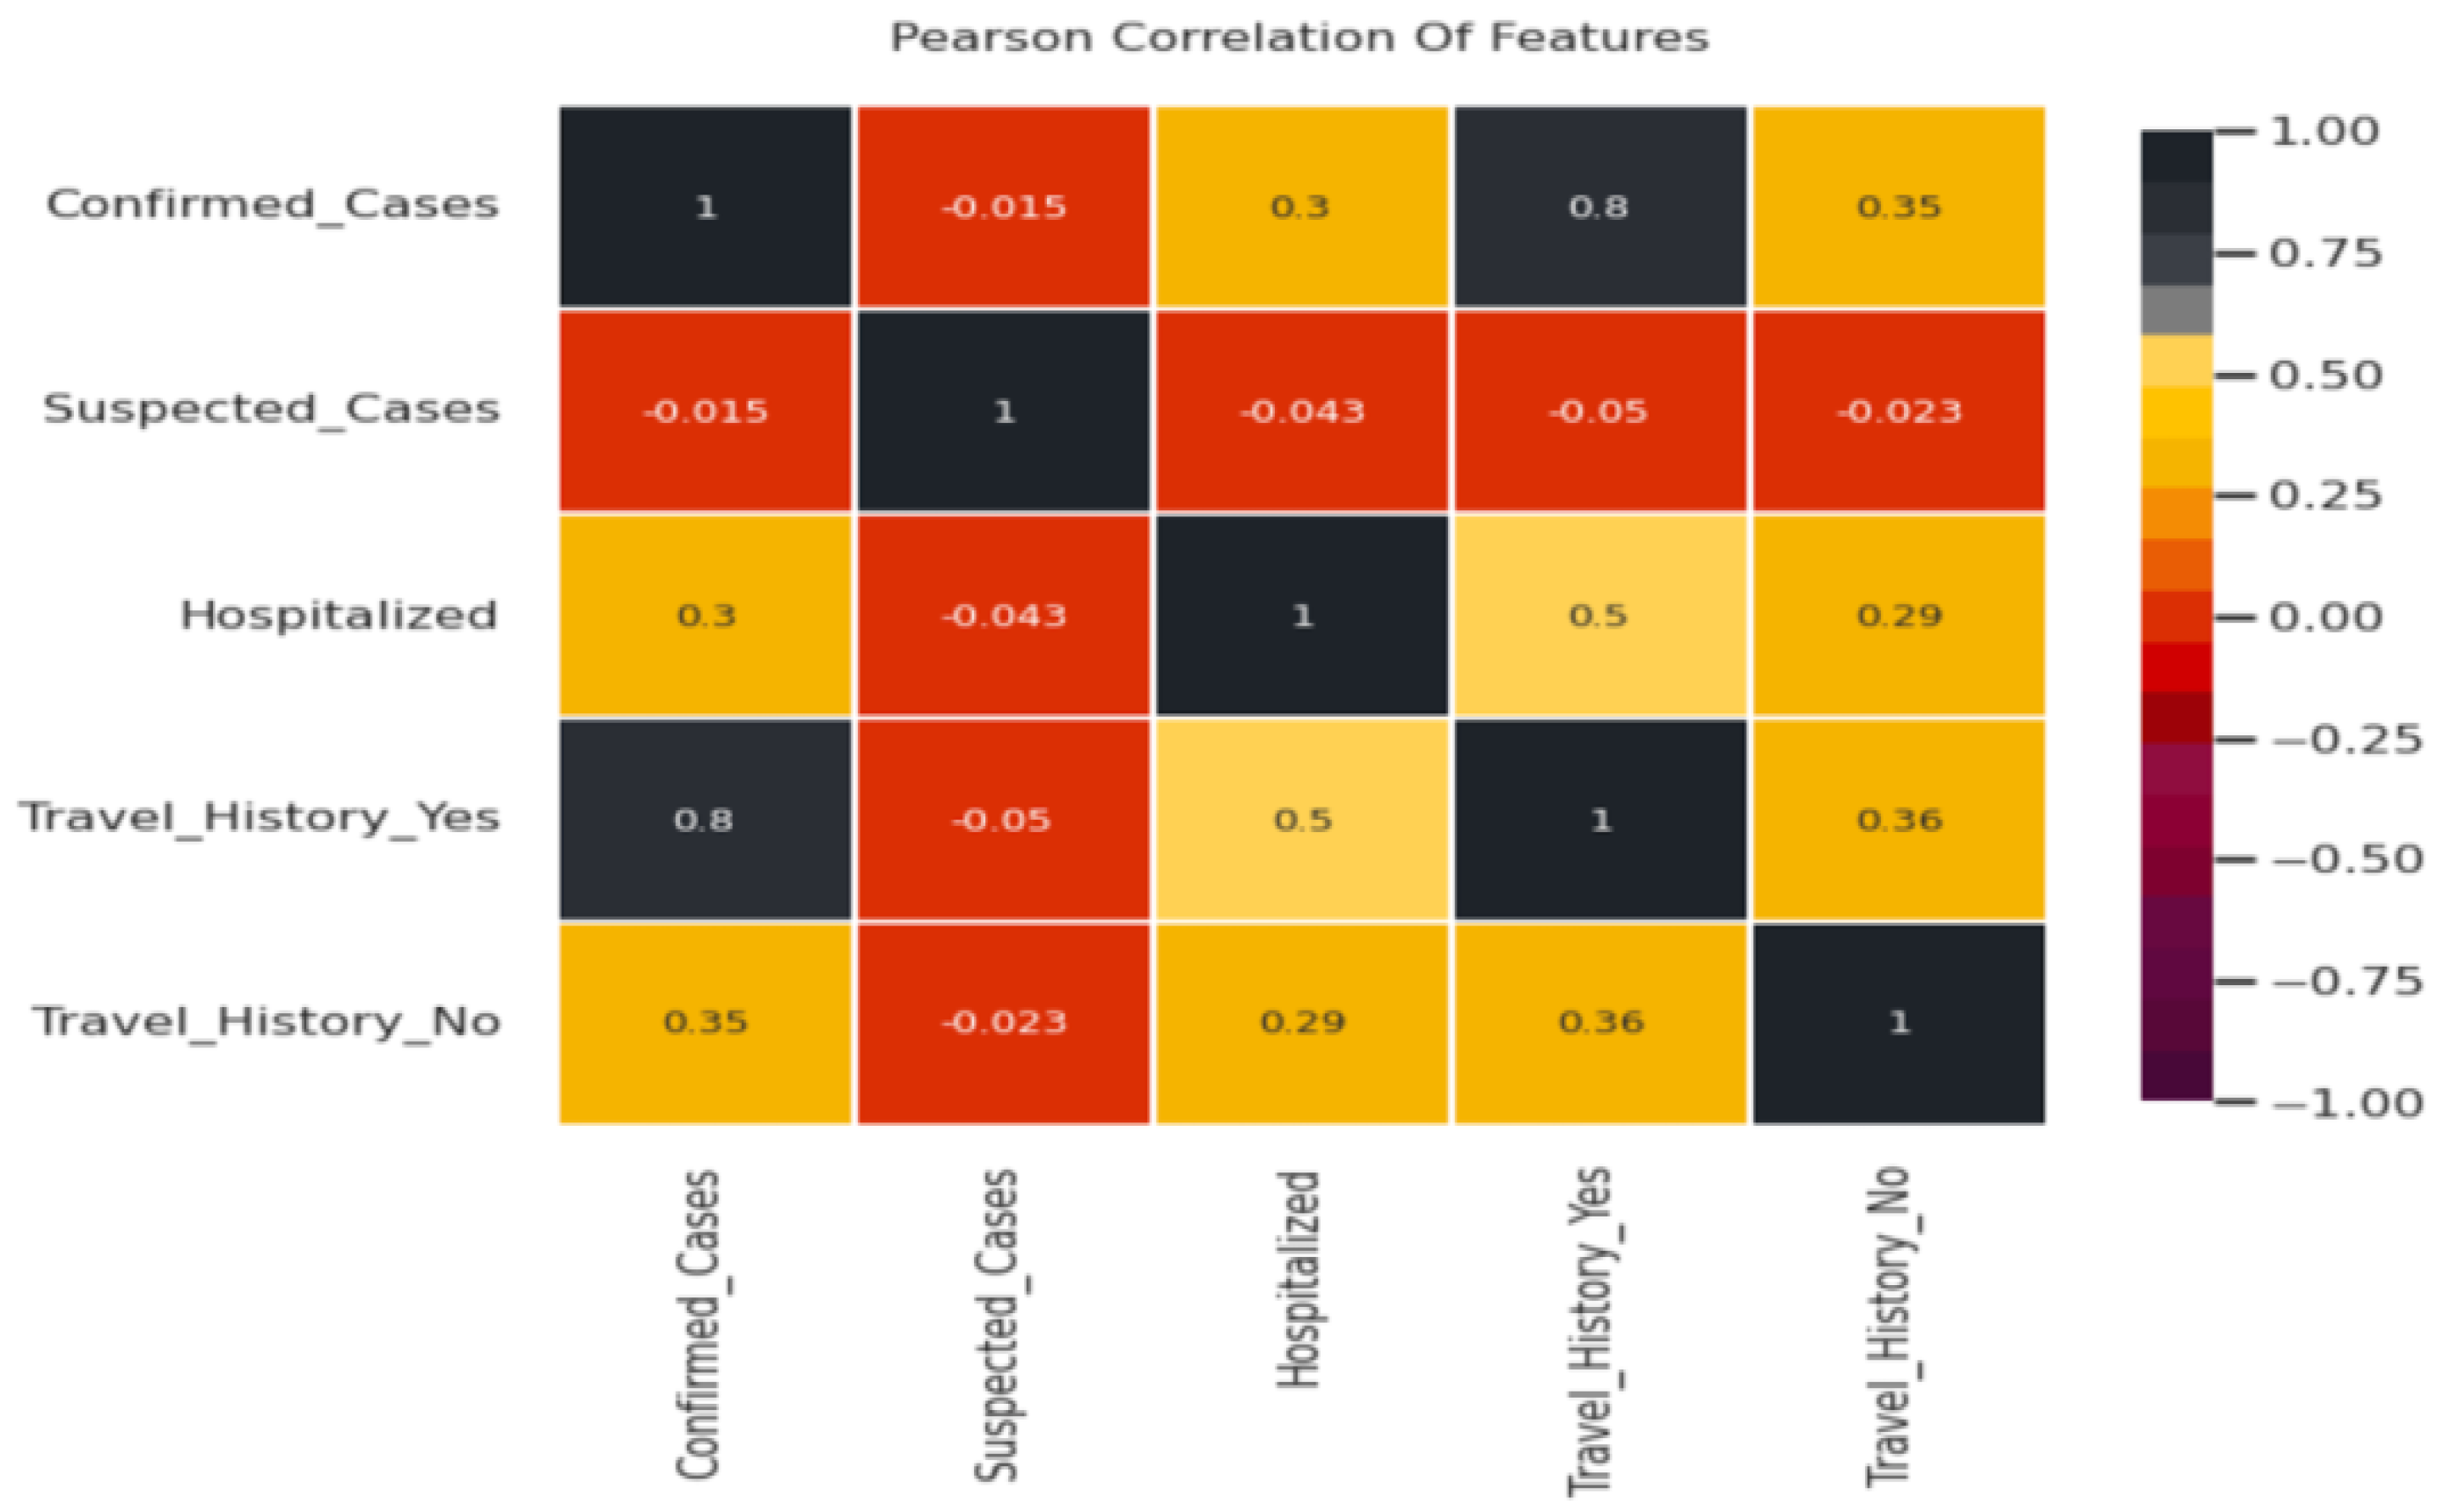
Pearson’s correlation method is used to find the relationship between features in a dataset. The values are between −1 and +1, denoting negative and positive linear correlation, respectively. Hence, the strength of the linear relationship between the two variables can be assessed. Based on the study shown in
Figure 7, we observed that people with a travel history correlate positively with hospitalization, and hospitalized cases correlate with confirmed cases.
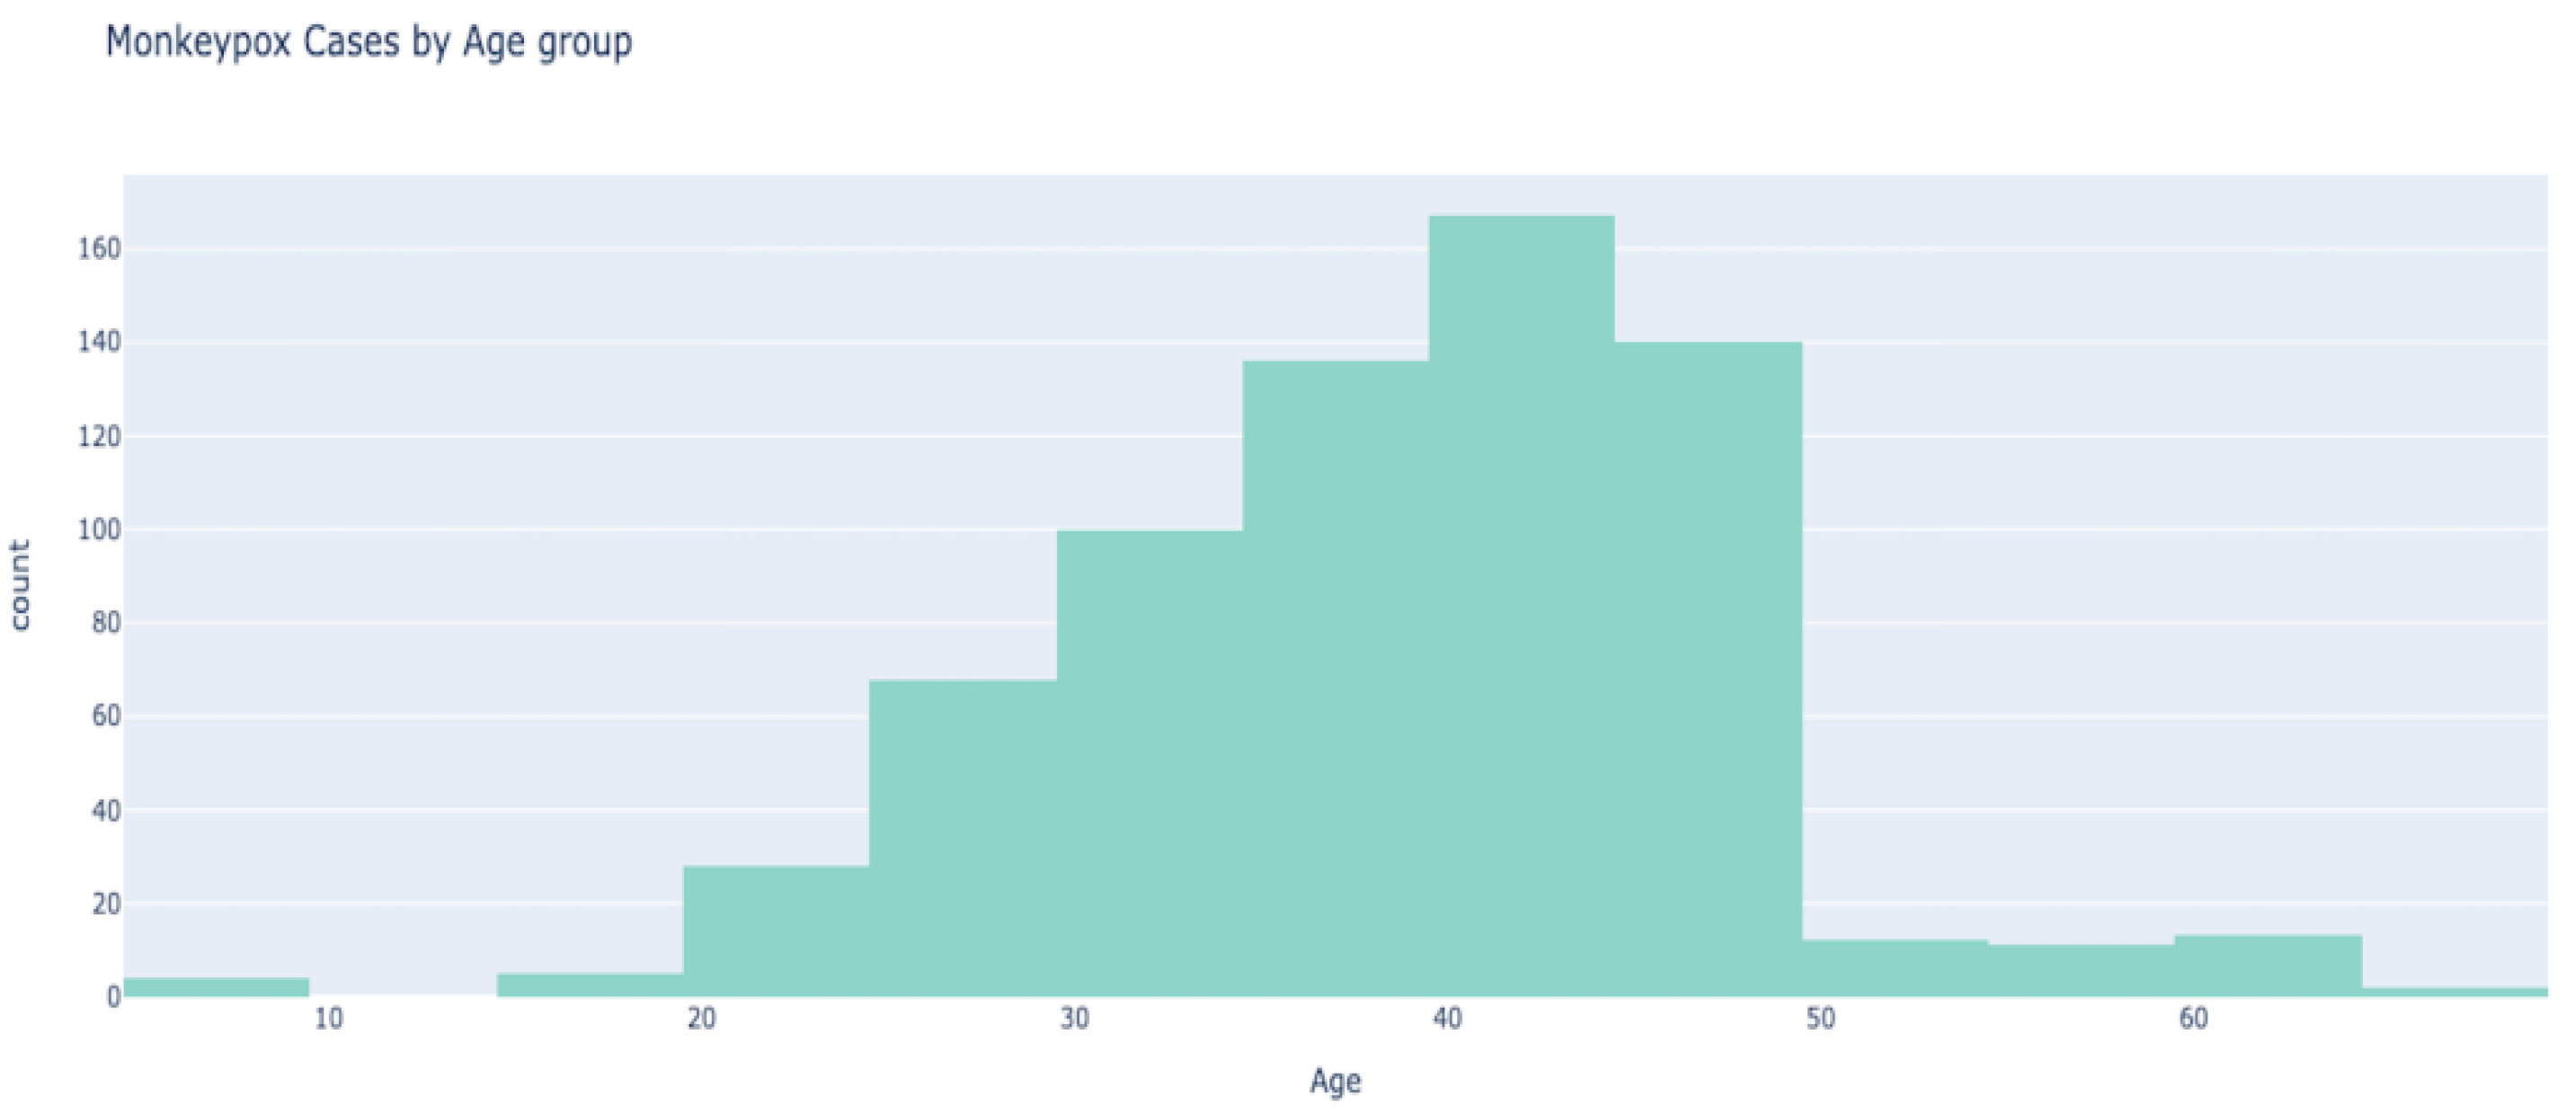
We observed in
Figure 8 that the maximum cases are in the age group between 40 and 50 years. The number of cases is relatively lower for people in their 20s and 30s, and significantly lower for people in the age group between 10 years and 20 years, and 50 years and 70 years.
4.2.2. Monkeypox Outbreak Analysis Using Machine Learning Models
In the initial stages of our data analysis, we observed that our data were highly skewed. Skewed data often lead to incorrect pattern analysis and prediction. Therefore, we handled the skewness using the min–max normalization technique. In min–max normalization, for every feature, the minimum value is transformed to 0, and the maximum value is transformed to 1. All the other values are placed as decimals between 0 and 1. After normalization and data splitting (80% training data and 20% test data), we deployed a few traditional machine learning algorithms (linear regression, decision tree, random forest, elastic net regression) and neural networks (convolutional neural networks or CNN, artificial neural networks or ANN). The performance was evaluated using MAE, MSE, MAPE, and R2; the results are depicted in
Table 2.
Based on the results from
Table 2, we observed a good range of values for the statistical parameters. MAE, MSE, and MAPE values can range from zero to infinity, and lower values indicate better performance. We deduce that CNN has the lowest values regarding MAE, MSE, and MAPE, suggesting that it performs the best compared to the other models. The second best model is ANN, followed by random forests. In terms of R2, the range lies between 0 and 1, and a higher value depicts better performance. We observe that CNN consistently performs better regarding R2, followed by ANN and the random forest model.
Table 3 depicts the performance of the models after applying grid search.
We observe that grid search improves the overall performance of ANN and CNN; hence, we apply grid search to all the models to analyze the efficiency.
Once grid search is applied to all models, we observe significant performance improvement. We also observe that CNN with grid search performs the best, followed by random forest with grid search and ANN with grid search, respectively. Linear regression with grid search shows the least efficiency.
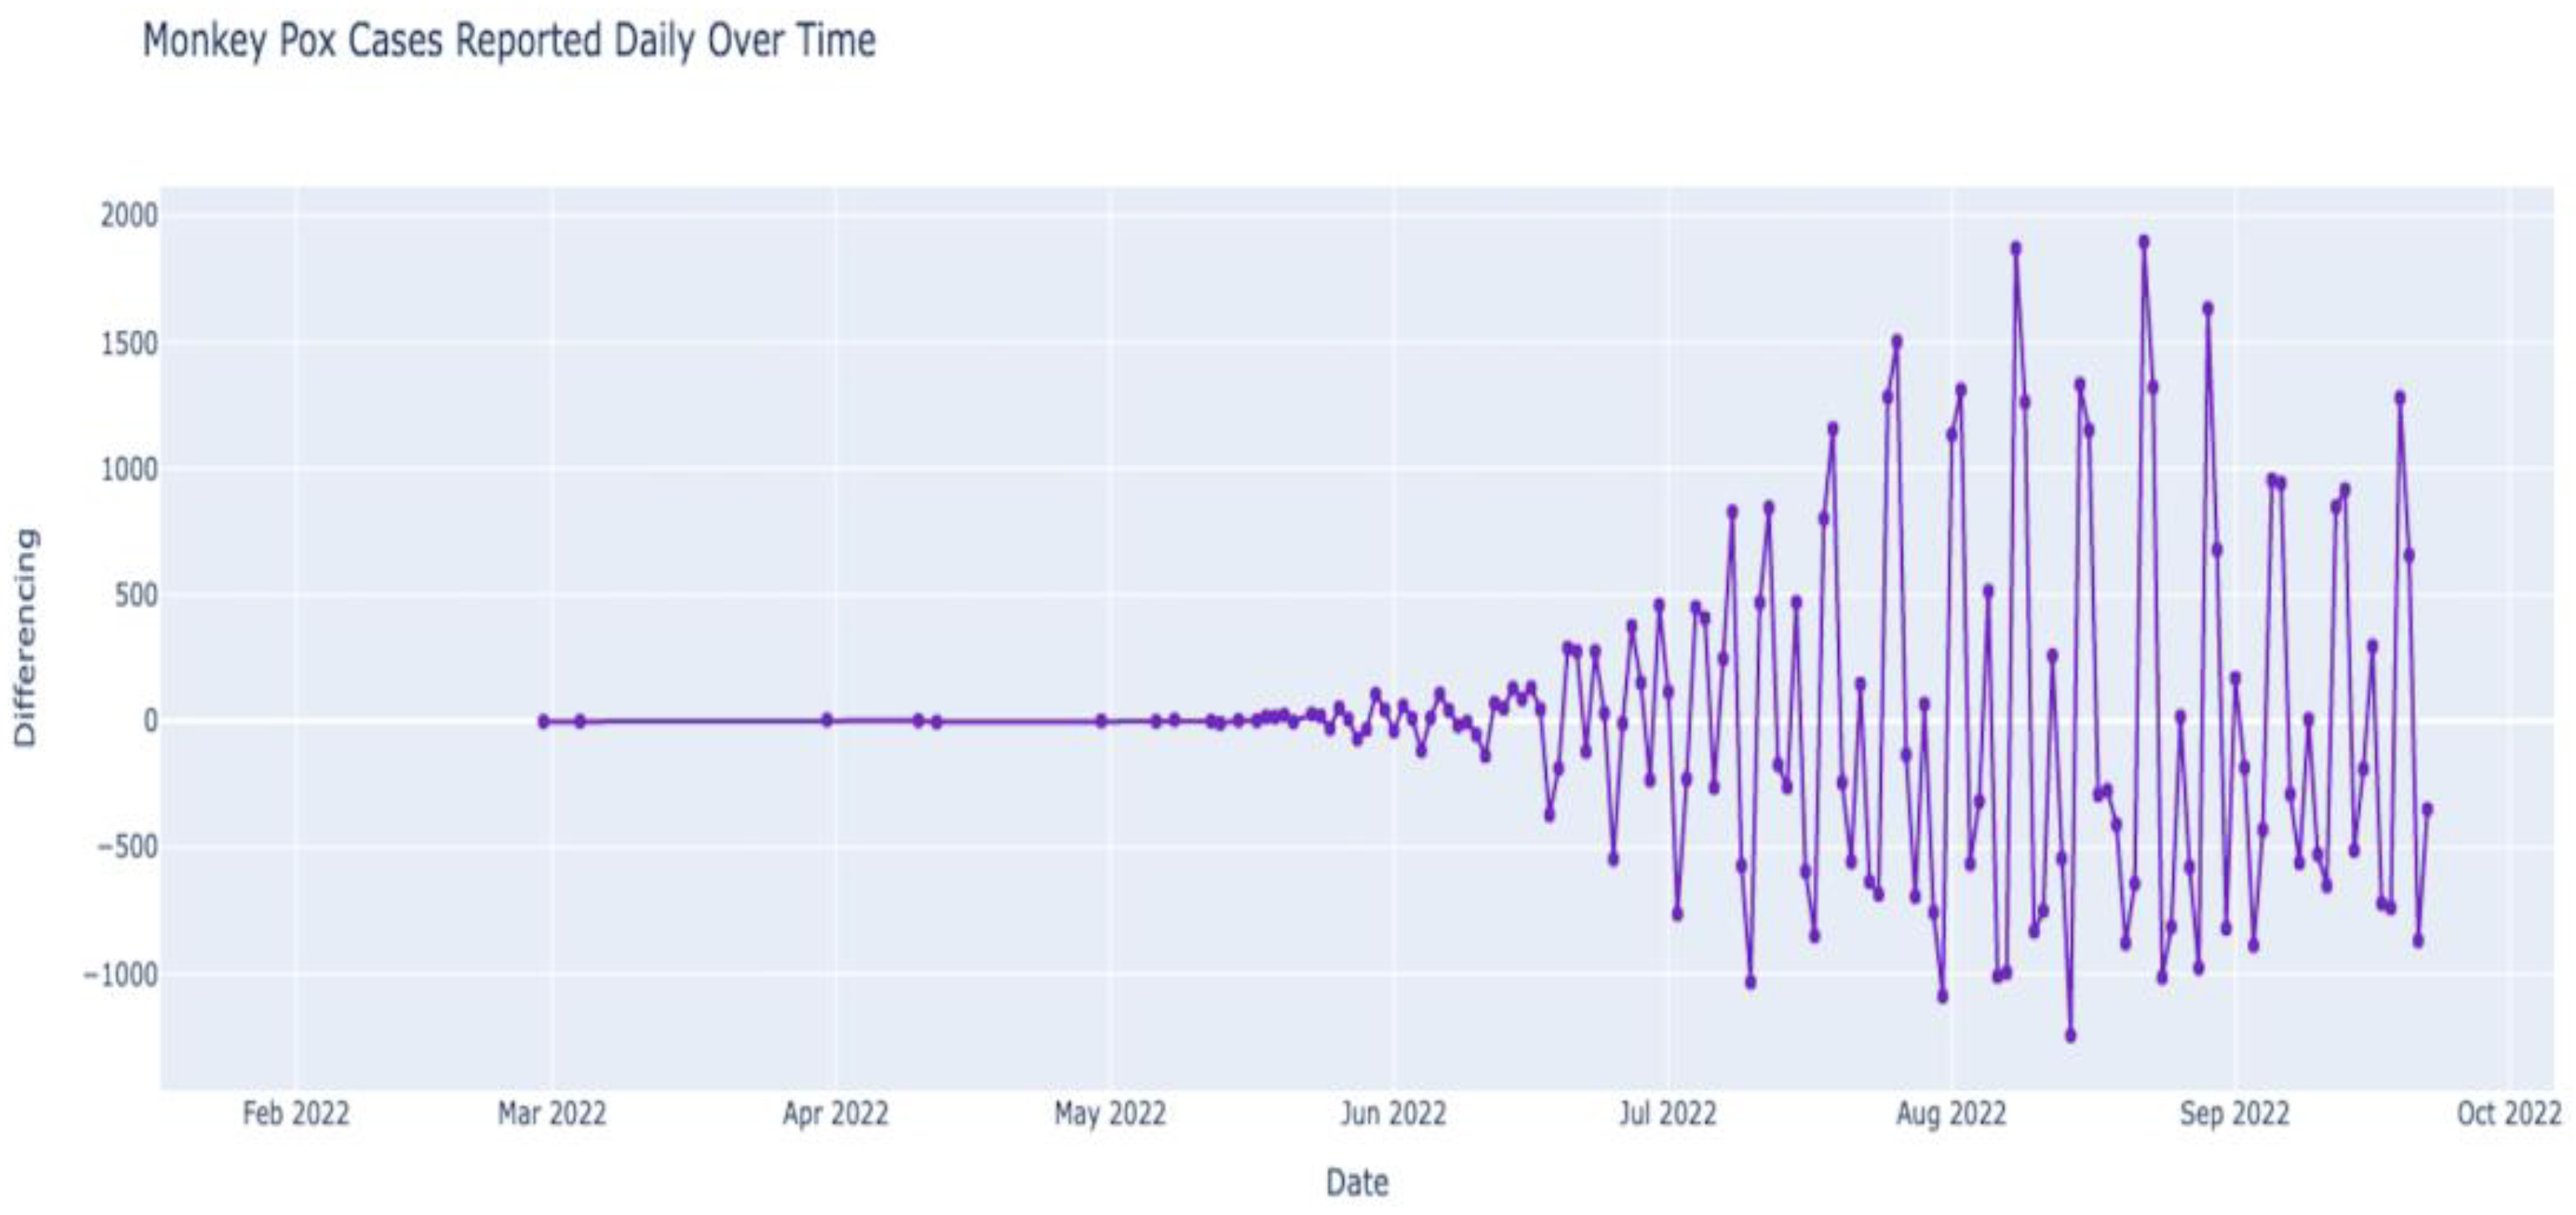
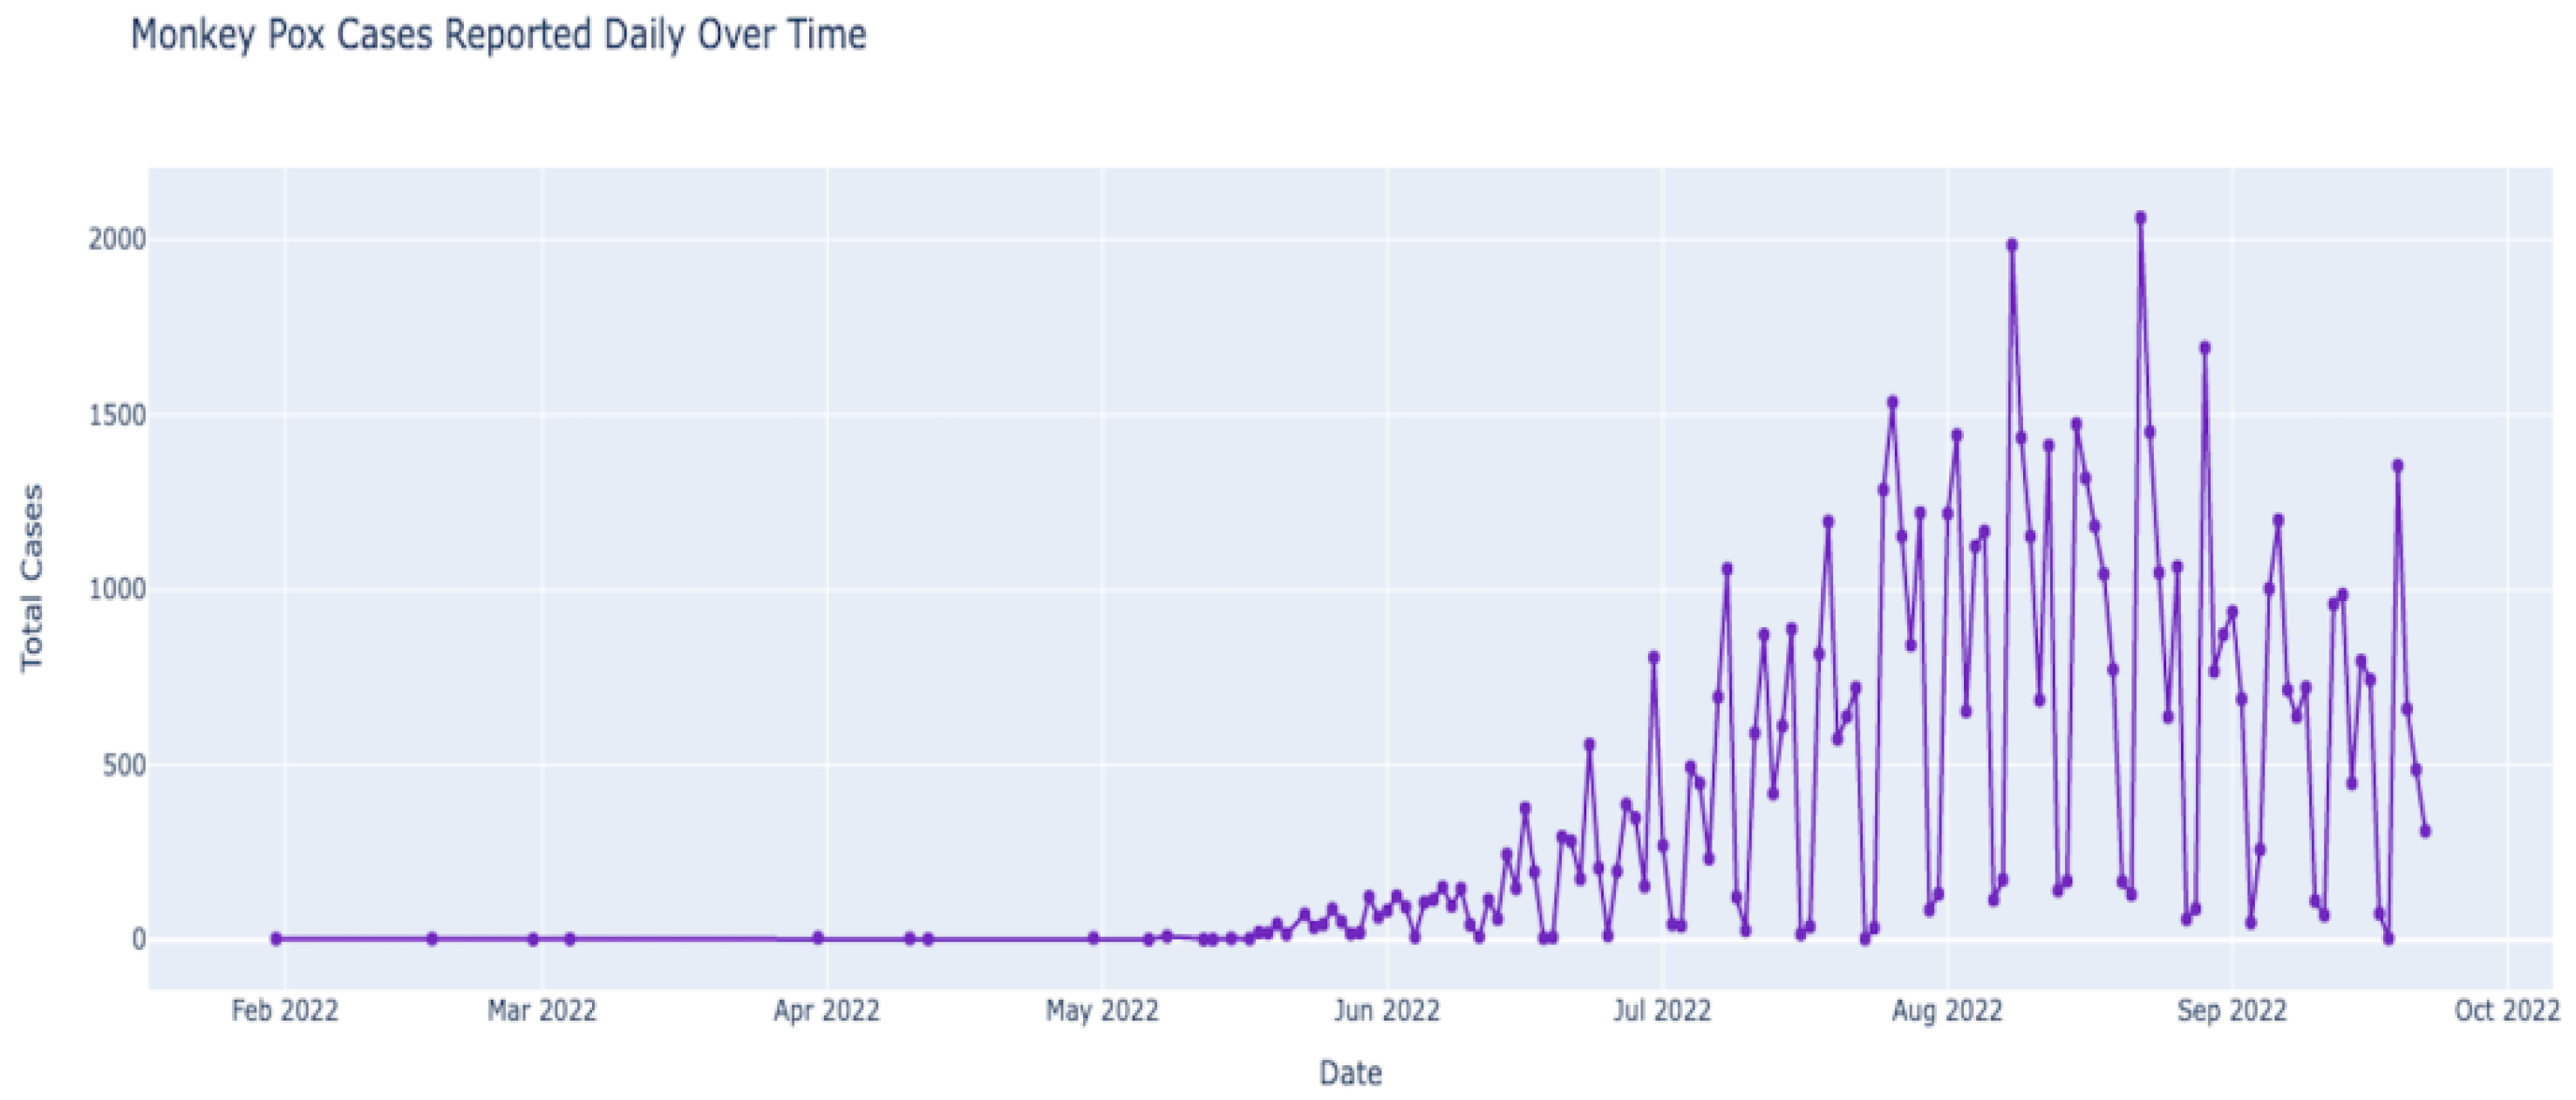
4.2.3. Time Series Analysis
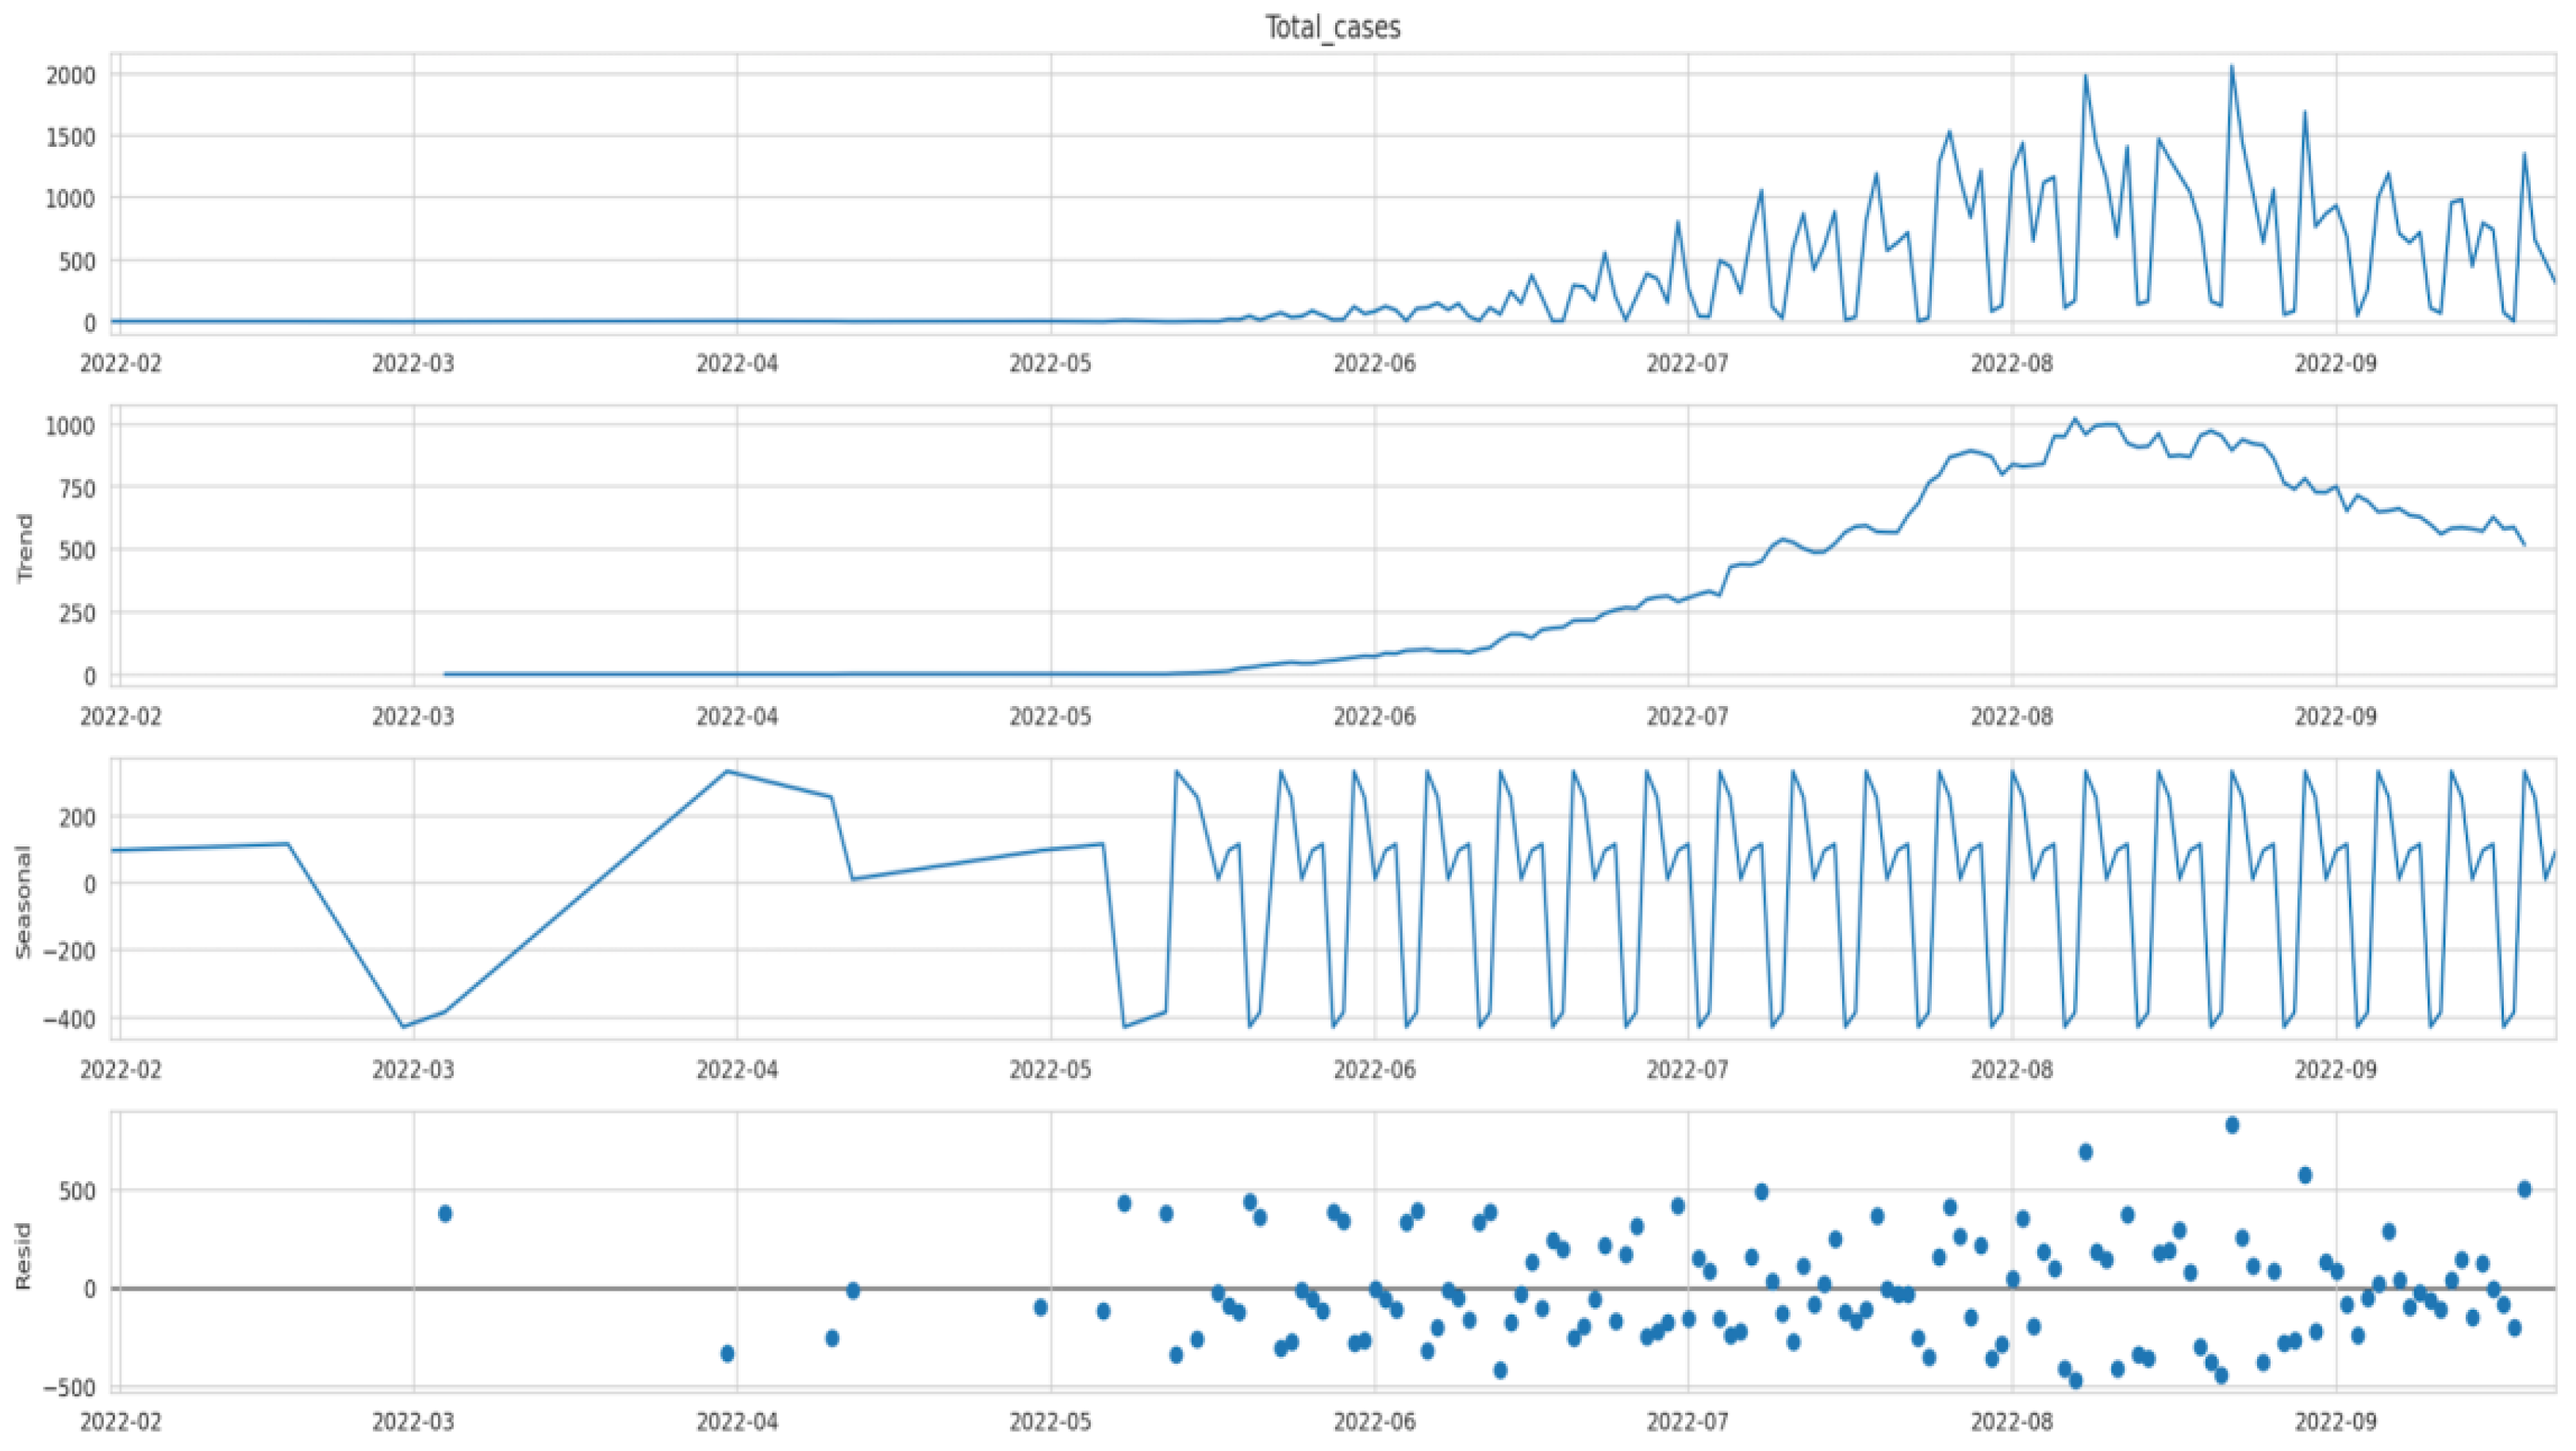
Figure 9 depicts the outbreak of monkeypox over the last few months (February 2022–October 2022). We observe that the number of cases was almost constant in the first few months of 2022 until the first few cases were observed after May 2022. While the numbers were still low in May 2022, after June, the numbers increased steadily. The number of cases in July was higher than in June, and the number in August seemed higher than in July. Now that we have data regarding monkeypox cases over time (time series data), we can deconstruct the data to understand the data’s nature better. The data can be deconstructed into various components to analyze the hidden patterns and categories. After deconstruction, we obtain our data’s trend, seasonal, and residual components (see
Figure 10).
Figure 10 shows that the seasonal component of our time series data has regular cycles over time. Hence, due to seasonality, we assert that time series data are non-stationary. The non-stationarity of data needs to be validated using statistical analysis. We rely on the augmented Dickey–Fuller Test for this. To validate the test, we need to observe whether it is a null hypothesis (not stationery) or an alternative hypothesis (stationery). For the data to be stationary, the
p-value should be less than or equal to 0.05. The
p-value is used for measuring the probability of acquiring the observed results considering that the null hypothesis is true. Lower
p-values demonstrate greater statistical significance. Hence, a
p-value of 0.05 or lower denotes statistical significance.
While performing the test, we obtained a p-value of 0.82259. As the p-value is higher than 0.05, the time series data are non-stationary. Non-stationery data denote that the statistical properties are changing through time. Since stationarity tremendously influences how data are analyzed or predicted, it is necessary to convert non-stationary data into stationery data. Stationery time series incorporate statistical properties, such as mean and variance, that do not vary in time and can provide a better analysis. We converted non-stationary data into stationery data using the concept of differencing.
Differencing leads to the transformation of the series to a new form such that the series’ dependence on time is eliminated. Using this technique, we found the difference between current and previous-day cases. Since we calculated the difference only once, the differencing was d = 1. Once the differencing was applied, the value of
p was found to be 0.03607, which is less than 0.05, indicating that the data have become stationary.
Figure 11 depicts the new time series with the eliminated seasonal components.
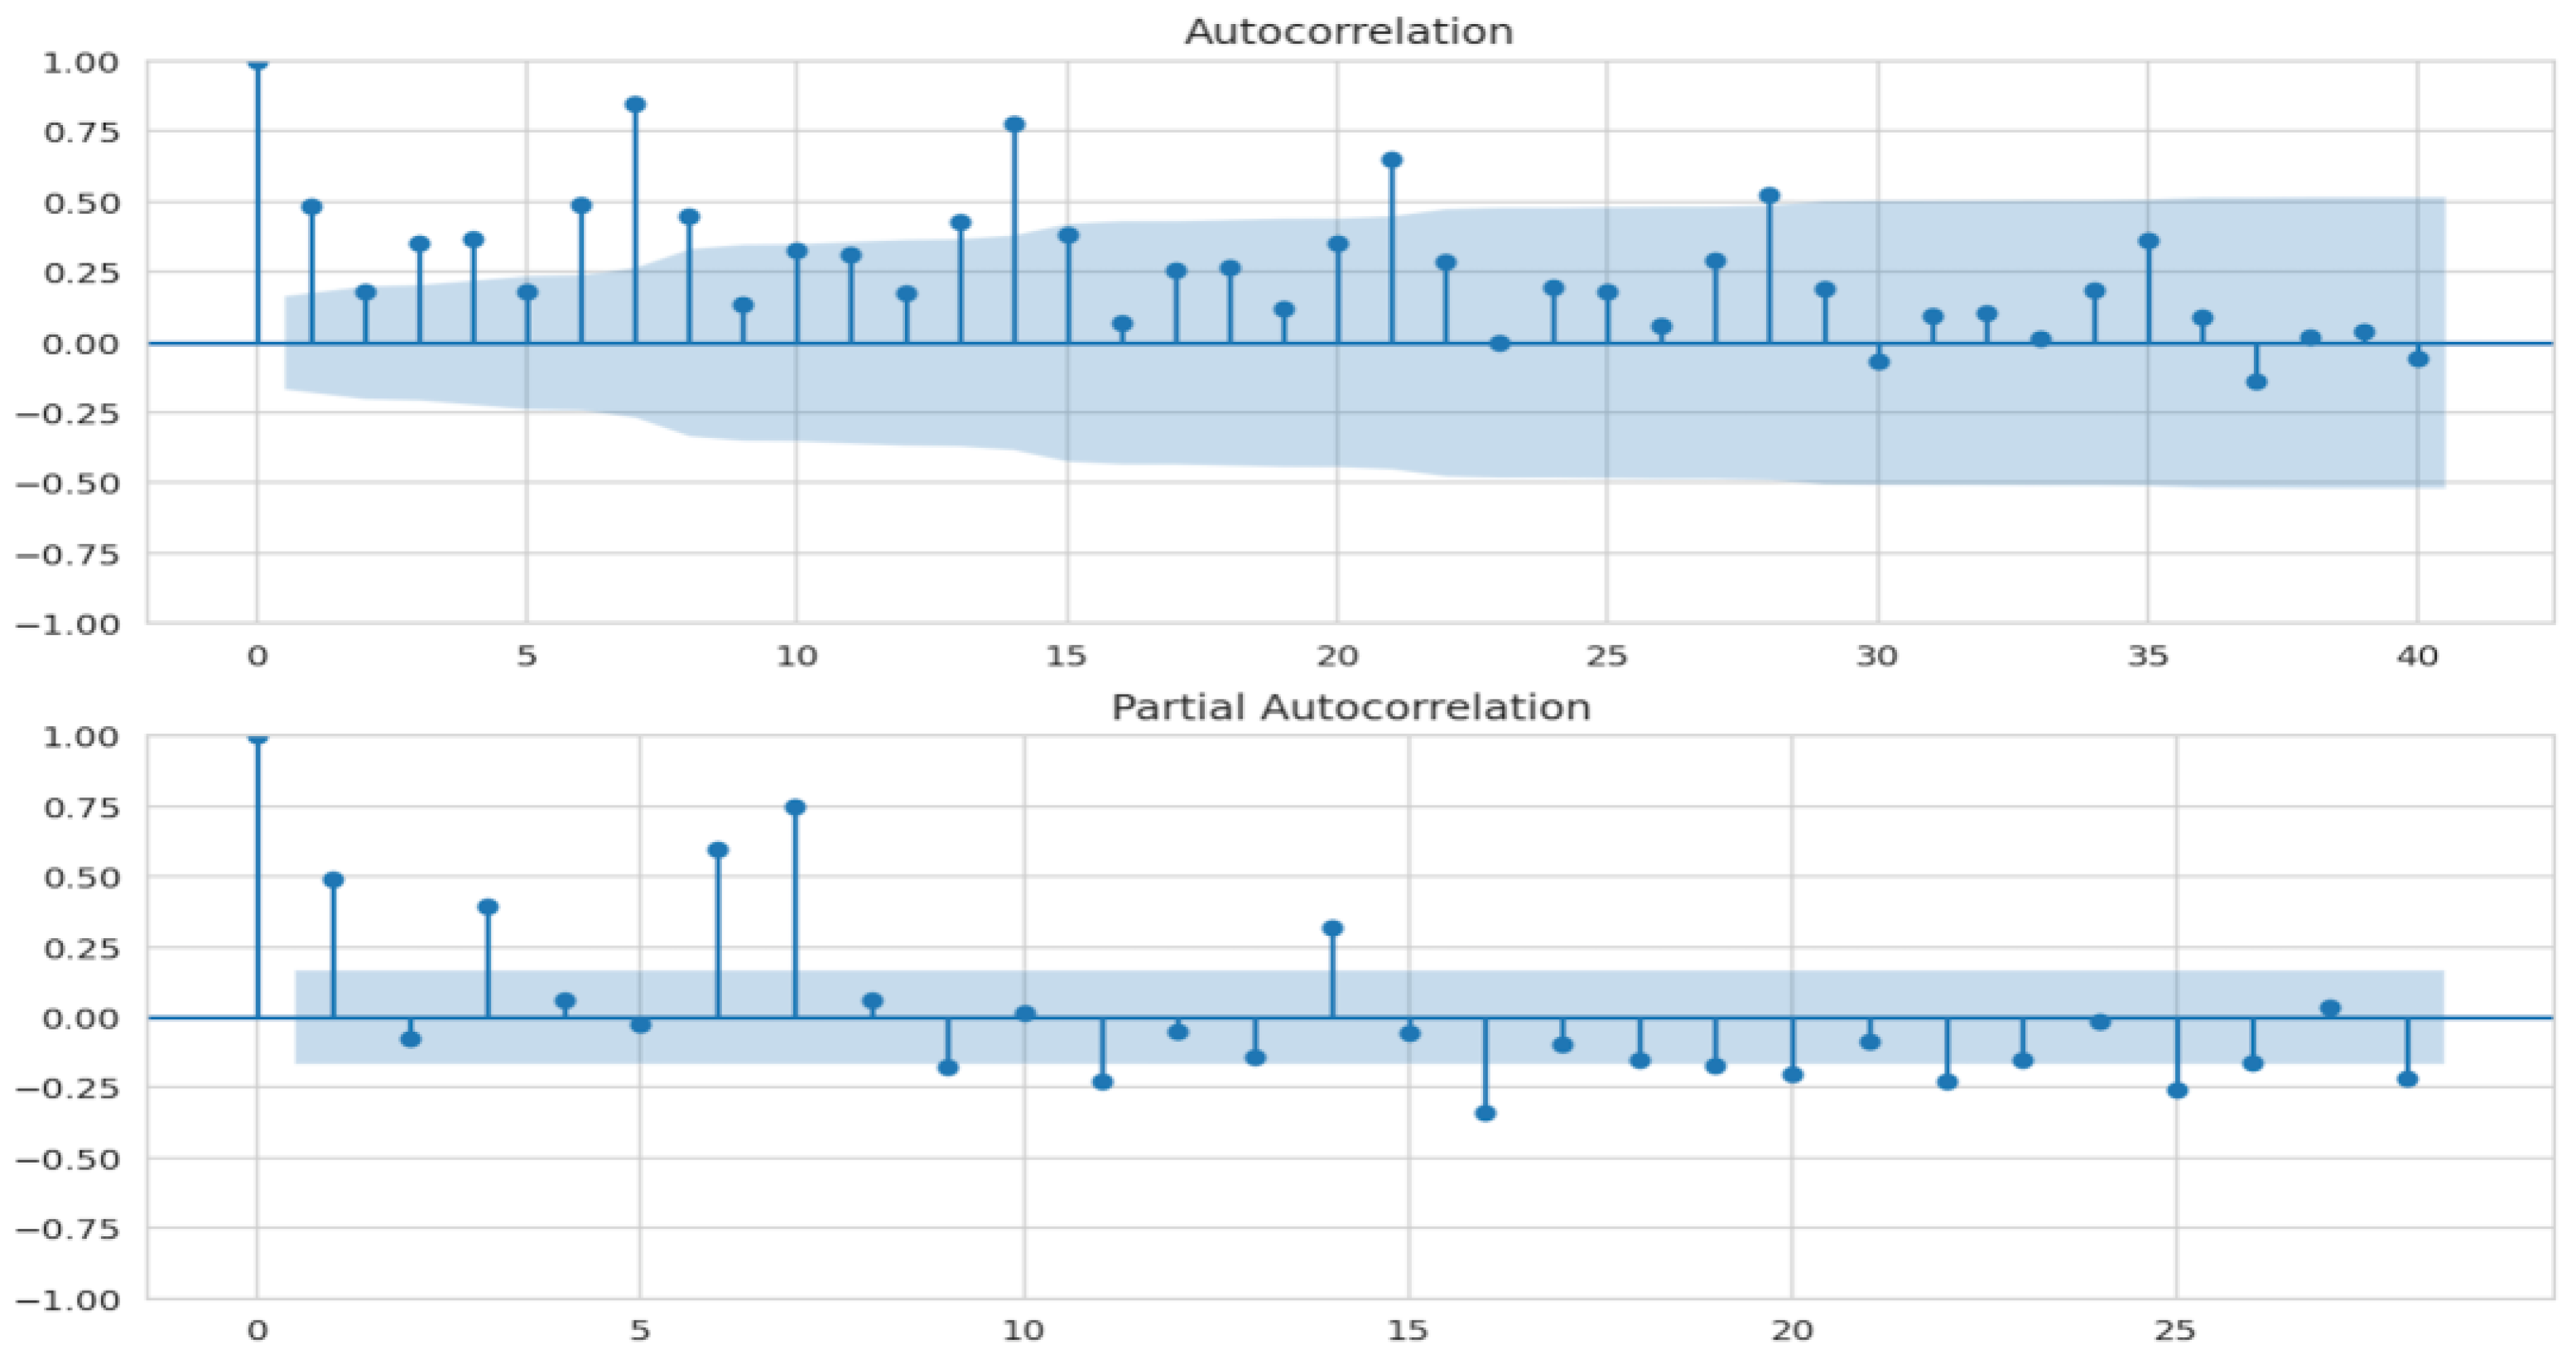
Once the new time series is established, we deploy the ARIMA model on the new data. The ARIMA model relies on three parameters, i.e., d,
p, and q, where d is the number of nonseasonal differences for obtaining stationarity, p is the number of autoregressive terms, and q is the number of lagged forecast errors in prediction. The value of d is d = 1 from differencing technique. To obtain the values of q and p, we need to analyze the autocorrelation function (ACF) plot and the partial autocorrelation function (PACF) plot, respectively.
Figure 12 shows that q and
p are 7 and 9, respectively. Once we deployed the ARIMA model using the values and the new data, we obtained the Akaike information criterion (AIC) value and the Bayesian information criterion (BIC) value as 1437.86 and 1482.65, respectively. These values are used to evaluate model performance.
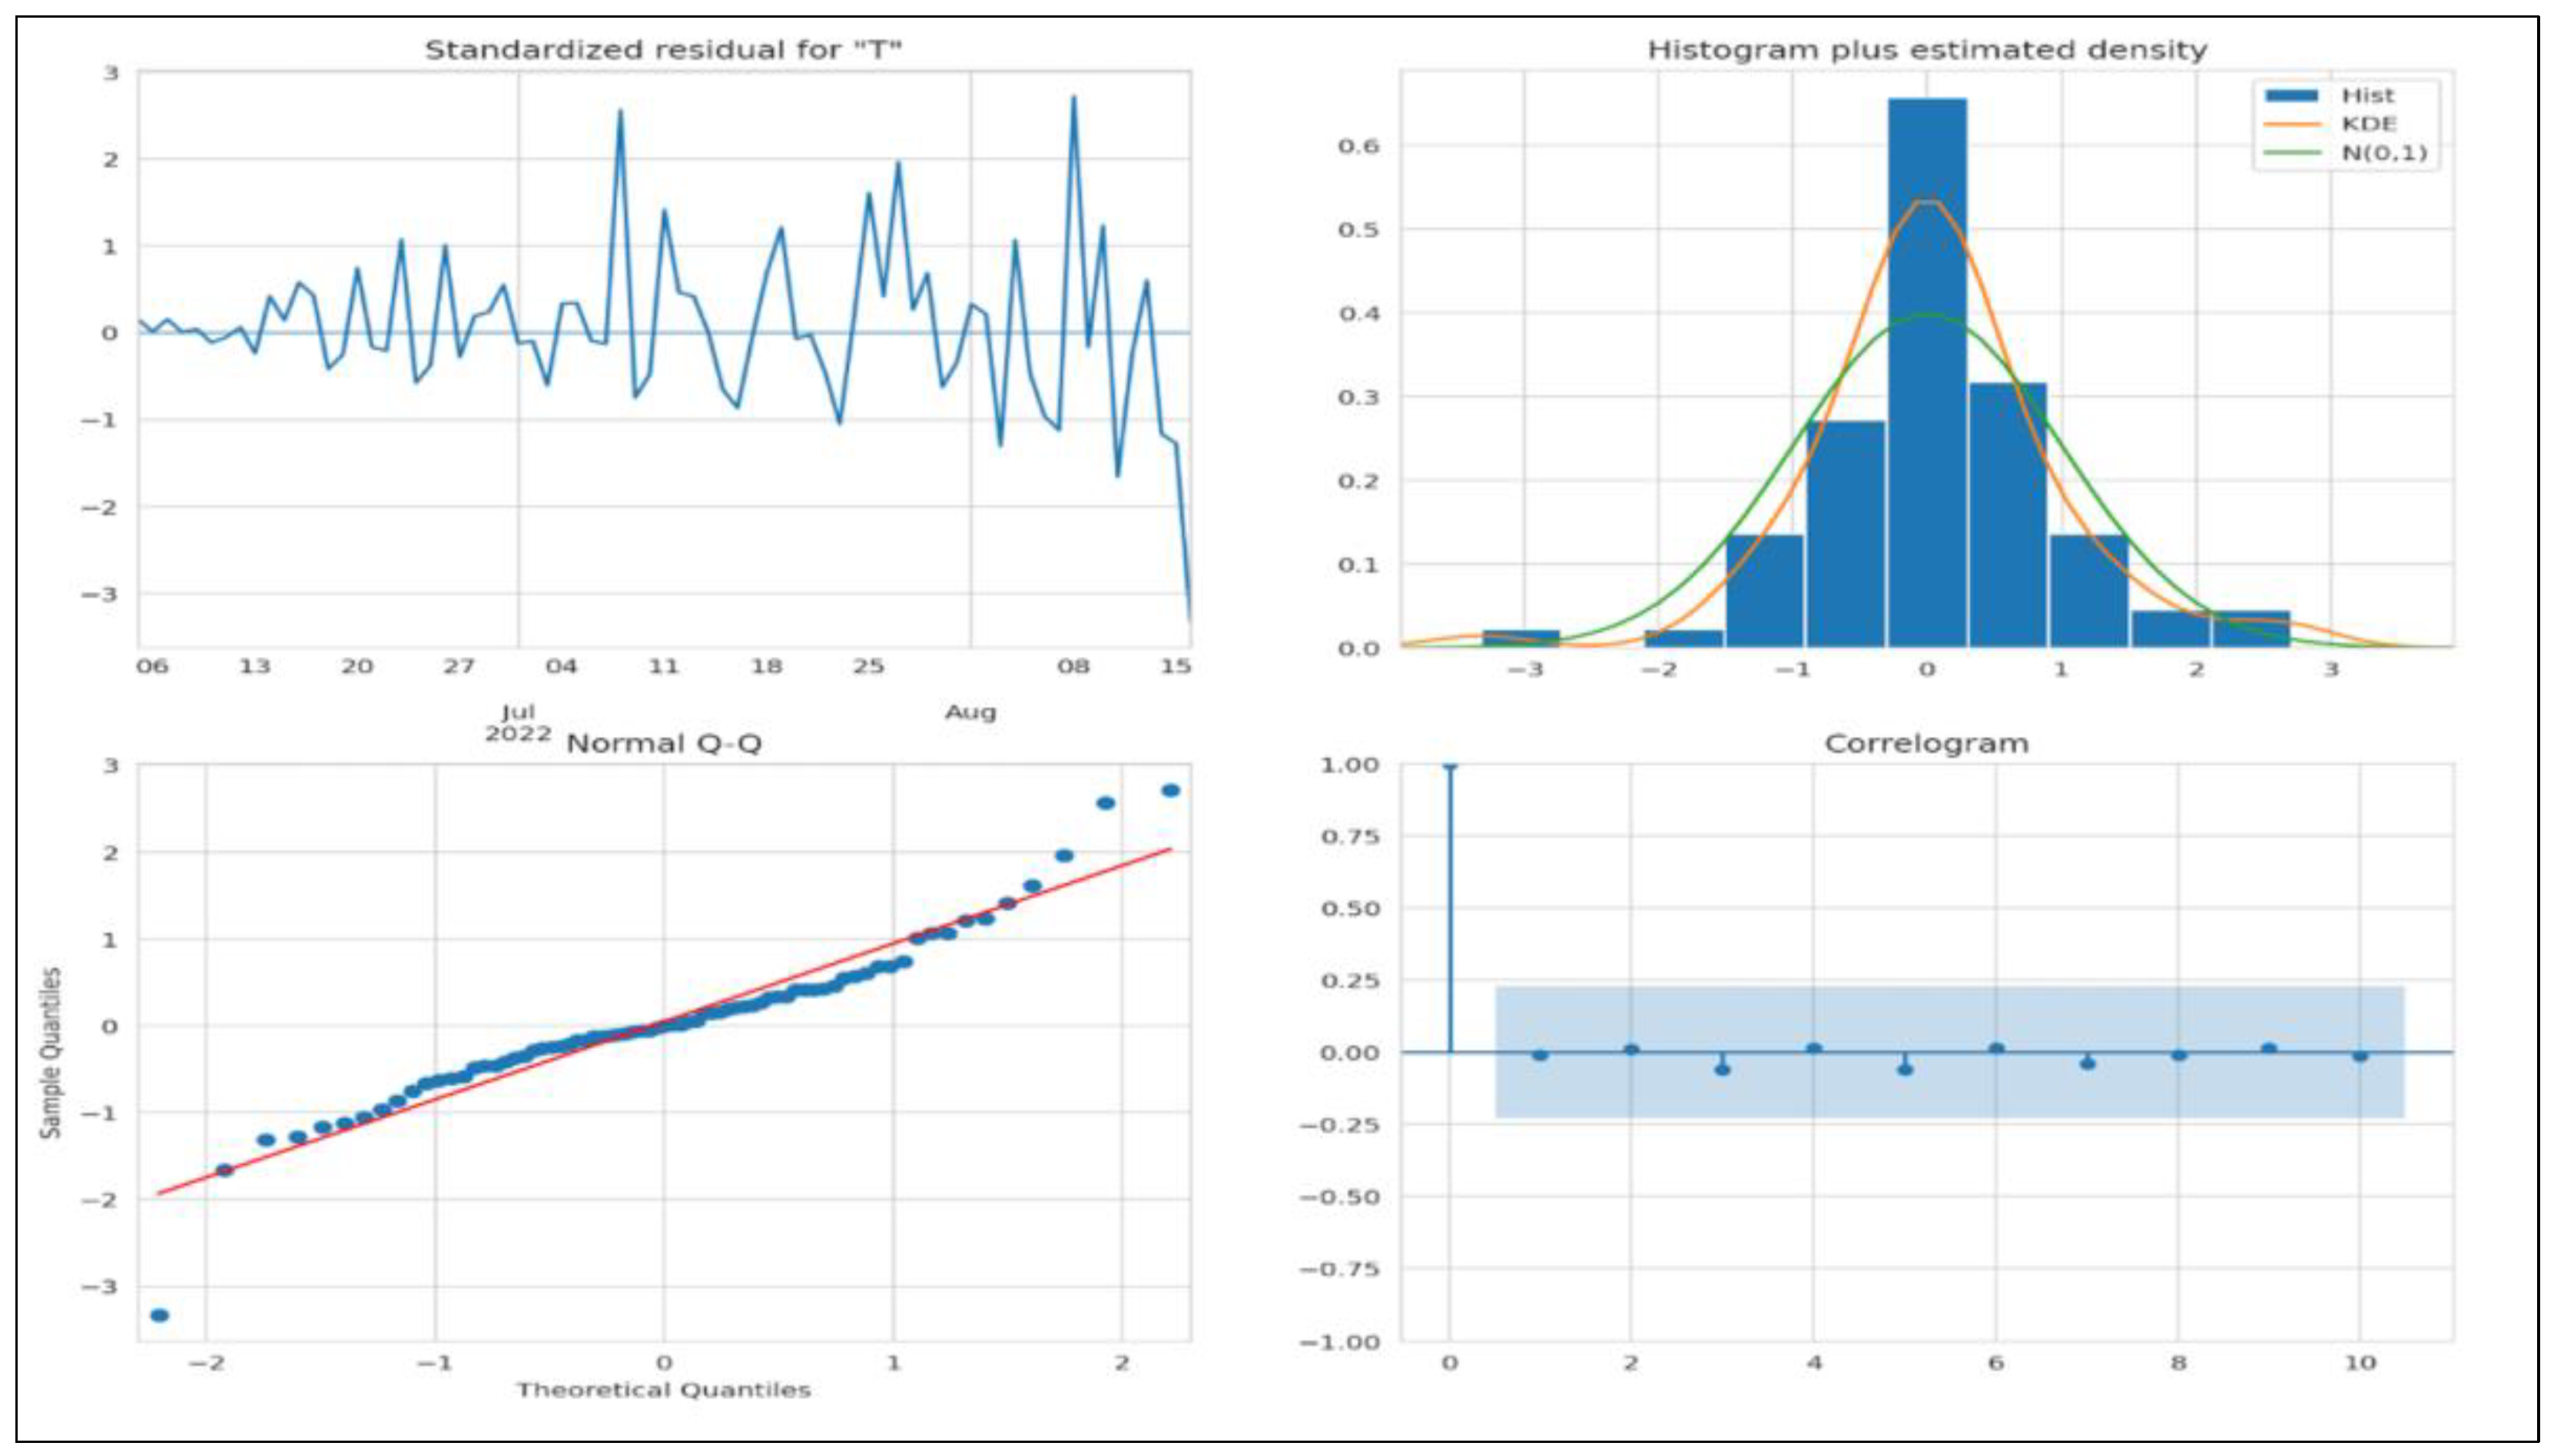
We must evaluate a few criteria to assert that the model is a good fit. The residuals must not have any patterns; therefore, the mean must be zero, and the variance must be uniform. The kernel density estimate (KDE) plot is used to visualize the data distribution and should be similar to the normal distribution. The points fall on a 45-degree reference line if the data are normally distributed. The normal Q-Q plot (see
Figure 13) indicates univariate normality. Hence, the data points must be in a straight line. In the ACF plot, if data points lie outside the confidence band, they are statistically significant. Our study shows only a few data points lie outside the band, which shows that the model may require additional parameters for better accuracy.
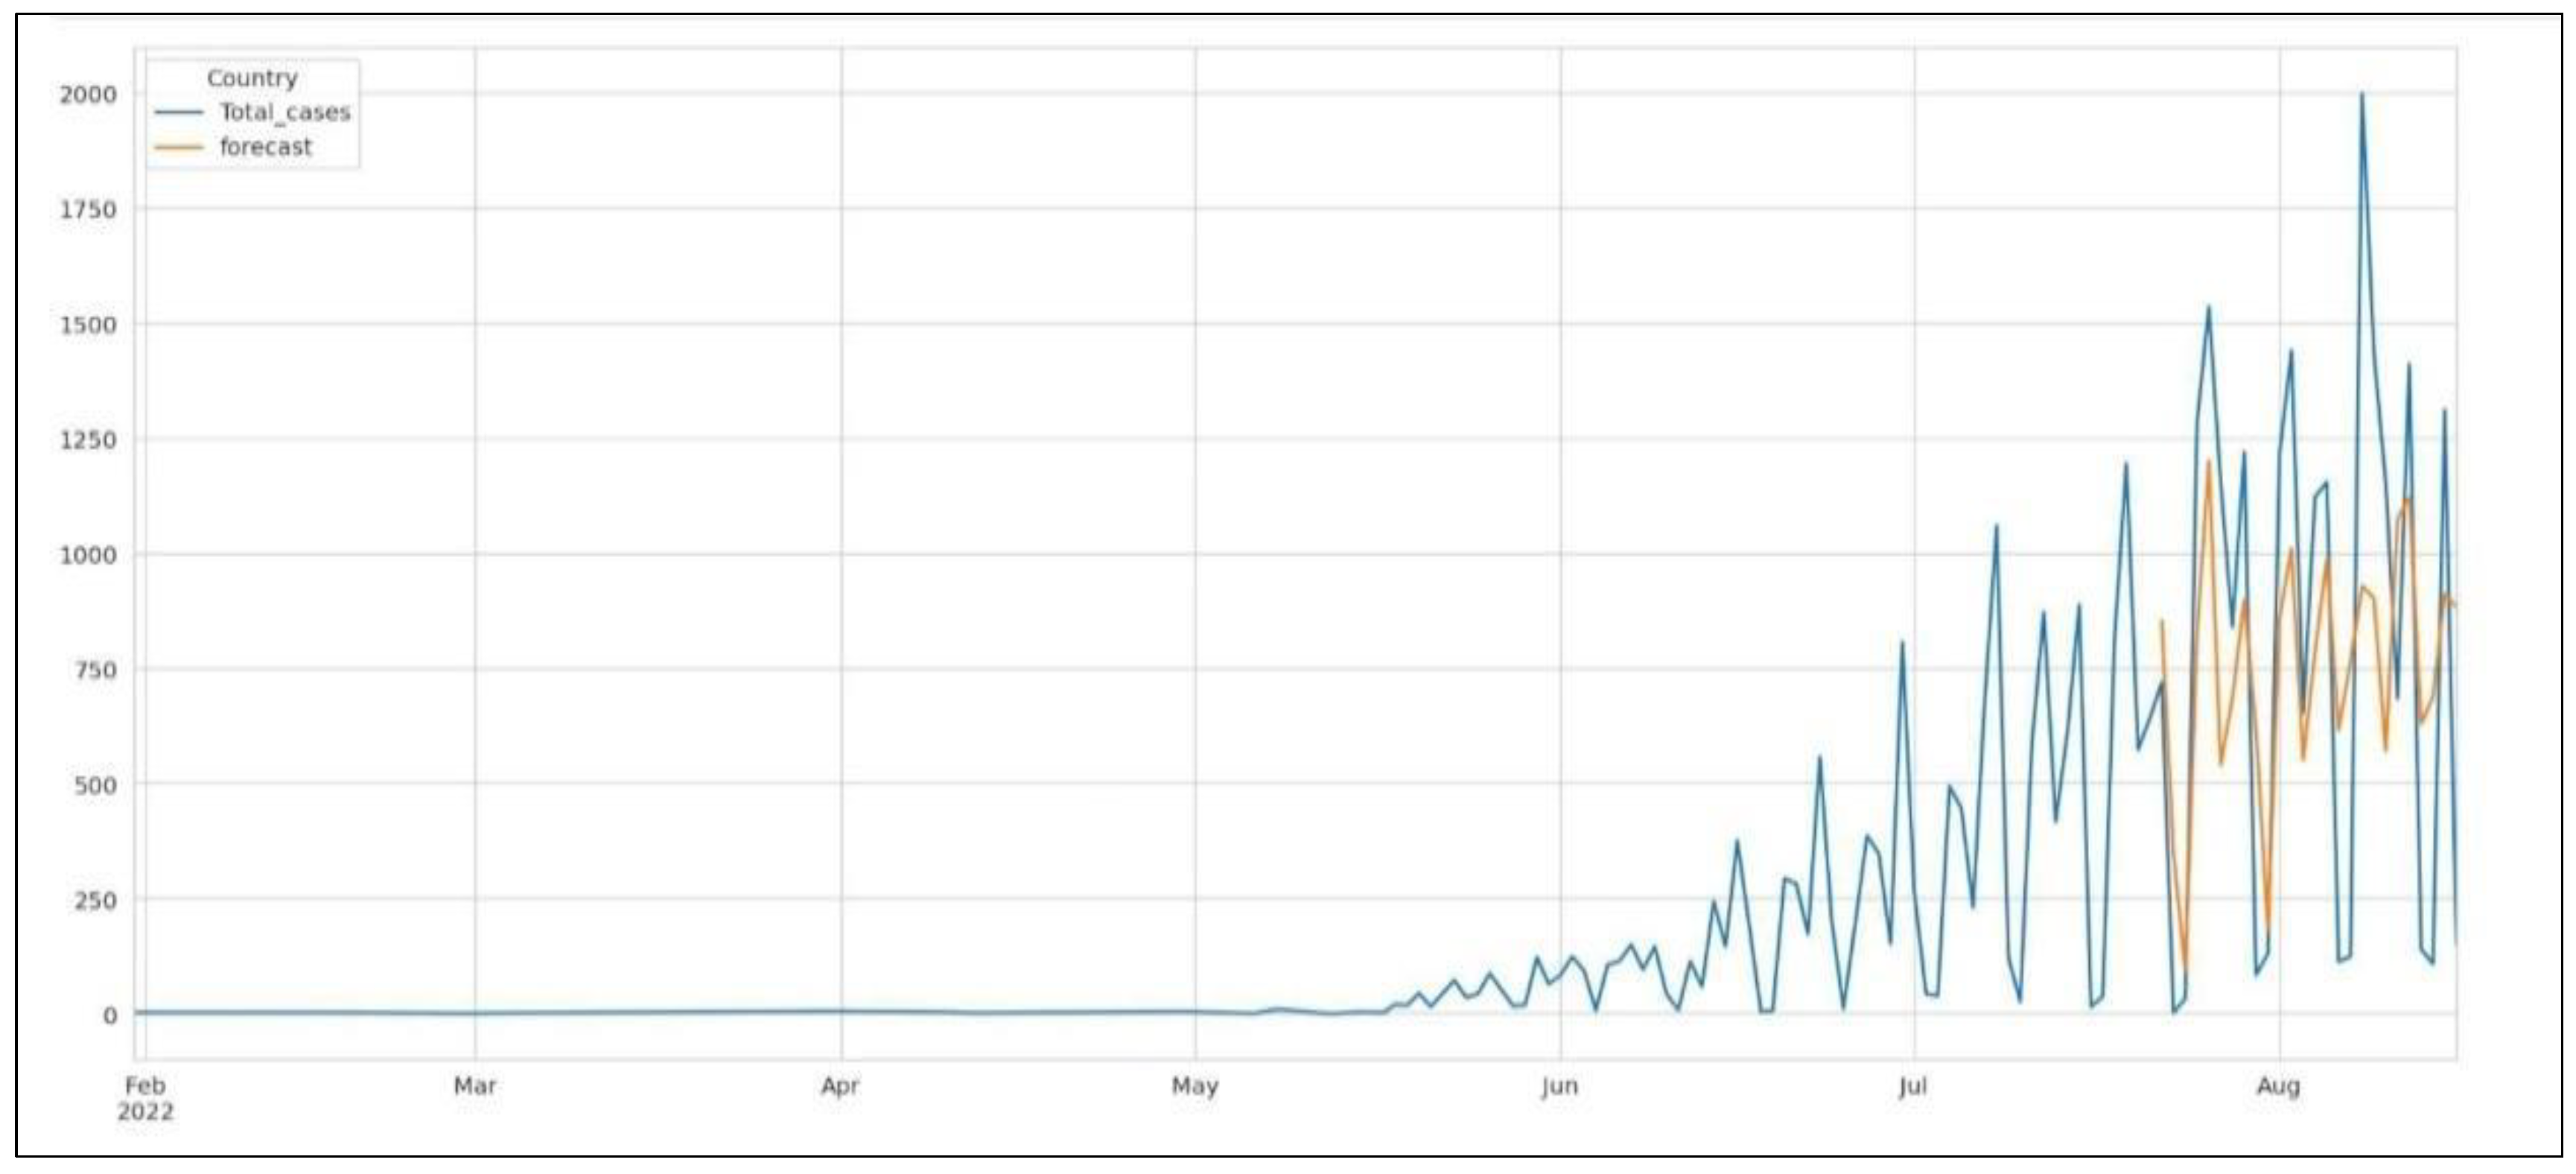
Figure 14 depicts the deployed ARIMA model on the test set. The forecast is lower than the actual number of cases, thus indicating that more parameters may be needed for better accuracy, which we have already established from the ACF plot in
Figure 13.
We deployed the SARIMA model on the same dataset, as it is much more efficient in handling seasonal data. The SARIMA model incorporates parameters P (number of autoregressive terms), D (number of non-seasonal differences for obtaining stationarity), Q (number of lagged forecast errors in prediction), and S (seasonal length of data). We obtain P = 5, Q = 7, D = 1, and S = 30. Based on the analysis, the AIC and BIC values are 1079.98 and 1137.24, respectively.
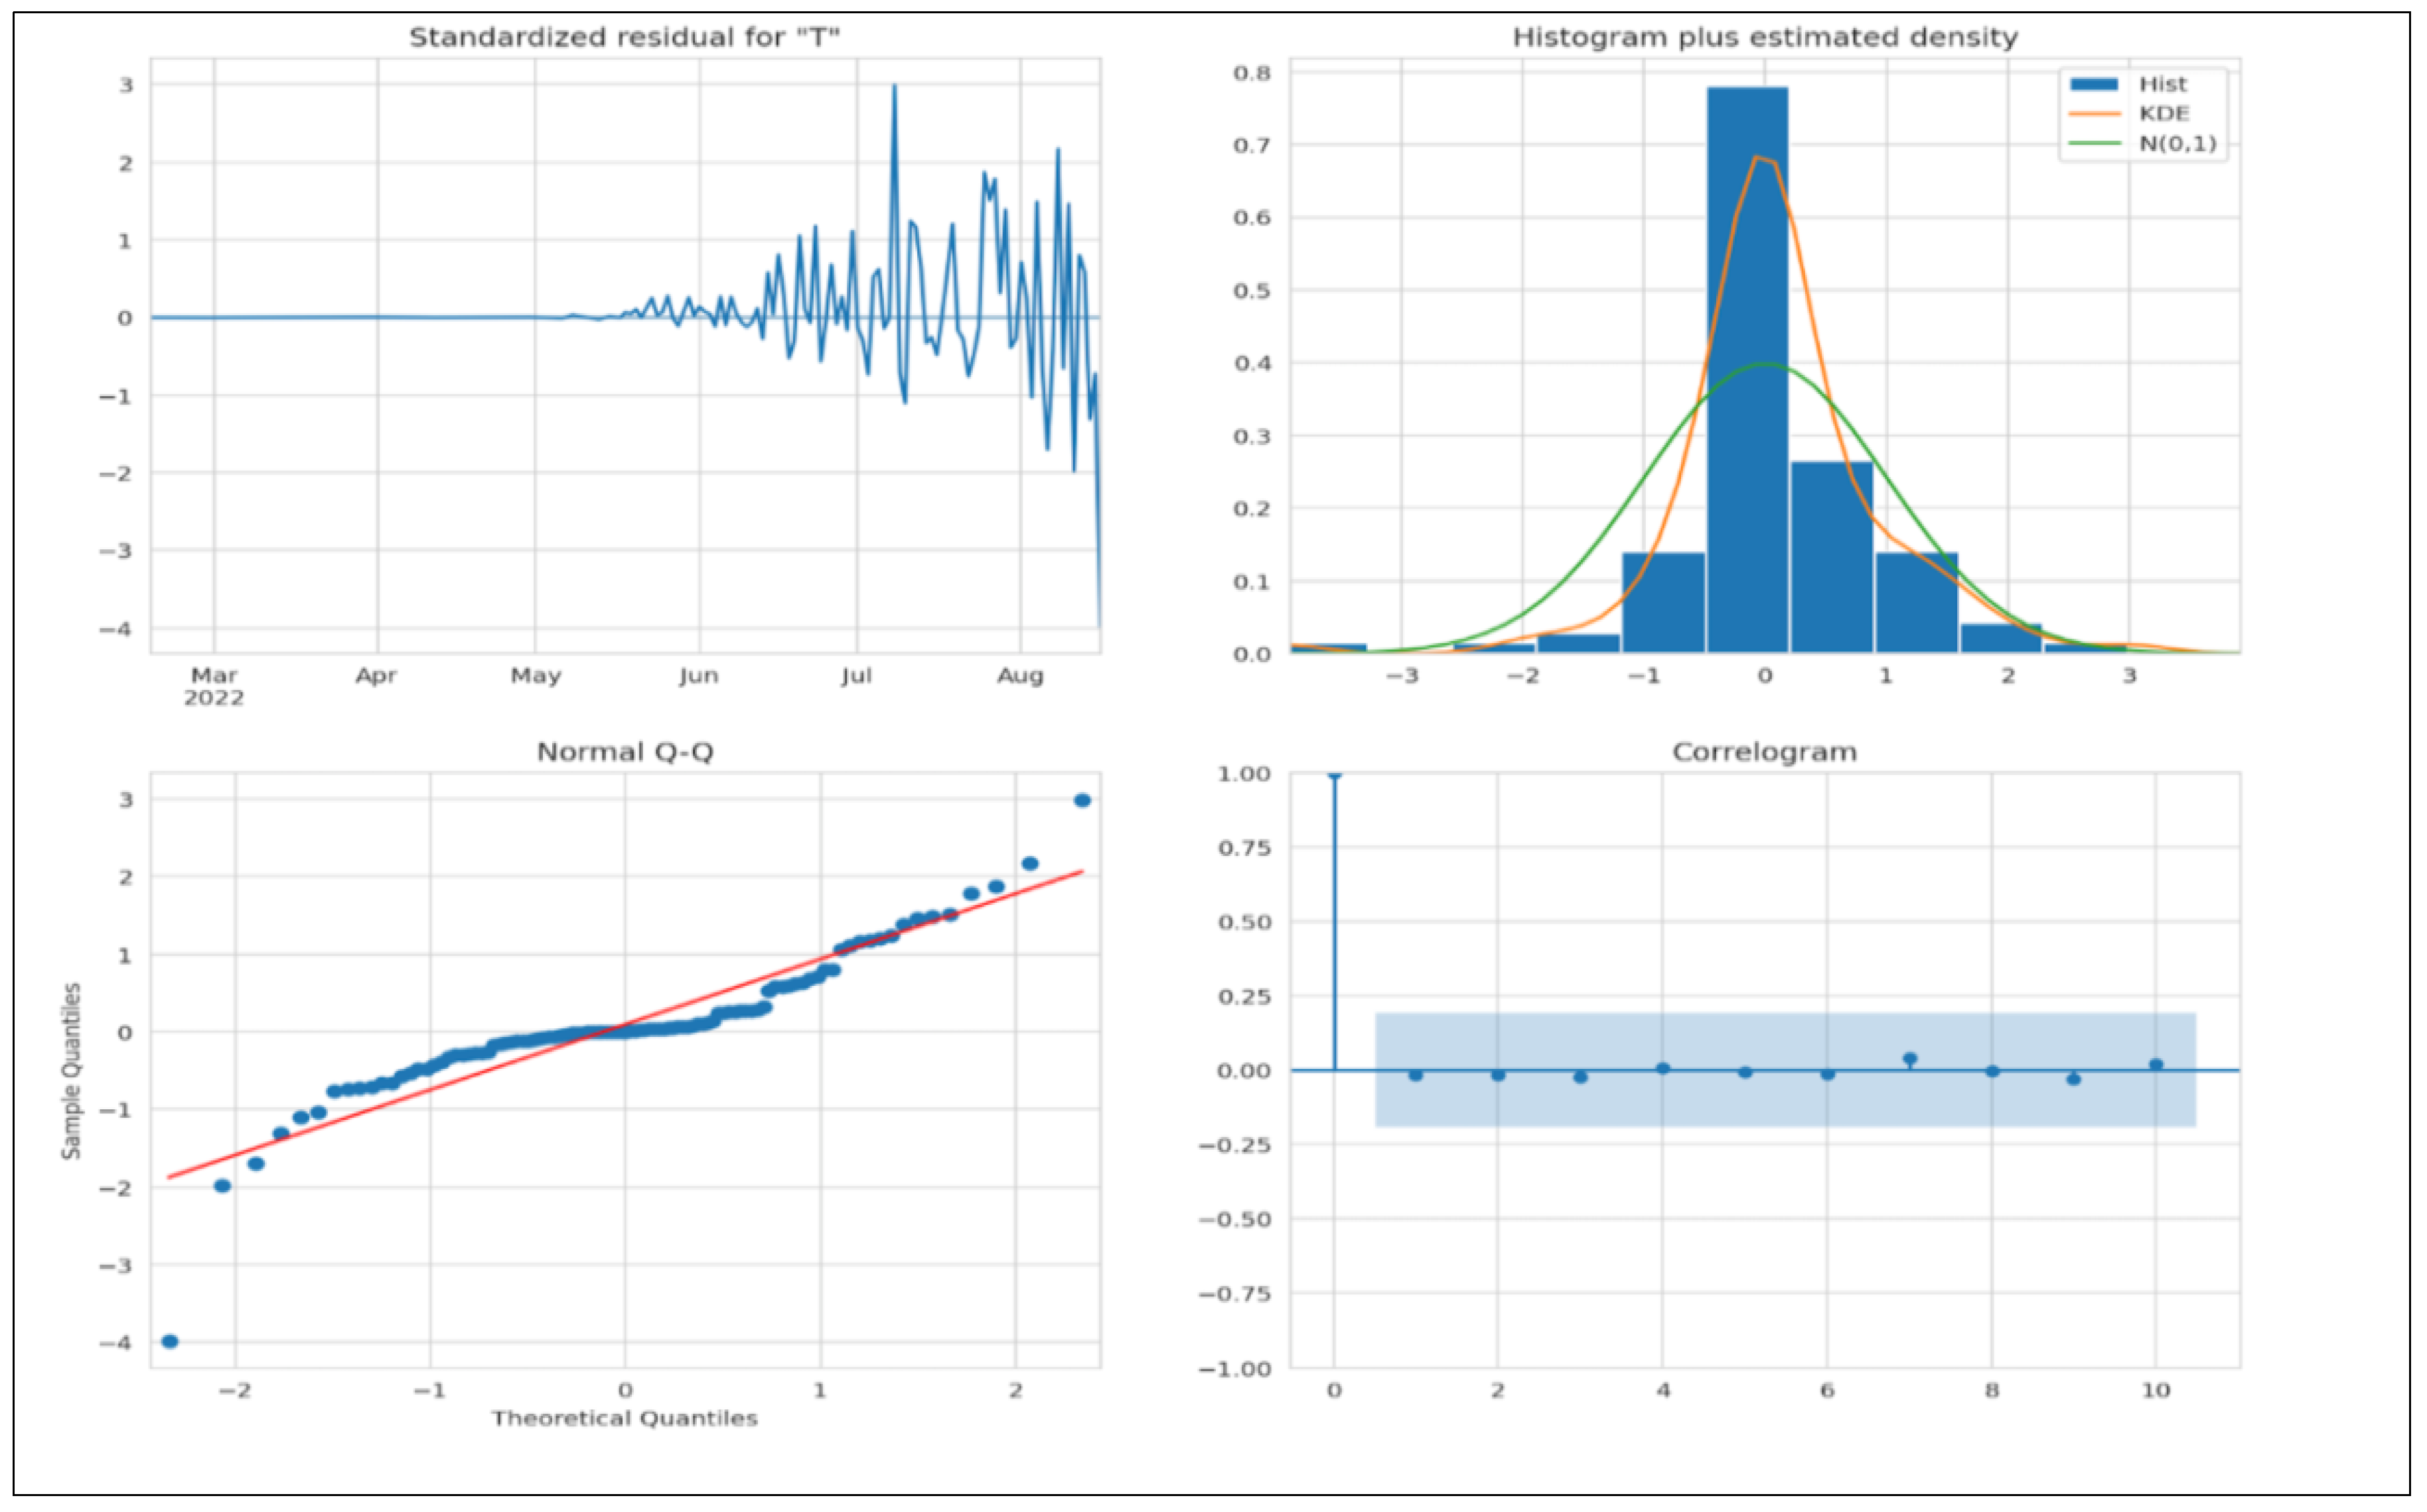
Figure 15 denotes all the criteria to determine whether the model fits. We do not see any obvious patterns, the KDE looks similar to a normal distribution, and the normal Q-Q plot looks good as most data points lie on a straight line. In the ACF plot, if data points lie outside the confidence band, they are statistically significant. Our study shows only a few data points outside the band, which shows that the model may require additional parameters for better accuracy.
Figure 16 depicts the deployed SARIMA model on the test set. The forecast is lower than the actual number of cases, thus indicating that more parameters may be needed for better accuracy, which we have already established from the ACF plot in
Figure 15.
4.3. Comparative Analysis
In this section, we present a comparative analysis of our proposed work with some previous related research works.
Table 4 presents a comparative analysis depicting our findings.
Table 4 presents a comparative analysis of our proposed work concerning some of the previous related research works. Most of the research works performed in the past are related to clinical trials and case studies. Our research focuses on the machine learning aspect of the study. The analysis has been performed in several ways, i.e., traditional machine learning methods, neural networks, and time series analysis, thereby highlighting the novelty of the research.
4.4. Discussions
In this section, we discuss three aspects of the study, i.e., the study’s main contributions, the key findings associated with the overall analysis, and the study’s limitations. The study’s main contributions are as follows:
Compared to the previous research, this study provides an interesting analysis of the monkeypox outbreak by deploying machine learning techniques;
This study deploys three different types of machine learning methods, i.e., traditional machine learning methods, such as linear regression, decision trees, random forests, and elastic net regression, and neural networks, such as artificial neural networks and convolutional neural networks;
The study also incorporates a time-series-based analysis using two different models, ARIMA and SARIMA;
The study performs extensive data visualization to find patterns in data for making inferences.
The key findings of the research are as follows: based on the analysis, the maximum number of confirmed cases is in the United States, followed by Spain and Germany. The United States has the maximum number of patients with a travel history, and Portugal has the maximum number of patients without a travel history. This implies that Portugal could be the origin of the outbreak. Patients’ most observed symptoms are fever, rashes, and genital ulcer lesions. Muscle pain is observed in fewer patients. Based on the correlation matrix, people with a travel history correlate positively with hospitalization, and hospitalized cases correlate with confirmed cases. The maximum number of cases belongs to people in the age group between 40 years to 50 years.
Machine learning analysis shows that CNNs perform better than other models. The evaluation is based on MAE, MSE, MAPE, and R2. Time-series analysis shows that the performances of ARIMA and SARIMA models are satisfactory.
The study’s limitations are as follows: data availability is limited, i.e., the total number of observations and the features in the dataset is insufficient for an extensive analysis. As was observed in time series analysis, in the ACF plot, if data points lie outside the confidence band, they are statistically significant. Our study shows only a few data points outside the band, which shows that the model may require additional parameters for better accuracy.


