Article

A Ranking Learning Model by K-Means Clustering Technique for Web Scraped Movie Data

1
Department of Computer Science, American International University Bangladesh, 408/1, Kuratoli, Khilkhet, Dhaka 1229, Bangladesh
2
Business Administration Department, Jumeira University, Latifa Bint Hamdan Street (West), Exit Number 24, Al Khail Road, Dubai P.O. Box 555532, United Arab Emirates
3
Department of Computing and IT, Global College of Engineering and Technology, Muscat 112, Oman
4
Department of Information Technology, School of Science and Engineering, Malaysia University of Science and Technology, Petaling Jaya 47810, Selangor, Malaysia
5
Department of Computing, Middle East College, Knowledge Oasis Muscat, P.B. No. 79, Al Rusayl 124, Oman
6
Department of Informatics, University Malaysia Terengganu, Kuala Terengganu 21030, Terengganu, Malaysia
*
Authors to whom correspondence should be addressed.
Computers 2022, 11(11), 158; https://doi.org/10.3390/computers11110158
Submission received: 14 September 2022 / Revised: 27 October 2022 / Accepted: 31 October 2022 / Published: 8 November 2022

Abstract

:
Business organizations experience cut-throat competition in the e-commerce era, where a smart organization needs to come up with faster innovative ideas to enjoy competitive advantages. A smart user decides from the review information of an online product. Data-driven smart machine learning applications use real data to support immediate decision making. Web scraping technologies support supplying sufficient relevant and up-to-date well-structured data from unstructured data sources like websites. Machine learning applications generate models for in-depth data analysis and decision making. The Internet Movie Database (IMDB) is one of the largest movie databases on the internet. IMDB movie information is applied for statistical analysis, sentiment classification, genre-based clustering, and rating-based clustering with respect to movie release year, budget, etc., for repository dataset. This paper presents a novel clustering model with respect to two different rating systems of IMDB movie data. This work contributes to the three areas: (i) the “grey area” of web scraping to extract data for research purposes; (ii) statistical analysis to correlate required data fields and understanding purposes of implementation machine learning, (iii) k-means clustering is applied for movie critics rank (Metascore) and users’ star rank (Rating). Different python libraries are used for web data scraping, data analysis, data visualization, and k-means clustering application. Only 42.4% of records were accepted from the extracted dataset for research purposes after cleaning. Statistical analysis showed that votes, ratings, Metascore have a linear relationship, while random characteristics are observed for income of the movie. On the other hand, experts’ feedback (Metascore) and customers’ feedback (Rating) are negatively correlated (−0.0384) due to the biasness of additional features like genre, actors, budget, etc. Both rankings have a nonlinear relationship with the income of the movies. Six optimal clusters were selected by elbow technique and the calculated silhouette score is 0.4926 for the proposed k-means clustering model and we found that only one cluster is in the logical relationship of two rankings systems.

1. Introduction

Artificial intelligence (AI), machine learning (ML), or data science applications are mostly data-driven software. Data are the fundamental elements of knowledge-based self-learning applications. Data denote the individual elements of a fact that are collected from one or more sources, that are stored, processed, and analyzed to describe factual information. Data could be qualitative/categorical (nominal or ordinal) or quantitative/numerical (discrete or continuous) [1]. Nominal data do not measure an object but are used to label variables like country, age, and race. Ordinal data are represented in an order or scale that measures a variable like, salary, range, rating, or points of a product. Discrete data consist of fixed values like, number of students, price of a product, etc., while continuous data can accept any numerical value from a range like water pressure and walking speed. A data scientist collects, processes, stores, analyzes, splits, merges, and applies effective algorithms to generate knowledge for decision making. Traditionally, we can collect data from primary sources or secondary sources, but time and reliability are sensitive in terms of competitive advantages [1,2]. Web data extraction has become popular [1,3] because it is up-to-date and accurate and supports better decision making.

1.1. Online Rating

The internet is the largest data source in this world that consists of images, text, videos, and different files. Most of the dynamic websites are updated by users’ content such as “review comments”, “like”, “dislike”, “react”, “star rating”, etc., in every moment [4]. These comments, emotions, and clicks provide valuable feedback of the products and services. A user can get an idea about the authenticity of information or quality of services or products. As a result, the internet has become one of the most important data sources, especially in e-commerce and social media. Besides traditional approaches, automation applications are also applied for data collection from webpages. Websites consist of data in HTML tags, and the presentation of data is unique for each internet site [5,6]. Web-scraping is a process to extract data from websites and transform it into structured data for further analysis. So, a web-scraper inspects the source code of the website to identify a specific tag, format, and content that will be mined. A web-scraper writes a program to extract content of the specific tag by removing unnecessary content of the same tag. Researchers use web-scraping techniques for automated data extraction from the internet; search engine optimization parties apply it for analysis and pulling their clients’ sites; and business organizations perform market analysis using it to make better and faster decisions. Statistical analysis helps to learn the data, navigate the common issues, understand the phenomenon, and provides support for decision making [7]. Nowadays, data-driven machine learning systems support discovering facts, decision making, and prediction [8]. The accuracy and effectiveness of machine learning algorithms depend on the quality and quantity of data and learning techniques [8,9]. On the other side, accessing authorization also depends on the level of membership type for most of the e-commerce websites [10] and an ordinary member or user may not be able to access review details except rating. In general, there are different potential customers with different experiences and a lower involvement of members shows the importance of the popularity of a product rather than of the reviews [11]. Online user rating is biased with personal choice, age, gender, and race that is not visible for the ordinary users.

1.2. Movie Rating and IMDB

The movie is one of the entertainment products in the film industry. IMDB or Amazon are popular sites commonly used by moviegoers to select a movie for watching based on the ratings given by users and movie critics (review score of experts). A movie is analyzed by experts called movie critics and the common measuring factors are depth of the story, touching impact, authenticity, wit of the writing, and originality [12]. Movie scholars dedicate themselves to knowing how a movie influences entertainment, its positive consequences, and how it generates a predisposition in the movie selection process of users [13]. IMDB has two different scoring approaches (experts and users) for each movie and a customer may face difficulty in selecting a movie when there is a large gap between two different scores. The weight average of many critics generates a score between 0 and 100 and it is called Metacritic or Metascore (https://www.imdb.com/list/ls051211184/) accessed on 24 June 2022. The IMDB site uses Metascore from critics and Rating from users to reduce the search time of its users [l01].
  • Research Scope: There is plenty of research on IMDB data analysis and the implementation of machine learning applications. Most of the works developed their own supervised models or applied clustering techniques, or performed a statistical analysis based on the repository data set (details in Section 2). The repository data set may consist of unnecessary fields at back dated information. Moreover, according to Quora [14], a good number of customers has no good experience when they select a movie only based on the scoring systems of Metascore or Rating because Metascore is biased by human error or business goals and Rating is biased by users’ influential factors (age, gender, race, and culture). On the other hand, an ordinary user has limited access on the IMDB movie information and most of the users follow Rating/Metascore, but it becomes ambiguous when a huge difference exists between these two scores of a movie.

1.3. Contribution

This research contributes to the three major areas:
(i)
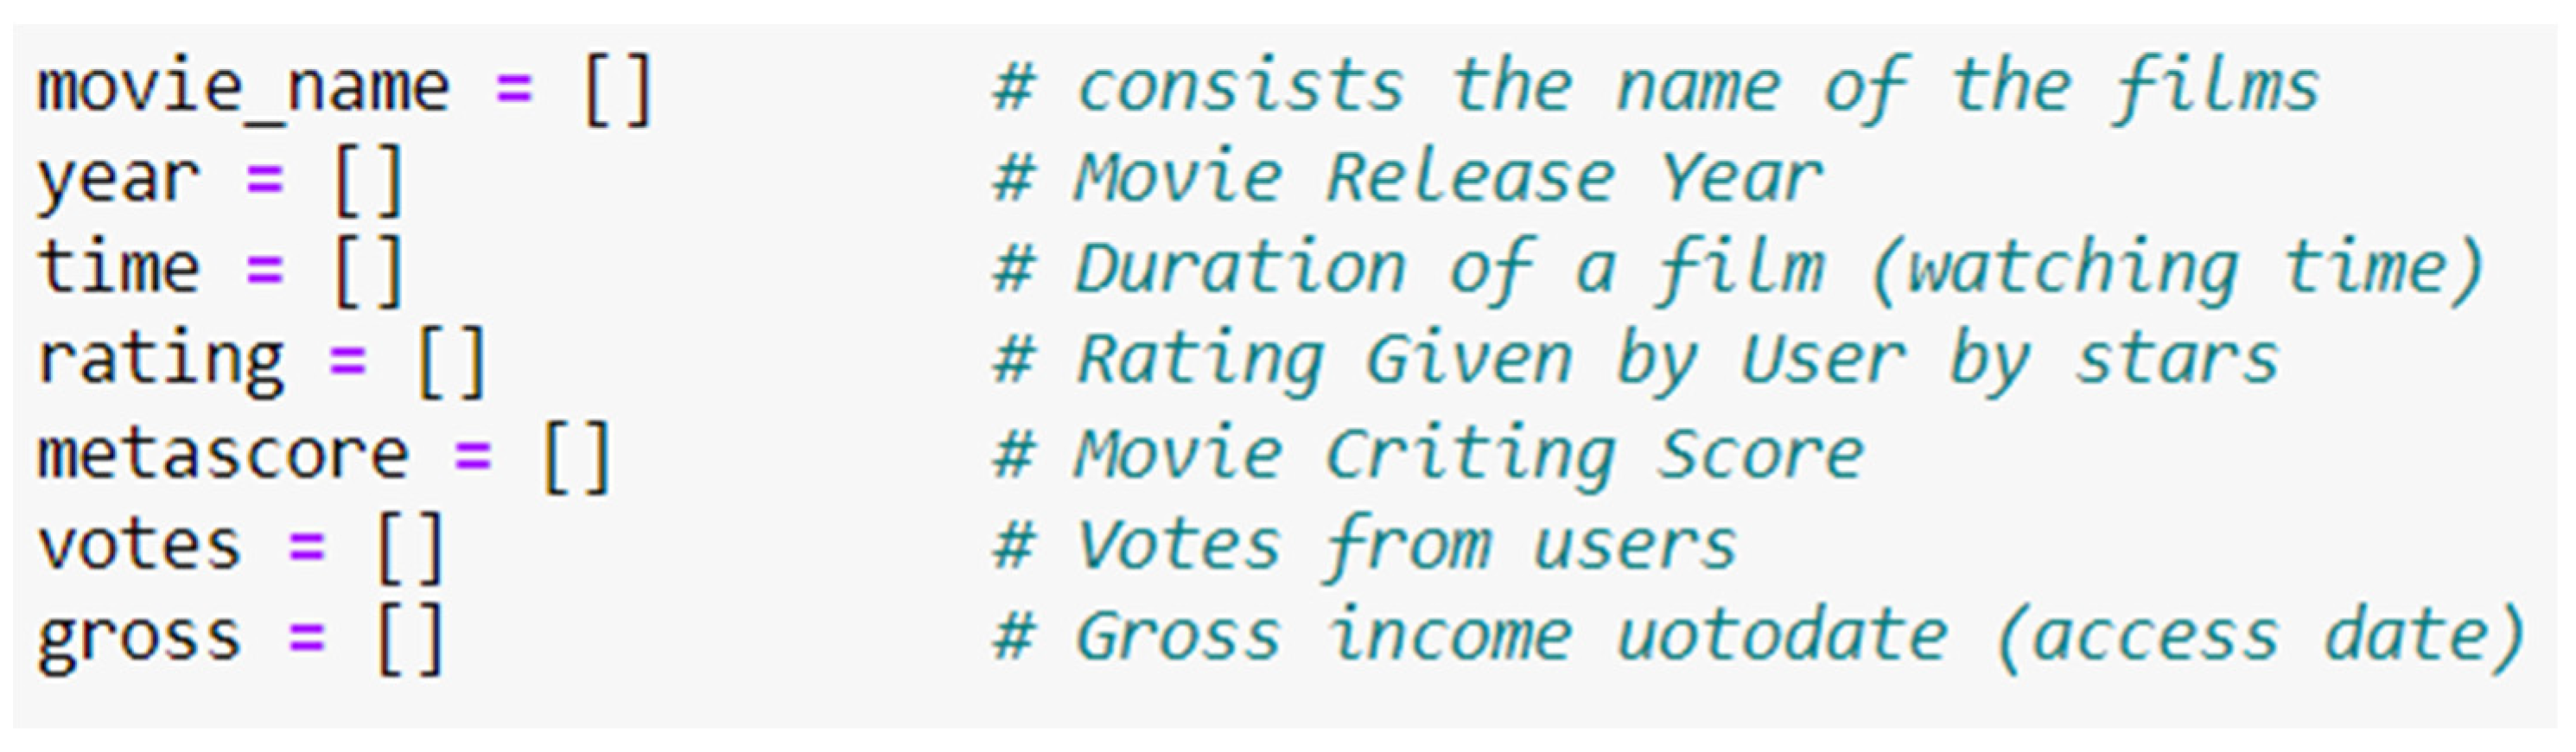
We extract up-to-date movie data (movie name, Metascore, Rating, year, votes, and gross income) from IMDB movie site. This is an ethical (grey area) data extraction process from the internet, which is more accurate and reliable than collected data from a third party.
(ii)
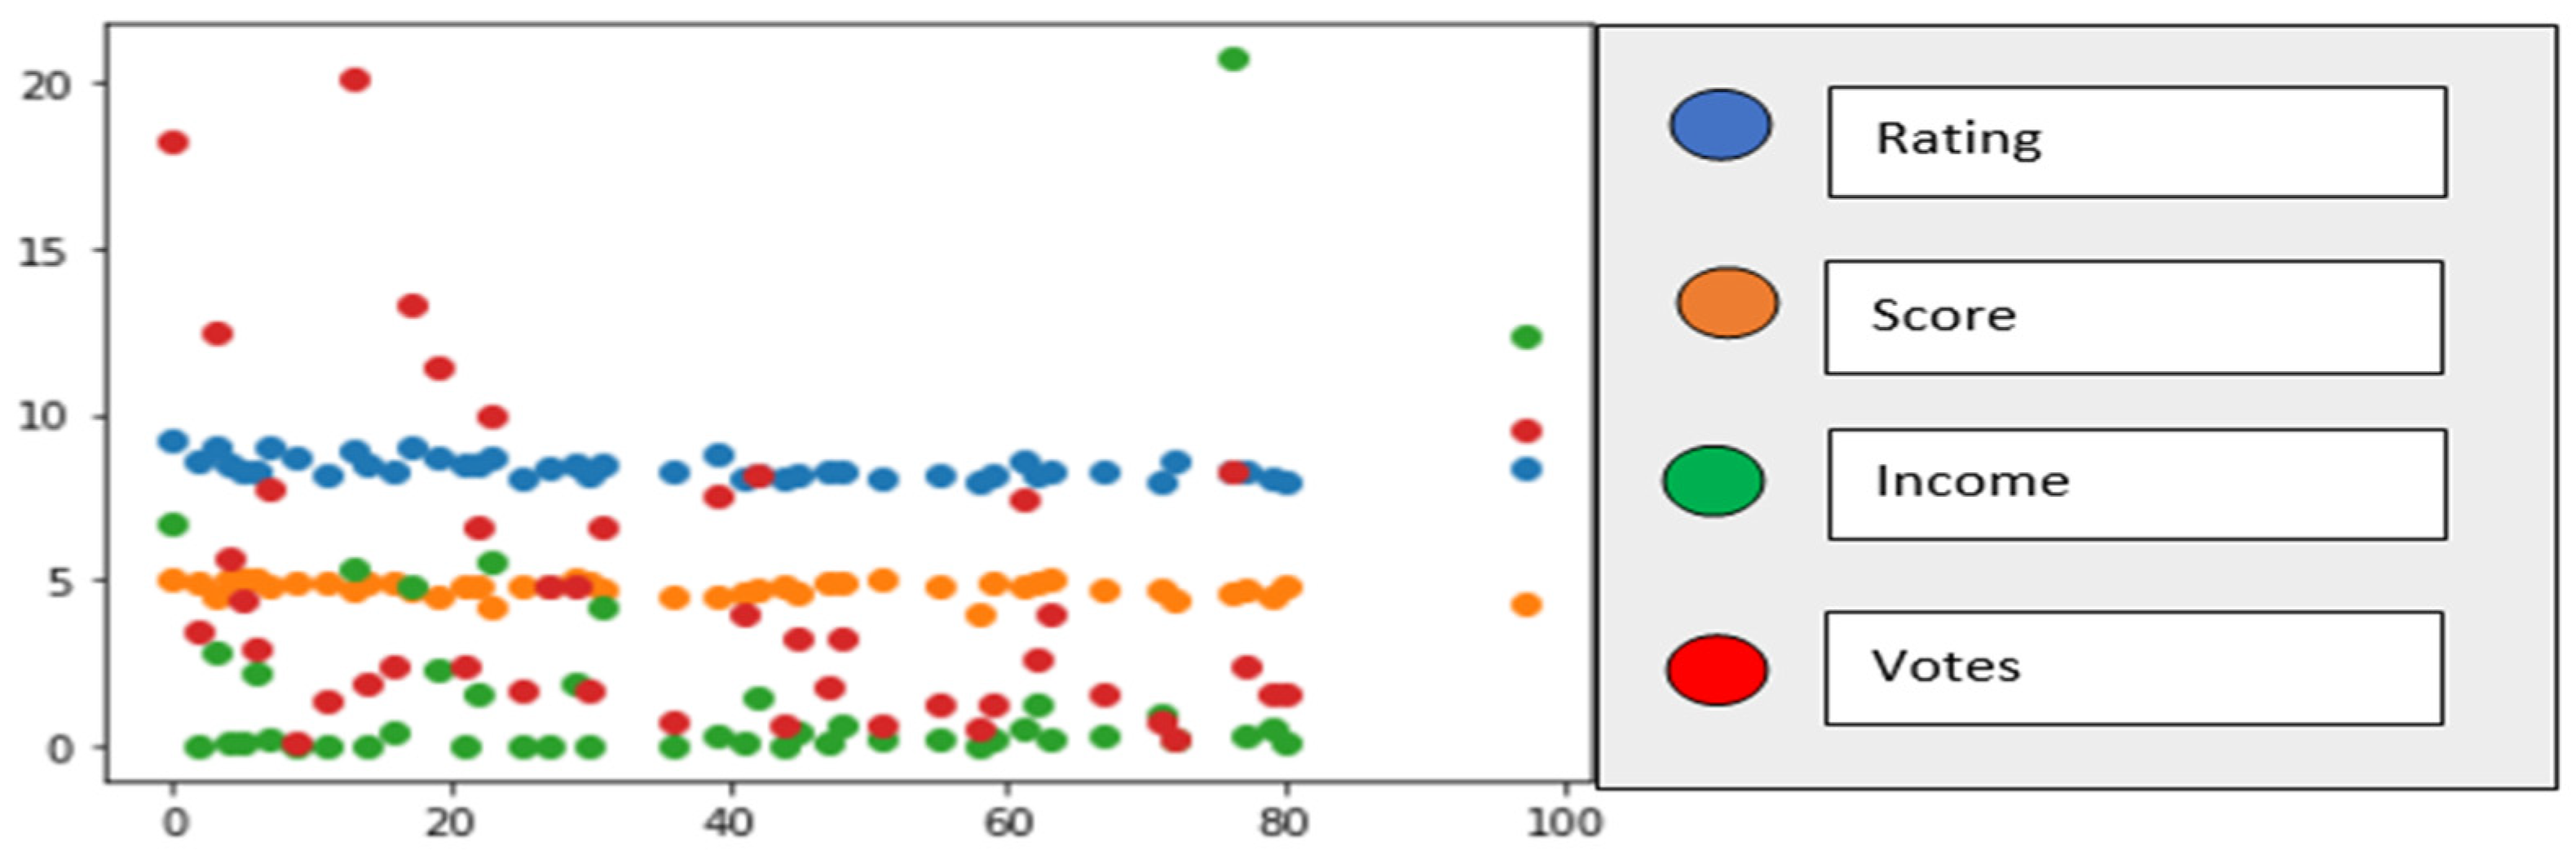
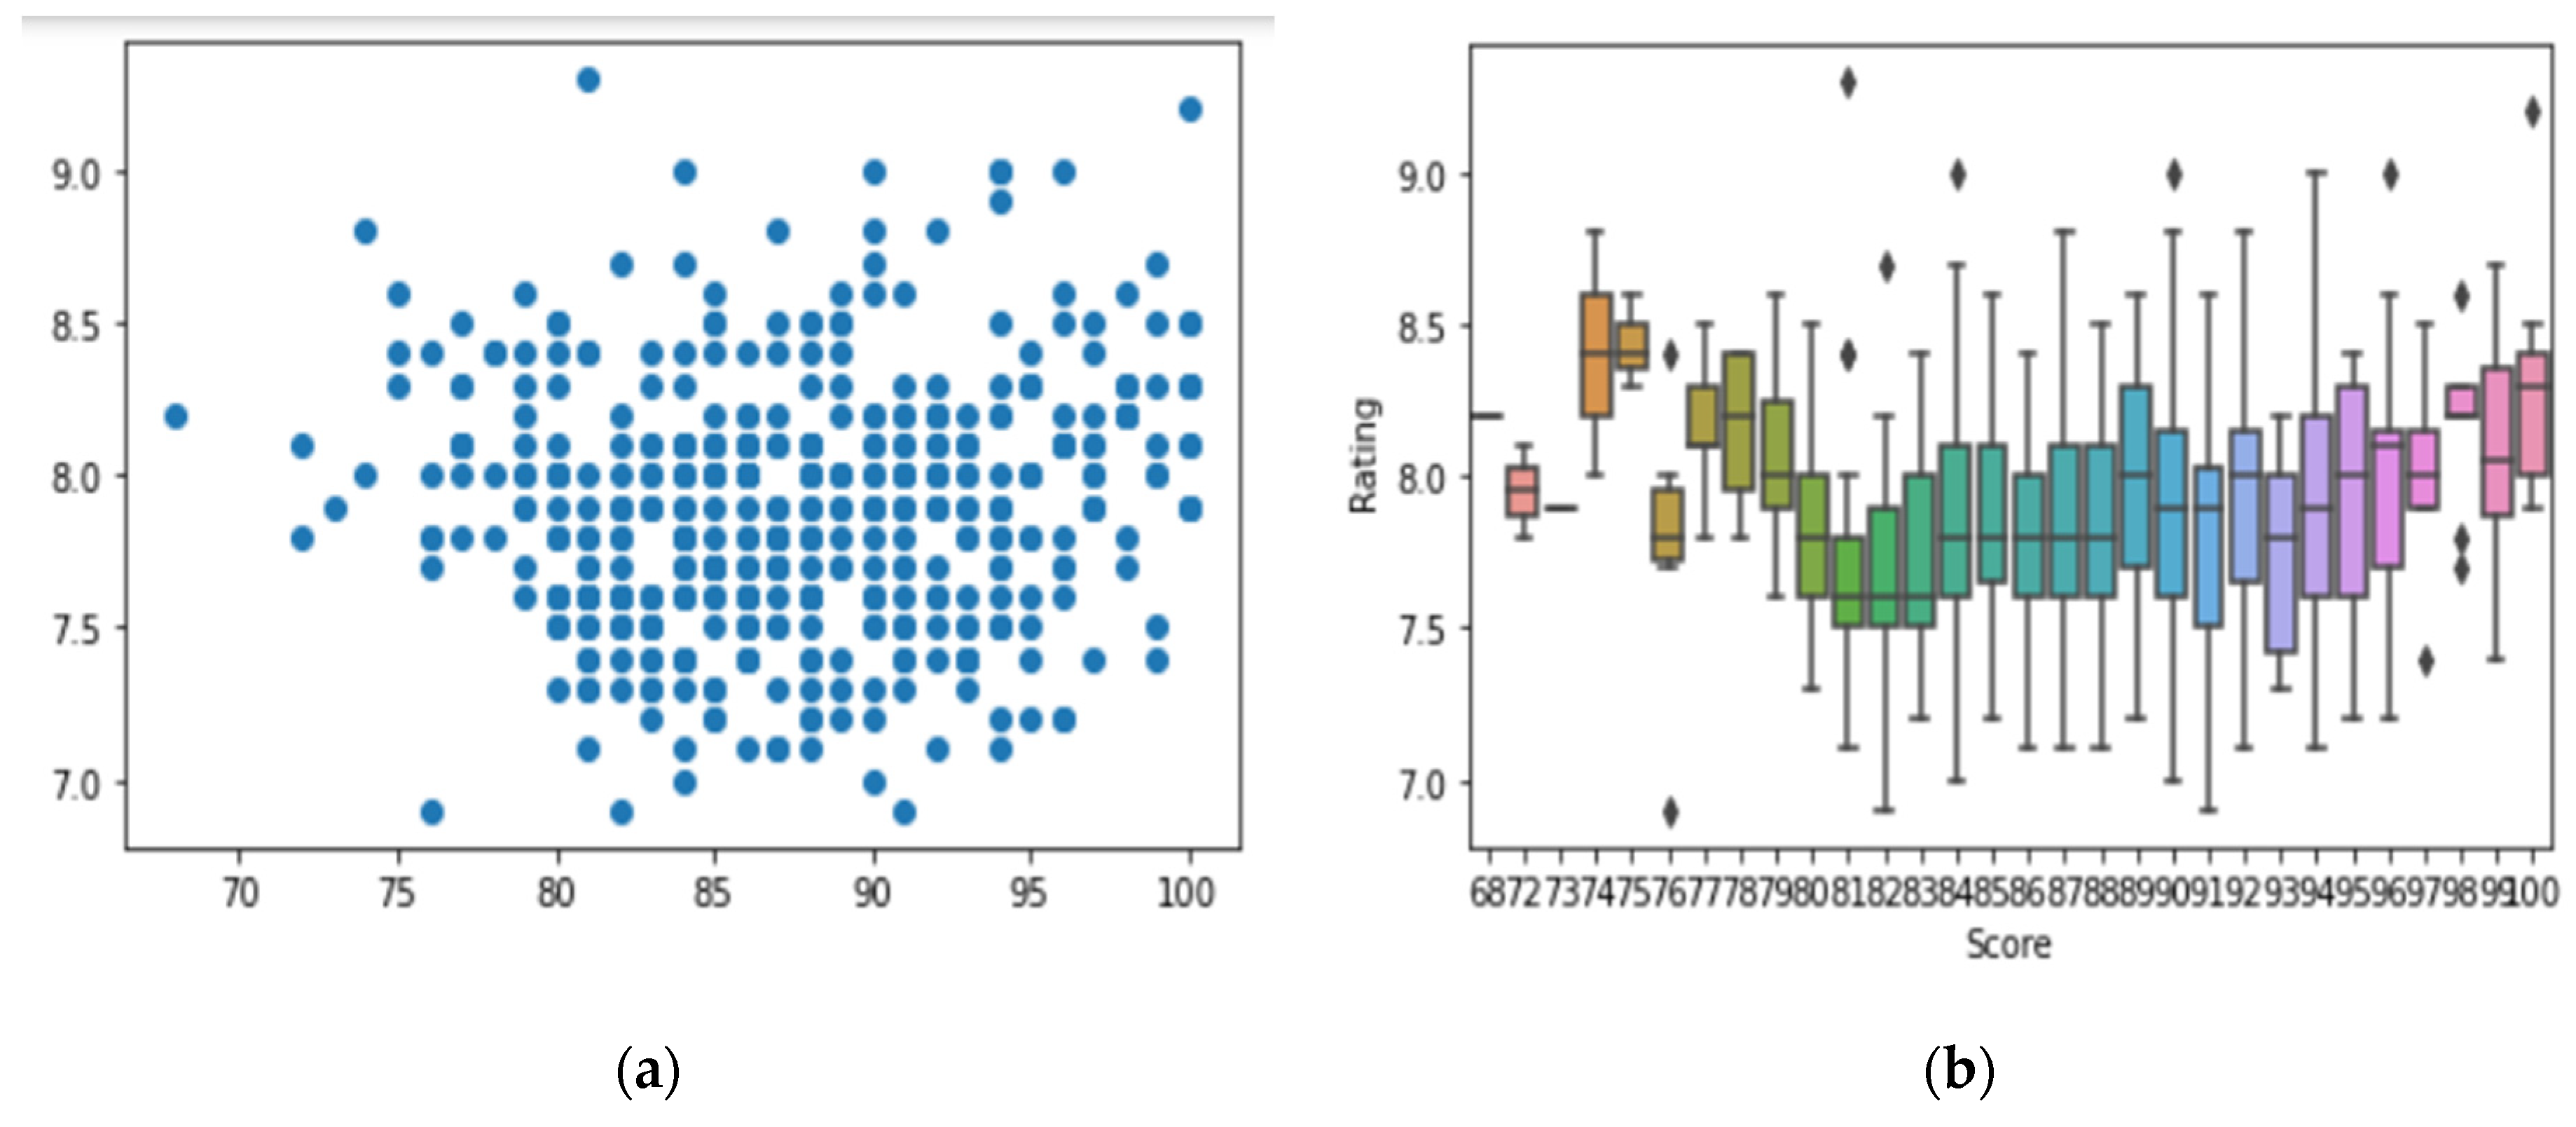
Data cleansing and analysis is performed to show the correlation between rating, Metascore, votes, and gross income of the movies. The statistical analysis illustrates the relationship between Metascore and rating by scatter plot and boxplot for comparison between two different scoring systems. This supports data validation and feature selection for machine learning applications.
(iii)
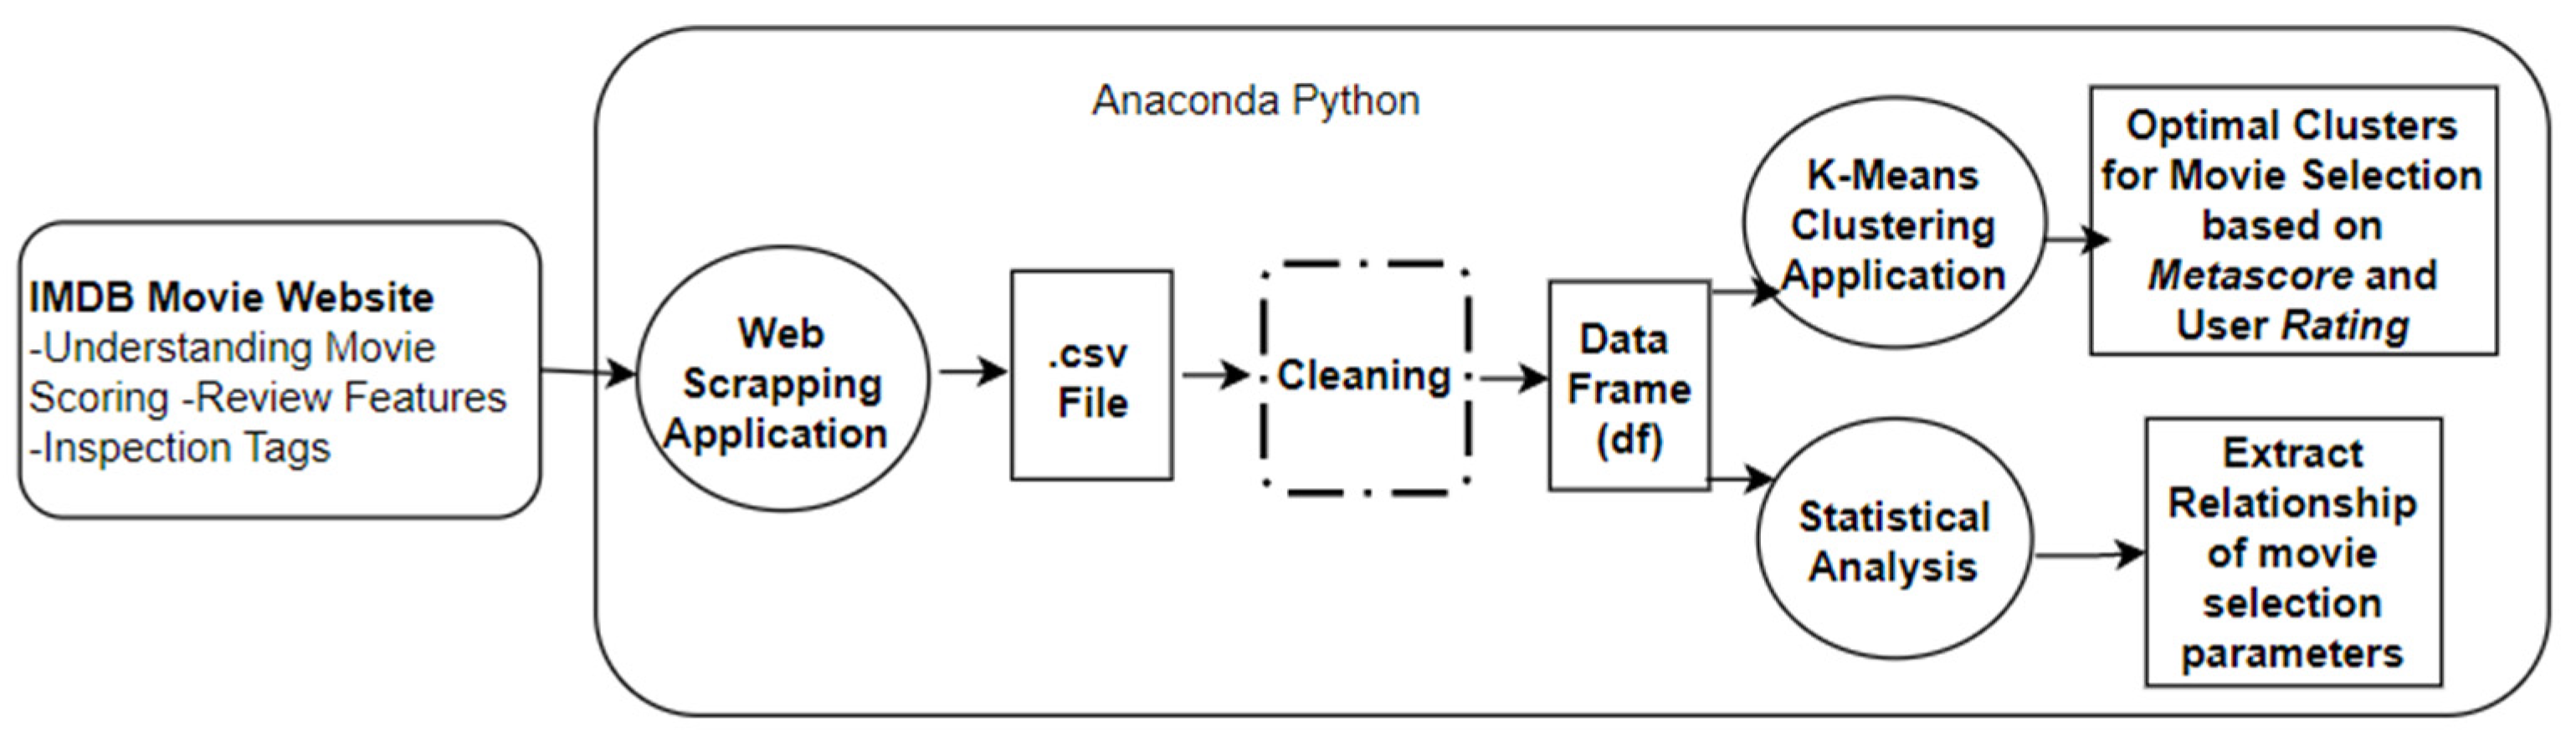
Finally, the k-means clustering technique is applied after analyzing the machine learning approaches that will support a user to select a move from optimal clusters. The rest of the paper is organized as follows: Section 2 consists of recently completed research in data science and machine learning domains for the IMDB dataset. Section 3 illustrates the research methodology aided with a diagram. Web-scraping data extraction, data analysis (statistical), and implementation of k-Means clustering are executed with the required explanation and literature in the following three sections (Section 4, Section 5 and Section 6). Section 7 explains the result and application of the research. Concluding remarks with limitations and future work are mentioned in Section 8.

2. Related Work

We are going to use IMDB movie data for our research to study the relationship between the two types of scoring systems. IMDB movie data are historically applied in different machine learning techniques. Jasmine Hsieh [15] performed a statistical analysis based on the movie rating and votes from 2005 to 2015 to see the changing pattern over the periods according to the genres (comedy, short, sport, adult, animation, etc.) of IMDB listed movies. Qaisar [16] applied Long Short-Term Memory (LSTM) classification for sentiment analysis based on the users’ comments and Topal et al. [17] applied statistical analysis to show the ranking changing pattern over a period of movie data. They worked on the repository dataset of IMDB that is collected from a third party. It has also been analyzed by different regressions [18] to predict popularity of the movies based on the genre information of the Kaggle dataset. Naeem et al. applied gradient boosting classifiers, support vector machines (SVM), Naïve Bayes classifier, and random forest [19], while Sourav M. and Tanupriya C. applied Naïve Bayes and SVM [20] and both found that SVM is better than any other classifier for sentiment analysis of IMDB movie review text. Hasan B. and Serdar K. showed clustering based on the genre of a movie to compare the genres with respect to other features like rating, release year, and gross income [21]. Aditya et al., on the other hand, applied different clustering techniques based on the rating with respect to genre, year, budget, Facebook likes, etc. [22]. The supplementary material (Table S1) includes the data of 1000 movies that are in the top of rating list at IMDB.

3. Methodology

This research contributes to web data scraping, statistical analysis, and machine learning algorithms to analyze the correlation between users’ feedback and experts’ evaluation on the internet, predominantly on a movie ranking website. The introduction section provided the preliminary understanding of the research domain (AI, web data, statistics) and the aim of this scholarly work.
This article is arranged in a sequential manner (Figure 1) that selects webpages and the features of data that are required for this research. Then, the website is inspected to understand the location of the data, the layers of tags, content of the tags, and structure of the pages. Anaconda is used for Python package management and deployment that is known as “free distribution of Python”. Pandas is one of the Python packages that is particularly uses in data science applications. There are plenty of Python IDEs for web-scraping, data analytics, and machine learning (details in Section 4) with their own special features. We used Jupyter Notebook, which is a web-based opensource application for Python programming. BeautifulSoup is the web screen scraping library that in the data extraction program stores .csv files of the Jupyter directories, while Numpy supports the convertion of extracted data into an appropriate data structure. The Pandas library is used for statistical analysis and implementation of clustering techniques. On the other hand, Seaborn and Matplotlib packages are utilized for visualization. Section 4 comprises data-scraping tools, techniques, features selection, algorithm, and cleansing methods. It also includes a web-scraping algorithm and related regular expressions that are used for data extraction and data cleansing. Data analysis included scattered plot, box-diagram, and correlation, as detailed in Section 5. We applied elbow functions to select number of optimal clusters for our dataset. K-means clustering technique is implemented for six clusters in Section 6 after a brief discussion of a few machine learning techniques. The result analysis is discussed in Section 7 with a comparison study of related research. The paper is concluded by mentioning limitations of the study and ways to further extend the research.

4. Data Collection

Websites contains huge amounts of information, and the content of the pages is updated regularly for better services. User-developed content is dynamic information that is updated every moment. So, our research extracts users’ ratings from the IMDB movie website instead of collecting it from a third party, in order to get up-to-date data. This section describes the importance of internet data, data extraction tools and techniques from webpages, data extraction legality, and an algorithm for movie data collection from IMDB website.

4.1. Importance

We are in the digital world and relate to data sources of the digital environment, which has been increasing due to digitally recorded activities of daily life, business, and news feeds [2,3]. Every moment, a vast amount of data is generated by the Internet of Things (IoT), cyber security, social media, smart devices, smart cities, digital financial services, health care, and ordinary websites. Machine learning applications are growing fast in the context of data analysis and computing with intelligent functions [1]. Data analysis applications need real data from that domain to train a machine learning model. For instance, cyber security data need to develop automated data-driven cyber security systems and mobile data are used in smart mobile awareness systems [5]. Similarly, the COVID-19 prevention system should reflect actions based on the COVID-19 dataset. Data are important when we can utilize them properly, which is mainly in three forms: unstructured data, semi-structured data, and structured data [4,6]. Structured data are organized in an order and represented in a standard format. Typically, the datare are highly organized in the tabular form (i.e., relational database). Office document files of audio, video, pdf, images, and websites consist of data that are unstructured and complicated to organize, manage, and analyze. Semi-structured data are not organized like a relational database, but they have a unique tie that supports analyzing, such as HTML, XML, NoSQL, and JSON files. Machine learning applications are data driven and the effectiveness or efficiency relies on the quality of data [4,7]; even the outcome of a machine learning algorithm differs based on the characteristics of data [8]. This research extracted unstructured web page data and converted them to a structured dataset before applying them to machine learning algorithms and statistical analysis.

4.2. Web Data Scraping

The internet is the main source of information extraction by scanning, indexing, and parsing [23,24]. Web-scraping is called a scraper that performs mechanical traverse on websites for data extraction [25]. Web data may be in the form of text, databases, emails, audio, video, images, blogs, tweets, etc., on web pages [26], which creates several technical issues in terms of volume, variety, velocity, and veracity [27]. Business organizations mostly apply decision making applications to a dataset that is collected from the internet for accuracy and faster decision making [28], though internal data (organization’s record) are used for analysis with public data (collected from different authentic sources) [29]. Web-scraping is also called data harvesting, screen-scraping, or simply data collecting from the internet [27]. It is an approach to convert unstructured internet data into a local structured data source [30] that is much faster and more sophisticated than the traditional approach [23]. Online scraping involves website analysis, website crawling, and data extraction [27,31,32] in its interwoven processes of data collection for a special purpose. It replaced all outdated data collection techniques [32]. Web parsing is common with the word embedding-based algorithm, the unsupervised lexicon-based method, a lexicon-based method, the dependency-based semantic parsing method, decision-based lexicon crowd coding, etc. [33]. It enables automated data collection at a large scale to unlock web data that can add value to the business by making data-driven decisions. Web-scraping APIs are available for large scale data extraction services, but all are not free, and most organizations do not relay the extracted information with APIs [34,35].
Using APIs is a formally supported approach to non-malicious data retrieval, while explicit data are retrieved by web-scraping [36]. According to Zhao [37] and Tarannum [38], web-scraping is cheaper, cleaner, and more automatic than web crawling. Data scientists also prefer HTTP protocol data collection methods for data retrieval from web pages [17,19,20]. It is popular in consultancy management, insurance, banking, online media, internet, network security, marketing, IT sectors, and computer software [39]. Nonprofit organizations, government agencies, and universities have archived data [24] for further use, and business organizations and scientific groups use for instance decision making [32,36] from the retrieved information by web scraping. It is commonly used in e-commerce [40,41], banking [42], recruitment agencies [43], and real estate [44] companies for data collection and is applied to their machine learning algorithms. The web-scraping dataset is up-to-date and can be used as a training dataset in a machine learning application for updating a model. It also enriches the database of a company and performance of the application. In this paper, we apply HTTP protocol data collection methods for web-scraping.

4.3. Scraping Technology

Python, R, SQL, and Java are the popular languages for web-scraping and data analysis [45]. Python is comparatively popular in development industries due to the simplicity of coding, libraries, and packages, though Java is applied for API data collection and R is used for data analysis widely [43]. However, web scraping is not a use of predefined APIs from websites [46]. It is imperative for a distinguished integrated development environment (IDE) that enables programmers to work in a special domain of development. An IDE supports editing, debugging, and executing features that may vary to the choice of developers according to experience, working domain, cost, and machine configuration. Python accompanies an Integrated Development and Learning Environment (IDLE) that is free and commonly used for beginners on Windows, Linux, or Mac OS. PyCharm is popular for professionals to work with websites because of its support for CSS, Java Script, and TypeScript. Visual Studio Code is an open-source IDE of Microsoft commonly used for Python development due to its smart features and services. Sublime Text 3 has project directory management features and supports accessing additional packages for web and data science application development. Atom is an interactive smart editor and supports cross-platform development. Spyder is an open-source IDE of Anaconda distribution mostly used for scientific development in data science and machine learning. We used Jupyter of the Anaconda platform for web-scraping, statistical data analysis, visualization, and machine learning algorithm. Regular expression, which refers to regex or regexp, is a well-known technique for data extraction from web pages by the “re” module of Python, but it creates problems when the HTML consists of ambiguous inner tags [47]. To overcome the limitations of regular expressions, Document Model Object (DOM)-based libraries are used in web-scraping application development. Jupyter is widely used in data science for NumPy (multi-dimensional array), Pandas (data frame), and Matplotlib libraries (plotting data). It is easy and interactive with code sharing and visualization. Commonly used library of Python is explained in Table 1.

4.4. Web Scraping Legality

Social scientists struggle to retrieve data [50] for research, but nowadays, websites are the source of a lot of granular and real-time data [51]. That makes the data available for the researcher when developing new research questions or answering old questions [52], and it allows practitioners to understand business strategy [53]. Web-scraping data are used by government agencies, and market and business analysts without legal issues [33]. A vast volume of web data extraction can lead to technical, legal, and ethical challenges [51,53]. There is a proliferation of selection tools, techniques, and purposes in a legal way called the “grey area” of web-scraping [50,54]. Web-scraping is not restricted by legislative addresses, but it is guided by a set of laws and theories: “Computer Fraud and Abuse Act (CFAA), “Trespass to Chattels”, “Breach of Contract”, and “Copyright Infringement” [54,55]. A website owner can apply fundamental theories, (i) by posting a terms of uses policy on their website to prevent programmatic access, (ii) apply the fair use principle to protect copyright property, (iii) protect premium content from commercial purposes by cease and desist declaration, (iv) be protected from overload and damage by Trespass to Chattels law declaration, and (v) the declaration of ethical statement, personal data protection, and data utilization strategy. Our scraped website (IMDB) is a public website and there is no private or copyright-protected data. The scraping program cannot damage or create extra load for the website. It only extracts published information that will only be used for research by academics. It will not be shared in the public domain, with third parties, or be used for commercial application. IMDB (https://www.imdb.com/list/ls048276758/?ref=otl2 accessed on 24 June 2022) is the selected website for data extraction using the Pandas library (BeautifulSoup of Python). Table 2 shows the checklist for ethical data collection criteria that are maintained by our research team. The IMDB site contains of several thousand movies in a list where a single page represents information of 200 movies. We only scraped information from the first 10 pages (total 1000), which takes a few seconds without interruption of their services.

4.5. Movie Data Extraction

The aim of this research is to apply a suitable clustering machine learning algorithms based on the two raking fields: (i) the users giving a rating by stars is called the Rating field of the dataset and (ii) the movie critics provide feedback via a number called Metascore, which is specified as Score in the dataset (Table 3). Few extra fields are extracted for statistical analysis to understand the phenomenon of the relationship but are not utilized in clustering. Figure 1 illustrates the scraped data fields (tags of the webpages).
An ordinary user selects a movie based on the scoring with some other features like name, actors, year of release, and subject of the movie. The movie features are in an association rule [56] and we extracted only seven features for statistical analysis but the aim of the work is to suggest a movie only based on the Metascore and Rating. Seven features of the movie records were scraped (Figure 2) for the first 1000 movies (first 10 pages) form the list of the website based on Algorithm 1 without interfering the website’s services. After removing the records that consist of incomplete or garbage data, 424 records (Table 3) were transformed into the Pandas data frame for analysis and clustering.
Algorithm 1. Web Scraping
1.  BEGIN
2.  ASSIGN array Variables
3.        for pages !END
4.        READ new URL for each page
5.        PARSE each page
6.        READ main DIV/CLASS/TAG of Data_Fields
7.                 for required_data_retrive !END
              if tag_of Data_Fields !SAME
8.                 Store_contentFilter if Need to (READ text_of_tag)
9.            Else
10.                Store_content [i]Filter if Need to (READ text_of_tags)
11.                Data_list←pandas_variable.DataFrame(Data_field1, .. ,data_fieldn)
12.  Data_list.to_csv(Local_Data_File.csv)
13.  END

5. Data Analysis

Data are presented in the tags of the web pages that were fetched as a text during scraping (by BeautifulSoup), but we are going to apply clustering machine learning techniques and analysis that will work on meaningful numerical values. The text was converted to a numerical form by a Python function (to_numeric()) for required fields. We applied three steps for cleansing: (i) dropped the records that consist of meaningless data (data.drop(number)), (ii) removed all records that consist of null value on the website but that are scraped with “00′ (data.data(Score !=0)) and “000” (data.data(income !=0)) in the Score and Income field, respectively. In the text fields of the tags, there might be additional symbols, special characters, or punctuation that are unnecessary or even barriers to apply arithmetic, logical, and machine learning applications. We applied regular expressions to remove extra data with a tag by removing special characters, symbols, spaces, and punctuation. Finally, 424 records were developed into a complete dataset (Table 3) for analysis and machine learning algorithm application.
Data are stored as a file that could be in a tabular form, image, graph, or even a text or pdf file. Each form of presentation is important for a particular application but may not be suitable for all. We extracted data as a tabular form (Table 3), which is easier to sense and for utilizing cleansing methods. Data scientists apply efficient techniques for analysis, present and store information using mathematical and statistical models. For example, the liner equation is applied for linear regression to predict price or customer satisfaction of a business organization. It is commonly used in principal component analysis for dimensionality reduction, encoding of the dataset, or singular value decomposition. Our dataset was extracted without unnecessary dimensions. The matrix is used to represent, store, and analyze images. It is also used to compress a file and our dataset was comparatively small and there was no need to apply a compression technique. Vector operations are used to calculate and predict the movement of a machine. To understand the nature of data, scientists use central tendency and dispersion, while probability is used in accuracy and prediction models. Moreover, point estimation, interval estimation, hypothesis testing, and categorization algorithms use distribution theory like Sigmoid and Gaussian functions. Mathematical and statistical models are commonly used in machine learning algorithms that are applied in data science. Naïve Bayes, support vector machines (SVM), and boost algorithms are used for supervised learning [57]. Wavelet coefficients of natural images are relatively sparse models implemented as a wavelet coefficient for natural image processing [58], Shannon source coding theorem is used for uniform coding in tree construction [59], sensing data modeling [60], and applications available for data transformation, projection of objects, as well as in learning algorithms. A sample of data could represent the concept of overall information, and normalization can also be applied for better visualization of multiple features in a single frame. Figure 3 shows overall relation of four movie choice parameters though it was developed on the random sample of one-tenth dataset. It also used a normalized scale of Income and Votes with respect to Rate and Score. Interestingly, Income of the movie is showing a random manner in relation to all other features.
Figure 4a,b represent the Score (x axis) and Rating (y axis) and show a scatter and a boxplot, respectively. Users’ choice (Rating) and experts’ ranking (Score) are negatively corelated (−0.03846622277552866). Figure 4a shows that the minimum Score is 70 (that is the considered minimum accepted value for movie critic Metascore) and maximum 100, so most of the metacore values are in the range of 80–95 and they are in small groups (that motivate us to apply clustering techniques) but very near to each other with different shapes. On the other hand, it does not clearly fall in the regressions, and we do not know how many groups can be made for classification. In the box diagram (Figure 4b), the quadratic values of boxes are not on the same level, from 70 to 100, so that we can imagine a curve in the medium of the boxes to classify or separate into two logical groups. However, the irregular imaginary curve does not generate any sense of classification. There are a few boxes of very small shape that consist of very few observations, and you can imagine outliers of the dataset.

6. Machine Learning

Artificial intelligence (AI) improves the ability of a machine to imitate a human and extended AI provides the learning capabilities of a machine called machine learning (ML). When a machine uses more learner layers (hidden layers) in neural networks, it is called deep learning (DL). In this research, we are concentrating on ML of supervised, semi-supervised, unsupervised, and reinforcement learning. Supervised learning maps input data to an output based on the predefined input–output mapping to participate in machine learning systems. It works on labeled training data and is called a task-driven learning system with classification and regression techniques. Unsupervised machine learning is a data-driven approach that can analyze unlabeled data for clustering, feature learning, dimensionality reduction, anomaly detection, etc. [57]. Semi-supervised learning can work on labeled or unlabeled datasets for clustering and classification [59]. In the real world, labeled data are limited and a semi-supervised model is more practical for work on unlabeled datasets [61] for better performance. Reinforcement machine learning allows its agents to learn from the environment. It is either a model-based or model-free technique [61] with four elements: agent, environment, reward, and policy for controlling a system (refer to Table 4).
Over the years, the data analytics technology ecosystem has integrated big data into sophisticated computing platforms with analysis tools, techniques, and machine learning algorithms [62]. Cognitive robotics, virtual agents, text analytics, and video analytics applications improve the capabilities of machine learning frameworks. Structured real data are important to train the machine, but internet pages have plenty of unstructured data. The proliferation of machine learning applications brings innovation in business and e-commerce. Robotics is the common field of AI that reduces human efforts in industries [63]. AI chatbots provide instant routine services to its customers [64], financial organizations use machine learning applications to enjoy competitive advantages [65], fraud detection systems are used in financial organizations [66], risk assessment and mitigation recommendation machine learning applications reduce risk in organizations [67], AI applications reduce false-positive-cases in money laundering [68], price prediction [69] and derivative price calculation [70] brings advantages in business. Item recommendation systems reduce users’ efforts to search an item in online portals based on the location, time, and user choice [71]. Features selection, feature engineering, component-based applications, context awareness, and machine learning techniques are applied to the user interface to recommend its customers/users in real time [72]. Cell mitosis detection system [73], features selection for malignant mesothelioma [56], job recommendation systems [74], spam email detection systems [75,76], malware and intrusion detection systems [76], cyber security data analysis (Naïve Bayes, Random Forest, ANN, DBN, Decision Tree, SVM) and threat prediction systems [77], user pattern detection [78], and social media recommendation systems [79] applied machine learning to recommend their users. A book recommended system uses features selection [80], a fraud detection system applied features selection and feature engineering [81], and a music recommendation system [82] consists of feature selection techniques and real-time user interface along with machine learning techniques. Machine learning is common and most effective for automatic recommendation in online applications. There are a few common machine learning modeling techniques.

6.1. Classification Algorithm

It is a supervised learning approach in computing and data science that is divided into binary classification, multiclass classification, and multilevel classification.
Binary classification: The binary classification consists of two states of output, such as YES or NO, TRUE or FALSE, HIGH or LOW [4], that can predict one of the two classes only. In the real world, it is implemented to predict special types of observations from the superset, which becomes two distinguished classes. It may be linearly separable or non-linear separable to make two different classes.
Multiclass classification: It refers to the classification of more than two classes [4] that has no expectation or principle of normal or abnormal outcomes. For example, it can classify data according to the various network attacks of the NSL-KDD dataset [83].
Multilevel classification: It is the generalization concept of multiclass classification where applications are associated with several classes or levels of a hierarchical structure. An application can access simultaneously more than one class of a level. Advance machine learning algorithms predict based on mutually non-exclusive classes or levels [84].
Rule-based classification: It is usable for any types of classification that can predict by IF/THEN rules. Decision tree is one of the most common rule-based classification techniques that support high level dimensionality and is easier for human beings to understand [85]. ONE-R [86] and Ripple Round Role (RIDOR) learner [87] generate rules for prediction with rule-based classification.
Table 4. Classification techniques.
ClassificationsFeatures/Characteristics and Applications
Naive
Bayes (NB):
It is founded on Bayes’ theorem that is surprisingly good for independence assumption [88].
It is a supervised model that can implement robust prediction model construction and is effective for noisy instances of a dataset [88].
It can work with a small amount of training datasets compared to other sophisticated classification algorithms [84].
Linear discriminant analysis (LDA):It is generalized of Fisher’s linear discriminant that searches linear combinations of features to separate data into two or more classes.
It is developed by Bayes’ rules and fitting class conditional data density [84,87].
Standard LDA is usually suited for Gaussian density and applied to analysis of variance, dimensionality reduction [84].
Logistic regression (LR):A statistical model used to solve classification issues by probabilistic theorem in machine learning applications [89].
It is also known as a sigmoid function in mathematics.
High dimensional dataset could be over fitted by it, but it is effective when the dataset is linearly separable.
L1 and L2 regularizations can be implemented to overcome over-fitting issues [84].
K-nearest neighbors (KNN):It is an instance-based learning that is also called lazy learning algorithm or non-generalizing learning technique [90].
Similarity measuring techniques (e.g., Euclidian distance calculation from a particular point) are used to classify new data [84].
The output is biased by data quality and noise.
Support vector machine (SVM)It is a supervised learning model that can be used for classification and regression [91].
It creates a hyper plane for high or infinite dimension of data.
It has distinguished applications based on the mathematical functions: sigmoid, radial bias function, kernel, polynomial, and linear, etc. [84].
Decision
tree (DT)
It is a non-parametric supervised learning approach [92] that can implement classifications and regression applications [84].
IntrudTree [93] and BehavDT [94] are two recently proposed DT algorithms for cyber security analysis and behavior analysis, respectively, while ID3, CS4.5, and CART [95,96] are commonly used DT algorithms.
Random
forest (RF)
It is an ensemble classification technique in machine learning and data science [97] that can fit several parallel “ensemble trees” for simultaneous accessing [8], which is more effective than a single tree structure.
Implementation of different sub-datasets on a tree of ensemble trees, minimize over-fitting problems [84].
It combines bootstrap aggregation [98] and random feature selection [99] to establish a series of trees (random forest tree) with several control variables.
It is more accurate and efficient than a single decision tree structure [100].
Adaptive Boosting (AdaBoost)A serial ensemble classifier employed to reduce errors in classification that is developed by Freund Y [101].
It brings poor classifiers together and improves quality of classification; it is also called meta learning algorithms.
It improves the performance of a base estimator [84] and a decision tree in binary classification but it is sensitive with outlier and noisy data.
Extreme gradient boosting (XGBoost)It is like a random forest that creates a final ensemble model based on the series of individual models [97].
It uses gradient to reduce loss functions while neural networks use it for weight optimization [4].
Second order gradient is used to deduct loss function and over fitting by advanced regularization [4].
Stochastic gradient descent (SGD)It is an iterative process to optimize objective function (computational burden in high dimensional optimization problems) [4].
It is applied in text classification applications and natural language processing algorithms [84].

6.2. Regression

Regression analysis is a mathematical model that predicts a dependent variable (outcome) based on a set of independent variable(s). This is a predictive analysis in artificial intelligence and data science for forecasting, time series analysis, and finding the cause–effect relationship between variables. It is also the process of fitting a group of points to a graph so that it can be represented by a mathematical equation to predict any outcome via given input(s). It supports getting significant factors of a dataset. Market analysis, promotion, and price changes are most common in intelligent business analytics. It can be classified based on the number of independent variables, shape of the curves, and type of dependent variable. It has several variations, like linear and nonlinear regression, or simple and multiple regression analysis. Linear regression is very measurable and easy to understand but sensitive to outliers [102]. It is frequently employed in pricing models, forecasting, and detecting financial performance that supports better decision making. Regression predicts a continuous fact while classification predicts at class level only. Polynomial regression (medicine, archaeology, environmental study), power regression (weather forecasting, physiotherapy, environmental study), exponential regression (exploration, bacteria growth, population), and Gompertz regression are famous in machine learning applications. Multiple linear regression is deployed for energy performance forecasting [103], exponential regression and the relevance vector machine are used to estimate the manner of residual life [104], a design optimization technique proposed by polynomial regression [105], and fuzzy polynomial regression is applied for feature selection and adjustment models [106]. Regression has variation between simple to complex functions that consist of a set of variables and coefficient(s) and those are selected based on the importance of accuracy [102]. During analysis (Section 4), we noticed that the ranking of two methods is negatively correlated, but dispersion is too high in the scatter diagram (Figure 4a). In this scenario, regression analysis will create high positive and negative errors that do not make real sense of implementation.

6.3. Reinforcement Learning

Reinforcement learning (RL) implements the Markov decision process [100], which is a sequential decision making approach. RL has four elements: agents, environment, rewards, and policy to implement in a model-based or model-free architecture. In this method of machine learning, the training method uses rewarding points for desired behaviors and punishing points for undesired behaviors. In this learning, the observer shall not be aware of the actions, which means it is a trial and search method. There is a possibility of delaying the process rewarding actions but this short-term sacrifice gives long-term improvements [106]. In the model-based technique, a machine learns from an environment-model and adopt its learning with the results of trial [107], and model-free RL is not associated with a predefined environment-model like Monte Carlo and Q deep network [108]. The aim of this research is not aligned to the reinforcement learning because it does not learn anything from the environment and does not need to update based on the future input.

6.4. Clustering

Clustering is an unsupervised machine learning technique that creates a group of similar items from a large dataset where each group has a specific characteristic called a cluster. Each cluster is separated from the others. It is a machine learning technique that makes n numbers of categories without prior knowledge about the number of clusters or characteristics of any cluster. It is used to identify the trend or pattern of the dataset, image segmentation, biological grouping, similarity and dissimilarity identification, logical partitioning, noise detection, visual object detection, dictionary learning, competitive learning, etc. [109]. A data scientist can use various clustering methods based on the requirements or outcomes of the task. Hierarchy clustering decomposes the dataset into multiple levels that cannot correct enormous merges or splits [110]. It is applicable in the hierarchy architecture of species or objects in agglomerative or divisive approaches. Density based clustering (DBSCAN) comprises the distance between the nearest points to make a cluster by separating higher density points into lower density points. It is commonly used in medical images for diagnosis [111]. It is not affected by outliers, and it is commonly applied in noise detection or image segmentation [112]. Grid-based clusters summarize all data into a grid and then merge grid cells for a cluster that is good for dealing with massive datasets. Model-based clustering is derived from statistical learning methods or neural network learning methods to generate required clusters. Partitioning clustering methods use mean or medoid to identify the center of a mutually exclusive spherical cluster and are good for small to medium datasets [110]. A distance-based clustering and sensitive with outliers. K-means, k-medoids, CLARA, and CLARANS are the commonly used partitioning clustering methods [113] and they are suitable for separate clusters with a predefined cluster number [110]. An algorithm is selected based on the application and time complexity. Time complexity of AI algorithms is influenced by number of instances (n), number of attributes (m), and number iterations (i) [111]; for example, time complexity of SVM is O(n2), DT is O(mn2), and DBN is O((n + m)i). We implemented k-mean clustering and the time complexity of different clustering algorithms mentioned in Table 5 according to Yash Dagli [110].
Density-based clustering algorithms create clusters depending on the density of the dataset (the higher density region is separated from the lower density region) and is used to select and remove noise from the dataset. A method that generates a hierarchy of the clusters in either an agglomerative (bottom up) way or a divisive (top down) way is called hierarchy clustering and forms a tree structure. Grid-based clusters summarize all data into a grid and then merge grid cells to a cluster that is good for dealing with massive datasets. Model-based clustering is derived by statistical learning methods or neural network learning methods to generate clusters. K-means clustering is a simple algorithm but fast and robust and provides good results when the data are well separated. It calculates the square distance between the k numbers of centroids and an object; the object is assigned to the cluster of the nearest centroid.

7. Result Analysis

This research is a new approach to IMDB movie data that fulfills the aim of the research. We created six clusters of the movies that will support the user in selecting a movie form the desired clusters. This research adds a new dimension to the study of IMDB movie information. Table 6 differentiates our study with previous works with respect to objectives of the study and data collection method.
Within Cluster Sum of Square (WCSS) is the method for cluster generating that is applied to develop the elbow diagram (Figure 5i). It shows the possible number of clusters (1 to 10) on the x axis and the sum of the square distance of the class elements on the y axis. The elbow function is developed based on the Rating and Score fields of the dataset. Cluster numbers 3 to 6 (Figure 5i) fall in the elbow part of the curve, so these are logical, reasonable, and acceptable cluster numbers for this dataset. Before cluster number 3 and after cluster number 6, the curve sharply changes and there are no distinguished remarkable points. Cluster number 3 and cluster number 6 are remarkable points to consider (ignore fraction to make a cluster). We found that six clusters are most suitable to see the relationship between Score and Rating (Figure 5ii). It is noticeable that cluster ‘b’ and cluster ‘e’ have a more homogeneous (comparatively less distance among the points of the cluster) bond, but cluster ‘a’ and cluster ‘d’ have a more heterogenous (more distance between the points of two cluster) bond. For movie data, we can consider that Metascore is strongly opposite to Rating between cluster ‘a’ and cluster ‘d’, while there is a mostly similar understanding between cluster ‘b’ and cluster ‘e’.
The x axis of Figure 5ii represents Score, and Rating is represented on the y axis to form six clusters that are indicated by a, b, c, d, e, and f. Clusters are formed by the points that are nearest (Euclidian distance) to the centroid. For three cluster modeling, the data are clustered into three groups where the common point of these clusters is in the center of the dataset. Each cluster spreads at a 120-degree angle (approximately) for each that does not make good sense according to Figure 5ii (six clusters model), group ‘e’ represents the movies that have a balanced ratio of Metascore and Ratings compared to the other clusters. Cluster ‘c’ has a comparatively high Metascore with a minimum user Rating, while cluster ‘a’ achieves the highest user Rating and a standard Metascore of 85–95. Cluster ‘d’ and cluster ‘e’ have the same user rating but there is a significant gap in the movie critic score. Cluster ‘b’ has the lowest ranks for both measures among the clusters. Here, cluster ‘e’ is the optimal one among the six clusters to select a movie with minimum risk.

8. Conclusions and Future

Data collection, data analysis, and implementation of k-means clustering are the three major phases of this study that is founded on web-scraping movie data. This work will motivate researchers to work on web-scraped data rather than relay a third party backdated dataset. “Grey area” web-scraping will reduce the limitation of research data. This paper provides guidelines for data science research with three main activities: data scrapping, data analysis, followed by machine learning application that could be extended in any domain. Researchers and experts can reduce dimensionality reduction and cleansing activities using web-scraping data rather than third party datasets.
We extracted the data of 1000 movies that are in the top of the rating list. Data were cleaned up by removing records that had ambiguous or null value. Out of 1000 records, we got 424 as a complete dataset that was applied in statistical analysis and to the k-means clustering model. The Jupyter Notebook of Python on the Anaconda platform were used in all phases of the research. We performed statistical analysis and found that there is a negative correlation between Metascore and Rating that is not an ordinary expectation (people expect that a good movie will get good rankings for both cases), and it justified the biasness (both ratings have influential factors that can bias the scoring) statement of Quora [14]. We know that high rank is a good motivating factor in the online world and that new users look to it to select a movie for entertainment. A user can accept any or both recommendations, but when both rankings show a good score, it definitely adds more value to a product. This study clearly created the clusters so that users can select better movies, researchers can find gaps between the two feedback systems, and movie critics can revise the factors of Metascoring. Movie producers can implement the study for better decision making to achieve their business goals. So, this study supports IMDB users, movie producers, and movie critics and experts besides supporting computing researchers. This will motivate users to justify a score with another type of scoring to improve the accuracy of the decision. The movie critics can review their scoring parameters so that it can reduce the distance to users’ rankings. Movie makers can decide to produce a movie that can enhance business goals. A researcher can show interest in real time data rather than the uses of the back dated dataset. Multi-criteria decision making applications can utilize multiple scoring systems for decision making. It is essential for smart recommendation systems where more parameters are required to make the decision.
Limitation: This research extracted information of a limited set of movies and all movies are at the top of user rating lists. A researcher can extract data for all movies or randomly selected movies. There are more influential factors of movie records such as genre of a movie, actors of the movie, and production time. Moreover, there is no information about the user who is rating since each user is influenced by individual factors such as age, sex, language, and culture, etc. We applied k-means clustering without removing outliers that fulfill our objective.
Future work and recommendation: In the near future, we are going to apply k-means and k-medoids clustering for each of the major genres from the IMDB movie list. There is an adequate scope for extending the research to develop a supervised and an unsupervised model that will help users and move producers in decision making. There is a popularity changing pattern with respect to the movie genre and movie popularity. This movie data could be helpful for multi-criteria decision making and problem solving in statistics and AI. The deep learning model of Kamran et al. [115] supports considering multiple vectors for automatic decision making with good accuracy. We will extend our study for multilayer deep learning algorithms to consider all influential factors (Metascore, User Ratings, Votes, Gross Income) for supervised modeling based on the research of Kamran et al. [115]. This idea could extend to validating any recommendation system where multiple online ratings exist for a product or service.

Supplementary Materials

The following supporting information can be downloaded at: https://www.mdpi.com/article/10.3390/computers11110158/s1, Table S1: Complete Dataset.

Author Contributions

K.U.S. and M.S. contributed to the investigation and project administration. R.H. contributed to the supervision. S.M. contributed to the visualization. A.A. and S.H. contributed to the resources and writing—review and editing. K.U.S. and A.D. contributed to the collected data and conducted the pre-processing of the input data. All authors have read and agreed to the published version of the manuscript.

Funding

This research received no external funding.

Institutional Review Board Statement

Not applicable.

Informed Consent Statement

Not applicable.

Data Availability Statement

The data presented in this study are available in supplementary material here.

Conflicts of Interest

The authors declare no conflict of interest.

References

  1. Sarker, I.H.; Kayes, A.S.M.; Badsha, S.; Alqahtani, H.; Watters, P.; Ng, A. Cybersecurity data science: An overview from machine learning perspective. J. Big Data 2020, 7, 41. [Google Scholar] [CrossRef]
  2. Sarker, I.H.; Kayes, A.S.M. Abc-ruleminer: User behavioral rule based machine learning method for context-aware intelligent services. J. Netw. Comput. Appl. 2020, 168, 102762. [Google Scholar] [CrossRef]
  3. Cao, L. Data science: A comprehensive overview. ACM Comput. Surv. (CSUR) 2017, 50, 43. [Google Scholar] [CrossRef] [Green Version]
  4. Han, J.; Pei, J.; Kamber, M. Data Mining: Concepts and Techniques; Elsevier: Amsterdam, The Netherlands, 2011. [Google Scholar]
  5. Sarker, I.H.; Hoque, M.M.; Kafil Uddin, M.; Tawfeeq, A. Mobile data science and intelligent apps: Concepts, ai-based modeling and research directions. Mob. Netw. Appl. 2021, 26, 285–303. [Google Scholar] [CrossRef]
  6. Marchand, A.; Marx, P. Automated product recommendations with preference-based explanations. J. Retail. 2020, 96, 328–343. [Google Scholar] [CrossRef]
  7. Witten, I.H.; Frank, E. Data Mining: Practical Machine Learning Tools and Techniques; Morgan Kaufmann: Burlington, NJ, USA, 2005. [Google Scholar]
  8. Sarker, I.H.; Watters, P.; Kayes, A.S.M. Effectiveness analisis of machine learning classification models for predicting personalized context-aware smartphone usage. J. Big Data 2019, 6, 57. [Google Scholar] [CrossRef] [Green Version]
  9. Harmon, S.A.; Sanford, T.H.; Sheng, X.; Turkbey, E.B.; Roth, H.; Ziyue, X.; Yang, D.; Myronenko, A.; Anderson, V.; Amalou, A.; et al. Artifcial intelligence for the detection of COVID-19 pneumonia on chest ct using multinational datasets. Nat. Commun. 2020, 11, 4080. [Google Scholar] [CrossRef]
  10. Chen, J.; Kou, G.; Peng, Y. The dynamic effects of online product reviews on purchase decisions. Technol. Econ. Dev. Econ. 2018, 24, 2045–2064. [Google Scholar] [CrossRef]
  11. Park, D.; Lee, J. eWOM overload and its effect on consumer behavioral intention depending on consumer involvement. Electron. Commer. Res. Appl. 2008, 7, 386–398. [Google Scholar] [CrossRef]
  12. Schneider, F.; Domahidi, E.; Dietrich, F. What Is Important When We Evaluate Movies? Insights from Computational Analysis of Online Reviews. Media Commun. 2020, 8, 153–163. [Google Scholar] [CrossRef]
  13. Raney, A.A.; Bryant, J. Entertainment and enjoyment as media effect. In Media Effects: Advances in Theory and Research, 4th ed.; Oliver, M.B., Raney, A.A., Bryant, J., Eds.; Routledge: New York, NY, USA, 2020; pp. 324–341. [Google Scholar]
  14. Quora, How Trustworthy Is IMDB with Its Ratings? Available online: https://www.quora.com/How-trustworthy-is-IMDB-with-its-ratings (accessed on 10 October 2022).
  15. Hsieh, J. Final Project: IMDB Data Analysis. 2015. Available online: http://mercury.webster.edu/aleshunas/Support%20Materials/Analysis/Hsieh-Final%20Project%20imdb.pdf (accessed on 10 October 2022).
  16. Qaisar, S.M. Sentiment Analysis of IMDb Movie Reviews Using Long Short-Term Memory. In Proceedings of the 2020 2nd International Conference on Computer and Information Sciences (ICCIS), Sakaka, Saudi Arabia, 13–15 October 2020; pp. 1–4. [Google Scholar] [CrossRef]
  17. Topal, K.; Ozsoyoglu, G. In Proceedings of the Movie review analysis: Emotion analysis of IMDb movie reviews. In Proceedings of the 2016 IEEE/ACM International Conference on Advances in Social Networks Analysis and Mining (ASONAM), Davis, CA, USA, 18–21 August 2016; pp. 1170–1176. [Google Scholar] [CrossRef]
  18. Nithin, V.; Pranav, M.; Babu, P.S.; Lijiya, A. Predicting Movie Success Based on IMDB Data. Int. J. Bus. Intell. 2014, 3, 34–36. [Google Scholar] [CrossRef]
  19. Naeem, M.Z.; Rustam, F.; Mehmood, A.; Din, M.Z.; Ashraf, I.; Choi, G.S. Classification of movie reviews using term frequency-inverse document frequency and optimized machine learning algorithms. PeerJ Comput. Sci. 2022, 8, e914. [Google Scholar] [CrossRef] [PubMed]
  20. Mehra, S.; Choudhary, T. Sentiment Analysis of User Entered Text. In Proceedings of the International Conference of Computational Techniques, Electronics and Mechanical Systems (CTEMS), Belgaum, India, 21–22 December 2018; ISBN 978-1-5386-7709-4. [Google Scholar]
  21. Bulut, H.; Korukoglu, S. Analysis and Clustering of Movie Genres. J. Comput. 2011, 3, 16–23. [Google Scholar]
  22. Aditya, T.S.; Rajaraman, K.; Subashini, M.M. Comparative Analysis of Clustering Techniques for Movie Recommendation. In Proceedings of the MATEC Web of Conferences 225, Nadu, India, 18–19 September 2018; p. 02004. [Google Scholar]
  23. Lawson, R. Web Scraping with Python; Packt Publishing Ltd.: Birmingham, UK, 2015. [Google Scholar]
  24. Gheorghe, M.; Mihai, F.-C.; Dârdală, M. Modern techniques of web scraping for data scientists. Int. J. User-Syst. Interact. 2018, 11, 63–75. [Google Scholar]
  25. Rahman, R.U.; Tomar, D.S. Threats of price scraping on e-commerce websites: Attack model and its detection using neural network. J. Comput. Virol. Hacking Tech. 2020, 17, 75–89. [Google Scholar] [CrossRef]
  26. Watson, H.J. Tutorial: Big Data Analytics: Concepts, Technologies, and Applications. Commun. Assoc. Inf. Syst. 2014, 34, 1247–1268. [Google Scholar] [CrossRef]
  27. Sarker, K.U.; Deraman, A.B.; Hasan, R.; Abbas, A. Ontological Practice for Big Data Management. Int. J. Comput. Digit. Syst. 2019, 8, 265–273. Available online: https://journal.uob.edu.bh/handle/123456789/3485 (accessed on 24 July 2022). [CrossRef]
  28. Almaqbali, I.S.; Al Khufairi, F.M.; Khan, M.S.; Bhat, A.Z.; Ahmed, I. Web Scrapping: Data Extraction from Websites. J. Stud. Res. 2019, 12. [Google Scholar] [CrossRef]
  29. Chaulagain, R.S.; Pandey, S.; Basnet, S.R.; Shakya, S. Cloud based web scraping for big data applications. In Proceedings of the 2017 IEEE International Conference on Smart Cloud (SmartCloud), New York, NY, USA, 3–5 November 2017; pp. 138–143. [Google Scholar]
  30. Sirisuriya, D.S. A comparative study on web scraping. In Proceedings of the 8th International Research Conference, KDU, Palisades, NY, USA, 7–10 October 2015. [Google Scholar]
  31. Milev, P. Conceptual approach for development of web scraping application for tracking information. Econ. Altern. 2017, 3, 475–485. [Google Scholar]
  32. Hillen, J. Web scraping for food price research. Br. Food J. 2019, 121, 3350–3361. [Google Scholar] [CrossRef]
  33. Shaukat, K.; Alam, T.M.; Ahmed, M.; Luo, S.; Hameed, I.A.; Iqbal, M.S.; Li, J. A Model to Enhance Governance Issues through Opinion Extraction. In Proceedings of the 2020 11th IEEE Annual Information Technology, Electronics and Mobile Communication Conference (IEMCON), Vancouver, BC, Canada, 4–7 November 2020; pp. 0511–0516. [Google Scholar] [CrossRef]
  34. Mitchell, R. Web Scraping with Python: Collecting More Data from the Modern Web; O’Reilly Media, Inc.: Sebastopol, CA, USA, 2018. [Google Scholar]
  35. Broucke, S.V.; Baesens, B. Practical Web Scraping for Data Science: Best Practices and Examples with Python, 1st ed.; Apress: New York, NY, USA, 2018. [Google Scholar]
  36. Black, M.L. The World Wide Web as Complex Data Set: Expanding the Digital Humanities into the Twentieth Century and Beyond through Internet Research. Int. J. Humanit. Arts Comput. 2016, 10, 95–109. [Google Scholar] [CrossRef]
  37. Zhao, B. Web scraping. In Encyclopedia of Big Data; Springer International Publishing: Berlin/Heidelberg, Germany, 2017; pp. 1–3. [Google Scholar]
  38. Tarannum, T. Cleaning of Web Scraped Data with Python. Doctoral Dissertation, Brac University, Dhaka, Bangladesh, 1 April 2019. [Google Scholar]
  39. Manjushree, B.S.; Sharvani, G.S. Survey on Web scraping technology. Wutan Huatan Jisuan Jishu 2020, XVI(VI), 1–8. [Google Scholar]
  40. Yannikos, Y.; Heeger, J.; Brockmeyer, M. An Analysis Framework for Product Prices and Supplies in Darknet Marketplaces. In Proceedings of the 14th International Conference on Availability, Reliability and Security, New York, NY, USA, 26 August 2019; Association for Computing Machinery: New York, NY, USA, 2019. [Google Scholar]
  41. Kurniawati, D.; Triawan, D. Increased information retrieval capabilities on e-commerce websites using scraping techniques. In Proceedings of the 2017 International Conference on Sustainable Information Engineering and Technology (SIET), Malang, Indonesia, 24–25 November 2017; pp. 226–229. [Google Scholar]
  42. Raicu, I. Financial Banking Dataset for Supervised Machine Learning Classification. Inform. Econ. 2019, 23, 37–49. [Google Scholar] [CrossRef]
  43. Mbah, R.B.; Rege, M.; Misra, B. Discovering Job Market Trends with Text Analytics. In Proceedings of the 2017 International Conference on Information Technology (ICIT), Singapore, 27–29 December 2017; pp. 137–142. [Google Scholar] [CrossRef]
  44. Farooq, B.; Husain, M.S.; Suaib, M. New Insights into Rental Housing Markets across the United States: Web Scraping and Analyzing Craigslist Rental Listings. Int. J. Adv. Res. Comput. Sci. 2018, 9, 64–67. [Google Scholar]
  45. Lunn, S.; Zhu, J.; Ross, M. Utilizing Web Scraping and Natural Language Processing to Better Inform Pedagogical Practice. In Proceedings of the 2020 IEEE Frontiers in Education Conference (FIE), Uppsala, Sweden, 21–24 October 2020; pp. 1–9. [Google Scholar] [CrossRef]
  46. Andersson, P. Developing a Python Based Web Scraper: A Study on the Development of a Web Scraper for TimeEdit. Master’s. Thesis, Mid Sweden University, Holmgatan, Sweden, 1 July 2021. Available online: https://www.diva-portal.org/smash/get/diva2:1596457/FULLTEXT01.pdf (accessed on 8 August 2022).
  47. Uzun, E.; Yerlikaya, T.; Kirat, O. Comparison of Python Libraries used for Web Data Extraction. J. Tech. Univ.–Sofia Plovdiv Branch Bulg. “Fundam. Sci. Appl.” 2018, 24, 87–92. [Google Scholar]
  48. Uzun, E.; Buluş, H.N.; Doruk, A.; Özhan, E. Evaluation of Hap, Angle Sharp and HTML Document in web content extraction. In Proceedings of the International Scientific Conference’2017 (UNITECH’17), Gabrovo, Bulgaria, 17–18 November 2017; Volume II, pp. 275–278. [Google Scholar]
  49. Ferrara, E.; De Meo, P.; Fiumara, G.; Baumgartner, R. Web data extraction, applications and techniques: A survey. Knowl.-Based Syst. 2014, 70, 301–323. [Google Scholar] [CrossRef] [Green Version]
  50. Munzert, S.; Rubba, C.; Meißner, P.; Nyhuis, D. Automated Data Collection with R: A Practical Guide to Web Scraping and Text Mining; John Wiley & Sons, Ltd.: Chichester, UK, 2015. [Google Scholar]
  51. Krotov, V.; Tennyson, M. Scraping Financial Data from the Web Using the R Language. J. Emerg. Technol. Account. 2018, 15, 169–181. [Google Scholar] [CrossRef]
  52. Ives, B.; Palese, B.; Rodriguez, J.A. Enhancing Customer Service through the Internet of Things and Digital Data Streams. MIS Q. Exec. 2016, 15, 4. [Google Scholar]
  53. Constantiou, I.D.; Kallinikos, J. New Games, New Rules: Big Data and the Changing Context of Strategy. J. Inf. Technol. 2015, 30, 44–57. [Google Scholar] [CrossRef] [Green Version]
  54. Snell, J.; Menaldo, N. Web Scraping in an Era of Big Data 2.0. Bloomberg BNA. 2016. Available online: https://www.bna.com/web-scraping-era-n57982073780/ (accessed on 13 September 2022).
  55. Dryer, A.J.; Stockton, J. Internet ‘Data Scraping’: A Primer for Counseling Clients. New York Law Journal. 2013. Available online: https://www.law.com/newyorklawjournal/almID/1202610687621 (accessed on 13 September 2022).
  56. Alam, T.M.; Shaukat, K.; Hameed, I.A.; Khan, W.A.; Sarwar, M.U.; Iqbal, F.; Luo, S. A novel framework for prognostic factors identification of malignant mesothelioma through association rule mining. Biomed. Signal Process. Control. 2021, 68, 102726. [Google Scholar] [CrossRef]
  57. Sulong, G.; Mohammedali, A. Recognition of human activities from still image using novel classifier. J. Theor. Appl. Inf. Technol. 2015, 71, 59103531. [Google Scholar]
  58. Mallat, S. A Wavelet Tour of Signal Processing: The Sparse Way; Academic Press: Cambridge, MA, USA, 2008. [Google Scholar]
  59. Gutiérrez-Gómez, L.; Petry, F.; Khadraoui, D. A comparison framework of machine learning algorithms for mixed-type variables datasets: A case study on tire-performances prediction. IEEE Access 2020, 8, 214902–214914. [Google Scholar] [CrossRef]
  60. Starck, J.; Murtagh, F.; Fadili, J. Sparse Image and Signal Processing: Wavelets and Related Geometric Multiscale Analysis; Cambridge University Press: Cambridge, UK, 2015. [Google Scholar]
  61. Mohammed, M.; Khan, M.B.; Bashier Mohammed, B.E. Machine Learning: Algorithms and Applications; CRC Press: Boca Raton, FL, USA, 2016. [Google Scholar]
  62. Paltrinieri, N.; Comfort, L.; Reniers, G. Learning about risk: Machine learning for risk assessment. Saf. Sci. 2019, 118, 475–486. [Google Scholar] [CrossRef]
  63. Shaukat, K.; Iqbal, F.; Alam, T.M.; Aujla, G.K.; Devnath, L.; Khan, A.G.; Iqbal, R.; Shahzadi, I.; Rubab, A. The Impact of Artificial intelligence and Robotics on the Future Employment Opportunities. Trends Comput. Sci. Inf. Technol. 2020, 5, 050–054. [Google Scholar]
  64. Yu, S.; Chen, Y.; Zaidi, H. AVA: A financial service chatbot based on deep bidirectional transformers. Front. Appl. Math. Stat. 2021, 7, 604842. [Google Scholar] [CrossRef]
  65. Eling, M.; Nuessl, D.; Staubli, J. The impact of artificial intelligence along the insurance value chain and on the insurability of risks. In Geneva Paper on Risk and Insurance-Issues and Practices; Springer: Berlin/Heidelberg, Germany, 2021. [Google Scholar] [CrossRef]
  66. Dornadula, V.N.; Geetha, S. Credit card fraud detection using machine learning algorithms. Procedia Comput. Sci. 2019, 165, 631–641. [Google Scholar] [CrossRef]
  67. Leo, M.; Sharma, S.; Maddulety, K. Machine learning in banking risk management: A literature review. Risks 2019, 7, 29. [Google Scholar] [CrossRef] [Green Version]
  68. Zand, A.; Orwell, J.; Pfluegel, E. A secure framework for anti-money laundering using machine learning and secret sharing. In Proceedings of the International Conference on Cyber Security and Protection of Digital Services, Dublin, Ireland, 15–19 June 2020; pp. 1–7. [Google Scholar] [CrossRef]
  69. Gu, S.; Kelly, B.; Xiu, D. Empirical asset pricing via machine learning. Rev. Financ. Stud. 2020, 33, 2233–2273. [Google Scholar] [CrossRef] [Green Version]
  70. Ye, T.; Zhang, L. Derivatives pricing via machine learning. J. Math. Financ. 2019, 9, 561–589. [Google Scholar] [CrossRef] [Green Version]
  71. Javed, U.; Shaukat, K.; AHameed, I.; Iqbal, F.; Mahboob Alam, T.; Luo, S. A Review of Content-Based and Context-Based Recommendation Systems. Int. J. Emerg. Technol. Learn. (iJET) 2021, 16, 274–306. [Google Scholar] [CrossRef]
  72. Ramzan, B.; Bajwa, I.S.; Jamil, N.; Amin, R.U.; Ramzan, S.; Mirza, F.; Sarwar, N. An Intelligent Data Analysis for Recommendation Systems Using Machine Learning. Sci. Program. 2019, 2019, 5941096. [Google Scholar] [CrossRef]
  73. Zhou, Y.; Mao, H.; Yi, Z. Cell mitosis detection using deep neural networks. Knowl.-Based Syst. 2017, 137, 19–28. [Google Scholar] [CrossRef]
  74. Yang, S.; Korayem, M.; AlJadda, K.; Grainger, T.; Natarajan, S. Combining content-based and collaborative filtering for job recommendation system: A cost-sensitive statistical relational learning approach. Knowl.-Based Syst. 2017, 136 (Suppl. C), 37–45. [Google Scholar] [CrossRef]
  75. Cohen, Y.; Hendler, D.; Rubin, A. Detection of malicious webmail attachments based on propagation patterns. Knowl.-Based Syst. 2018, 141, 67–79. [Google Scholar] [CrossRef]
  76. Shaukat, K.; Luo, S.; Varadharajan, V.; Hameed, I.A.; Chen, S.; Liu, D.; Li, J. Performance Comparison and Current Challenges of Using Machine Learning Techniques in Cybersecurity. Energies 2020, 13, 2509. [Google Scholar] [CrossRef]
  77. Shaukat, K.; Luo, S.; Varadharajan, V.; Hameed, I.A.; Xu, M. A Survey on Machine Learning Techniques for Cyber Security in the Last Decade. IEEE Access 2020, 8, 222310–222354. [Google Scholar] [CrossRef]
  78. Rodr’ıguez, C.; Florian, D.; Casati, F. Mining and quality assessment of mashup model patterns with the crowd: A feasibility study. ACM Trans. Internet Technol. 2016, 16, 17. [Google Scholar] [CrossRef] [Green Version]
  79. Xu, K.; Zheng, X.; Cai, Y.; Min, H.; Gao, Z.; Zhu, B.; Xie, H.; Wong, T. Improving user recommendation by extracting social topics and interest topics of users in uni-directional social networks. Knowl.-Based Syst. 2018, 140 (Suppl. C), 120–133. [Google Scholar] [CrossRef]
  80. Castillo, P.A.; Mora, A.M.; Faris, H.; Merelo, J.J.; García-Sanchez, P.; Fernandez-Ares, A.J.; de las Cuevas, P.; Garcıa-Arenas, M.I. Applying computational intelligence methods for predicting the sales of newly published books in a real editorial business management environment. Knowl.-Based Syst. 2017, 115 (Suppl. C), 133–151. [Google Scholar] [CrossRef]
  81. Hajek, P.; Henriques, R. Mining corporate annual reports for intelligent detection of financial statement fraud–Comparative study of machine learning methods. Knowl.-Based Syst. 2017, 128, 139–152. [Google Scholar] [CrossRef]
  82. Lee, W.; Chen, C.; Huang, J.; Liang, J. A smartphone-based activity aware system for music streaming recommendation. Knowl.-Based Syst. 2017, 131 (Suppl. C), 70–82. [Google Scholar] [CrossRef]
  83. Tavallaee, M.; Bagheri, E.; Lu, W.; Ghorbani, A.A. A detailed analysis of the kdd cup 99 data set. In. IEEE symposium on computational intelligence for security and defense applications. IEEE 2009, 2009, 1–6. [Google Scholar]
  84. Pedregosa, F.; Varoquaux, G.; Gramfort, A.; Michel, V.; Thirion, B.; Grisel, O.; Blondel, M.; Prettenhofer, P.; Weiss, R.; Dubourg, V.; et al. Scikit-learn: Machine learning in python. J. Mach. Learn. Res. 2011, 12, 2825–2830. [Google Scholar]
  85. Wu, C.-C.; Yen-Liang, C.; Yi-Hung, L.; Xiang-Yu, Y. Decision tree induction with a constrained number of leaf nodes. Appl. Intell. 2016, 45, 673–685. [Google Scholar] [CrossRef]
  86. Holte, R.C. Very simple classification rules perform well on most commonly used datasets. Mach. Learn. 1993, 11, 63–90. [Google Scholar] [CrossRef]
  87. John, G.H.; Langley, P. Estimating continuous distributions in Bayesian classifiers. In Proceedings of the Eleventh Conference on Uncertainty in Artificial Intelligence; Morgan Kaufmann Publishers Inc.: Burlington, NJ, USA, 1995; pp. 338–345. [Google Scholar]
  88. Sarker, I.H. A machine learning based robust prediction model for real-life mobile phone data. Internet Things 2019, 5, 180–193. [Google Scholar] [CrossRef] [Green Version]
  89. LeCessie, S.; Van Houwelingen, J.C. Ridge estimators in logistic regression. J. R. Stat. Soc. Ser. C (Appl. Stat.) 1992, 41, 191–201. [Google Scholar]
  90. Kibler, D.; Albert, M. Instance-based learning algorithms. Mach. Learn. 1991, 6, 37–66. [Google Scholar]
  91. Keerthi, S.S.; Shevade, S.K.; Bhattacharyya, C.; Radha Krishna, M.K. Improvements to platt’s smo algorithm for svm classifer design. Neural Comput. 2001, 13, 637–649. [Google Scholar] [CrossRef]
  92. Quinlan, J.R. C4.5: Programs for machine learning. Mach. Learn. 1993, 16, 235–240. [Google Scholar]
  93. Sarker, I.H.; Abushark, Y.B.; Alsolami, F.; Khan, A. Intrudtree: A machine learning based cyber security intrusion detection model. Symmetry 2020, 12, 754. [Google Scholar] [CrossRef]
  94. Sarker, I.H.; Alan, C.; Jun, H.; Khan, A.I.; Abushark, Y.B.; Khaled, S. Behavdtee: A behavioral decision tree learning to build user-centric context-aware predictive model. Mob. Netw. Appl. 2019, 25, 1151–1161. [Google Scholar] [CrossRef] [Green Version]
  95. Quinlan, J.R. Induction of decision trees. Mach. Learn. 1986, 1, 81–106. [Google Scholar] [CrossRef] [Green Version]
  96. Breiman, L.; Friedman, J.; Stone, C.J.; Olshen, R.A. Classifcation and Regression Trees; CRC Press: Boca Raton, FL, USA, 1984. [Google Scholar]
  97. Breiman, L. Random forests. Mach. Learn. 2001, 45, 5–32. [Google Scholar] [CrossRef] [Green Version]
  98. Breiman, L. Bagging predictors. Mach. Learn. 1996, 24, 123–140. [Google Scholar] [CrossRef] [Green Version]
  99. Amit, Y.; Geman, D. Shape quantization and recognition with randomized trees. Neural Comput. 1997, 9, 1545–1588. [Google Scholar] [CrossRef] [Green Version]
  100. Puterman, M.L. Markov Decision Processes: Discrete Stochastic Dynamic Programming; John Wiley & Sons: Hoboken, NJ, USA, 2014. [Google Scholar]
  101. Freund, Y.; Schapire, R.E. Experiments with a new boosting algorithm. Icml Citeseer 1996, 96, 148–156. [Google Scholar]
  102. Iqbal, M.A. Application of Regression Techniques with their Advantages and Disadvantages. Elektron. Mag. 2021, 4, 11–17. [Google Scholar]
  103. Ciulla, G.; Amico, A.D. Building energy performance forecasting: A multiple linear regression approach. Appl. Energy 2019, 253, 113500. [Google Scholar] [CrossRef]
  104. Maio, F.D.; Tsui, K.L.; Zio, E. Combining relevance vector machines and exponential regression for bearing residual life estimation. Mech. Syst. Signal Process. 2012, 31, 405–427. [Google Scholar] [CrossRef]
  105. Kim, S.J.; Kim, C.H.; Jung, S.Y.; Kim, Y.J. Optimal design of novel pole piece for power density improvement of magnetic gear using polynomial regression analysis. IEEE Trans. Energy Convers. 2015, 30, 1171–1179. [Google Scholar] [CrossRef]
  106. Wi, Y.M.; Joo, S.K.; Song, K.B. Holiday load forecasting using fuzzy polynomial regression with weather feature selection and adjustment. IEEE Trans. Power Syst. 2011, 27, 596–603. [Google Scholar] [CrossRef]
  107. Wiering, M.A.; Van Otterlo, M. Reinforcement learning. Adapt. Learn. Optim. 2012, 12, 729. [Google Scholar]
  108. Kaelbling, L.P.; Littman, M.L.; Moore, A.W. Reinforcement learning: A survey. J. Artif. Intell. Res. 1996, 4, 237–285. [Google Scholar] [CrossRef] [Green Version]
  109. Dar, K.S.; Javed, I.; Amjad, W.; Aslam, S.; Shamim, A. A Survey of clustering applications. J. Netw. Commun. Emerg. Technol. (JNCET) 2015, 4, 10–15. [Google Scholar]
  110. Dagli, Y. Partitional Clustering using CLARANS Method with Python Example. 2019. Available online: https://medium.com/analytics-vidhya/partitional-clustering-using-clarans-method-with-python-example-545dd84e58b4 (accessed on 29 August 2022).
  111. Shaukat, K.; Masood, N.; Shafaat, A.B.; Jabbar, K.; Shabbir, H.; Shabbir, S. Dengue Fever in Perspective of Clustering Algorithms. arXiv 2015, arXiv:abs/1511.07353. [Google Scholar]
  112. Chauhan, N.S. DBSCAN Clustering Algorithm in Machine Learning. An Introduction to the DBSCAN Algorithm and Its Implementation in Python. KDnuggets. 2022. Available online: https://www.kdnuggets.com/2020/04/dbscan-clustering-algorithm-machine-learning.html (accessed on 30 August 2022).
  113. Iqbal, H. Sarker, Machine Learning: Algorithms, Real-World Applications and Research Directions. SN Comput. Sci. 2021, 2, 160. [Google Scholar]
  114. Maas, A.L.; Daly, R.E.; Pham, P.T.; Huang, D.; Ng, A.Y.; Potts, C. Learning word vectors for sentiment analysis. In Proceedings of the 49th Annual Meeting of the Association for Computational Linguistics: Human Language Technologies, Stroudsburg, PA, USA, 19–24 June 2011; Volume 1, pp. 142–150. [Google Scholar]
  115. Shaukat, K.; Luo, S.; Varadharajan, V. A novel method for improving the robustness of deep learning-based malware detectors against adversarial attacks. Eng. Appl. Artif. Intell. 2022, 116, 105461. [Google Scholar] [CrossRef]
Figure 1. Research methodology.
Computers 11 00158 g001
Figure 2. Selected fields for data-scraping.
Computers 11 00158 g002
Figure 3. Sample of Rating, Score, income, and votes.
Computers 11 00158 g003
Figure 4. Score vs. Rating. (a) Scatter Plot; (b) Box Plot.
Computers 11 00158 g004
Figure 5. (i) The elbow method and (ii) the clustering model.
Computers 11 00158 g005
Table 1. Python libraries for web-scraping.
LibrariesDescription
RequestsIt is the most basic and essential library for web-scraping that is used for various HTTP requests like GET and POST to extract information from HTML server pages [48]. It is simple, support HTTP(s) proxy and it is easy to get chunk amount data from static web pages, but it cannot parse data from retrieved HTML files or collet information from Java script pages [47].
Beautiful SoupPerhaps it is the most used Python library that creates parse tree for parsing HTML and XML document. It is comparatively easier and suitable for beginners to extract information and combine with lxml. It is commonly used with Requests in industries though it is slower than pure lxml [47,49].
lxmlThis is a blazingly fast HTML and XML parsing library of Python that shows high performance for large amount dataset scraping [49]. It also works with Requests in industries. It supports data extraction by CSS and XPath selectors but is not good for poorly designed HTML webpages [48].
SeleniumIt was developed for automatic webpage testing and pretty quickly it has turned into a data science for web-scraping. It supports web-scraping dynamically populated pages. It is not suitable for large application but can be applied if time and speed is not a concern.
ScrapyIt is a web-scraping framework that can crawl multiple web sites by spider bots. It is asynchronous to send multiple HTTP requests simultaneously. It can extract data from dynamic websites using the Splash library [49].
Table 2. Grey checklist of web-scraping [50,54].
SpecificationRemarks
Web-scraping is explicitly prohibited by terms and conditions.No
The extracted data are confidential for the organization.No
Information of the website is copyrighted.No
Are data going to be used for illegal, fraudulent, or commercial purposes?No
Scraping causes information or system damage.No
Web-scraping diminishes the service.No
Collected data are going to compromise individuals’ privacy.No
Collected information will be shared.No
Table 3. Complete dataset.
Unnamed:0Name_of_MovieRelease_YearDuration_of_FlimRatingScoreVotesIncome
01Cameraperson20161027.48629000
12Goldfinger19641107.787189,66151.08
26True Grit20101107.680337,113171.24
37Nebraska20131157.787118,21517.65
49Paterson20161187.39081,2702.14
41978Pan’s Labyrinth20061188.298662,74737.63
42085The Best Years of Our Lives19461708.19364,31023.65
42188Tampopo19851147.98719,0970.22
42289Werckmeister harm6niak20001458.09214,2310.03
42398Rio Bravo19591418.09362,48512.54
424 rows × 8 columns
Table 5. Comparison of partition clustering.
Comparing FactorsK-MeansK-MedoidsCLARACLARANS
Implementation on practical dataset of application users’ opinions.EasierAcceptableComplicatedComplicated
Appropriateness of the algorithm based on the size of the dataset.SmallerSmallerLargerLarger
Time complexity for n points, k is clusters, s is the sample size, and i is iterations.O(ink)O(k(n − k)2)O(k(s2 + n − k))O(n2)
Accuracy of the clustering sensitive for outliers.YesNoNoNo
Table 6. Comparison on the studies of IMDB movie data.
Research on IMDB
Movie Information
Objective of the ResearchData ExtractionOutcomes
S. M. Qaisar [16]Classification: Sentiment analysis based on the text of the review comments.Used data repository: created by Andrew Maas [114] The comments are classified into positive and negative classification by the Long Short-Term Memory (LSTM) classifier and showed that the classification accuracy is 89.9%.
Sourav M. and Tanupriya C. [20]Classification: Sentiment analysis based on the text of the review comments.Used data repository: the “IMDB Large Movie Review Dataset”Compared and analyzed SVM machine with Naïve Bayes and showed that SVM is more accurate than Naïve Bayes.
Naeem et al. [19]Classification: Sentiment analysis based on the text of the review comments.Used data repository: Kaggle.comCompared gradient boosting classifiers, support vector machines (SVM), Naïve Bayes classifier, and random forest and showed that SVM is better than any other methods.
Aditya TS et al. [22]Clustering: Based on the on rating with respect to years, Facebook likes, and budget.Used data repository: the Movie Database on kaggle.comCreated different clusters based on the rating of the movies with respect to release year, Facebook likes, etc., that support the user to select a popular movie from a particular domain.
Hasan B. and Serdar K. [21]Clustering: Based on the genre of the movies.Used data repository: the “IMDB Large Movie Review Dataset”Created different clusters based on the genre of the movies that supports the user to select a popular movie from a particular genre.
Our study Clustering: Based on the Metascore and Rating.Web-scraped up-to-date data Our study validates the scoring systems and supports the user to make faster decision based on the outcome of both scoring systems.
Publisher’s Note: MDPI stays neutral with regard to jurisdictional claims in published maps and institutional affiliations.

