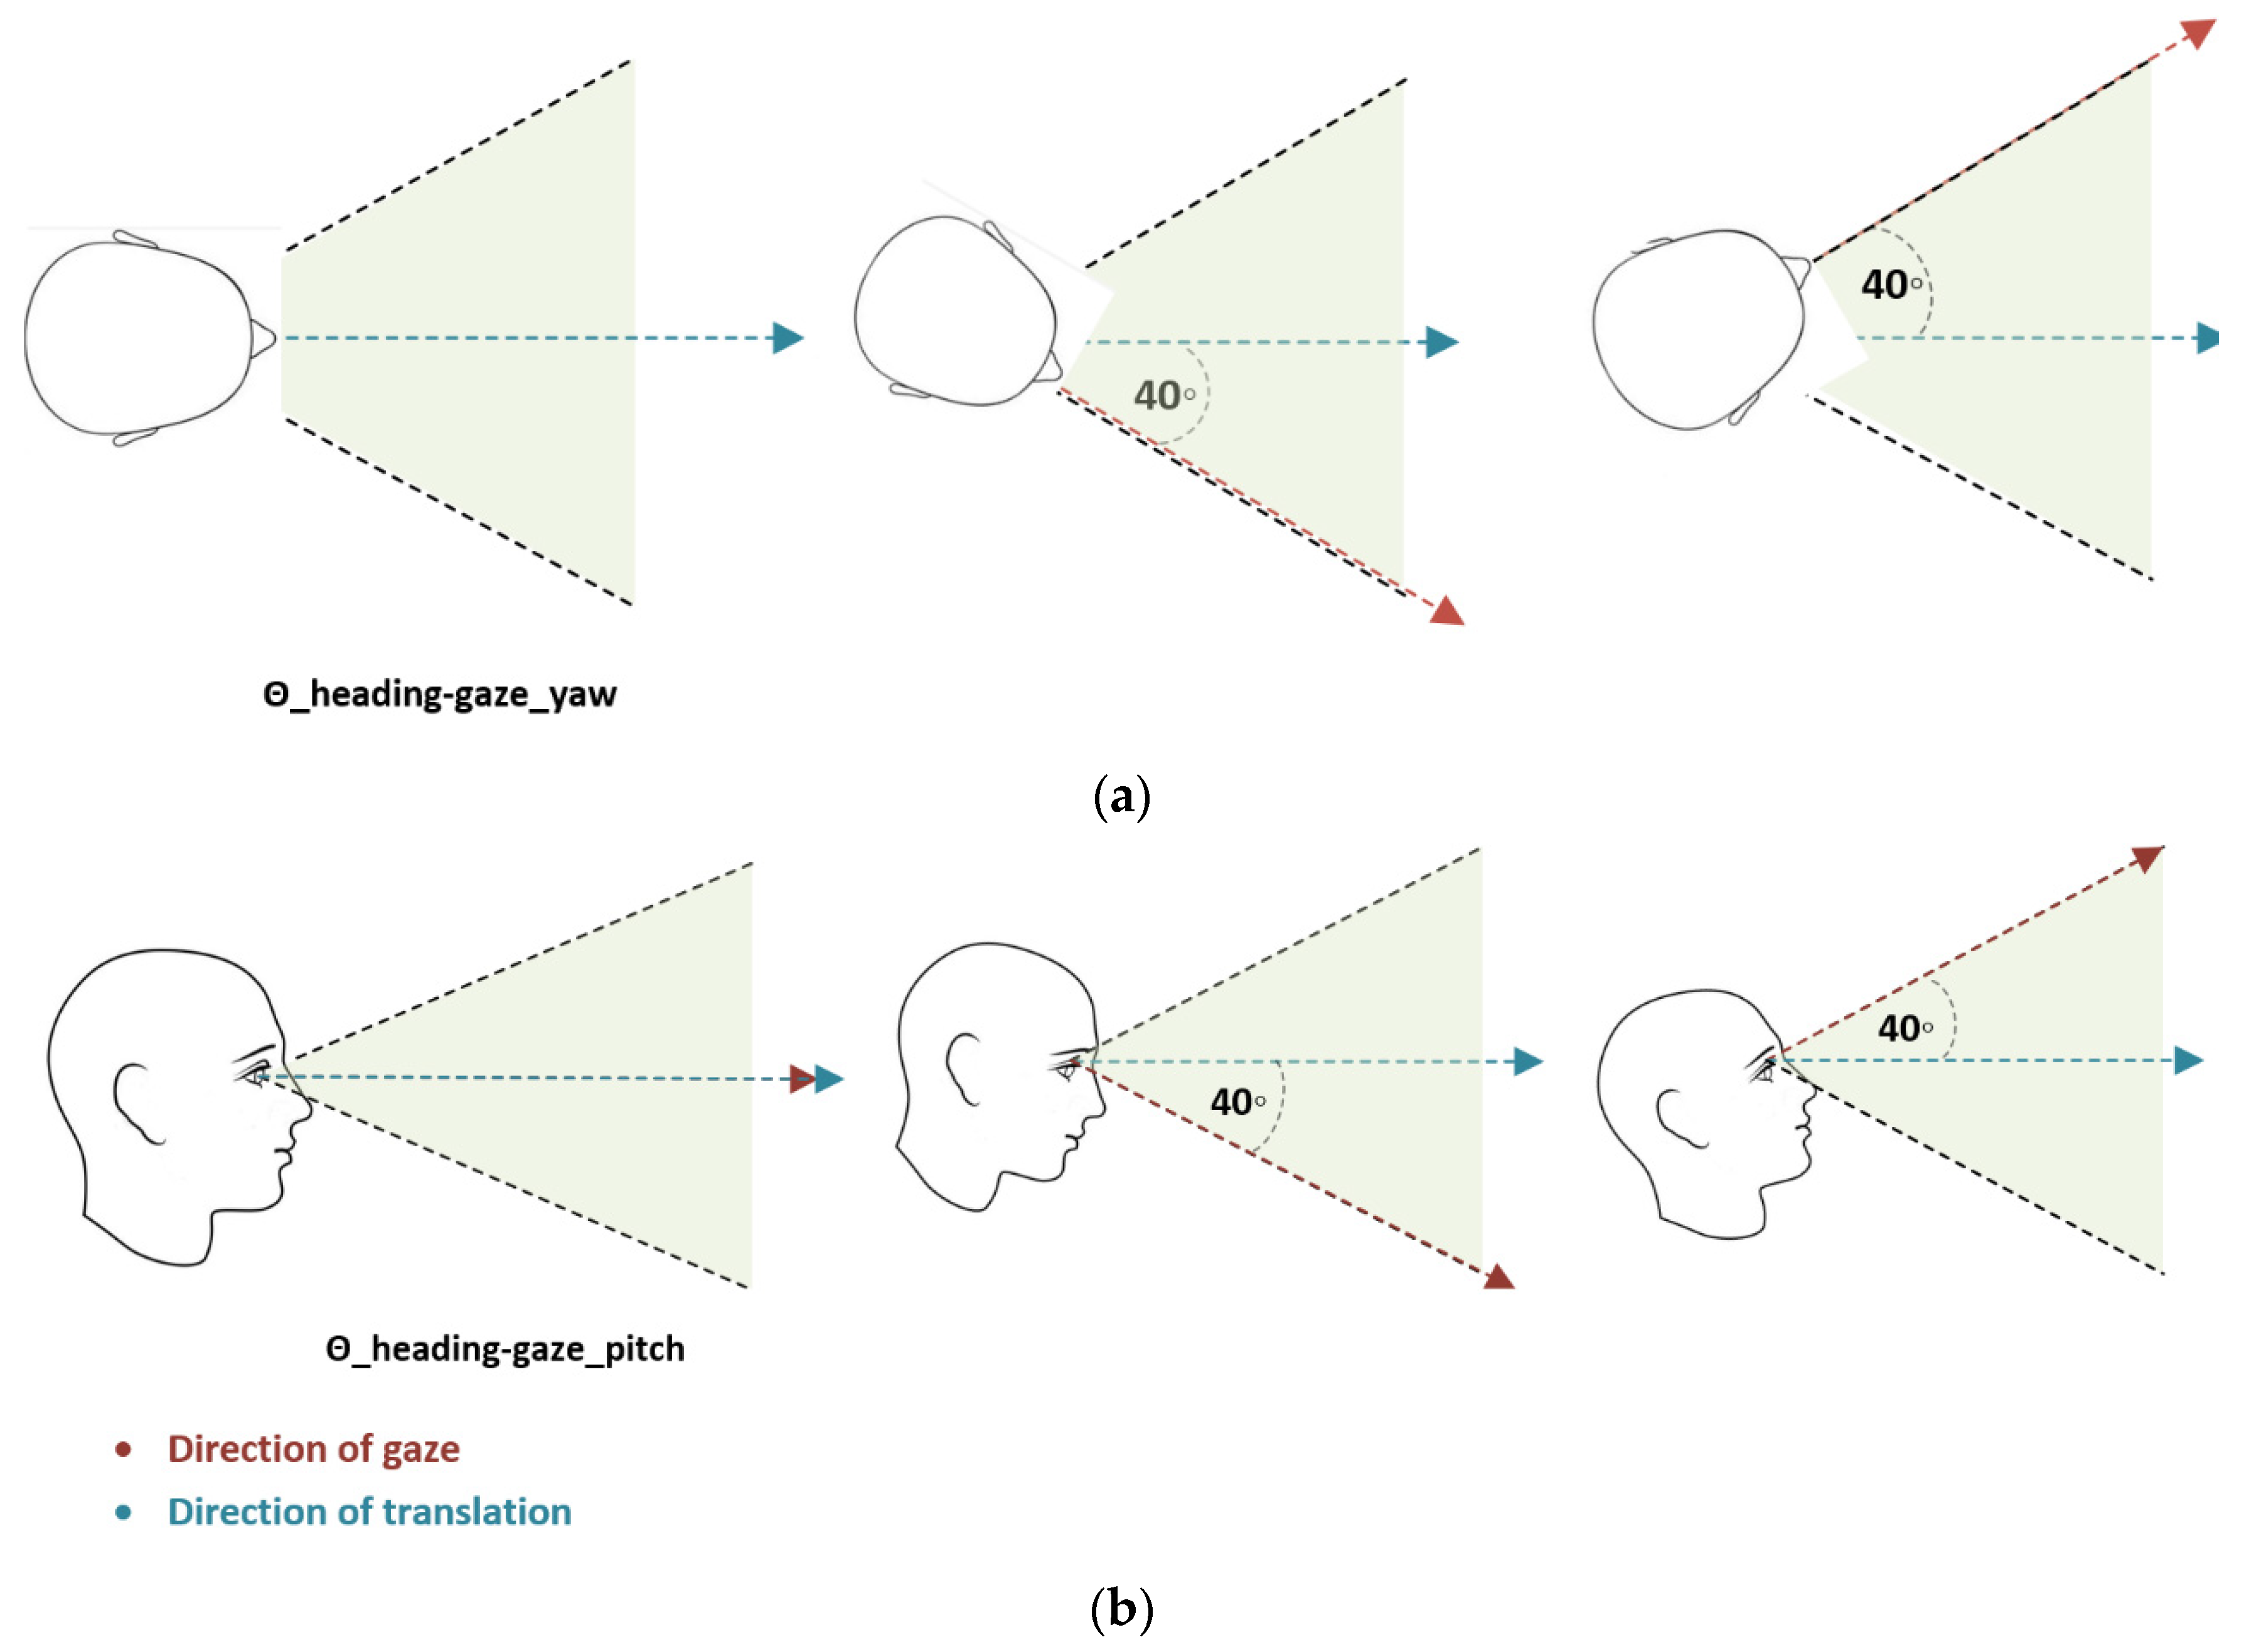
Article

Composite Spatial Manipulation Framework for Redirected Walking

Department of Electrical Engineering and Computer Science, University of Kassel, 34127 Kassel, Germany
*
Author to whom correspondence should be addressed.
Computers 2022, 11(11), 156; https://doi.org/10.3390/computers11110156
Submission received: 18 September 2022 / Revised: 27 October 2022 / Accepted: 27 October 2022 / Published: 31 October 2022

Abstract

:
In this study, we present a composite spatial manipulation framework for the redirected walking technique. The proposed framework focuses on utilizing two different approaches simultaneously to manipulate the user’s position and orientation in the physical space, aiming to substantially improve their redirection in a confined physical space and reduce the special requirements for the RDW technique. Each approach utilizes different perceptual processes. The first is a discrete spatial manipulation approach that introduces translation and/or rotation gains to the user’s virtual perspective in the immersive virtual environment (IVE) during temporal events such as eyeblinks. The second approach is the continuous spatial manipulation approach, which continuously introduces (with each frame) translation and/or rotation gains below the user’s perception threshold to their virtual perspective in the IVE. Two simulation experiments were conducted to investigate the feasibility of adopting the composite spatial manipulation framework for RDW without considering the user’s walking behavior or the impact of the proposed approach on user performance in the immersive virtual environment. In the second simulation experiment we aimed to investigate the performance of the proposed approach while considering the user’s walking behavior and performance in the IVE. Finally, a user experiment was conducted to validate the proposed framework and its impact on the user’s performance in the IVE. The findings revealed a significant improvement in the redirection performance of the proposed controller when it was compared to the classical RDW controller. Additionally, there was significant improvement in the user’s performance when the composite RDW controller was utilized.

1. Introduction

Walking is the most effective and intuitive approach to performing locomotion in immersive virtual environments (IVEs). Several perceptual and cognitive studies have demonstrated how virtual locomotion interfaces that utilize real walking have substantial benefits over other kinds of locomotion techniques in terms of a sense of presence, the buildup of the cognitive map [1], the imposed cognitive load [2], and navigational search tasks [3]. Due to the occurrence of physical movement, vestibular self-motion and kinesthetic proprioceptive information are produced, leading to a more realistic and natural navigation experience. However, most of the time it is not possible to use real walking processes in VR because the area of the virtual environment is much larger than the area of the physical space that is available in the real world.
The redirected walking (RDW) technique was proposed in a previous study [4] to solve this issue by introducing an imperceptible increase in rotation into the participant’s virtual preceptive in an immersive virtual environment (IVE), such that the inserted rotation gain is below the perception threshold of the participant. Consequently, the participant unconsciously compensates for these rotation gains, causing them to perceive a straight walking path in the IVE while walking along a circular one in the real physical world.
The RDW technique utilizes imperceptible manipulations in the form of translation, rotation, curvature, and bending gains to redirect the user away from the boundaries of the tracked physical space. However, due to the fact that the user’s walking behavior is hard to predict, there is no guarantee that the RDW controller will always successfully redirect the user away from the boundaries of the tracked space by utilizing only the gain manipulation. Therefore, an overt intervention is necessary to avoid a collision with the boundaries of the physical space and keep the user within the tracked area. Unfortunately, this overt intervention is inherently disruptive and has negative implications on the presence (the feeling of being in the VE) and the user’s experience in the VR. For detailed information about the RDW technique, please refer to [5].
Since the RDW technique was announced [6], a large body of research has been conducted to fine-tune this approach. These studies have made a significant contribution to the development of the RDW technique. However, despite the large volume of published studies, and the benefit of utilizing a full gait locomotion interface by means of the RDW technique, it has still not been adopted by the developers of immersive VR experiences. This is because of several issues that are related to its generalization, for instance, some RDW controllers are scripted like RDW controllers, which are utilized in impossible spaces [7] and which make use of change blindness redirection [8]. These are scripted controllers, meaning that this type of controller needs to be reprogrammed with every scene to be able to manipulate the geometry of the spaces inside the VE. Furthermore, another issue concerns the support for unconstrained walking in the IVE and the spatial requirements for the RDW technique to obtain a walking experience in the VR that is equivalent to natural walking in the real world.
Previous psychophysical studies have evaluated the optimal space that is required for RDWT to produce an experience that is functionally equivalent to real walking in terms of the proprioceptive, vestibular, and visual feedback. The findings varied from 35 × 35 m [9] to 40 × 40 m [10] to 60 × 60 m [11]. Another research study [12] proposed a room-scale VR setup that utilized a physical space measuring 4 × 4 m. Using the proposed approach, it was possible to explore 25 × 25 m of virtual space. However, this approach does not support free exploration because the participant has to follow a specific path in the VE. Irrespective of which of these different findings is correct, the spatial area that is required for the optimal performance of RDWT is considered a major limiting factor that precludes its use in practical applications.
Cognitive load is another negative side effect that occurs when utilizing the RDW technique. Our working memory draws upon finite cognitive resources, as well as verbal and spatial resources. Therefore, studies such as [13,14] have analyzed the assembly workspaces in industrial environments to improve the ergonomics and optimize the processes to reduce the cognitive load. A previous study assessed several types of semi-natural locomotion interfaces in VR [2]. The findings showed that the demands on the spatial working memory increased when there were fewer natural locomotion user interfaces. Another study [15] investigated the effect of the imperceptible continuous reorientation approach on cognitive load and on curvature gains, utilizing a dual-tasking method to evaluate the mutual impact between a locomotion task utilizing the RDW technique and a simultaneous task that draws upon spatial or verbal cognitive resources. The findings showed that spatial and verbal working memory was significantly affected by the radius of the circular path on which the participants had been redirected using curvature gains.
Another research avenue for the RDW technique is using discrete redirections during temporal events such as eye blinks and saccades, with previous studies [16,17,18] having introduced rotations and curvature gains during saccades and eyeblinks. These approaches depend on visual suppression taking place during blinks and saccades [19,20,21,22,23] to ensure that the gain values that were applied are greater than the estimated perceptual thresholds are [10]. Furthermore, a study [24] investigated the relationship between the perception thresholds for discrete repositioning during eyeblinks and the participants’ walking speeds. The finding showed a proportional relationship between the walking speed and the perception thresholds for forward and backward repositioning during blinks.
Recently, progress regarding the generalization of the RDW techniques has been reported. For instance, the authors of [25] proposed a general reactive RDW controller that considers the obstacles in the physical space. The proposed RDW controller determines the ideal location in the physical world and redirects the user toward that position to avoid obstacles using artificial potential functions. Another RDW controller has been proposed in a recent study [26] with a method that was based on reinforcement learning (RL), in which a deep neural network was trained to prescribe the translation, rotation, and curvature gains directly in relation to the user’s position and orientation in the VE. The authors of the study compared the performance of the proposed algorithm with that of a steer-to-center (S2C) RDW controller [27]. The results showed that the proposed RDW using RL outperformed the S2C RDW controller.

2. Hypothesis Formulation

Based on the reviewed literature, it is clear that no single solution can solve all of the issues of the RDW techniques, such as participant collision with the boundaries of the physical tracked space, the spatial requirements of the RDW, and supporting free exploration in the IVE. For instance, predictive redirected controllers can be adopted if the user’s future trajectory in the IVE is known which helps to plan the user’s future path in the physical environment by calculating the values of the necessary gain to keep the user within the tracked physical space [28]. However, predicting the users’ future paths in an IVE where free exploration is intended is not feasible because it is difficult to predict the user’s walking behavior. In contrast, reactive RDW algorithms are more generalized in an IVE, and they support unconstrained walking. However, reducing the spatial requirements to support unconstrained walking in the VE is constrained by the users’ perception thresholds for spatial manipulation gains [10], the size and the shape of the available physical space [29], and the complexity of the environment [30].
A hypothesis has been synthesized that by adopting the composite spatial manipulation framework, it improves the redirection performance of RDW controllers within a confined physical space while supporting unconstrained walking in the IVE. In this chapter, a composite RDW controller was implemented. The proposed RDW controller utilizes two different steering algorithms at the same time. The first is a continuous spatial manipulation approach, whereas the second utilizes a discrete spatial manipulation approach during eyeblinks. Eyeblinks offer a good opportunity to introduce discrete spatial manipulation to the user’s virtual perspective in the VE due to the visual input suppression that occurs during eyeblinks [20,21]. Since a continuous steering framework utilizes different perceptual processes when it is compared to discrete steering during the eyeblinks approach, combining both of the approaches to work simultaneously could enhance the overall redirection performance and reduce the spatial requirements. Additionally, an overt reorientation algorithm (reset algorithm) is still required if the controller fails to redirect the user from the boundaries of the available physical tracked space.
A simulation was run to verify the feasibility of utilizing the proposed framework in the RDW technique using OpenRDW [31], an open-source library and the benchmark for developing and evaluating various methods for redirected walking techniques. Finally, a user study was conducted to validate the performance of the proposed approach and evaluate its impact on the users’ performance.

3. The Utilized Method

The proposed composite redirected walking controller combines two different subtle spatial manipulation approaches. The first approach is a continuous spatial manipulation framework, which is used for classical RDW controllers, such as S2C [32], APF [25], and RDW using RL [26]. The second approach is a discrete subtle spatial manipulation framework, such as the repositioning and reorientation that are carried out during the occurrence of eyeblinks. In this study, three different composite RDW controllers were implemented. Each composite controller employed one of the following continuous spatial manipulation frameworks—S2C, APF, or RDW using RL. Simultaneously, the composite controller used a discrete spatial manipulation framework to inject discrete translation and rotation gains during the occurrence of eyeblinks.

3.1. Calculation of the Spatial Manipulation Gains

A previous study [24] estimated the perception threshold for discrete translation. Therefore, in this study, the discrete translation gain was calculated with respect to the participant’s walking speed using Equation (1), which is shown below. Equation (1) is a result of fitting the dataset that was collected during a previous experiment to estimate the perception thresholds for discrete repositioning during eyeblinks. Refer to [24] for more information about estimating the perception thresholds for discrete repositioning during eyeblinks.
T g _ d i s c r e t e = 0.9674 × w a l k i n g   s p e e d 0.1675
T g _ d i s c r e t e represents the discrete translation gain with a proportional relationship to the users’ walking speed during the occurrences of eyeblinks. It should be noted that the estimated threshold values in the previous study [24] were considered to be conservative values because during the evaluation experiment, the participant’s main task was to detect the repositioning after the occurrence of an eyeblink. In practical situations, the participant might have a primary objective (such as a search-and-retrieve task) in the scene, and so the navigation task is usually secondary.
Furthermore, two constraints on introducing the translation gain T g _ d i s c r e t e to the user’s virtual preceptive in VEs have been implemented. This reduces the possibility of the participant noticing the applied translation gain because they depend on depth cues, such as motion parallax. These constraints are the participant’s walking speed S w , which should be greater than 0.25 m/s, and the pitch and yaw angles between the direction of the translation vector and the user’s gaze direction θ h e a d i n g g a s e (this variable has a paired value for the horizontal and vertical components), as shown in Figure 1. The angles’ values were chosen based on a prior pilot study in which the experiments were conducted with several values ranging from | 10 ° | to | 60 ° | degrees. The chosen thresholds were angles ≤ | 40 ° | . It should be pointed out that the second constraint reduces the effective blink count, which reduces the chance of introducing discrete translation gains, and with a slight angle value, the chance of injecting translation gains is further reduced. Consequently, this decreases the performance of the proposed approach. A value such as | 40 ° | is considered as a moderate value with which enough effective blinks can occur and a discrete translation can be applied to obtain a decent performance using the proposed approach.

3.2. Discrete Rotation Gain

The perception threshold for discrete rotation was estimated in a previous study [18] in which it was reported that the participants did not recognize the discrete rotations during eyeblinks with a magnitude of 9.1°. Therefore, we adopted the estimated value from the mentioned study, such that the discrete rotation gain that was inserted during eyeblinks was R g _ d i s c r e t e = ±9.1°. The sign represents the direction of the rotation (positive for a clockwise direction and negative for a counterclockwise direction).
Moreover, the direction of discrete rotations was determined based on the user’s position in the physical space. In the cases where the distances from both of the sides (the right side R and the left side L) of the player to the boundaries of the physical space have been calculated, that is, if the distance L is less than the distance R is, then the discrete rotation direction will be counterclockwise, whereas if the distance R is less than the distance L is, then the discrete direction of rotation will be clockwise. Figure 2 illustrates how the discrete rotation was selected and applied to the user’s virtual preceptive in the VE.

3.3. Translation and Rotation Gains for Continuous (Classical) RDW Controllers

Regarding the continuous spatial manipulation framework that was used for the composite controller, state-of-the-art controllers, including redirected walking using reinforcement learning (RDW by RL) [26] and the artificial potential function (APF) [25], were adopted because both of them have performed well in the empty VE, the VE with obstacles, and the VE with multiple users [33]. The maximum translation gain was 1.26 m [10], whereas the curvature gain was 7.5 m [34]. Furthermore, the overt reset algorithm “2:1 turn” was utilized. The reset algorithm was triggered when the user reached the boundary of the physical space. An overt instruction then guided the user to return to the center of the physical space by performing an in-place rotation, with a 180° rotation in the physical space becoming a 360° rotation in the VE. It is worth mentioning that the composite RDW controller is classified as a reactive controller. It calculates the optimal redirection gains based on the data that are available in the current frame only and does not utilize any information from the previous frame/frames.

3.4. Eyeblink Simulation

In order to simulate the eyeblinks during the experiment, an actual dataset [35] of non-frontal video recordings of the left eye, which were monitored inside a VR headset, was utilized. This dataset was collected during a previous study to detect the eyeblinks and classify the eye states (open or closed) inside the HMDs. The software was implemented to play the video dataset during the experiment and detect the eyeblinks in the video stream, as shown in Figure 3. For detailed information about the software, please refer to [36].

3.5. Evaluating the Performance of the RDW Controller

In order to measure the performance of the RDW controllers, the following quantitative parameters were utilized. These are commonly used in the RDW technique in the literature.
  • The average count of resets during the trials—this parameter represents how many times the reset event has been triggered due to the user colliding with the boundary of the tracked physical space; a lower value indicates a better redirection performance;
  • The average walked distance between resets—a higher value indicates better a performance;
  • The average elapsed time between resets—a higher value indicates a better redirection performance;
  • The average sum of the virtual walked distance in the IVE;
  • The total virtual walked distance in the IVE and the total physical walked distance in the physical tracked space. The virtual walked distance should be greater than the physical distance is, and there being a large difference between both of the values indicates better a redirection performance.

4. Experimental Design

During the study, two simulation experiments were conducted. The first experiment was intended to investigate the feasibility of the proposed approach (the composite RDW controller) and test which classical RDW controller performed better when they were combined with a discrete RDW controller regardless of the user’s walking behavior. In the second experiment, the best-performing composite RDW controller in the first experiment was utilized for further investigations. During the second experiment, the performance of the proposed composite controller was evaluated, and the user’s walking behavior was considered. In real life, most of the time, walking from point A to point B to achieve a specific objective is a secondary task. Therefore, a primary objective was assigned for the user. This was accomplished by involving them in a search-and-retrieve task for a specific period to mimic a practical scenario, wherein, walking in the environment was a secondary task. Furthermore, the impact of utilizing the proposed approach on the participants’ performance in the IVE was evaluated.

4.1. Experiment No. 1: Investigating the Feasibility of the Proposed Model

In this experiment, three composite controllers were implemented, with each of them utilizing a different classical RDW controller that employed a continuous spatial manipulation framework, including S2C [32], APF [25], and the RDW system using the RL approach [26]. The experiment comprised two sessions, during which the baseline data samples were collected, with only the classical RDW controllers being utilized to redirect the user in the IVE. In the second session, the data concerning the performance of the proposed composite RDW controller were collected.
During the first session, an agent simulated the user in the implemented scene, which was controlled using a keyboard to move around in the VE. The agent was represented in the VE by a humanoid avatar with a capsule collider with a radius of 0.5 m. If the agent collided with the boundaries of the physical space, a reset procedure would be triggered. After the walked path had been completed, the performance metrics were calculated. In total, 90 trials were performed to collect the baseline samples, i.e., 30 for each controller.
The composite spatial manipulation framework was evaluated in the second session with the same procedure as the first session. Three different composite controllers were implemented. The first one was the RDW system using APF for the continuous controller, the second one was the RDW system using RL, and the third one was the S2C RDW continuous controller. In total, 90 trials (30 for each controller) were performed during the second session, utilizing the same user trajectory as the first experiment did. Figure 4 summarizes the experiments that were conducted in this stage of the study.

4.1.1. Assumptions and Limitations

During the simulated experiment, some assumptions were made regarding the user’s walking behavior and the area of the simulated physical space that was available for the agent, which are listed below.
  • The simulated physical space that was available for the agent during the simulation was a convex shape of 100 square meters (10 × 10 m);
  • The agent’s walking speed was 1 m/s, and their angular velocity was 90°/s;
  • No obstacles were present in the physical space, and only a single user was present in the physical space;
  • The virtual environment could be infinite because the controller should be designed to work in any VE.

4.1.2. Performance Evaluation and the Utilized Virtual Environment

In general, the performance of the RDW controllers depends on several factors. One is the size and shape of the available physical space [29]. In the case of utilizing the proposed composite spatial manipulation framework for the RDW system, the frequency of eyeblink occurrences also affects the controller performance because an increase in this parameter means that there will be more opportunities to apply discrete redirections.
The complexity of the virtual environment also affects the controller performance; for instance, each walked path has its own specific characteristics. A straight walked path that is 100 m long can generate different performance metrics if it is compared to a zigzagging one of the same length. Therefore, a zigzagging path could generate fewer reset events and a higher mean walking distance value between the resets. Consequently, a specific walking path passing through different topologies in the VE (80 × 80 m) was created. The same path was utilized in the experiment in which the control samples were collected and the proposed composite controllers were assessed. The aim of using a single walking trajectory was to reduce the number of independent variables that could affect the performance of the evaluated RDW controller, such as the participant’s walking behavior, in order to avoid errors that could cause misleading data to be collected. For instance, if the user intentionally walked in circles, they would reduce the reset count and increase the walked distance between the resets, which would not reflect realistic walking behavior. Hence, a single path was chosen that could challenge the proposed approach and compare its performance with the performance of other state-of-the-art approaches that used the same path. Figure 5 shows a top-down view of the virtual environment that was used in the simulation experiment.

4.1.3. Apparatus Utilized in the Simulation

During the experiment, we utilized a Windows PC with a core i7-10750H 8th Gen, 16 GB Ram, 512 SSD, 2 Graphic cards from NVIDIA GTX 980Ti, and the Windows 10 operating system. The test scene was implemented with the Unity game engine, version 2019.4.8f1, and the OpenRDW open-source library was used to evaluate the proposed model. Furthermore, the eyeblink detection software that had been implemented in an earlier study [36] was utilized to introduce simulated eyeblinks. The software detected eyeblinks from a previously recorded video file depicting a participant’s left eye inside a VR headset.

4.1.4. Experiment No. 1—Results and Discussion

During the first session of the experiment, the state-of-the-art continuous RDW controllers (the APF system and the RDW system using RL) and the classical S2C system were evaluated. As mentioned above, 90 trials were conducted (30 trials for each controller) to collect the control samples, and the measured performance of these samples was considered as a baseline. During the second session of the experiment, 90 trials in total were conducted to evaluate the performance of three different composite RDW controllers. Each one of these composite controllers utilized a different continuous RDW approach, namely, S2C, APF, and RL. Then, the measured performance of the three composite RDW controllers was compared against the baseline. Specifically, a two-factor ANOVA was performed on the collected performance metrics regarding the average count of the reset events, the average virtual walked distance between the resets, and the elapsed time between the resets.

The Counts of Resets during the Trials

For the continuous RDW controllers, the average counts of reset events for the S2C, APF, and RL controllers were 28.93, 26.53, and 22.87, respectively, whereas for the composite RDW controllers, these were 22.93, 19.80, and 18.73, respectively. Figure 6 illustrates the results of the two-factor ANOVA for the counts of the reset events during the trials and their estimated marginal means.
Table 1 shows the results of the two-factor ANOVA for the counts of the resets during the trials. For the samples of the continuous framework, the F value (92.53) was much greater than the F critical value (3.95) was, with a p-value of 4.3 × 10⁻¹⁵, which is ˂0.001. On the other hand, for the columns (the algorithms that were utilized in RDW controllers, S2C, APF, and RL), the F value (25.49) was greater than the F critical value (3.11) was, with a p-value that was equal to 2.2 × 10⁻⁹, which is ˂0.001. There being fewer reset counts indicates a better performance. Figure 6b shows the marginal means of the counts of reset events, which showed no interaction between the variables. Fewer calls for reset events indicates a better redirection performance. The analysis revealed a significant improvement in the performance of the RDW controllers that utilized the composite framework when they were compared to those that employed the continuous one.

The Average Time Elapsed between Resets

The average time that elapsed between the resets was another performance metric which was evaluated via a two-factor ANOVA. The analysis showed an increase in the average time that elapsed between the resets for the composite framework controllers when they were compared to the continuous ones. For the continuous RDW controllers (S2C, APF, and RL), the average time that elapsed between the resets was 11.83, 13.18, and 11.97 s, respectively, whereas for the composite framework controllers (S2C, APF, and RL), the average time in seconds between the resets was 14.94, 17.71, and 15.41, respectively. Figure 7a shows the results of the two-factor ANOVA on this performance matric, and Figure 7b shows the estimated marginal means of the time elapsed between the resets for the proposed approach and the state-of-the-art methods.
Table 2 shows the results of the two-factor ANOVA analysis. For the samples (controller frameworks), the F value (42.24) was much greater than the F critical value (3.95) was, with a p-value of 5.45 × 10⁻⁹, which is ˂0.001, whereas for the columns (the algorithms that were utilized in RDW controllers, S2C, APF, and RL), the F value (5.08) was slightly greater than the F critical value (3.11) was, with a p-value equal to 0.008. The analysis indicated a significant improvement in the performance of the composite RDW controllers when they were compared to the continuous ones, with there being more elapsed time between the resets resulting from a better redirection performance.

The Average Virtual Distance Walked between Resets

The average virtual distance that was walked between the resets during the trials was another performance parameter which was evaluated using a two-factor ANOVA. The analysis showed an increase in the average virtual distance that was walked between the resets when utilizing the composite controllers when they were compared to the continuous ones. Specifically, for the continuous controllers (S2C, APF, and RL), the average walking distances were 11.19, 12.08, and 14.62 m, respectively, whereas for the composite controllers (S2C, APF, and RL), these were 16.91, 18.98, and 19.68 m, respectively. Figure 8a shows the results of the ANOVA that was conducted to evaluate the average virtual distance that was walked between the resets.
Figure 8 shows the results of two-factor ANOVA regarding the average virtual distance that was walked. For the samples (controller frameworks), the F value (108.43) was much greater than the F critical value (3.95) was, with a p-value of 9 × 10⁻¹⁷, which is <0.001, whereas for the columns (the algorithms utilized in RDW controllers S2C, APF, and RL), the F value (9.98) was less significant than the F critical value (3.105) was, with a p-value equal to 0.0001. Furthermore, Figure 8b shows that there was no interaction between the parameters. Table 3 summarizes the result of the ANOVA of the average virtual distance that was walked between the resets.
The evaluation results show that there were increased virtual distances between the reset events when the composite RDW controllers were utilized. The ANOVA indicates a significant improvement in the controllers that employed the composite framework compared to those that utilized the continuous one.

4.1.5. Discussion of the Findings of Experiment No. 1

Table 4 shows the performance metrics that were obtained during the trials and the evaluated score values for each controller, showing the average values of the evaluated performance metrics and the corresponding p-values for the RDW controllers that utilized the composite and the continuous frameworks.
A two-way ANOVA revealed statistically significant improvements in the redirection performance of the RDW controllers that utilized the composite framework when they were compared to those that utilized the continuous one. Hence, the simulation experiment demonstrated the feasibility of utilizing the proposed approach for redirecting the user in the IVE more effectively than when the user was using the continuous RDW controllers. Furthermore, the results showed that the composite RDW controller adopting the APF method performed better than the other composite controllers, which utilized S2C and RL, did. However, as mentioned before, the evaluation did not consider the users’ walking behavior.

4.2. Experiment No. 2: Evaluating the Performance of the Proposed Approach While Considering the Users’ Walking Behavior

The first simulation experiment results showed that the composite RDW controller using the APF method outperformed other composite RDW controllers; hence, this was adopted for the second experiment. This experiment was aimed at evaluating the redirection performance of the proposed approach while considering the users’ walking behavior and investigating the impact of using this approach on the spatial requirements and the users’ performance.
During this experiment, a participant using a keyboard controlled an agent representing a user in an IVE. The virtual environment that was used during the experiment was a warehouse with an area of 4800 m2 (40 m × 120 m). The warehouse was populated with shelves, equipment, and warehouse machinery. The participant had to perform a search task to find cubes that had been scattered around the area within a specific time frame (10 min). These needed to be collected and dropped in a specific drop zone (represented by a large carton box) in the VE. In order to simulate eyeblinks, the same procedure in the first experiment was utilized. Figure 9 shows the IVE that was utilized in this experiment, for which two sessions were conducted. In the first, 31 trials were carried out for the collection of the baseline samples, with only the classical RDW using the APF controller being utilized. In the second session, 31 trials were conducted to evaluate the redirection performance of the proposed composite RDW controller. Figure 10 shows a screenshot that was obtained while conducting the simulation experiment.

4.2.1. Assumptions and Limitations

The following assumptions and limitations regarding the simulated tracked physical space that was available for the user in the utilized IVE were made during this simulated experiment:
  • The simulated physical space that was available for the agent was 6 × 6 m;
  • The agent’s walking speed was 1 m/s, and their angular velocity was 90°/s;
  • The agent’s gaze direction was the same as the heading direction was;
  • No obstacles were present in the physical space, and only a single user was present in the physical space;
  • The virtual environment could be infinite because the controller should be designed to work in any type of VE.

4.2.2. Apparatus Utilized in the Simulation

Regarding the apparatus that was used in this experiment, we used a Windows PC with core i7-10750H 8th Gen, 16 GB Ram, 512 SSD, 2 Graphic cards from NVIDIA GTX 980Ti, and the Windows 10 operating system. The level design of the virtual scene in the VE was implemented with the unity3D game engine, version 2019.4.8f1. Additionally, the OpenRDW open-source library was used to evaluate the proposed model. Moreover, eyeblink detection software that had been implemented in an early study [36] was utilized to detect the eyeblinks based on a previously recorded video file depicting a participant’s left eye inside a VR headset.

4.2.3. Experiment No. 2—Results and Discussion

After finishing both sessions, 62 samples in total were collected. Thirty-one samples were collected as a baseline during the first session, and thirty-one of them were collected for evaluating the proposed model. A t-test for a dependent sample analysis was conducted to evaluate the collected data, with α = 0.05. Additionally, the average value of the simulated blink counts that were obtained during the entire experiment’s duration (10 min) was 119.2, SD = 27.4, whereas the average value of the effective blink counts with the application of the discrete translation and rotation gains was 75.8, with SD = 20.67. Based on these data samples, the following performance parameters were evaluated.

The Average Reset Counts

This parameter represented the number of times the reset event was triggered.
The null hypothesis stated that there was no difference between the group that utilized the continuous controller when they were compared to the group that used the composite controller with respect to the dependent variable “participant performance score”.
The alternative hypothesis stated that there was a difference between the group that utilized the continuous controller and the group that used the composite controller with respect to the dependent variable “participant performance score”.
The descriptive statistics show that when the continuous RDW controller was utilized, the reset count was higher (M = 73.06, SD = 5.68) than in the case where the composite RDW one was used (M = 67.39, SD = 6.94), as shown in Table 5.
A t-test for dependent samples showed that this difference was statistically significant; t(30) = 4.2, p < 0.001, 95% confidence interval (2.92, 8.44), resulting in a p-value that is below the significance level of 0.05. The t-test result was therefore significant for the present data, and the null hypothesis was rejected. Figure 11 shows the average reset counts for both of the controllers.

The Average Virtual Distance That was Walked between Resets

The null hypothesis stated that there was no difference in the average virtual distance that was walked between the reset events between the cases in which the continuous RDWC and the composite RDWC were utilized.
The alternative hypothesis stated that there was a difference in the average virtual distance that was walked between the reset events for the cases in which the continuous RDWC and the composite RDWC were utilized.
The descriptive statistics show that the average value of the virtual walked distance between the resets had a lower value (M = 7.14, SD = 0.64) when the continuous RDW controller was used compared to the case in which the composite RDWC was utilized (M = 10.16, SD = 1.22), as shown in Table 6.
A t-test for the dependent samples showed that this difference was statistically significant; t(30) = −12.96, p = < 0.001, 95% confidence interval (−3.5, −2.54), resulting in a p-value that is below the specified significance level of 0.05. The t-test result was therefore significant for the present data, and the null hypothesis was rejected. Figure 12 shows the average values of the virtual distance that was walked between the resets for both of the controllers.

The Average Time That Elapsed between Resets

The null hypothesis stated that there was no difference in the average value of the time that elapsed between the reset events between the cases in which the continuous RDWC and the composite RDWC was utilized.
The alternative hypothesis stated that there was a difference in the average value of the time that elapsed between the reset events for the cases in which the continuous RDWC and the composite RDWC were utilized.
The descriptive statistics showed that the case in which the continuous RDWC was used had a lower elapsed time (M = 8.44, SD = 0.67) than when the composite RDWC was utilized (M = 9.03, SD = 0.9), as shown in Table 7.
A t-test for the dependent samples showed that this difference was not statistically significant; t(30) = −3.65, p-value = 0.001, 95% confidence interval (−0.92, −0.26), resulting in a p-value that is above the specified significance level of 0.05. The t-test result was significant for the present data, and the null hypothesis was rejected. Figure 13 shows the average time that elapsed between the resets for both of the controllers.

The Average Sum of the Virtual Distance That Was Walked in the IVE

This parameter described the average value of the sum of the virtual distance that was walked in the IVE across all of the trials.
The null hypothesis stated that there was no difference in the mean value of the sum of the virtual walked distance in the IVE between the cases in which the continuous RDWC and composite RDWC were utilized.
The alternative hypothesis stated that there was a difference in the mean value of the sum of the virtual walked distance in the IVE between the cases in which the continuous RDWC and composite RDWC were utilized.
The descriptive statistics showed that in the cases in which the continuous RDWC was utilized, the average sum of the virtual distance that was walked in the IVE was lower (M = 527.29, SD = 46.14) when it was compared to the cases in which the composite RDWC was used (M = 691.02, SD = 80.91), as shown in Table 8.
A t-test for dependent samples showed that this difference was statistically significant; t(30) = −9.18, p-value < 0.001, 95% confidence interval (−200.15, −127.3). This resulted in a p-value that is below the specified significance level of 0.05. The t-test result was therefore significant for the present data, and the null hypothesis was rejected. Figure 14 shows a visualization of this parameter for the RDW controllers.

The Average User Performance

As mentioned before, the participants were involved in search-and-retrieve tasks during the experiment. This parameter described the average score that was achieved by the participants across the trials. Each time the participant collected and delivered a cube to the drop zone, they scored one point.
The null hypothesis stated that there was no difference in the mean value of the score between the cases in which the continuous RDWC was utilized and those in which the composite RDWC was used.
The alternative hypothesis stated that there was a difference in the mean value of the score between the cases in which the continuous RDWC was utilized and those in which the composite RDWC was used.
The descriptive statistics showed that in the cases in which the continuous RDWC was utilized, the mean of the score had a lower value (M = 16.26, SD = 1.77) when it was compared to those in which the composite RDWC was used (M = 19.97, SD = 2.71), as shown in Table 9.
A t-test for dependent samples showed that this difference was statistically significant; t(30) = −6.51, p-value < 0.001, 95% confidence interval (−4.87, −2.55). This resulted in a p-value that is below the specified significance level of 0.05. The t-test result was therefore significant for the present data, and the null hypothesis was rejected. Figure 15 shows the measured performance scores for both of the approaches.

The Average Value of the Ratio of the Virtual Distance That Was Walked in the IVE to That of the Physical Distance That Was Walked in the Tracked Space

This parameter showed how much of a gain in the virtual distance that was walked was achieved when the user was using a specific RDW controller. The being a higher value indicates a better redirection performance.
The null hypothesis stated that there was no difference in the mean value for this parameter between the cases in which the continuous RDWC was utilized and those in which the composite RDWC was used.
The alternative hypothesis stated that there was a difference in the mean value for this parameter between the cases in which the continuous RDWC was utilized and those in which the composite RDWC was used.
The descriptive statistics showed that, in the cases in which the continuous RDWC was utilized, the mean of the ratio had a lower value (M = 1.35, SD = 0.01) when it was compared to when the composite RDWC was used (M = 1.5, SD = 0.04), as shown in Table 10.
A t-test for the dependent samples showed that this difference was statistically significant; t(30) = −22.8, p-value = < 0.001, 95% confidence interval (−0.16, −0.13). This resulted in a p-value of <0.001, which was below the specified significance level of 0.05. The t-test result was therefore significant for the present data, and the null hypothesis was rejected. Figure 16 shows the evaluated ratio.

4.2.4. Discussion

In general, the findings of this experiment indicated a statistically significant improvement in the redirection performance in the cases in which the composite RDW controller was utilized compared to those in which the classical RDW one was in use. The results showed that the user performance in the IVE improved when the proposed approach was utilized, thereby allowing users to achieve higher scores in the search-and-retrieve task than those which were obtained using the classic RDW controllers. Moreover, the average time elapsed between the resets was slightly higher when the user was using the composite controller; consequently, the user walked a longer distance between the resets.
Moreover, the ratio of the average sum of the virtual distance that was walked in the IVE to that of the physical distance that was walked in the real space had a higher value when the composite RDWC was utilized compared to the classic RDWC, which indicates a better gain in terms of the virtual distance that was walked compared to the distance that was walked in the given physical space. Table 11 summarizes the performance parameters that were evaluated for the classic and composite RDW controllers.

4.3. Experiment Design (User Study)

Based on the findings of the simulation experiments, a user experiment was conducted to validate the proposed approach and verify the findings of the simulation studies. During the user experiment, the performance of the proposed composite RDW controller and its impact on the users’ performance was evaluated. The performance evaluation was undertaken by collecting telemetry data about the participant’s walking behavior, including walking speed, eyeblink occurrences, gaze direction, virtual and real walked distances, timestamps, injected translation and rotation gain values, as well as the scores that were obtained for the task that was performed during the trial. The collected performance parameters were evaluated using t-testing for a dependent sample analysis.
Two constraints were implemented to control the insertion of the discrete translation and rotation gains into the participant’s virtual perspective in the IVE; the first one was that the participant’s walking speed S_w had to be greater than 0.25 m/s. The second constraint was based on θ_(heading-gase), the angle between the direction of the translation vector and the user’s gaze direction, as explained above in Section 3.1 and as shown in Figure 1.

4.3.1. The Virtual and Physical Environment

The virtual environment that was used during this experiment was a warehouse. It was the same virtual environment to that which was utilized in the second simulation experiment (Section 4.2), as shown previously in Figure 9. The area of the virtual environment was 4800 m2 (40 m × 120 m), whereas the physical area that was available for the participants was a calibrated tracked space of 6 × 6 m in size, as shown in Figure 17.

4.3.2. Apparatuses

In order to conduct the user study, the following equipment was utilized: a gaming notebook from ASUS TUF F15 with core i7-11800H 10th Gen, 16 GB Ram, 512 SSD, GPU from NVIDIA RTX3060, and the Windows 10 operating system. The test scene was implemented with the Unity game engine, version 2019.4.8f1, and the HTC Vive Pro Eye was utilized for the VR headset. This VR headset is already equipped with an eye-tracking capability. The notebook was mounted inside a backpack to provide the participant with a tether-free VR experience. Figure 18 shows a list of the apparatuses that were utilized in the experiment.
Providing the participants with a tether-free VR experience has several advantages, such as improving the users’ presence (the feeling of being in the VE), eliminating the issue of cable tangling, and eliminating the clues that the participant can gain from the position of the HMD cable. However, there are also disadvantages, such as the heavy weight of the equipment which the participant must carry.
Figure 19 shows the utilized setup, which provided the participant with a tether-free VR experience. As shown in the figure, the notebook was mounted onto a custom-made rack and inserted into the backpack. The participant wore this backpack during the experiment. The notebook was equipped with two onboard graphic cards; the first was an Intel graphics card, which was active when the notebook was running on a battery. The second one was a dedicated graphics card from NVIDIA RTX3060. However, the NVIDIA graphic card worked only if the notebook was plugged into the power adapter to preserve the battery life because it consumed much more energy. Hence, two external batteries were mounted on the rack to provide the notebook with 20 V and 200 watts (enough for one hour) to run the dedicated graphics card (the RTX3060).
Additionally, an external duct fan was mounted on a rack to circulate the air inside the backpack to prevent the notebook from overheating. Furthermore, a power bank with a capacity of 20,000 mA provided the necessary power to run the VR headset and the duct fan. After mounting the notebook inside the backpack, it was difficult to control and manage the application on the notebook. Therefore, the notebook was connected to an external monitor via a Microsoft wireless display adaptor and a wireless mouse and keyboard. This setup allowed for the interaction with the notebook to occur while it was inside the backpack.

4.3.3. Experimental Procedure

When the participants arrived, they were given a brief description of the experiment, and the laboratory instructor explained the course of the study. All of the participants were informed about the negative side effects (such as simulator sickness) that could occur during or after performing the required tasks. The participants were informed to quit the experiment at any point and extend the break time if they wished. Moreover, the participants gave their consent verbally to participate in the experiment. Then, they had to fill out a simulator sickness questionnaire (SSQ) before starting the experiment. The answers were evaluated to check to what extent the participant had been exposed to simulator sickness. This step was essential to ensure the validity of the participant’s replays.
During the experiment, the participants took part in search-and-retrieve tasks within a specific time frame. Cubes were spawned in different locations in the IVE, and the participant’s objectives were to locate these cubes, pick them up, and collect them at a specified location. Each participant performed two trials, with each of them taking approximately 10 min to complete, with a 15-min break between them. In the first session of the experiment, a baseline dataset was collected in which only a classic RDW controller was utilized. In the second session, the actual dataset, which was obtained utilizing the composite RDW controller, was collected. After finishing both of the sessions, the participants were required to fill in the SSQ again. Next, a debriefing session with each of the participants was conducted by the instructor. Figure 20 illustrates the experimental procedure.

4.3.4. Population

For this experiment, 34 participants were recruited. However, three data samples were eliminated because they were corrupted, and so the results for 10 females and 21 males were available for analysis. The average population age was 29.42, with the SD = 1.87 and the ages ranging from 22 to 42 years old. None of the participants had any ocular diseases, and they did not wear glasses. Most of the participants were students at the University of Kassel. They had either had no previous experience with VR or had tried it once before. However, they were familiar with 3D gaming.

4.3.5. Experimental Results

The performance parameters that were collected for the proposed RDW controller were analyzed using a t-test for dependent samples. There was a 95% confidence interval, and the level of significance was 0.05. The following performance parameters were evaluated. The average walking speed during the trials was 0.93 m/s, with SD = 0.11. The average number of eyeblink occurrences during the trials was 155.13 per trial, with SD = 19.74, whereas the average number of effective eyeblinks was 111.86, with SD = 23.31. The average discrete translation gain that was inserted was 0.87 m, with SD = 0.1, and the average SSQ score that was obtained after the experiments was 10.7, with SD = 4.96.

Participant Performance

The null hypothesis stated that there was no difference between the groups that utilized the continuous and the composite RDW controllers with respect to the users’ performance (dependent variable).
The alternative hypothesis stated that there was a difference between the groups that utilized the continuous and the composite RDW controllers with respect to the users’ performance (dependent variable).
The results of the descriptive statistics showed that the user group in which the continuous RDW controller was utilized exhibited lower performance scores (M = 11.12, SD = 1.69) than those of the group using the composite RDW controller (M = 14.59, SD = 1.77), as shown in Table 12.
A two-tailed t-test for dependent samples showed that the difference between the continuous RDW and composite RDW groups with respect to the dependent variable performance score was statistically significant; t(30) = −5.62, p ≤ 0.001, 95% confidence interval (−4.7, −2.13), and thus, the null hypothesis was rejected. Figure 21 shows the average scores of the participants’ performance for both of the groups.

The Average Reset Count during the Trials

The null hypothesis stated that there was no difference between the average value of the reset count (dependent variable) between the groups that utilized the continuous and composite RDW controllers.
The alternative hypothesis stated that there was a difference between the average value of the reset count (dependent variable) for the groups that utilized the continuous and composite RDW controllers.
The descriptive statistics showed that the user group in which the continuous RDW controller was utilized had a higher reset count (M = 60.82, SD = 6.74) than the group that used the composite RDW controller (M = 51.94, SD = 7.95), as shown in Table 13.
A two-tailed t-test for dependent samples showed that the difference between the continuous RDW and composite RDW controller groups, in regard to the average reset count, was statistically significant; t(30) = 5.8, p ≤ 0.001, 95% confidence interval (5.64, 12.13), and thus, the null hypothesis was rejected. Figure 22 shows the average number of reset counts that were measured during the trials for both groups.

The Average Time That Elapsed between Resets

The null hypothesis stated that there was no difference between the average time that elapsed between the resets (dependent variable) between the groups that utilized the continuous and composite RDW controllers.
The alternative hypothesis stated that there was a difference between the average time that elapsed between the resets (dependent variable) for the groups that utilized the continuous and composite RDW controllers.
The results of the descriptive statistics showed that the group that utilized the continuous RDW controller had a lower value for the average time that elapsed between the resets (M = 10.96, SD = 1.31) than that of the group using the composite RDW controller (M = 11.52, SD = 1.6), as shown in Table 14.
A two-tailed t-test for dependent samples showed that the difference between the continuous RDW and composite RDW controllers with respect to the average time that elapsed between the resets was significant; t(30) = −1.9, p-value = 0.076, 95% confidence interval (−1.18, 0.07), and thus, the null hypothesis was rejected. Figure 23 shows the average time that elapsed between the resets during the trials for both of the groups.

The Average Virtual Distance That Was Walked between Resets

The null hypothesis stated that there was no difference between the average values of the virtual distance that was walked between the resets (dependent variable) for the groups that utilized the continuous and the composite RDW controllers.
The alternative hypothesis stated that there was a difference between the average values of the virtual distance that was walked between the resets (dependent variable) for the groups that utilized the continuous and the composite RDW controllers.
The results of the descriptive statistics showed that the group that utilized the continuous RDW controller exhibited a lower value for the average virtual distance that was walked between the resets (M = 7.57, SD = 1.11) than that of the group using the composite RDW controller (M = 9.54, SD = 1.16), as shown in Table 15.
A two-tailed t-test for dependent samples showed that the difference between the continuous RDW and composite RDW controller groups with respect to the average virtual distance that was walked between the resets is significant; t(30) = −5.56, p ≤ 0.001, 95% confidence interval (−2.72, −1.21), and therefore, the null hypothesis was rejected. Figure 24 shows the average virtual distance that was walked between the resets.

The Average Sum of the Real Distance That Was Walked during the Trials

The null hypothesis stated that there was no difference between the groups that utilized the continuous RDW and composite RDW controllers with respect to the dependent variable “the average sum of real distance traveled”.
The alternative hypothesis stated that there was a difference between the groups that utilized the continuous RDW and composite RDW controllers with respect to the dependent variable “the average sum of real distance traveled”.
The results of the descriptive statistics showed that the group that utilized the continuous RDW controller exhibited a lower value for the average sum of the actual distance that was traveled (M = 411.87, SD = 32.48) than that of the group using the composite RDW controller (M = 523.96, SD = 79.3), as shown in Table 16.
A two-tailed t-test for dependent samples showed that the difference between the continuous RDW and composite RDW controller groups with respect to the average sum of real distance that was traveled was statistically significant; t(30) = −6.1, p ≤ 0.001, 95% confidence interval (−151.07, −73.11), and thus, the null hypothesis was rejected. Figure 25 shows the average sums of the real distance that was walked during the trials.

The Average Sum of the Virtual Distance That Was Walked in the IVE

The null hypothesis stated that there was no difference between the groups that utilized the continuous RDW and composite RDW controllers with respect to the dependent variable “the average sum of the virtual walked distance in IVE”.
The alternative hypothesis stated that there was a difference between the groups that utilized the continuous RDW and composite RDW controllers with respect to the dependent variable “the average sum of the virtual walked distance in IVE”.
The results of the descriptive statistics showed that the group that utilized the continuous RDW controller exhibited a lower value for the average sum of the virtual walked distance (M = 435.06, SD = 34.58) than that of the group using the composite RDW controller (M = 671.78, SD = 112.6), as shown in Table 17.
A two-tailed t-test for dependent samples (equal variances not assumed) showed that the difference between the continuous RDW and composite RDW controller groups with respect to the average sum of the actual distance that was traveled was statistically significant; t(30) = −9.13, p ≤ 0.001, 95% confidence interval (−296.69, −181.74), and thus, the null hypothesis was rejected. Figure 26 shows the average sums of the virtual distance that was walked in the IVE during the trials.

The Ratio of the Average Sum of the Virtual Distance That Was Walked in the IVE to the Average Sum of the Physical Distance That Was Walked in the Tracked Space

This parameter expressed how much of a gain in the virtual walked distance was achieved using a specific RDW controller, with a higher value indicating that there was a better redirection performance.
The null hypothesis stated that there was no difference in the mean value for this parameter between the cases in which the continuous RDWC was utilized and those in which the composite RDWC was used.
The alternative hypothesis stated that there was a difference in the mean value for this parameter between the cases in which the continuous RDWC was utilized and those in which the composite RDWC was used.
The descriptive statistics showed that in the cases in which the classic RDWC was utilized, the mean of the ratio had a lower value (M = 1.11, SD = 0.09) when it was compared to that for which the composite RDWC was used (M = 1.32, SD = 0.08), as shown in Table 18.
A t-test for dependent samples showed that this difference was statistically significant; t(30) = −13.78, p-value ≤ 0.001, 95% confidence interval (−0.24, −0.17). This resulted in a p-value is below the specified significance level of 0.05. The t-test result was therefore significant for the present data, and the null hypothesis was rejected. Figure 27 shows the evaluated ratios.

4.3.6. Discussion

Table 19 summarizes the evaluated performance parameters for the continuous and the composite RDW controllers. The redirection performance parameters showed that the proposed composite framework for the RDW technique performed better when it was compared to the continuous (classic) RDW framework. The results show that the composite RDWC had a 14.6% lower reset count than the classic RDWC did. Furthermore, the composite RDWC exhibited that a 20.64% higher virtual distance was walked between the resets and that there was a 21.39% higher average total virtual walked distance throughout the trials when they were compared to the ones for the continuous RDWC. Additionally, the user performance scores were increased by 23.78% with the utilization of the composite RDWC.
Moreover, the average difference between the virtual distance that was walked in the IVE and the physical walked distance in the real tracked space was higher for the composite controller group than it was for the continuous RDWC group, indicating a greater gain in the virtual walked distance in the VE. Regarding the effect of the proposed approach on the users’ performance, the results showed that the participants performed better when the composite controller was utilized compared to the continuous RDWC. In relation to the time that elapsed between the resets, the findings showed that the average time that elapsed between the resets increased by 4.86% with the use of the composite controller, however, this increase was statistically insignificant.
The descriptive statistics presented in Table 19 relate to the performance parameters (mentioned in Section 3.5) for both of the controllers, the continuous and the composite RDWC. The results showed that the composite RDWC outperformed the continuous RDWC in the virtual environment (Figure 9 in Section 4.2).

5. Conclusions and Directions for Future Works

In this study, we developed a composite spatial manipulation framework to effectively redirect a participant in a physical space and support unconstrained walking in an IVE.
Composite RDW controllers were implemented to quantitatively evaluate the redirection performance of the proposed framework. Two simulation experiments were performed. During the first experiment, only the technical aspects of the proposed RDW controller were evaluated, without considering the participants’ walking behavior. Control samples were collected, evaluating the state-of-the-art continuous RDW controllers (the S2C, APF, and RL systems) using a specific walking trajectory. Subsequently, the proposed composite approach was evaluated using the same walking trajectory. The results showed that the composite spatial manipulation framework was feasible because the proposed approach demonstrated a better redirection performance than the continuous RDWC did. Moreover, the composite RDW controller utilizing APF outperformed the other composite controllers, which used the steer-to-center and reinforcement learning approaches.
During the second simulation experiments, the performance of the proposed framework was evaluated by implementing the use of a composite RDW controller using APF (the best performing controller in the first experiment). In this experiment, the participants’ walking behavior was considered with the use of an agent simulating a participant in a search-and-retrieve task in a virtual warehouse within a simulated physical space measuring 6 × 6 m. The findings revealed that the composite RDW controller outperformed the continuous RDW controller. The composite RDW controller had a 9.72% lower reset count, a 25.76% higher virtual distance that was walked between the resets, a 17.87% higher average sum of virtual distance that was walked during the trials, and an 8.78% higher ratio of virtual distance that was walked to physical distance that was walked when it was compared to the continuous RDW controller that used the APF method. Furthermore, the results showed an 18.57% increase in the users’ performance when they were utilizing the proposed approach. These results verified our hypothesis.
Finally, a user experiment was conducted to validate the findings that were obtained in the simulation experiments and to investigate the effect of the proposed approach on the users’ performance. The same research methodology as that of the second simulation experiment was adopted, although during these experiments, real participants took part in the search-and-retrieve task, and we evaluated their performances. Assigning an objective to the participants made the travel task a secondary task, thereby mimicking practical scenarios in which the user travels from point a to point b in order to achieve a specific purpose, and so the walking task itself is a secondary task most of the time. Moreover, a tether-free VR experience was utilized to improve the feeling of presence (the feeling of being in the VE) to prevent the users from using the VR headset cable to localize themselves in the physical environment, and to eliminate the issue of the cables becoming tangled around the users. The results showed that the proposed approach exhibited a 14.6% lower reset count than that which was observed with the use of the continuous RDWC. Furthermore, the distance that was walked between the resets increased by 20.64%, and the average sum of the virtual distance that was walked during the trials increased by 21.39% when they were compared to those of the continuous RDWC. Moreover, the users’ performance scores improved by 23.78%. Furthermore, the ratio of the virtual distance that was walked to the physical distance that was walked increased by 15.9%.
Comparing the redirection parameters that were evaluated in the real-life user experiments to the results of the second experiment (Section 4.2), we observed that the findings of the user study validated the findings of the second simulation experiment. However, we found that the values of the parameters (the average value of user performance and the average reset count during the trials) that were evaluated in the user experiment were lower than those that were obtained for the same evaluated parameters in the simulation experiments. This difference was due to the difference in the participants’ walking speeds in both of the experiments. During the simulation studies, the participants’ simulated walking speed was fixed (1 m/s), whereas in the user experiment, the walking speed was variable, with there being an average of 0.87 m/s.
However, there were some limitations regarding the use of the composite spatial manipulation framework when the discrete redirection approach using eyeblinks was adopted. For instance, it emerged that the performance of the proposed approach depended on the number of eyeblink occurrences. A higher blink count meant there were more opportunities to introduce imperceptible spatial manipulations into the participant’s virtual perspective in the VE and thus, obtain a better performance. Additionally, implementing constraints on the application of the discrete spatial manipulations (such as the minimum threshold value of the walking speed and the minimum threshold value of the angle between the gaze direction and heading direction) reduced the opportunities to apply discrete spatial manipulations and thus, it worsened the performance. However, these constraints reduced the likelihood that the participant would detect the spatial manipulations that had been introduced in the study.
The composite spatial manipulation framework is a scalable approach. With the constantly increasing body of research on the RDW technique and the emergence of better continuous RDW controllers, it will be possible to adopt the composite spatial manipulation framework to combine two RDW controllers as long as each one utilizes different perceptual processes, such as the use of continuous RDW controllers, along with the use of discrete RDW during saccades and eyeblinks.
In future works, we propose extending the discrete manipulation approach for composite controllers in order to include eyeblinks and saccades as this would increase the number of opportunities to introduce spatial manipulations, especially since it is easier to induce saccades artificially compared to eyeblinks. Extending the capabilities of the composite controllers will help to reduce the spatial requirements of the RDW controller. Furthermore, this will increase the virtual distance that is walked, which means that the users can explore a greater virtual area within a given physical space.
Additionally, it would be beneficial to conduct a broader user study with a more balanced population (male/female) to investigate the impact of the use of composite controllers on cognitive load and user performance.

Author Contributions

Investigation, N.A.; Project administration, A.Z.; Writing—original draft, N.A.; Writing—review & editing, N.A. All authors have read and agreed to the published version of the manuscript.

Funding

This research received no external funding.

Data Availability Statement

All data has been present in main text.

Conflicts of Interest

The authors declare no conflict of interest.

References

  1. Ruddle, R.A.; Volkova, E.; Bülthoff, H.H. Walking improves your cognitive map in environments that are large-scale and large in extent. ACM Trans. Comput. Interact. 2011, 18, 1–20. [Google Scholar] [CrossRef] [Green Version]
  2. Marsh, W.E.; Kelly, J.W.; Dark, V.J.; Oliver, J. Cognitive Demands of Semi-Natural Virtual Locomotion. Presence Teleoperators Virtual Environ. 2013, 22, 216–234. [Google Scholar] [CrossRef] [Green Version]
  3. Ruddle, R.A.; Lessels, S. The benefits of using a walking interface to navigate virtual environments. ACM Trans. Comput. Interact. 2009, 16, 1–18. [Google Scholar] [CrossRef] [Green Version]
  4. Razzaque, S. Redirected Walking. Ph.D. Thesis, University of North Carolina, Chapel Hill, NC, USA, 2005. [Google Scholar]
  5. Nilsson, N.C.; Peck, T.; Bruder, G.; Hodgson, E.; Serafin, S.; Whitton, M.; Steinicke, F.; Rosenberg, E.S. 15 Years of Research on Redirected Walking in Immersive Virtual Environments. IEEE Comput. Graph. Appl. 2018, 38, 44–56. [Google Scholar] [CrossRef]
  6. Sharif, R.; Kohn, Z.; Mary; Whitton, C. Redirected Walking. Eurographics 2001, 2001, 112. [Google Scholar]
  7. Suma, E.A.; Lipps, Z.; Finkelstein, S.; Krum, D.M.; Bolas, M. Impossible Spaces: Maximizing Natural Walking in Virtual Environments with Self-Overlapping Architecture. IEEE Trans. Vis. Comput. Graph. 2012, 18, 555–564. [Google Scholar] [CrossRef] [PubMed]
  8. ESuma, A.; Clark, S.; Krum, D.; Finkelstein, S.; Bolas, M.; Warte, Z. Leveraging change blindness for redirection in virtual environments. In Proceedings of the IEEE Virtual Reality Conference (VR), Singapore, 19–23 March 2011; pp. 159–166. [Google Scholar]
  9. Hodgson, E.; Bachmann, E. Comparing Four Approaches to Generalized Redirected Walking: Simulation and Live User Data. IEEE Trans. Vis. Comput. Graph. 2013, 19, 634–643. [Google Scholar] [CrossRef]
  10. Steinicke, F.; Bruder, G.; Jerald, J.; Frenz, H.; Lappe, M. Estimation of Detection Thresholds for Redirected Walking Techniques. IEEE Trans. Vis. Comput. Graph. 2009, 16, 17–27. [Google Scholar] [CrossRef] [PubMed]
  11. Field, T.; Vamplew, P. Generalised algorithms for redirected walking in virtual environments. In Proceedings of the AISAT2004: International Conference on Artificial Intelligence in Science and Technology, Hobart, Australia, 21 November 2004; Volume 4, pp. 58–63. [Google Scholar]
  12. Langbehn, E.; Lubos, P.; Bruder, G.; Steinicke, F. Application of redirected walking in room-scale VR. In Proceedings of the 2017 IEEE Virtual Reality (VR), Los Angeles, CA, USA, 18–22 March 2017; Volume 7, pp. 449–450. [Google Scholar] [CrossRef]
  13. Dimitropoulos, N.; Togias, T.; Zacharaki, N.; Michalos, G.; Makris, S. Seamless Human–Robot Collaborative Assembly Using Artificial Intelligence and Wearable Devices. Appl. Sci. 2021, 11, 5699. [Google Scholar] [CrossRef]
  14. Michalos, G.; Karvouniari, A.; Dimitropoulos, N.; Togias, T.; Makris, S. Workplace analysis and design using virtual reality techniques. CIRP Ann. 2018, 67, 141–144. [Google Scholar] [CrossRef]
  15. Bruder, G.; Lubos, P.; Steinicke, F. Cognitive Resource Demands of Redirected Walking. IEEE Trans. Vis. Comput. Graph. 2015, 21, 539–544. [Google Scholar] [CrossRef]
  16. Langbehn, E.; Steinicke, F.; Lappe, M.; Welch, G.F.; Bruder, G. In the blink of an eye—Leveraging Blink-Induced Suppression for Imperceptible Position and Orientation Redirection in Virtual Reality. ACM Trans. Graph. 2018, 37, 1–11. [Google Scholar] [CrossRef]
  17. Sun, Q.; Patney, A.; Wei, L.-Y.; Shapira, O.; Lu, J.; Asente, P.; Zhu, S.; Mcguire, M.; Luebke, D.; Kaufman, A. Towards virtual reality infinite walking. ACM Trans. Graph. 2018, 37, 1–13. [Google Scholar] [CrossRef]
  18. Nguyen, A.; Inhelder, M.; Kunz, A. Discrete Rotation During Eye-Blink; LNCS sublibrary. SL 6, Image processing, computer vision, pattern recognition, and graphics, vol. 10850, Augmented reality, virtual reality, and computer graphics. In Proceedings of the Part I: 5th International Conference, AVR 2018, Otranto, Italy, 24–27 June 2018; de Paolis, P.B.L.T., Bourdot, P., Eds.; Springer: Cham, Switzerland, 2018; pp. 183–189. [Google Scholar]
  19. Volkmann, F.C. Human visual suppression. Vis. Res. 1986, 26, 1401–1416. [Google Scholar] [CrossRef]
  20. Volkmann, F.C.; Riggs, L.A.; Moore, R.K. Eyeblinks and Visual Suppression. Science 1980, 207, 900–902. [Google Scholar] [CrossRef]
  21. Bristow, D.; Haynes, J.-D.; Sylvester, R.; Frith, C.; Rees, G. Blinking Suppresses the Neural Response to Unchanging Retinal Stimulation. Curr. Biol. 2005, 15, 1296–1300. [Google Scholar] [CrossRef] [Green Version]
  22. Greicius, M.D.; Krasnow, B.; Reiss, A.L.; Menon, V. Functional connectivity in the resting brain: A network analysis of the default mode hypothesis. Proc. Natl. Acad. Sci. USA 2002, 100, 253–258. [Google Scholar] [CrossRef] [PubMed] [Green Version]
  23. Nakano, T.; Kato, M.; Morito, Y.; Itoi, S.; Kitazawa, S. Blink-related momentary activation of the default mode network while viewing videos. Proc. Natl. Acad. Sci. USA 2012, 110, 702–706. [Google Scholar] [CrossRef] [PubMed] [Green Version]
  24. Alsaeedi, N.; Wloka, D. Velocity-Dependent Perception Threshold for Discrete Imperceptible Repositioning in a Virtual Environment During Eye Blinks. IEEE Access 2021, 9, 122147–122165. [Google Scholar] [CrossRef]
  25. Thomas, J.; Rosenberg, E.S. A General Reactive Algorithm for Redirected Walking Using Artificial Potential Functions. In Proceedings of the 2019 IEEE Conference on Virtual Reality and 3D User Interfaces (VR), Osaka, Japan, 23–27 March 2019; pp. 56–62. [Google Scholar]
  26. Strauss, R.R.; Ramanujan, R.; Becker, A.; Peck, T.C. A Steering Algorithm for Redirected Walking Using Reinforcement Learning. IEEE Trans. Vis. Comput. Graph. 2020, 26, 1955–1963. [Google Scholar] [CrossRef] [PubMed]
  27. Hodgson, E.; Bachmann, E.; Thrash, T. Performance of Redirected Walking Algorithms in a Constrained Virtual World. IEEE Trans. Vis. Comput. Graph. 2014, 20, 579–587. [Google Scholar] [CrossRef] [PubMed]
  28. Zmuda, M.A.; Wonser, J.L.; Bachmann, E.R.; Hodgson, E. Optimizing Constrained-Environment Redirected Walking Instructions Using Search Techniques. IEEE Trans. Vis. Comput. Graph. 2013, 19, 1872–1884. [Google Scholar] [CrossRef] [PubMed]
  29. Azmandian, M.; Grechkin, T.; Bolas, M.; Suma, E. (Eds.) Physical Space Requirements for Redi-Rected Walking: How Size and Shape Affect Performance; USC Institute for Creative Technologies: Los Angeles, CA, USA, 2015. [Google Scholar]
  30. Williams, N.L.; Bera, A.; Manocha, D. ARC: Alignment-based Redirection Controller for Redirected Walking in Complex Environments. IEEE Trans. Vis. Comput. Graph. 2021, 27, 2535–2544. [Google Scholar] [CrossRef]
  31. Li, Y.-J.; Wang, M.; Steinicke, F.; Zhao, Q. (Eds.) OpenRDW: A Redirected Walking Library and Benchmark with Multi-User, Learning-Based Functionalities and State-of-the-Art Algorithms; IEEE: Piscataway, NJ, USA, 2021. [Google Scholar]
  32. Hodgson, E.; Bachmann, E.; Waller, D. Redirected walking to explore virtual environments. ACM Trans. Appl. Percept. 2011, 8, 1–22. [Google Scholar] [CrossRef]
  33. Bachmann, E.R.; Hodgson, E.; Hoffbauer, C.; Messinger, J. Multi-User Redirected Walking and Resetting Using Artificial Potential Fields. IEEE Trans. Vis. Comput. Graph. 2019, 25, 2022–2031. [Google Scholar] [CrossRef]
  34. Langbehn, E.; Lubos, P.; Bruder, G.; Steinicke, F. Bending the Curve: Sensitivity to Bending of Curved Paths and Application in Room-Scale VR. IEEE Trans. Vis. Comput. Graph. 2017, 23, 1389–1398. [Google Scholar] [CrossRef]
  35. Alsaeedi, N. Eye Blink Detection; Springer: Berlin/Heidelberg, Germany, 2019. [Google Scholar]
  36. Alsaeedi, N.; Wloka, D. Real-Time Eyeblink Detector and Eye State Classifier for Virtual Reality (VR) Headsets (Head-Mounted Displays, HMDs). Sensors 2019, 19, 1121. [Google Scholar] [CrossRef] [PubMed]
Figure 1. Head movement constraints when applying translation gains on the user’s viewpoint in VR. (a) Top view showing the range of limits on head movements during a yaw movement. (b) Side view showing the range of limits on head movements during a pitch movement.
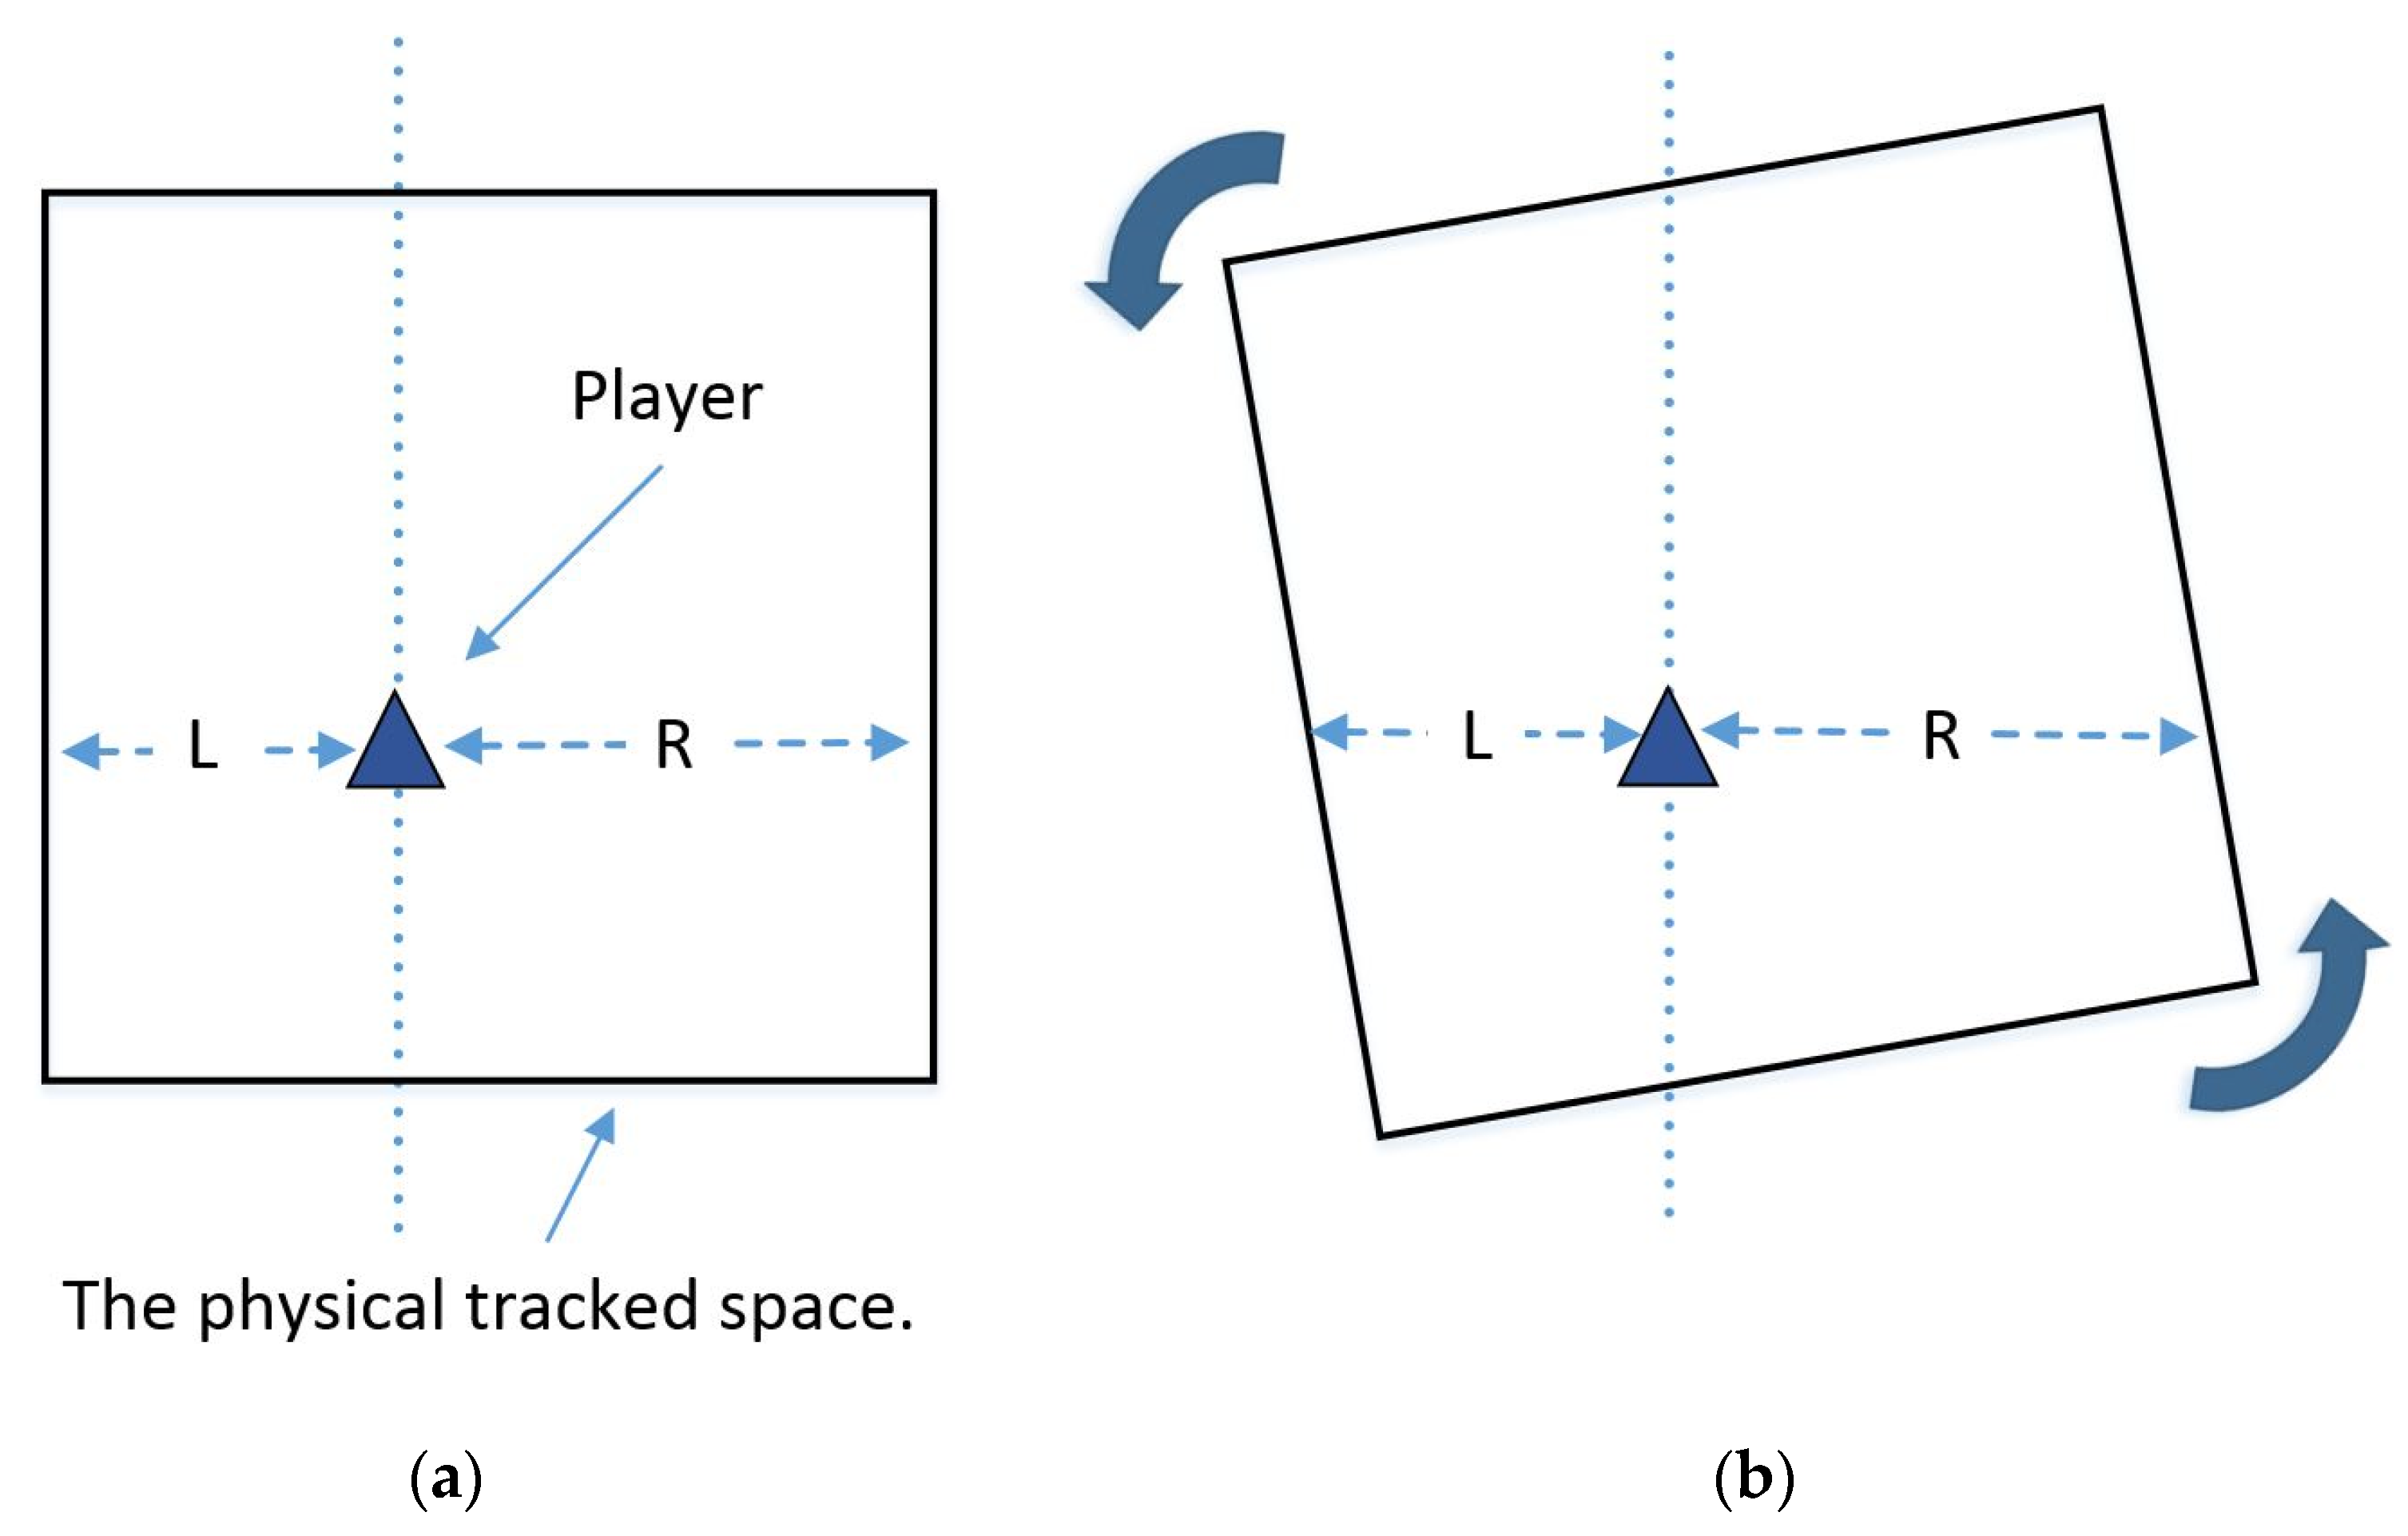
Computers 11 00156 g001
Figure 2. How the direction of the discrete rotation was selected. (a) The user is represented by a triangle located in the physical space. (b) Discrete rotation was applied to steer the user away from the boundary of the physical space.
Computers 11 00156 g002
Figure 3. User interface (UI) of the software used for detecting eyeblinks in HMDs. (a) The interface when the eye is open. (b) Visualization of the motion vector during eye closure.
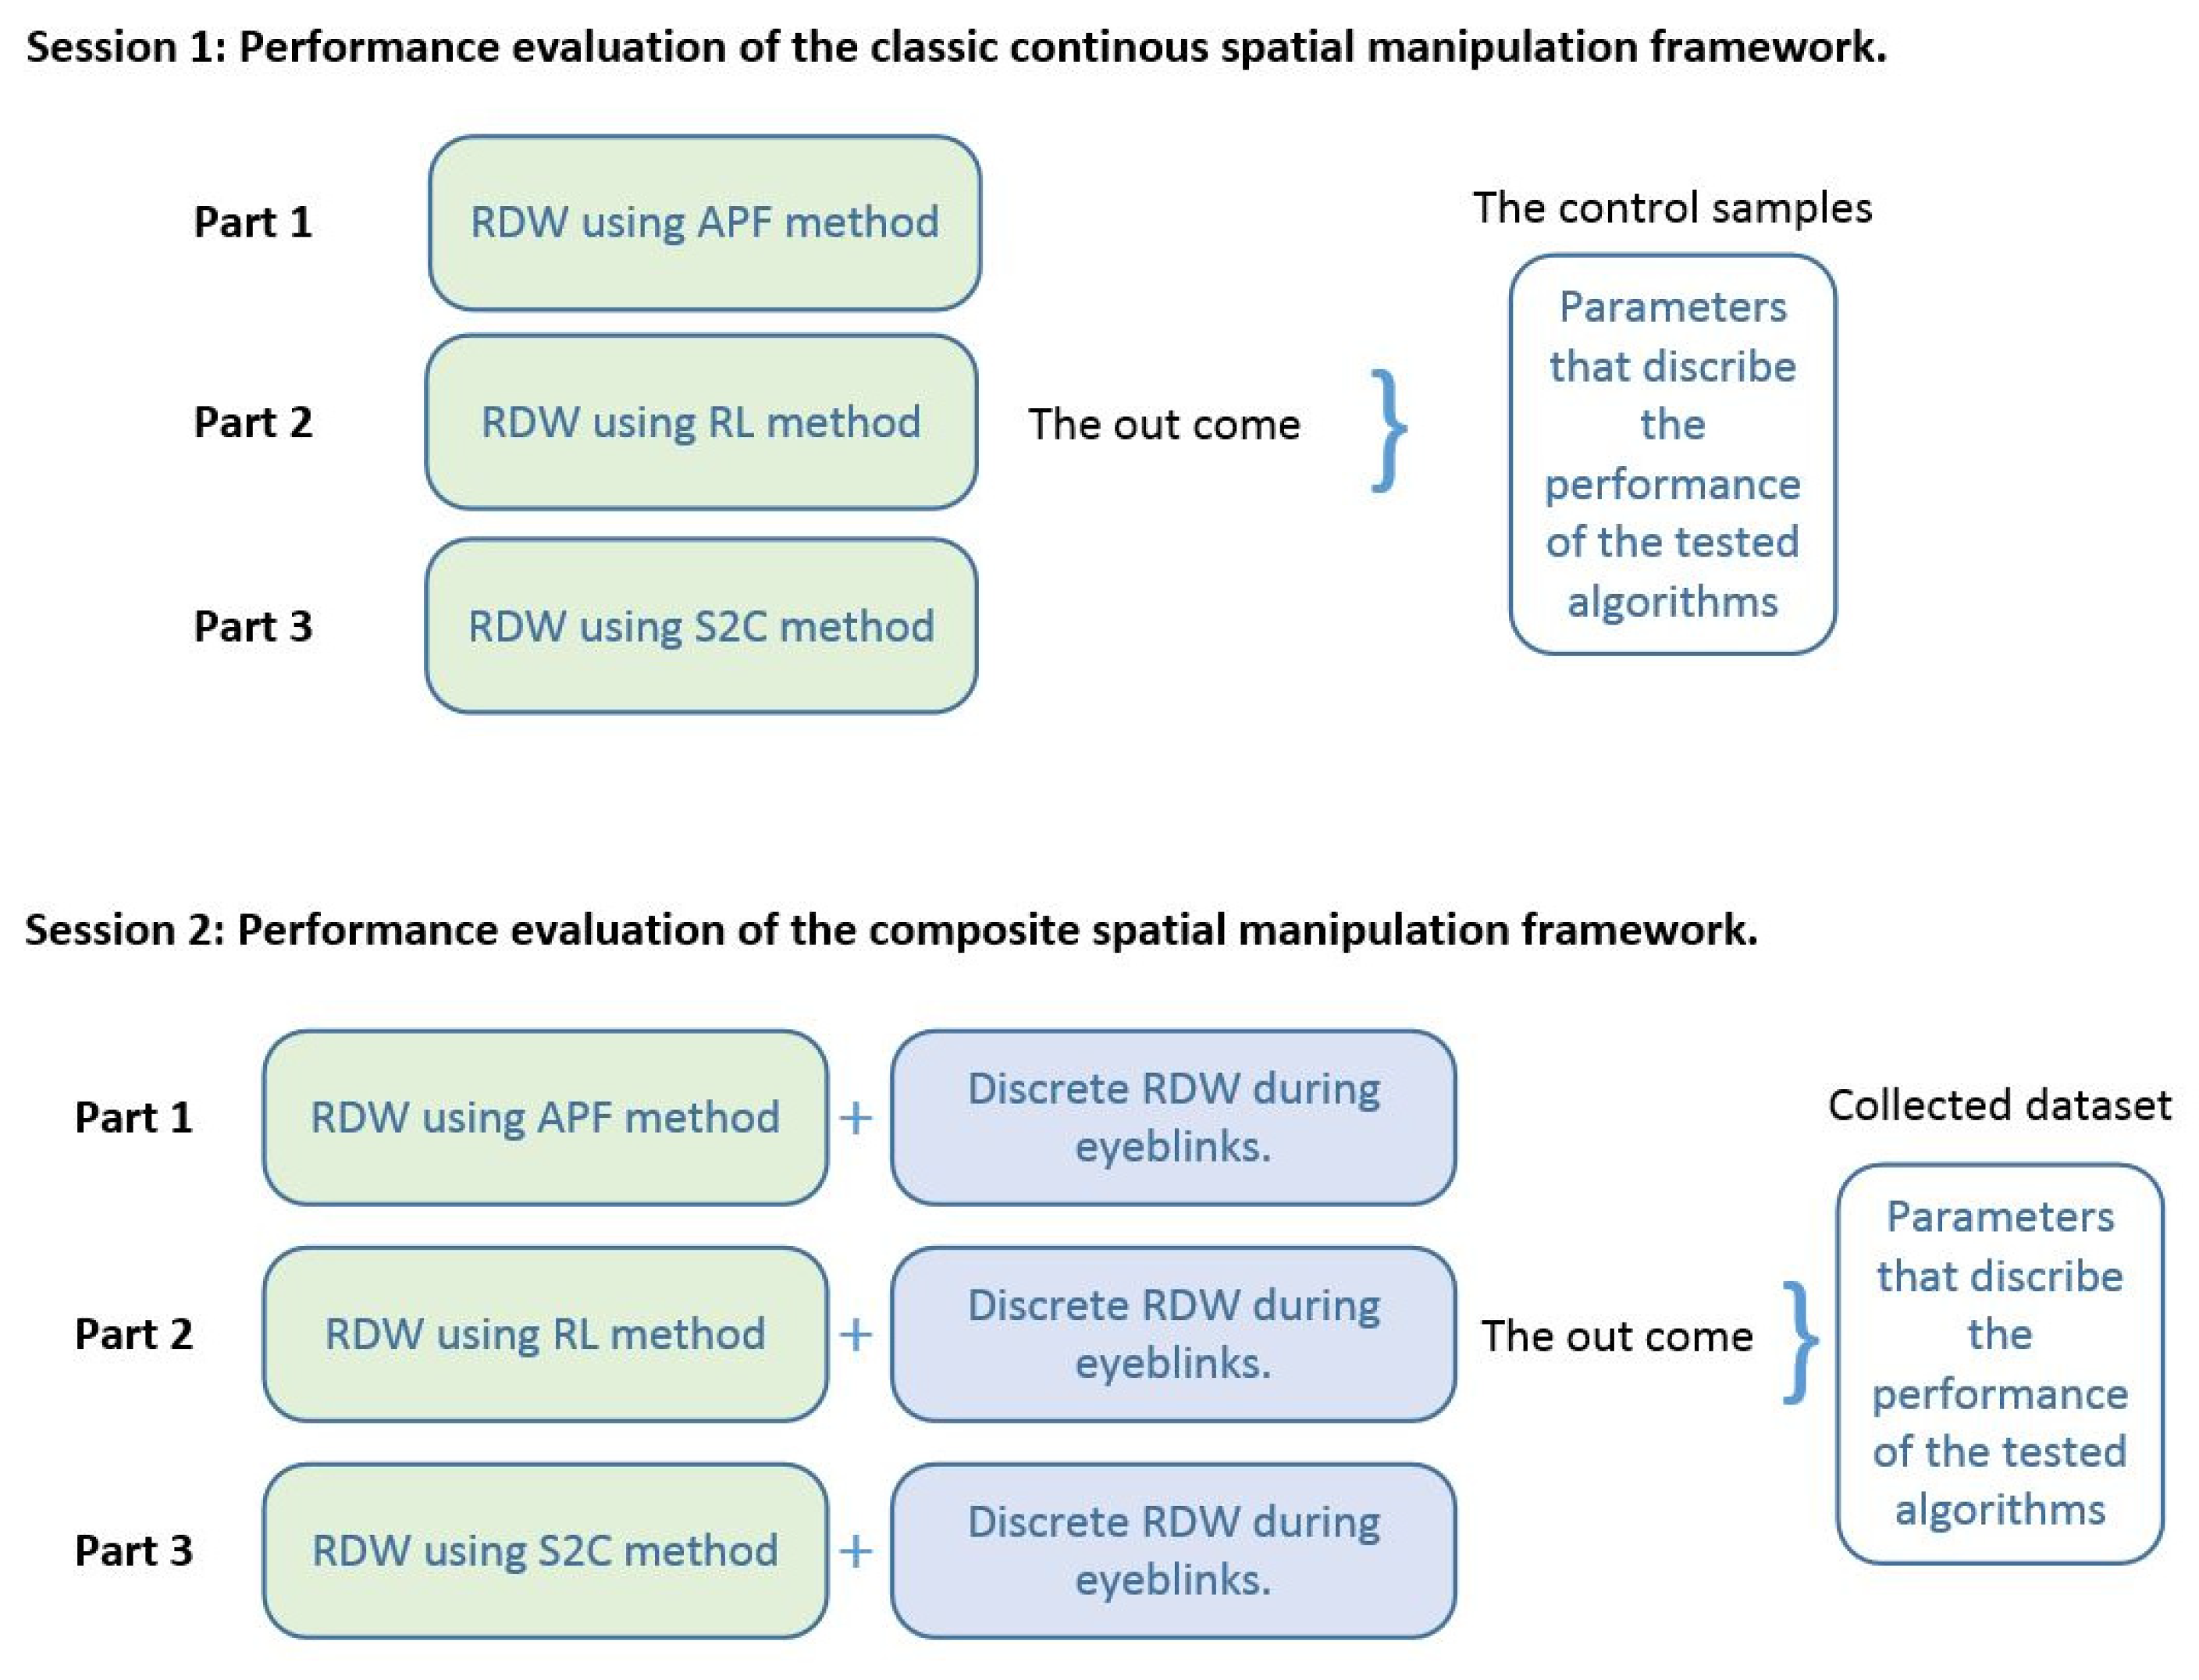
Computers 11 00156 g003
Figure 4. Summary of the first stage of experiments conducted to evaluate the performance of the proposed composite RDW controllers.
Computers 11 00156 g004
Figure 5. Top-down view of the virtual environment used in the simulation. The figure shows the virtual walked trajectory (in green) and the physical walked trajectory (in blue).
Computers 11 00156 g005
Figure 6. (a) The results of ANOVA for the counts of reset events during the trials. (b) The estimated marginal means of the counts of resets events.
Computers 11 00156 g006
Figure 7. (a) The results of the two-factor ANOVA for the average elapsed time between resets. (b) The estimated marginal means of the average elapsed time between resets.
Computers 11 00156 g007
Figure 8. (a) The results of evaluating the average virtual distance that was walked between resets using ANOVA; (b) the marginal means of the virtual distance that was walked between resets.
Computers 11 00156 g008
Figure 9. The virtual environment used in the user experiment. (a) Bird’s-eye view of the warehouse. (b) The box where the cubes needed to be collected. (c) Top-down view of the warehouse.
Computers 11 00156 g009
Figure 10. Screenshots that were obtained during the second simulation experiment. (a) Third-person view of an agent simulating a user in the IVE. (b) Top view showing the available simulated tracked physical space for the agent, as well as the virtual walked trajectory (green track) and the physical walked trajectory (blue track).
Computers 11 00156 g010
Figure 11. The average reset counts that were obtained during the trials. The dashed line represents the mean, and the solid line represents the median.
Computers 11 00156 g011
Figure 12. The average virtual distance that was walked between resets. The dashed line represents the mean, and the solid line represents the median.
Computers 11 00156 g012
Figure 13. The average time elapsed between resets. The dashed line represents the mean, and the solid line represents the median.
Computers 11 00156 g013
Figure 14. The average sum of the virtual distance walked in the virtual environment across the trials. The dashed line represents the mean, and the solid line represents the median.
Computers 11 00156 g014
Figure 15. The average scores of participant performance across the trials. The dashed line represents the mean, and the solid line represents the median.
Computers 11 00156 g015
Figure 16. The ratio of the average sum of the virtual distance walked in the IVE to the average sum of the distance that was walked in the real physical space.
Computers 11 00156 g016
Figure 17. The physical environment that was used in the user experiment.
Computers 11 00156 g017
Figure 18. The apparatuses that were utilized during the experiment. (1) Notebook; (2) custom notebook mounting rack; (3) Microsoft wireless display adaptor; (4) external battery; (5) external battery charger; (6) monitor; (7) wireless mouse; (8) wireless keyboard; (9) HTC Vive Lighthouse 2; (10) external battery bank 12 V, 9 V, 20,000 mA; (11) HTC Vive controllers; (12) HTC Vive Pro Eye VR-headset; (13) tripods to mount the HTC Vive Lighthouse; (14) backpack.
Computers 11 00156 g018
Figure 19. The VR mobile station used for the tether-free experience. (a) The custom-made rack and the portable power supply for mounting the notebook inside the backpack. (b) Peripherals (monitor, keyboard, and mouse) were connected wirelessly to the notebook inside the backpack. (c) The backpack with the hardware components which were carried inside it.
Computers 11 00156 g019
Figure 20. Experimental procedure for evaluating the performance of the proposed RDWC.
Computers 11 00156 g020
Figure 21. The average user performance in the IVE for both of the controllers. The dashed line represents the mean, and the solid line represents the median.
Computers 11 00156 g021
Figure 22. The average number of rest counts that were measured during the trials for the groups that utilized the continuous RDW and composite RDW controllers. The dashed line represents the mean, and the solid line represents the median.
Computers 11 00156 g022
Figure 23. The average time that elapsed between resets during the trials. The dashed line represents the mean, and the solid line represents the median.
Computers 11 00156 g023
Figure 24. The average sum of the virtual distance that was walked between resets during the trials. The dashed line represents the mean, and the solid line represents the median.
Computers 11 00156 g024
Figure 25. The average sums of the real distance that was walked during the trials. The dashed line represents the mean, and the solid line represents the median.
Computers 11 00156 g025
Figure 26. The average sum of the virtual distance that was walked in the IVE during the trials. The dashed line represents the mean, and the solid line represents the median.
Computers 11 00156 g026
Figure 27. The ratio of the average total virtual distance that was walked in the IVE to the average total distance that was walked in the real physical space.
Computers 11 00156 g027
Table 1. The two-factor ANOVA results for the average counts of reset events during the trials.
SummaryS2CAPFRLTotal
Continuous Framework
Count31313193
Sum4343983431175
Average28.9326.5322.8726.11
Variance4.923.553.7010.24
Composite Framework
Count31313193
Sum344297281922
Average22.9319.8018.7320.49
Variance8.6422.033.7814.21
Two-factor ANOVAdfF-valuep-valueF Crit
Sample192.53<0.0013.95
Columns2198.03231.203.11
Interaction21.730.1833.11
Table 2. The results of the two-factor ANOVA for the average time elapsed between resets.
SummaryS2CAPFRLTotal
Continuous Framework
Count31313193
Sum177.45197.69179.51554.65
Average11.8313.1811.9712.33
Variance3.124.272.893.65
Composite Framework
Count31313193
Sum224.15265.62231.20720.97
Average14.9417.7115.4116.02
Variance8.3122.802.2712.11
Two-factor ANOVAdfF-valuep-valueF Crit
Sample142.24<0.0013.95
Columns25.080.0083.11
Interaction20.5650.5703.11
Table 3. The results of the two-factor ANOVA evaluating the average virtual distance that was walked between resets.
SummaryS2CAPFRLTotal
Continuous Framework
Count31313193
Sum167.88181.27219.26568.40
Average11.1912.0814.6212.63
Variance0.902.311.933.79
Composite Framework
Count31313193
Sum253.70284.76295.21833.66
Average16.9118.9819.6818.53
Variance4.1328.545.4513.54
Two-factor ANOVAdfF-valuep-valueF Crit
Sample1108.43<0.0013.955
Columns29.980.00013.105
Interaction20.900.413.105
Table 4. Performance metrics that were obtained during the trials and the evaluated score values for each controller.
FrameworkController TypeAverage Count of ResetsAverage Virtual Distance Walked between ResetsAverage Time Elapsed between Resets
Continuous FrameworkRDW by RL22.8714.6211.97
Continuous FrameworkRDW by APF26.3312.2013.18
Continuous FrameworkRDW by S2C28.9311.3911.83
Composite FrameworkRDW by RL18.7319.6815.41
Composite FrameworkRDW by APF19.8019.3817.71
Composite FrameworkRDW by S2C22.9316.9114.94
p-Value <0.001<0.001<0.001
Table 5. Descriptive statistics of the average value of the reset counts that were obtained during the trials.
FrameworkSamplesMeanStd. DeviationStd. Error Mean
Continuous RDWC3173.065.681.02
Composite RDWC3167.396.941.25
Table 6. Descriptive statistics of the average value of the virtual distance that was walked between the resets.
FrameworkSamplesMeanStd. DeviationStd. Error Mean
Continuous RDWC317.140.640.12
Composite RDWC3110.161.220.22
Table 7. Descriptive statistics for the average time elapsed between resets.
FrameworkSamplesMeanStd. DeviationStd. Error Mean
Continuous RDWC318.440.670.12
Composite RDWC319.030.90.16
Table 8. Descriptive statistics for the average of the sum of the virtual distance (m) that was walked in the IVE.
FrameworkSamplesMeanStd. DeviationStd. Error Mean
Continuous RDWC31527.2946.148.29
Composite RDWC31691.0280.9114.53
Table 9. Descriptive statistics for the average scores that were achieved by the participants during the trials.
FrameworkSamplesMeanStd. DeviationStd. Error Mean
Continuous RDWC3116.261.770.32
Composite RDWC3119.972.710.49
Table 10. Descriptive statistics for the mean value of the ratio of the virtual-to-physical walked distance during the trials.
FrameworkSamplesMeanStd. DeviationStd. Error Mean
Continuous RDWC311.350.010
Composite RDWC311.50.040.01
Table 11. The performance parameters that were evaluated for the classic RDW controller and the proposed approach during the simulation study.
RDW ControllersAverage Score of User PerformanceAverage Count of ResetsAverage Virtual Distance Walked between ResetsAverage Time Elapsed between ResetsThe Average Sum of the Virtual Distance WalkedThe Ratio of Virtual/Real Distance Walked
Continuous RDWC16.2673.067.14 (m)8.44 (s)527.29 (m)1.35
Composite RDWC19.9767.3910.16 (m)9.03 (s)691.02 (m)1.5
p-value˂0.001˂0.004˂0.001=0.001˂0.001˂0.001
Table 12. Descriptive statistics for the mean ratio of the virtual distance that was walked to the physical distance that was walked during the trials.
FrameworkSamplesMeanStd. DeviationStd. Error Mean
Continuous RDWC3111.181.780.43
Composite RDWC3114.591.770.43
Table 13. Descriptive statistics for the mean value of reset counts during the trials.
FrameworkSamplesMeanStd. DeviationStd. Error Mean
Continuous RDWC3160.826.741.63
Composite RDWC3151.947.951.93
Table 14. Descriptive statistics for the mean value of the average time that elapsed during the trials.
FrameworkSamplesMeanStd. DeviationStd. Error Mean
Continuous RDWC3110.961.310.32
Composite RDWC3111.521.60.39
Table 15. Descriptive statistics for the average virtual distance that was walked between resets.
FrameworkSamplesMeanStd. DeviationStd. Error Mean
Continuous RDWC317.571.110.29
Composite RDWC319.541.160.3
Table 16. Descriptive statistics for the mean value of the average sum of the real distance that was walked during the trials.
FrameworkSamplesMeanStd. DeviationStd. Error Mean
Continuous RDWC31411.8732.487.88
Composite RDWC31523.9679.319.23
Table 17. Descriptive statistics for the average sum of the virtual distance that was walked in the IVE during the trials.
FrameworkSamplesMeanStd. DeviationStd. Error Mean
Continuous RDWC31435.0634.588.39
Composite RDWC31671.78112.627.31
Table 18. Descriptive statistics for the ratio of virtual-to-physical distance that was walked during the trials.
FrameworkSamplesMeanStd. DeviationStd. Error Mean
Continuous RDWC311.110.090.02
Composite RDWC311.320.080.021
Table 19. Descriptive statistics for the performance parameters of the composite and the continuous RDW controller groups.
RDW ControllersAverage Score of User PerformanceAverage Count of ResetsAverage Virtual Walked Distance between the ResetsAverage Time Elapsed between ResetsThe Average Sum of the Virtual Walked DistanceThe Ratio of Virtual/Real Walked Distance
Continuous RDWC11.1260.827.57 (m)10.96 (s)435.06 (m)1.11
Composite RDWC14.5951.949.54 (m)11.52 (s)671.78 (m)1.32
p-value˂0.001˂0.001˂0.001≥0.076˂0.001˂0.001
Publisher’s Note: MDPI stays neutral with regard to jurisdictional claims in published maps and institutional affiliations.

