
User Analytics in Online Social Networks: Evolving from Social Instances to Social Individuals

 ,
, 
Abstract
1. Introduction
2. Related Work
3. User Analytics in OSNs: Our Approach
3.1. Service Architecture
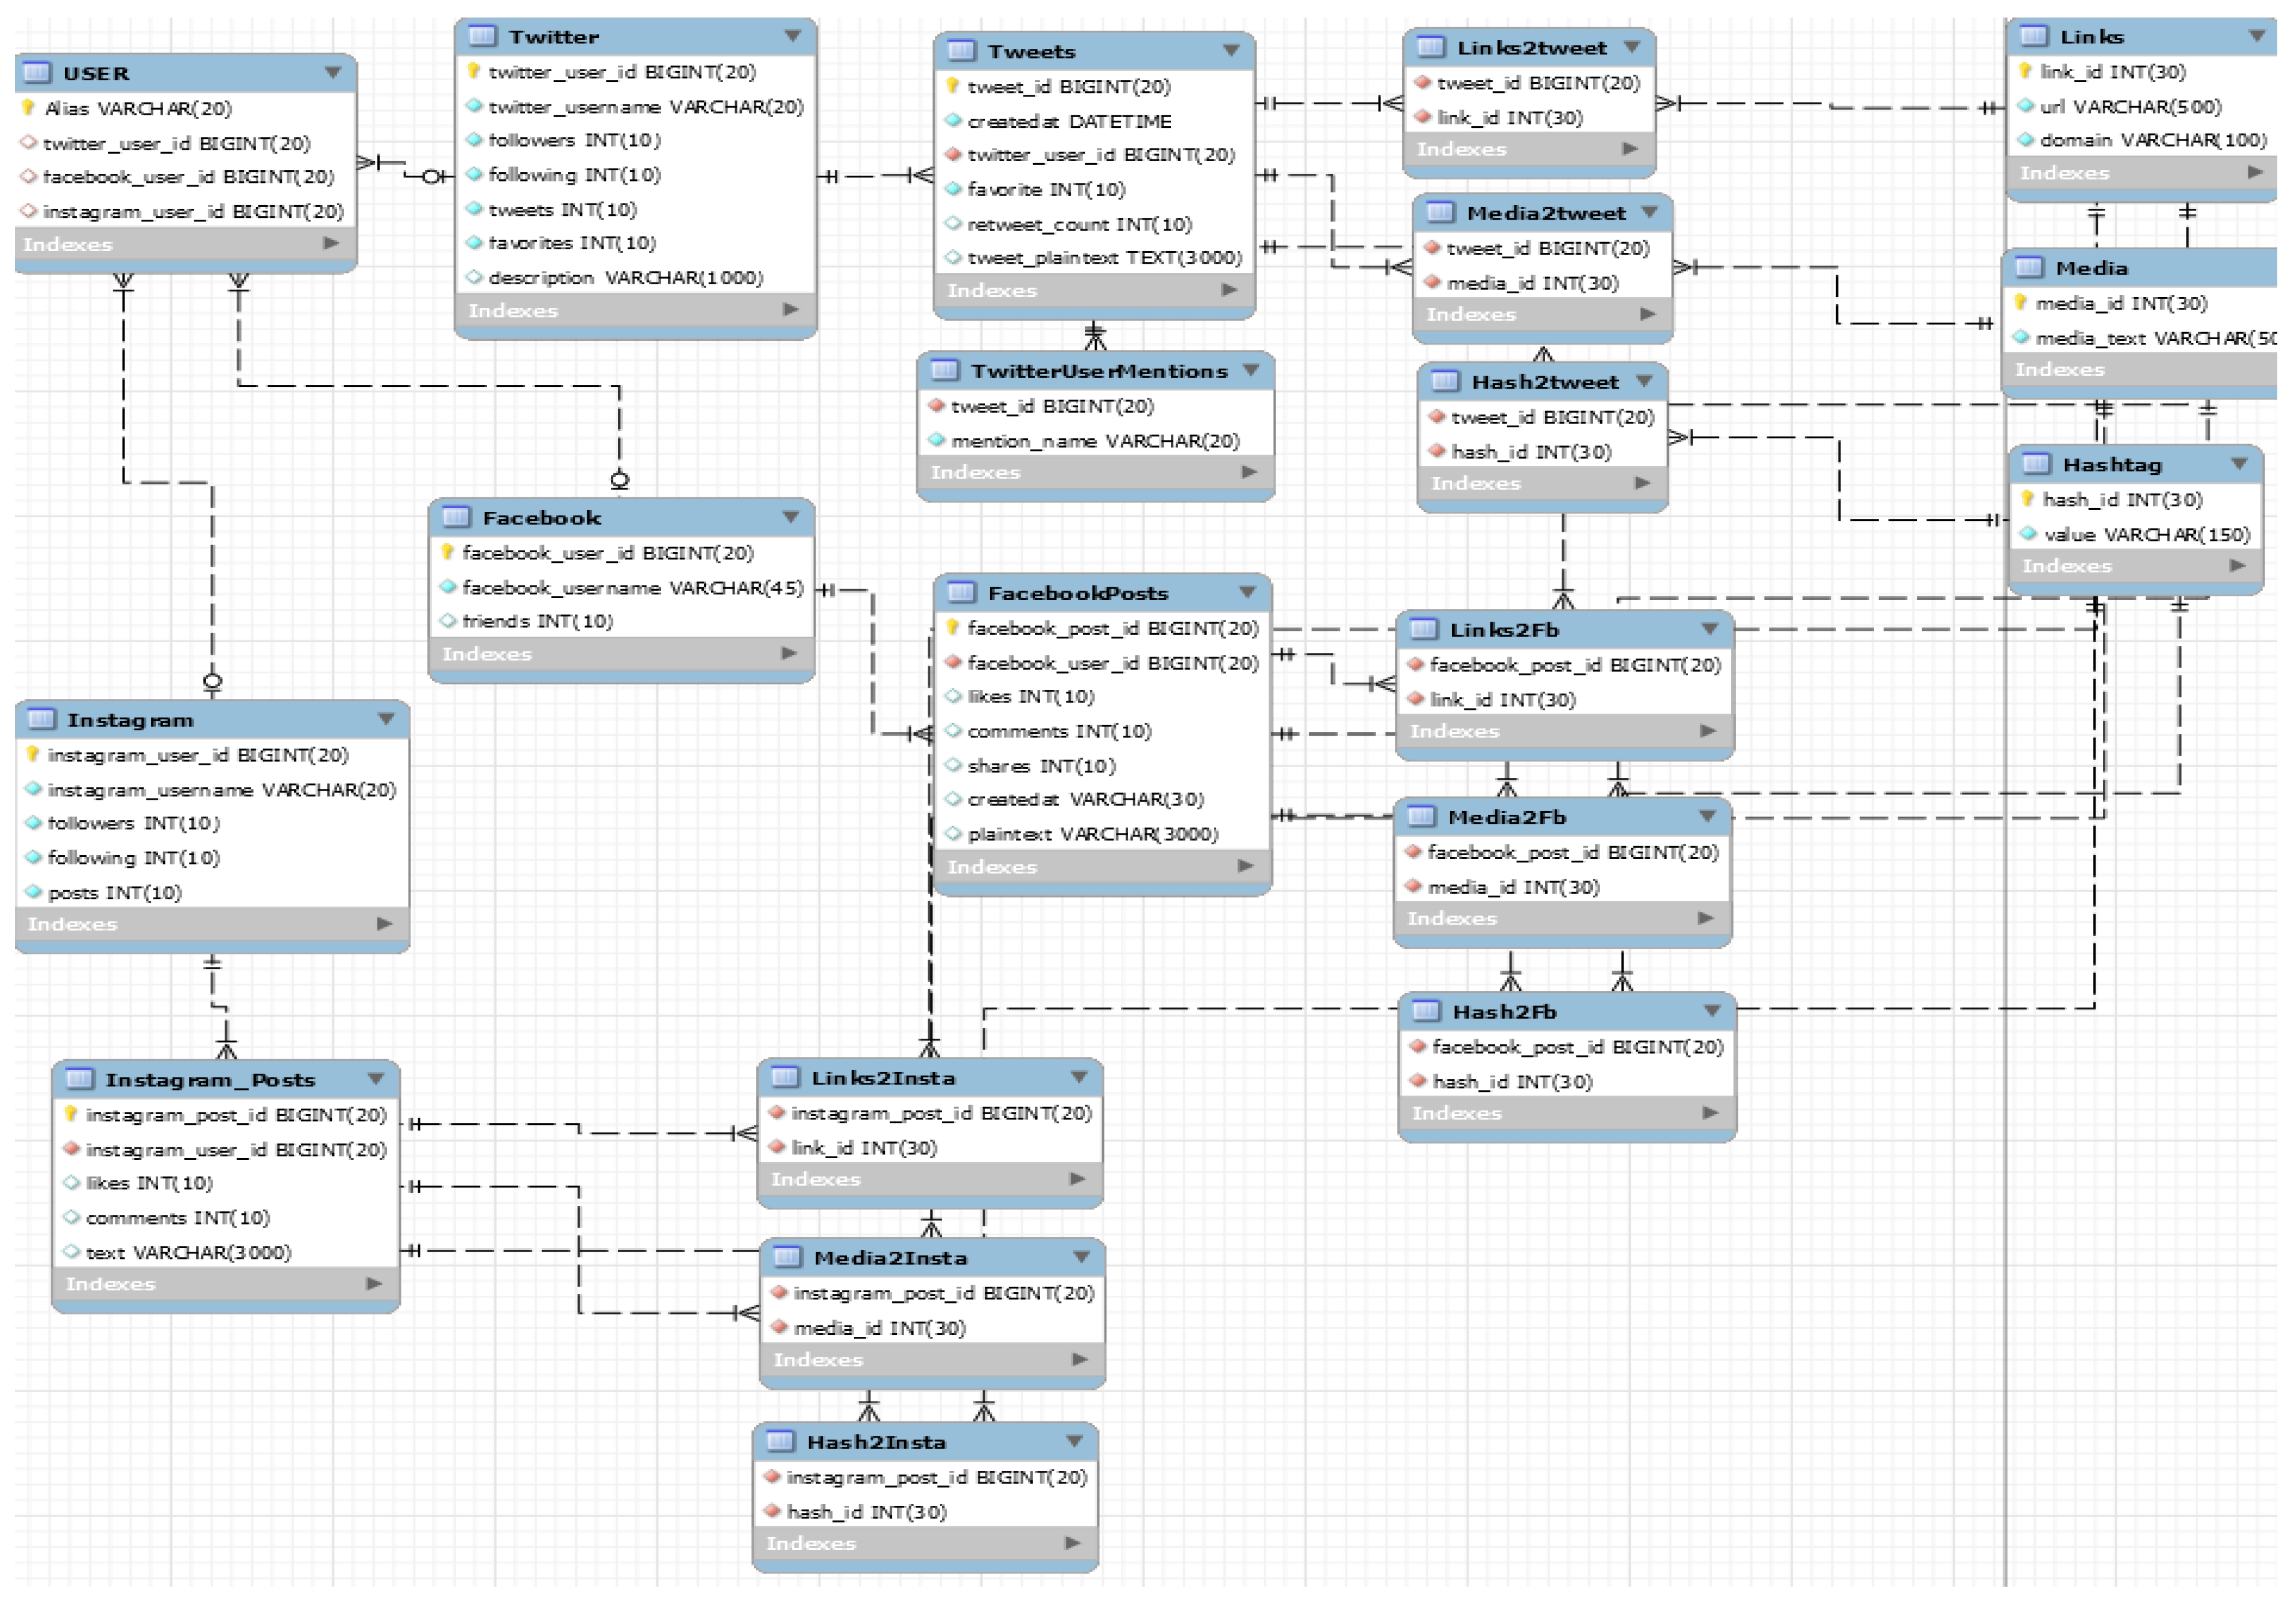
3.2. Database Model
- OSN accounts: the tables “Twitter”, “Facebook”, and “Instagram” store the basic metadata regarding the social accounts.
- OSN posts: the tables “Tweets”, “FacebookPosts”, and “InstagramPosts” store the basic metadata regarding the social messages.
- OSN entities: the tables “Hashtags”, “Links”, and “Media” store these social entities.
- User alias: the table “User” allows us to analyse the seemingly unconnected social instances, namely the OSN accounts, as social individuals. Essentially, this table assigns an alias to an entity (social individual) that maintains accounts in all three examined OSNs (social instances).
- Joining tables: these supportive structures are created to represent the many relationships in our schema, since relational database management systems (RDBMS) do not support the direct implementation of said relationships between tables. Indicative examples are the “Links2Tweets”, “Media2Fb”, and “Hash2Insta” tables.
3.3. OSN Data Acquisition
4. Defining Influential Metrics in OSNs
4.1. Rating the Dataset’s Twitter Accounts
5. Experimental Results
5.1. Experimental Methodology
- Distribution of social entities (per OSN, per social instance, or per influence group);
- Ranking differences between social entities (per social instance);
- Overlap of social entities (per OSNs);
- Number of social entities (per post);
- Correlation between OSN activity and social influence.
5.2. Assessment of the Experimental Results
5.2.1. Investigating the Behavioural Patterns of the Social Individuals
5.2.2. Investigating the Behavioural Patterns of the OSN Influence Groups
6. Identifying Social-Influence-Stimulated Behavioural Patterns in OSNs
7. Conclusions and Future Work
- Social individuals do not behave uniformly in all OSNs but, via their social instances, display multiple behavioural patterns.
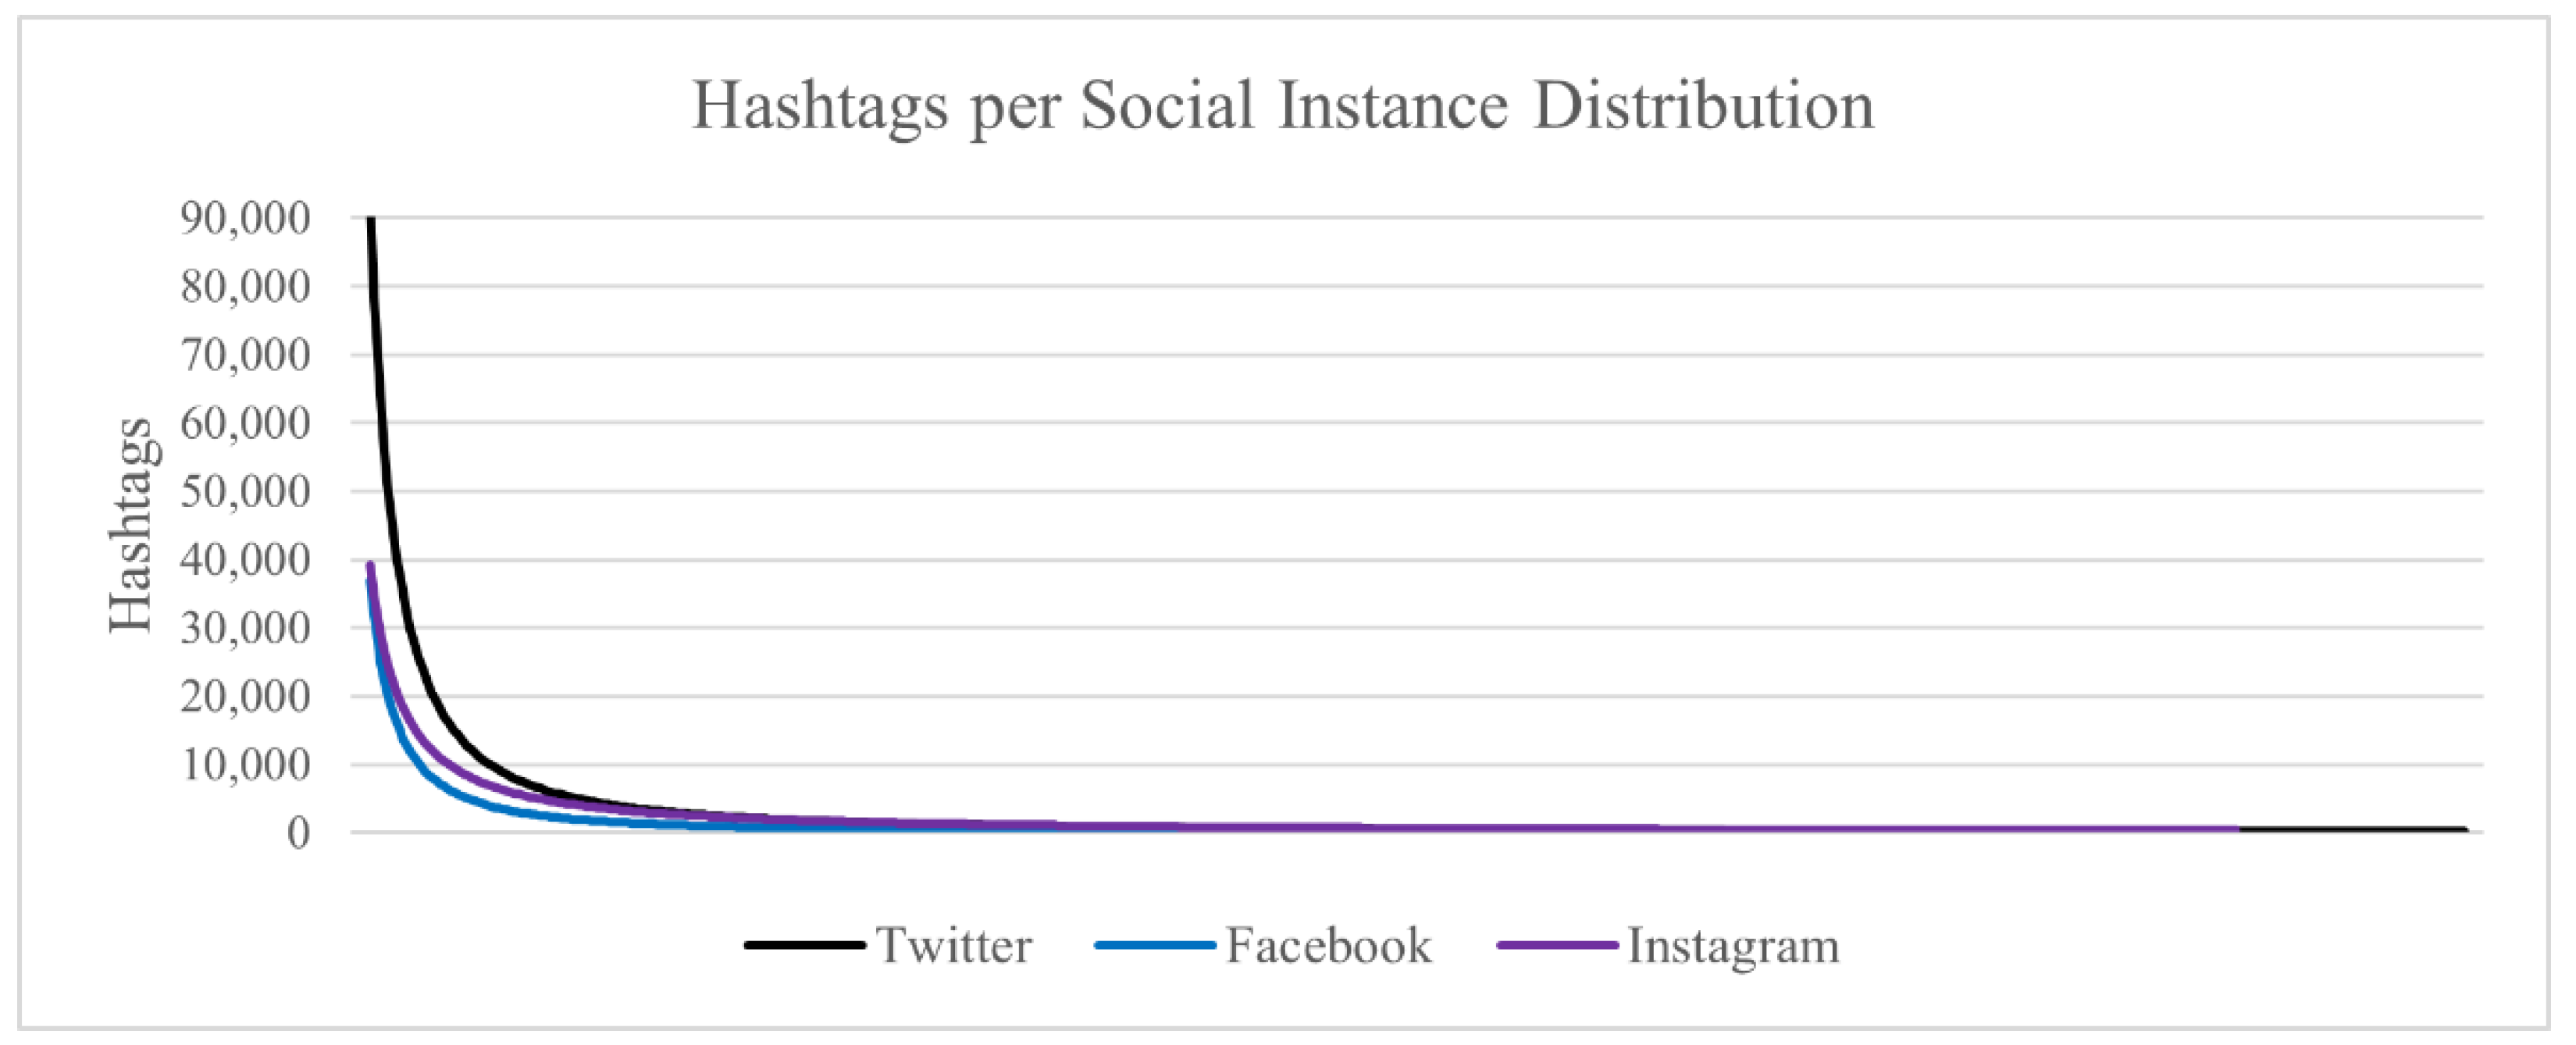
- In the case of all three OSNs, a typical power law distributions occurs in regard to the dissemination of the social entities of hashtags, links, domains, and multimedia content. This means that there are very few such entities with a substantial number of occurrences, and most of them appear very sparsely.
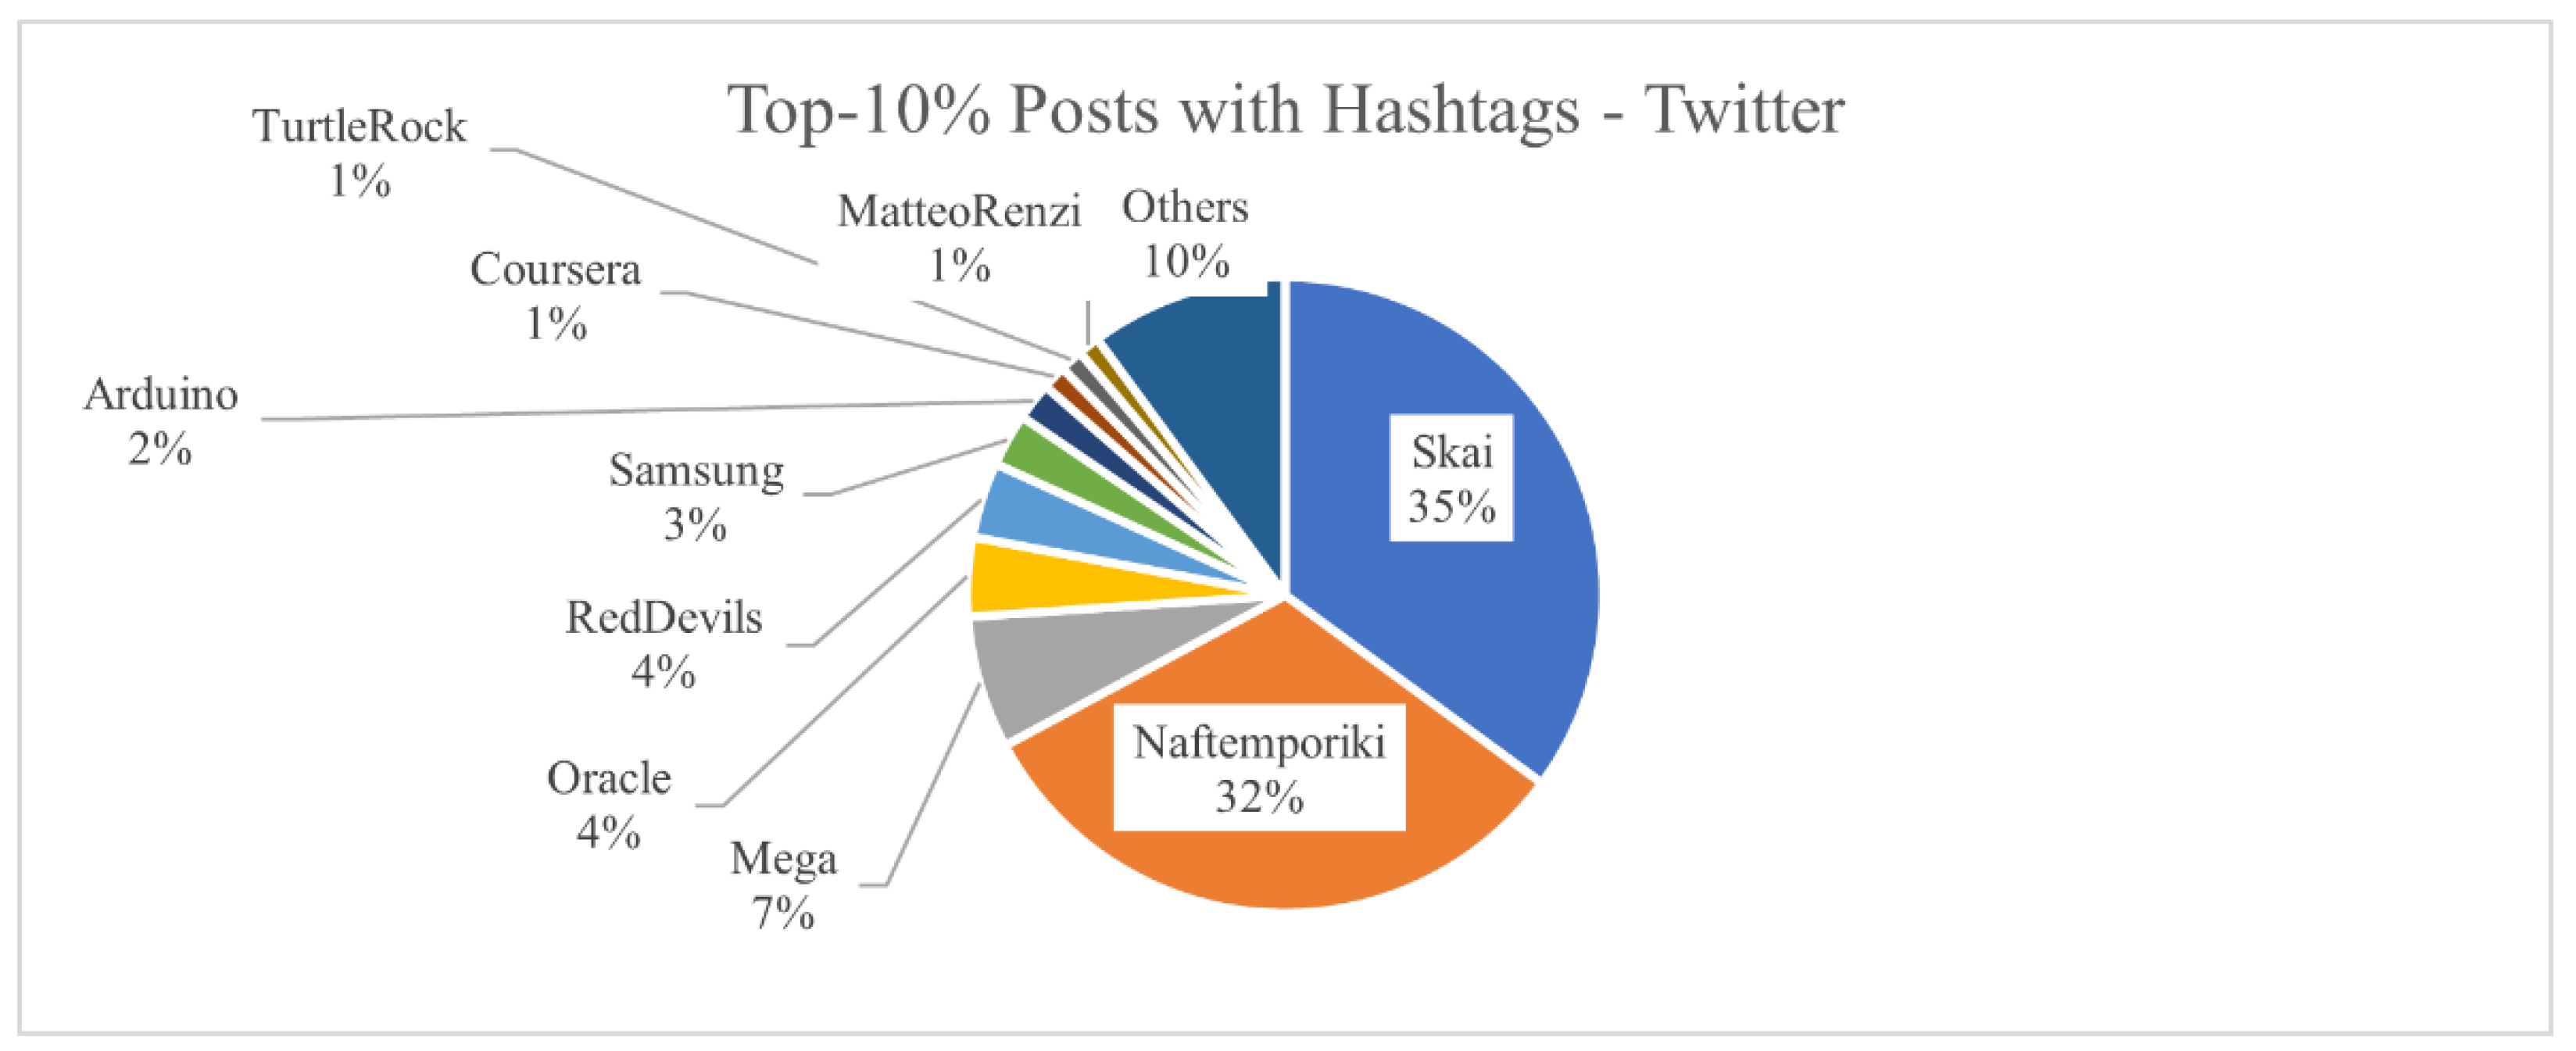
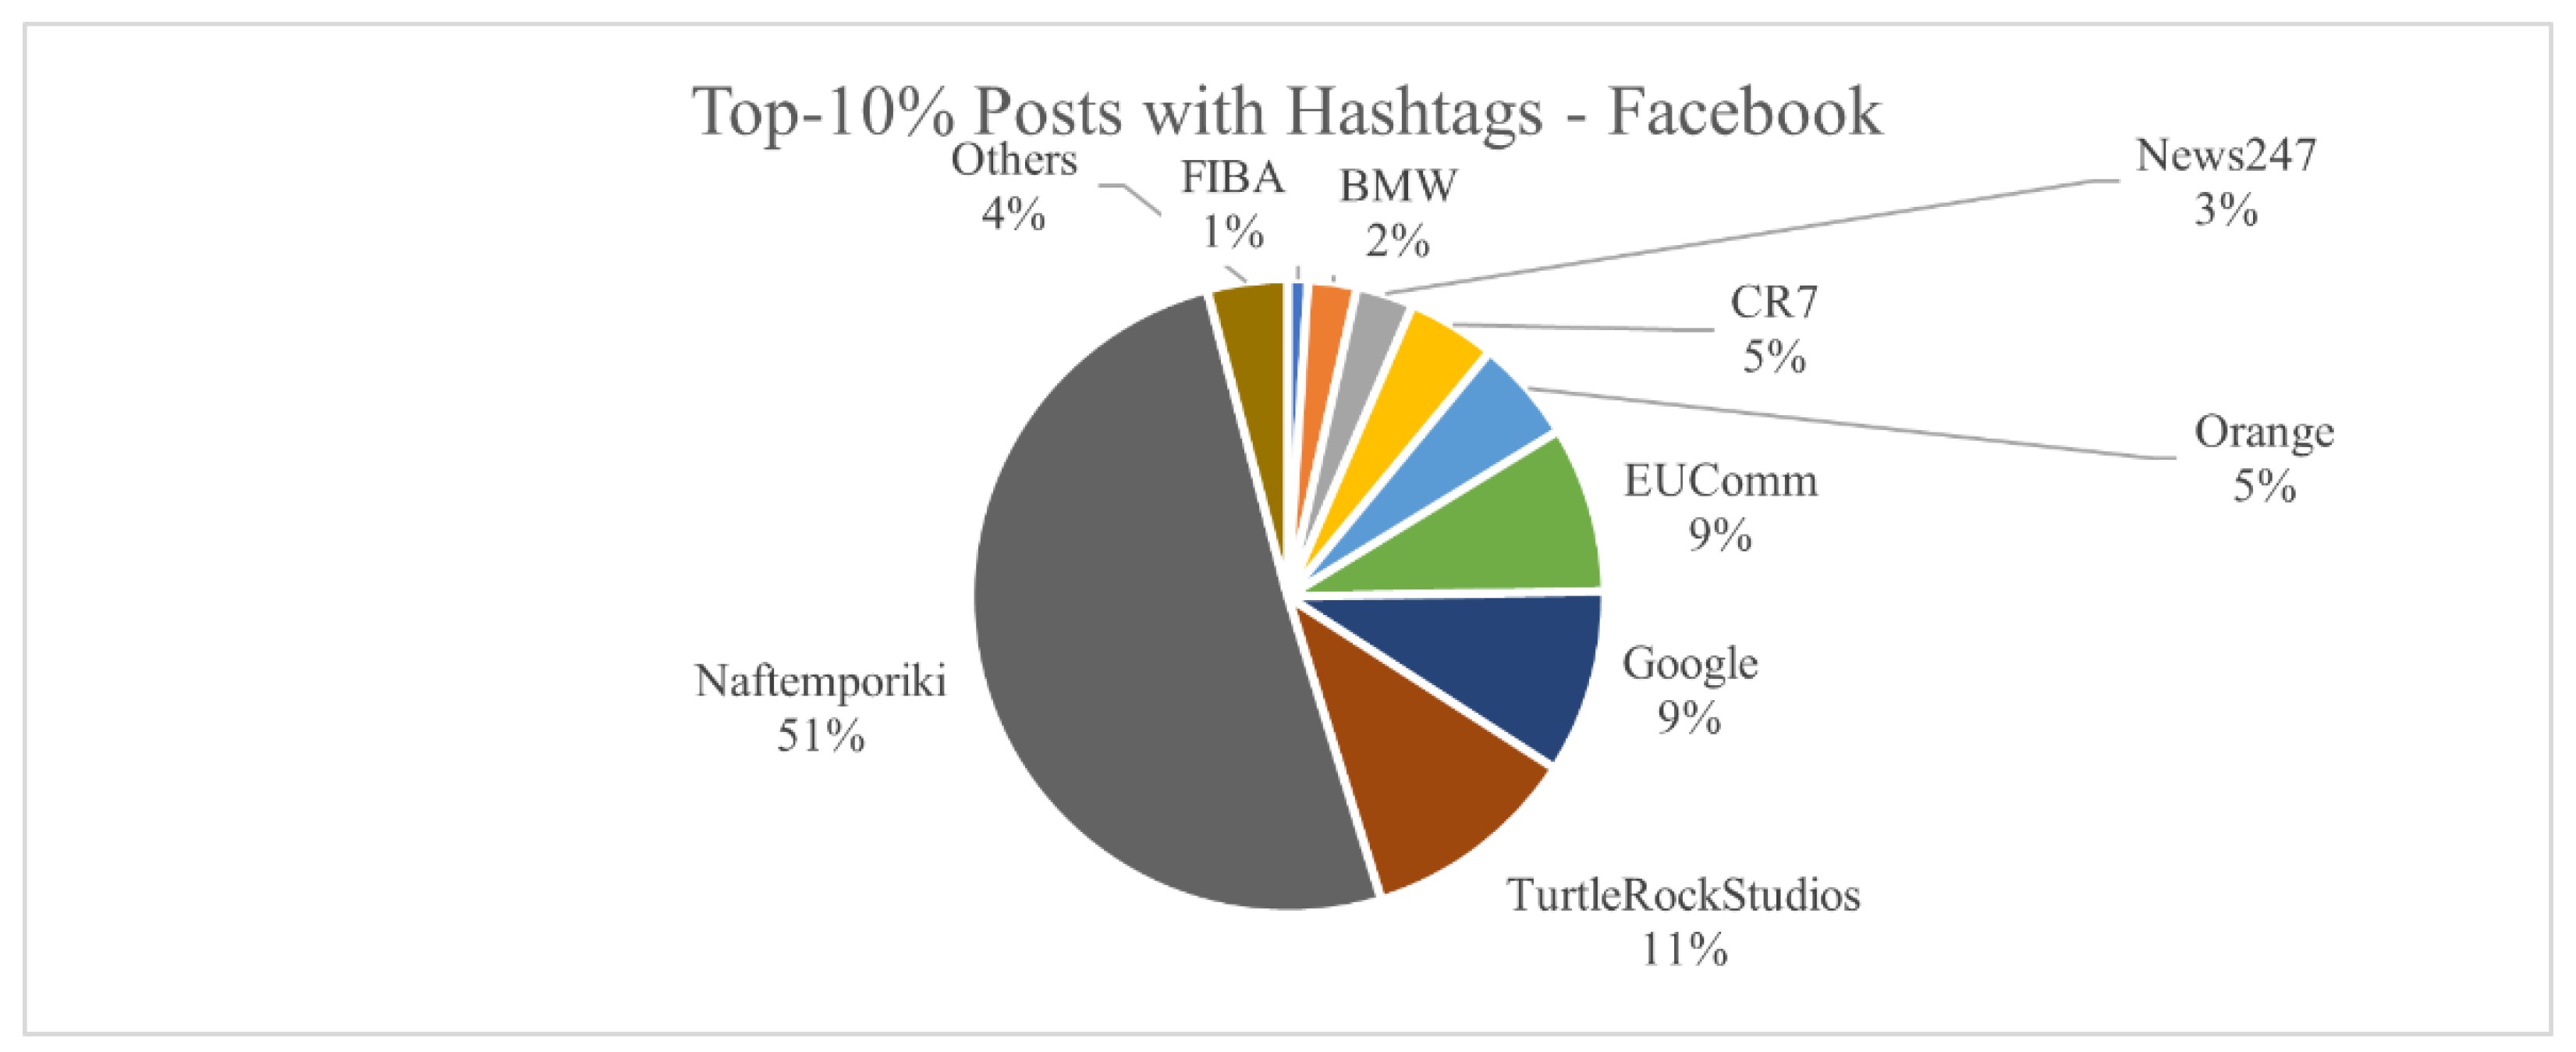
- On Twitter, a wider variety of hashtags are created and shared, whereas on Facebook, the reuse of the same hashtags is more frequent.
- The use of hashtags on Facebook posts is very low per user, while the same user includes on average almost three times more hashtags on Twitter and 12 times more on Instagram.
- The users react more to Instagram posts via engaging in public conversations or marking them with a “Like” compared to Twitter or Facebook posts.
- Facebook posts include more hyperlinks compared to Twitter posts authored by the same individuals.
- The use of multimedia content in Twitter posts is very low, whereas the same individuals include on average almost two times more such content on Facebook and five times more on Instagram.
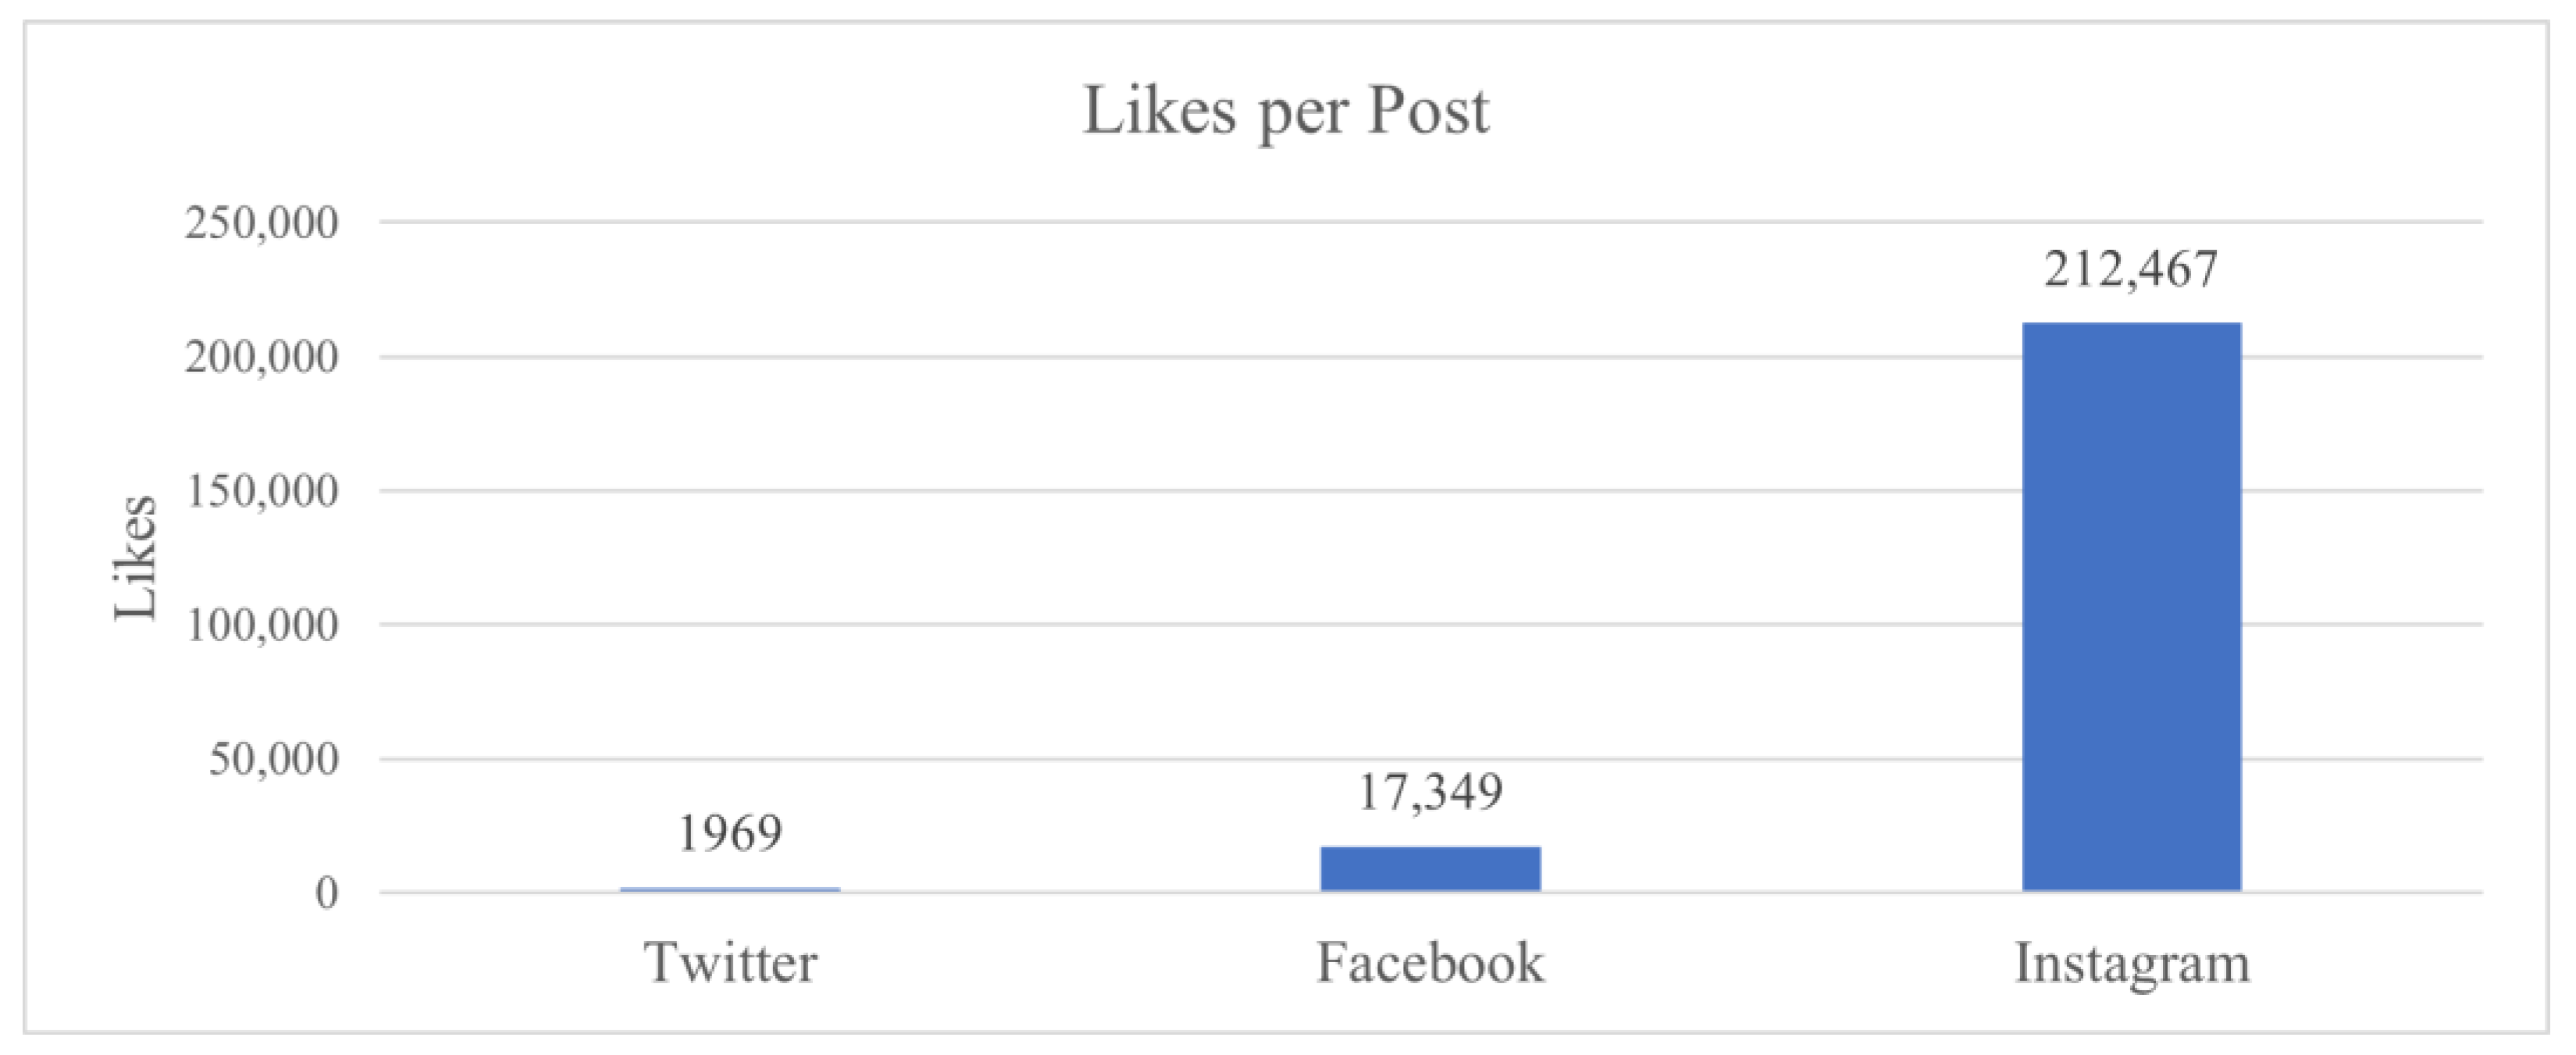
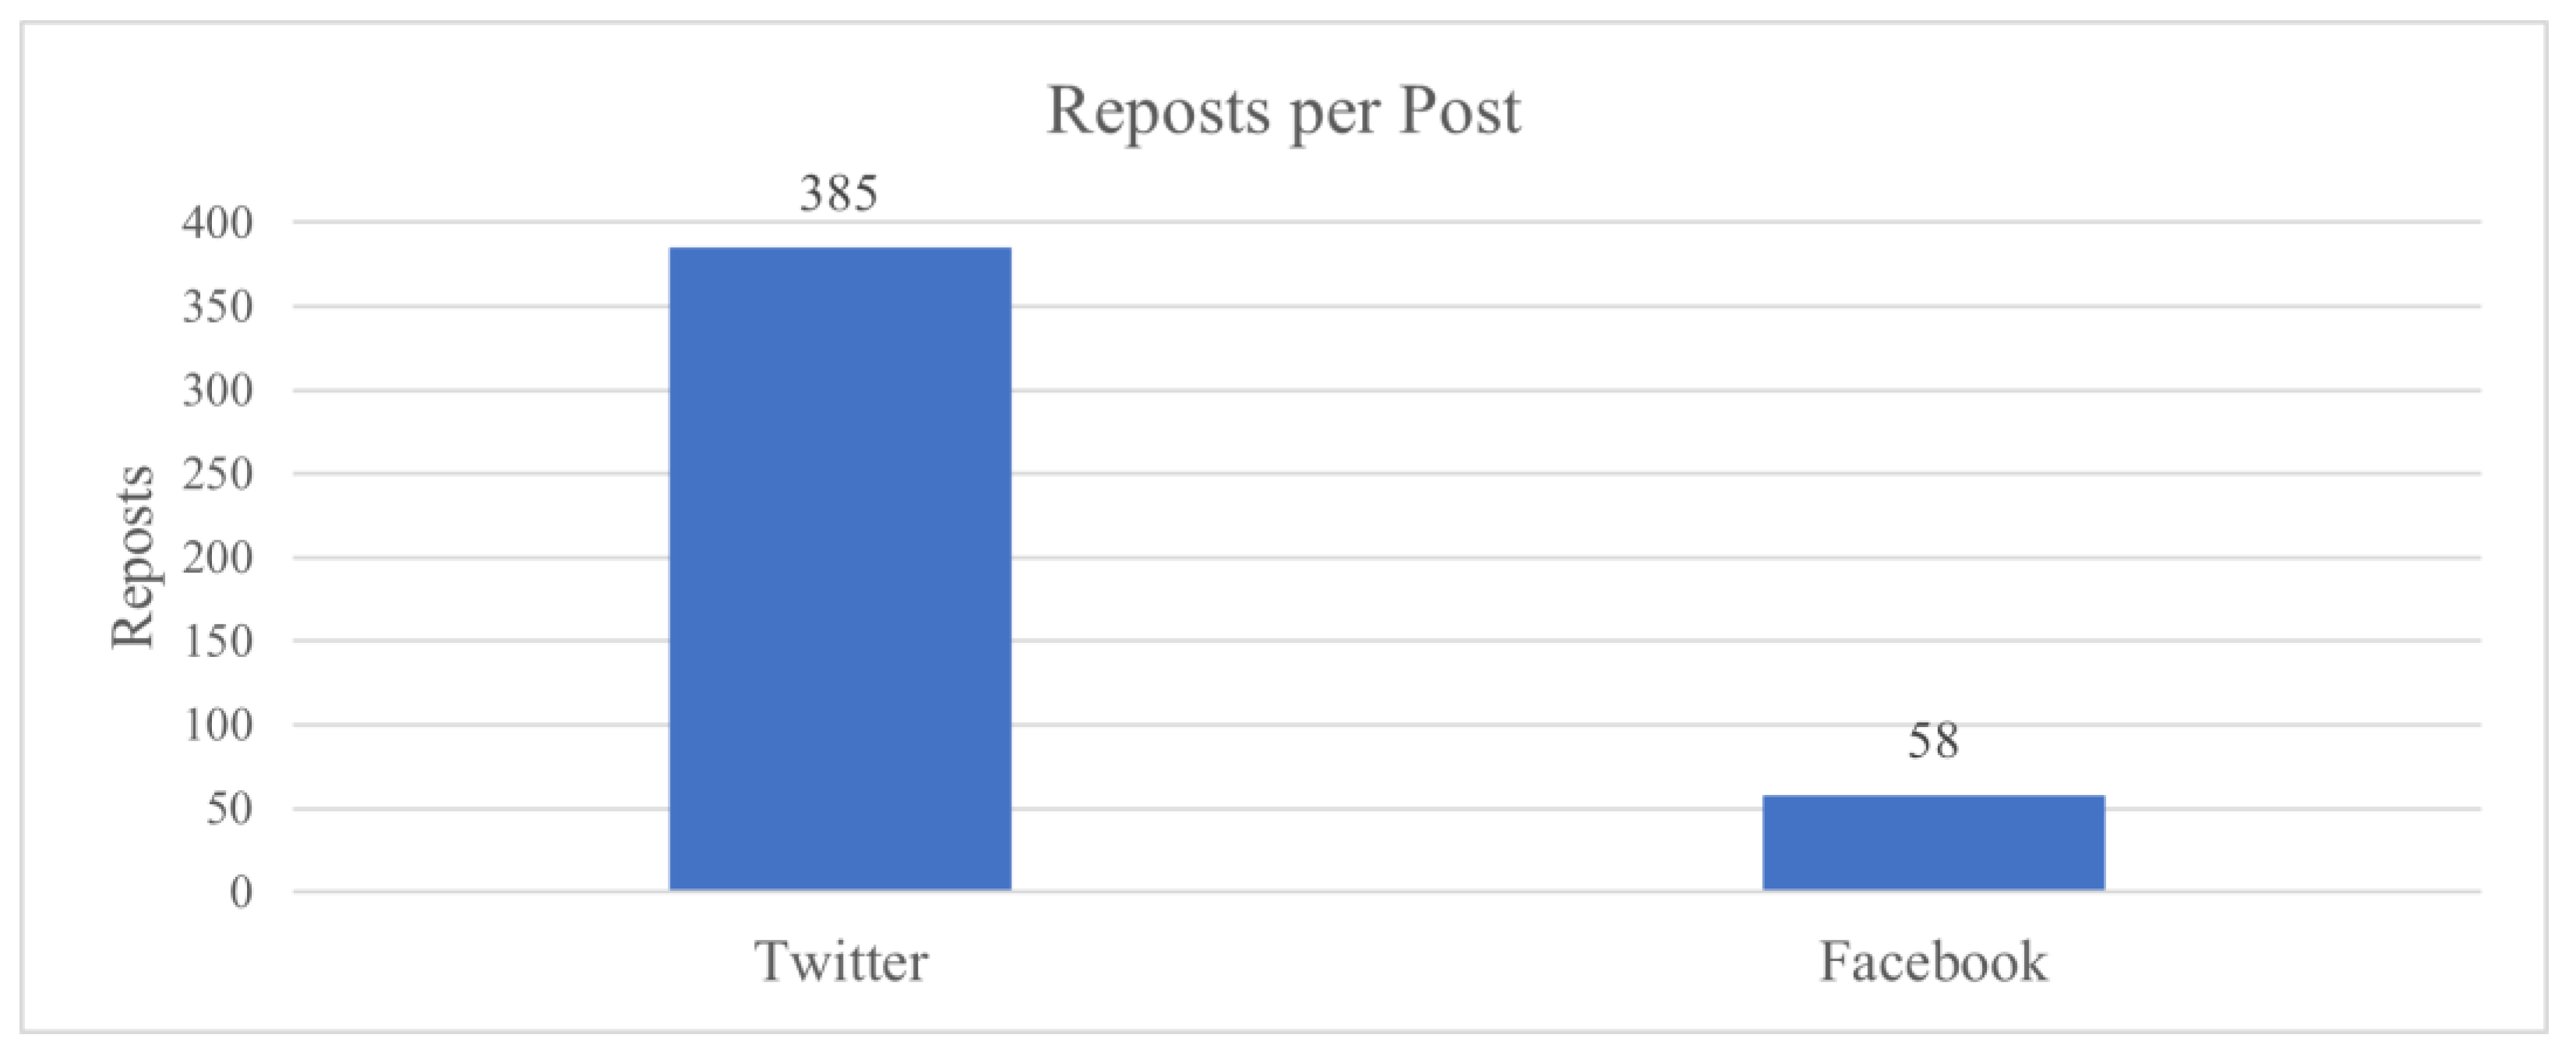
- Regarding social acceptance, on Instagram it is considerably easier to receive positive feedback through “Likes” compared to Facebook (placed second) and Twitter (placed third). However, the same social individuals’ posts are reposted more than six times more frequently on Twitter compared to Facebook. Instagram does not support reposting.
- The influence groups do not receive uniform social acceptance in all three OSNs, and this acceptance is affected by, and closely related to, the social individuals’ exerted influence.
- The non-influencers participate in public discussions more often on Twitter rather than the other two OSNs.
- Higher social influence leads to the stimulation of a greater number of public conversations.
- The “influencers” display a more consistent usage of a single OSN compared to the least influential groups.
- The “influencers” receive more social acceptance and tend to avoid the use of hashtags compared to the other influence groups.
Author Contributions
Funding
Institutional Review Board Statement
Informed Consent Statement
Data Availability Statement
Conflicts of Interest
References
- Breslin, J.G.; Decker, S.; Harth, A.; Bojars, U. SIOC: An approach to connect web-based communities. Int. J. Web Based Communities IJWBC 2006, 2, 133–142. [Google Scholar] [CrossRef]
- Zhang, Y.; Li, G.; Chu, L.; Wang, S.; Zhang, W.; Huang, Q. Cross-media topic detection: A multi-modality fusion framework. In Proceedings of the 2013 IEEE International Conference on Multimedia and Expo (ICME), San Jose, CA, USA, 15–19 July 2013; pp. 1–6. [Google Scholar] [CrossRef]
- Fang, M.; Li, Y.; Hu, Y.; Mao, S.; Shi, P. A Unified Semantic Model for Cross-Media Events Analysis in Online Social Networks. IEEE Access 2019, 7, 32166–32182. [Google Scholar] [CrossRef]
- Mander, J.; Kavanagh, D.; Buckle, C. GlobalWebIndex’s Flagship Report on the Latest Trends in Social Media. GlobalWebIndex. 2020. Available online: https://www.gwi.com/hubfs/Downloads/2019%20Q2-Q3%20Social%20Report.pdf (accessed on 20 August 2022).
- Golbeck, J.; Rothstein, M. Linking Social Networks on the Web with FOAF: A Semantic Web Case. In Proceedings of the 23rd AAAI Conference on Artificial Intelligence, AAAI Press, Chicago, IL, USA, 13–17 July 2008; pp. 1138–1143. [Google Scholar]
- Rowe, M. Interlinking distributed social graphs. In Proceedings of the WWW2009 Workshop on Linked Data on the Web, LDOW 2009, Madrid, Spain, 20 April 2009. [Google Scholar]
- Bennacer, N.; Nana Jipmo, C.; Penta, A.; Quercini, G. Matching User Profiles Across Social Networks. In Advanced Information Systems Engineering, Proceedings of the CAiSE 2014, Thessaloniki, Greece, 16–20 June 2014; Lecture Notes in Computer Science; Jarke, M., Mylopoulos, J., Quix, C., Rolland, C., Manolopoulos, Y., Mouratidis, H., Horkoff, J., Eds.; Springer: Cham, Switzerland, 2014; Volume 8484, pp. 424–438. [Google Scholar] [CrossRef]
- Panchenko, A.; Babaev, D.; Obiedkov, S. Large-Scale Parallel Matching of Social Network Profiles. In Analysis of Images, Social Networks and Texts, Proceedings of the 4th International Conference, AIST 2015, Yekaterinburg, Russia, 9–11 April 2015; Communications in Computer and Information Science; Khachay, M., Konstantinova, N., Panchenko, A., Ignatov, D., Labunets, V., Eds.; Springer: Cham, Switzerland, 2015; Volume 542, pp. 275–285. [Google Scholar] [CrossRef]
- Halimi, A.; Ayday, E. Profile Matching Across Online Social Networks. In Information and Communications Security, Proceedings of the 22nd International Conference, ICICS 2020, Copenhagen, Denmark, 24–26 August 2020; Lecture Notes in Computer Science; Meng, W., Gollmann, D., Jensen, C.D., Zhou, J., Eds.; Springer: Cham, Switzerland, 2020; Volume 12282, pp. 54–70. [Google Scholar] [CrossRef]
- Diao, M.; Zhang, Z.; Su, S.; Gao, S.; Cao, H. UPON: User Profile Transferring across Networks. In Proceedings of the 29th ACM International Conference on Information & Knowledge Management (CIKM ‘20), Virtual, 19–23 October 2020; Association for Computing Machinery: New York, NY, USA, 2020; pp. 265–274. [Google Scholar] [CrossRef]
- Malhotra, A.; Totti, L.; Meira, W., Jr.; Kumaraguru, P.; Almeida, V. Studying User Footprints in Different Online Social Networks. In Proceeding of the 2012 IEEE/ACM International Conference on Advances in Social Networks Analysis and Mining, Istanbul, Turkey, 26–29 August 2012; pp. 1065–1070. [Google Scholar] [CrossRef]
- Moshkin, V. The approach to building a graph knowledge base using social media data. In Proceedings of the 2020 IEEE 14th International Conference on Application of Information and Communication Technologies (AICT), Tashkent, Uzbekistan, 7–9 October 2020; pp. 1–6. [Google Scholar] [CrossRef]
- Hiba, S.; Taieb, H.; Ali, M.; Mohamed, B.A. SNOWL model: Social networks unification-based semantic data integration. Knowl. Inf. Syst. 2020, 62, 4297–4336. [Google Scholar] [CrossRef]
- Thelwall, M.; Vis, F. Gender and image sharing on Facebook, Twitter, Instagram, Snapchat and WhatsApp in the UK: Hobbying alone or filtering for friends? Aslib J. Inf. Manag. 2017, 69, 702–720. [Google Scholar] [CrossRef]
- Phua, J.; Jin, S.V.; Kim, J. Uses and gratifications of social networking sites for bridging and bonding social capital: A comparison of Facebook, Twitter, Instagram, and Snapchat. Comput. Hum. Behav. 2017, 72, 115–122. [Google Scholar] [CrossRef]
- Shane-Simpson, C.; Manago, A.; Gaggi, N.; Gillespie-Lynch, K. Why do college students prefer Facebook, Twitter, or Instagram? Site affordances, tensions between privacy and self-expression, and implications for social capital. Comput. Hum. Behav. 2018, 86, 276–288. [Google Scholar] [CrossRef]
- Arora, A.; Bansal, S.; Kandpal, C.; Aswani, R.; Dwivedi, Y. Measuring social media influencer index- insights from facebook, Twitter and Instagram. J. Retail. Consum. Serv. 2019, 49, 86–101. [Google Scholar] [CrossRef]
- Ye, S.; Ho, K.K.W.; Zerbe, A. The effects of social media usage on loneliness and well-being: Analysing friendship connections of Facebook, Twitter and Instagram. Inf. Discov. Deliv. 2021, 49, 136–150. [Google Scholar] [CrossRef]
- Delle, F.A.; Clayton, R.B.; Jordan Jackson, F.F.; Lee, J. Facebook, Twitter, and Instagram: Simultaneously examining the association between three social networking sites and relationship stress and satisfaction. Psychol. Pop. Media, 2022; online ahead of print. [Google Scholar] [CrossRef]
- Chia-chen, Y.; Lee, Y. Interactants and activities on Facebook, Instagram, and Twitter: Associations between social media use and social adjustment to college. Appl. Dev. Sci. 2020, 24, 62–78. [Google Scholar] [CrossRef]
- Boulianne, S.; Larsson, A.O. Engagement with candidate posts on Twitter, Instagram, and Facebook during the 2019 election. New Media Soc. 2021; online ahead of print. [Google Scholar] [CrossRef]
- Razis, G.; Anagnostopoulos, I. InfluenceTracker: Rating the impact of a Twitter account. In Artificial Intelligence Applications and Innovations, Proceedings of the Artificial Intelligence Applications and Innovations Workshops (AIAI 2014), Rhodes, Greece, 19–21 September 2014; IFIP Advances in Information and Communication Technology; Iliadis, L., Maglogiannis, I., Papadopoulos, H., Sioutas, S., Makris, C., Eds.; Springer: Berlin/Heidelberg, Germany, 2014; Volume 437, pp. 184–195. [Google Scholar] [CrossRef]
- Razis, G.; Anagnostopoulos, I. Semantifying Twitter: The Influence Tracker Ontology. In Proceedings of the 9th International Workshop on Semantic and Social Media Adaptation and Personalization (SMAP), Corfu, Greece, 6–7 November 2014; pp. 98–103. [Google Scholar] [CrossRef]
- Hirsch, J.E. An index to quantify an individual’s scientific research output. Proc. Natl. Acad. Sci. USA 2005, 102, 16569–16572. [Google Scholar] [CrossRef] [PubMed]
- Razis, G.; Theofilou, G.; Anagnostopoulos, I. Latent Twitter Image Information for Social Analytics. Information 2021, 12, 49. [Google Scholar] [CrossRef]


| OSN Alias | Influence Metric Score | OSN Alias | Influence Metric Score | OSN Alias | Influence Metric Score |
|---|---|---|---|---|---|
| TurtleRock | 31.26 | Liverpool | 41.34 | Airbnb | 42.01 |
| Sport24 | 42.62 | Dell | 43.06 | Oreo | 43.3 |
| Coursera | 43.56 | FIBA | 44.19 | Mega | 44.34 |
| Orange | 44.39 | LEVIS | 44.48 | Oracle | 44.64 |
| Ellinofreneia | 45.07 | Arduino | 46.42 | Wikipedia | 46.52 |
| TurtleRock | 31.26 | Liverpool | 41.34 | Airbnb | 42.01 |
| OSN Alias | Influence Metric Score | OSN Alias | Influence Metric Score | OSN Alias | Influence Metric Score |
|---|---|---|---|---|---|
| PCMag | 51.61 | CocaCola | 52.33 | Ford | 52.45 |
| JamieOliver | 53.09 | Nike | 53.25 | Kathimerini | 53.75 |
| RedBull | 53.62 | Skai | 54.34 | TimOreiily | 54.36 |
| LKing | 55.07 | News247 | 55.45 | Yahoo | 55.93 |
| Dropbox | 57.18 | PIglesias | 57.45 | MLS | 57.72 |
| Bulls | 58.09 | Naftemporiki | 59.04 | BMW | 59.07 |
| Microsoft | 59.38 | MatteoRenzi | 59.45 | EUComm | 61.1 |
| Marvel | 61.29 | OnePlus | 61.6 | AmericanAir | 62.14 |
| NRJ | 62.52 | FTimes | 63.27 | HuffPost | 63.3 |
| McDonalds | 63.74 | BBCSport | 64.16 | - | |
| OSN Alias | Influence Metric Score | OSN Alias | Influence Metric Score | OSN Alias | Influence Metric Score |
|---|---|---|---|---|---|
| Starbucks | 66.3 | VSecret | 66.98 | Samsung | 71.03 |
| CR7 | 71.95 | Chelsea | 72.06 | 72.2 | |
| RedDevils | 72.31 | Barca | 72.34 | 9GAG | 72.56 |
| WhiteHouse | 73.01 | Time | 75.59 | CNN | 78.78 |
| KatyPerry | 81.78 | - | |||
| Social Characteristic Type | Metric (Average Number of) | OSN | ||
|---|---|---|---|---|
| Entities | Hashtags per Post (Figure 11) | 2nd | 3rd | 1st |
| Links per Post (Figure 13) | 2nd | 1st | N/A | |
| Media per Post (Figure 16) | 3rd | 2nd | 1st | |
| Acceptance | Likes per Post (Figure 18) | 3rd | 2nd | 1st |
| Reposts per Post (Figure 19) | 1st | 2nd | N/A | |
| Conversation | Comments per Post (Figure 20) | 3rd | 2nd | 1st |
| Ranking Points | 4 | 6 | 6 | |
| Social Characteristic Type | Metric (Average Number of) | Twitter Social Influence Group | ||
|---|---|---|---|---|
| Medium | High | Very High | ||
| Entities | Hashtags per Post (Figure 21) | 2nd | 1st | 3rd |
| Links per Post (Figure 25) | 1st | 2nd | 3rd | |
| Media per Post (Figure 26) | 2nd | 3rd | 1st | |
| Acceptance | Likes per Post (Figure 27) | 2nd | 3rd | 1st |
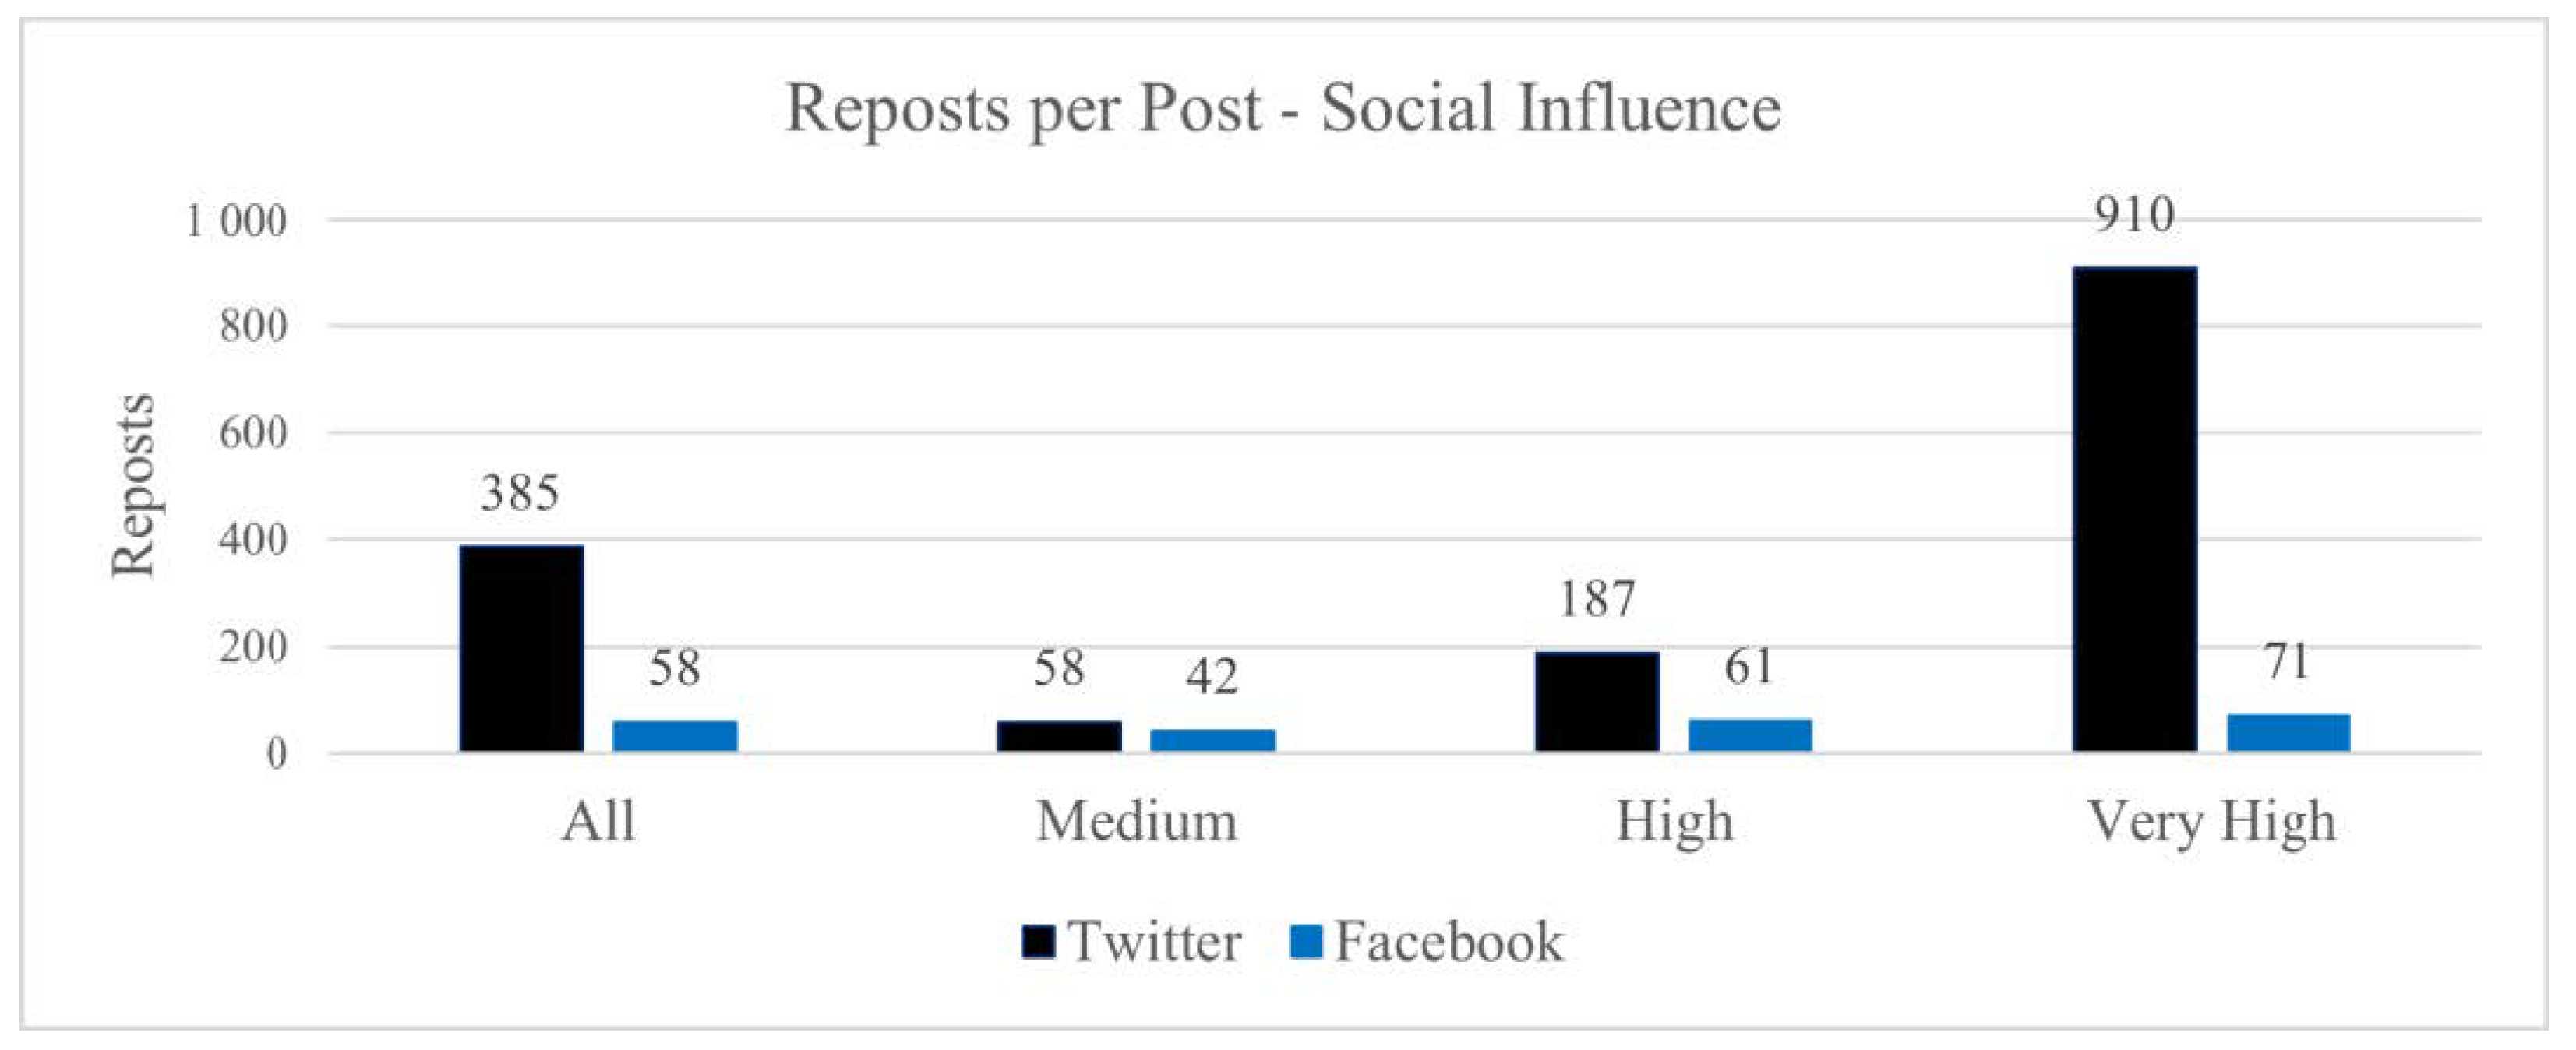
| Reposts per Post (Figure 28) | 3rd | 2nd | 1st | |
| Conversation | Comments per Post (Figure 29) | 3rd | 2nd | 1st |
| Ranking Points | 5 | 5 | 8 | |
| Social Characteristic Type | Metric (Average Number of) | Facebook Social Influence Group | ||
|---|---|---|---|---|
| Medium | High | Very High | ||
| Entities | Hashtags per Post (Figure 21) | 2nd | 1st | 3rd |
| Links per Post (Figure 25) | 2nd | 3rd | 1st | |
| Media per Post (Figure 26) | 2nd | 3rd | 1st | |
| Acceptance | Likes per Post (Figure 27) | 3rd | 2nd | 1st |
| Reposts per Post (Figure 28) | 3rd | 2nd | 1st | |
| Conversation | Comments per Post (Figure 29) | 3rd | 2nd | 1st |
| Ranking Points | 3 | 5 | 10 | |
| Social Characteristic Type | Metric (Average Number of) | Instagram Social Influence Group | ||
|---|---|---|---|---|
| Medium | High | Very High | ||
| Entities | Hashtags per Post (Figure 21) | 1st | 2nd | 3rd |
| Links per Post | N/A | N/A | N/A | |
| Media per Post (Figure 26) | 3rd | 2nd | 1st | |
| Acceptance | Likes per Post (Figure 27) | 3rd | 2nd | 1st |
| Reposts per Post | N/A | N/A | N/A | |
| Conversation | Comments per Post (Figure 29) | 3rd | 2nd | 1st |
| Ranking Points | 2 | 4 | 6 | |
| Social Characteristic Type | Metric (Average Number of) | Social Influence Group | ||
|---|---|---|---|---|
| Medium | High | Very High | ||
| Entities | Hashtags per Post | 2nd | 1st | 3rd |
| Links per Post | N/A | N/A | N/A | |
| Media per Post | 2nd | 3rd | 1st | |
| Acceptance | Likes per Post | 3rd | 2nd | 1st |
| Reposts per Post | 3rd | 2nd | 1st | |
| Conversation | Comments per Post | 3rd | 2nd | 1st |
| Ranking Points | 2 | 5 | 8 | |
Publisher’s Note: MDPI stays neutral with regard to jurisdictional claims in published maps and institutional affiliations. |
© 2022 by the authors. Licensee MDPI, Basel, Switzerland. This article is an open access article distributed under the terms and conditions of the Creative Commons Attribution (CC BY) license (https://creativecommons.org/licenses/by/4.0/).
Share and Cite
Razis, G.; Georgilas, S.; Haralabopoulos, G.; Anagnostopoulos, I. User Analytics in Online Social Networks: Evolving from Social Instances to Social Individuals. Computers 2022, 11, 149. https://doi.org/10.3390/computers11100149
Razis G, Georgilas S, Haralabopoulos G, Anagnostopoulos I. User Analytics in Online Social Networks: Evolving from Social Instances to Social Individuals. Computers. 2022; 11(10):149. https://doi.org/10.3390/computers11100149
Chicago/Turabian StyleRazis, Gerasimos, Stylianos Georgilas, Giannis Haralabopoulos, and Ioannis Anagnostopoulos. 2022. "User Analytics in Online Social Networks: Evolving from Social Instances to Social Individuals" Computers 11, no. 10: 149. https://doi.org/10.3390/computers11100149
APA StyleRazis, G., Georgilas, S., Haralabopoulos, G., & Anagnostopoulos, I. (2022). User Analytics in Online Social Networks: Evolving from Social Instances to Social Individuals. Computers, 11(10), 149. https://doi.org/10.3390/computers11100149