
A Brief Review of Some Interesting Mars Rover Image Enhancement Projects


Abstract
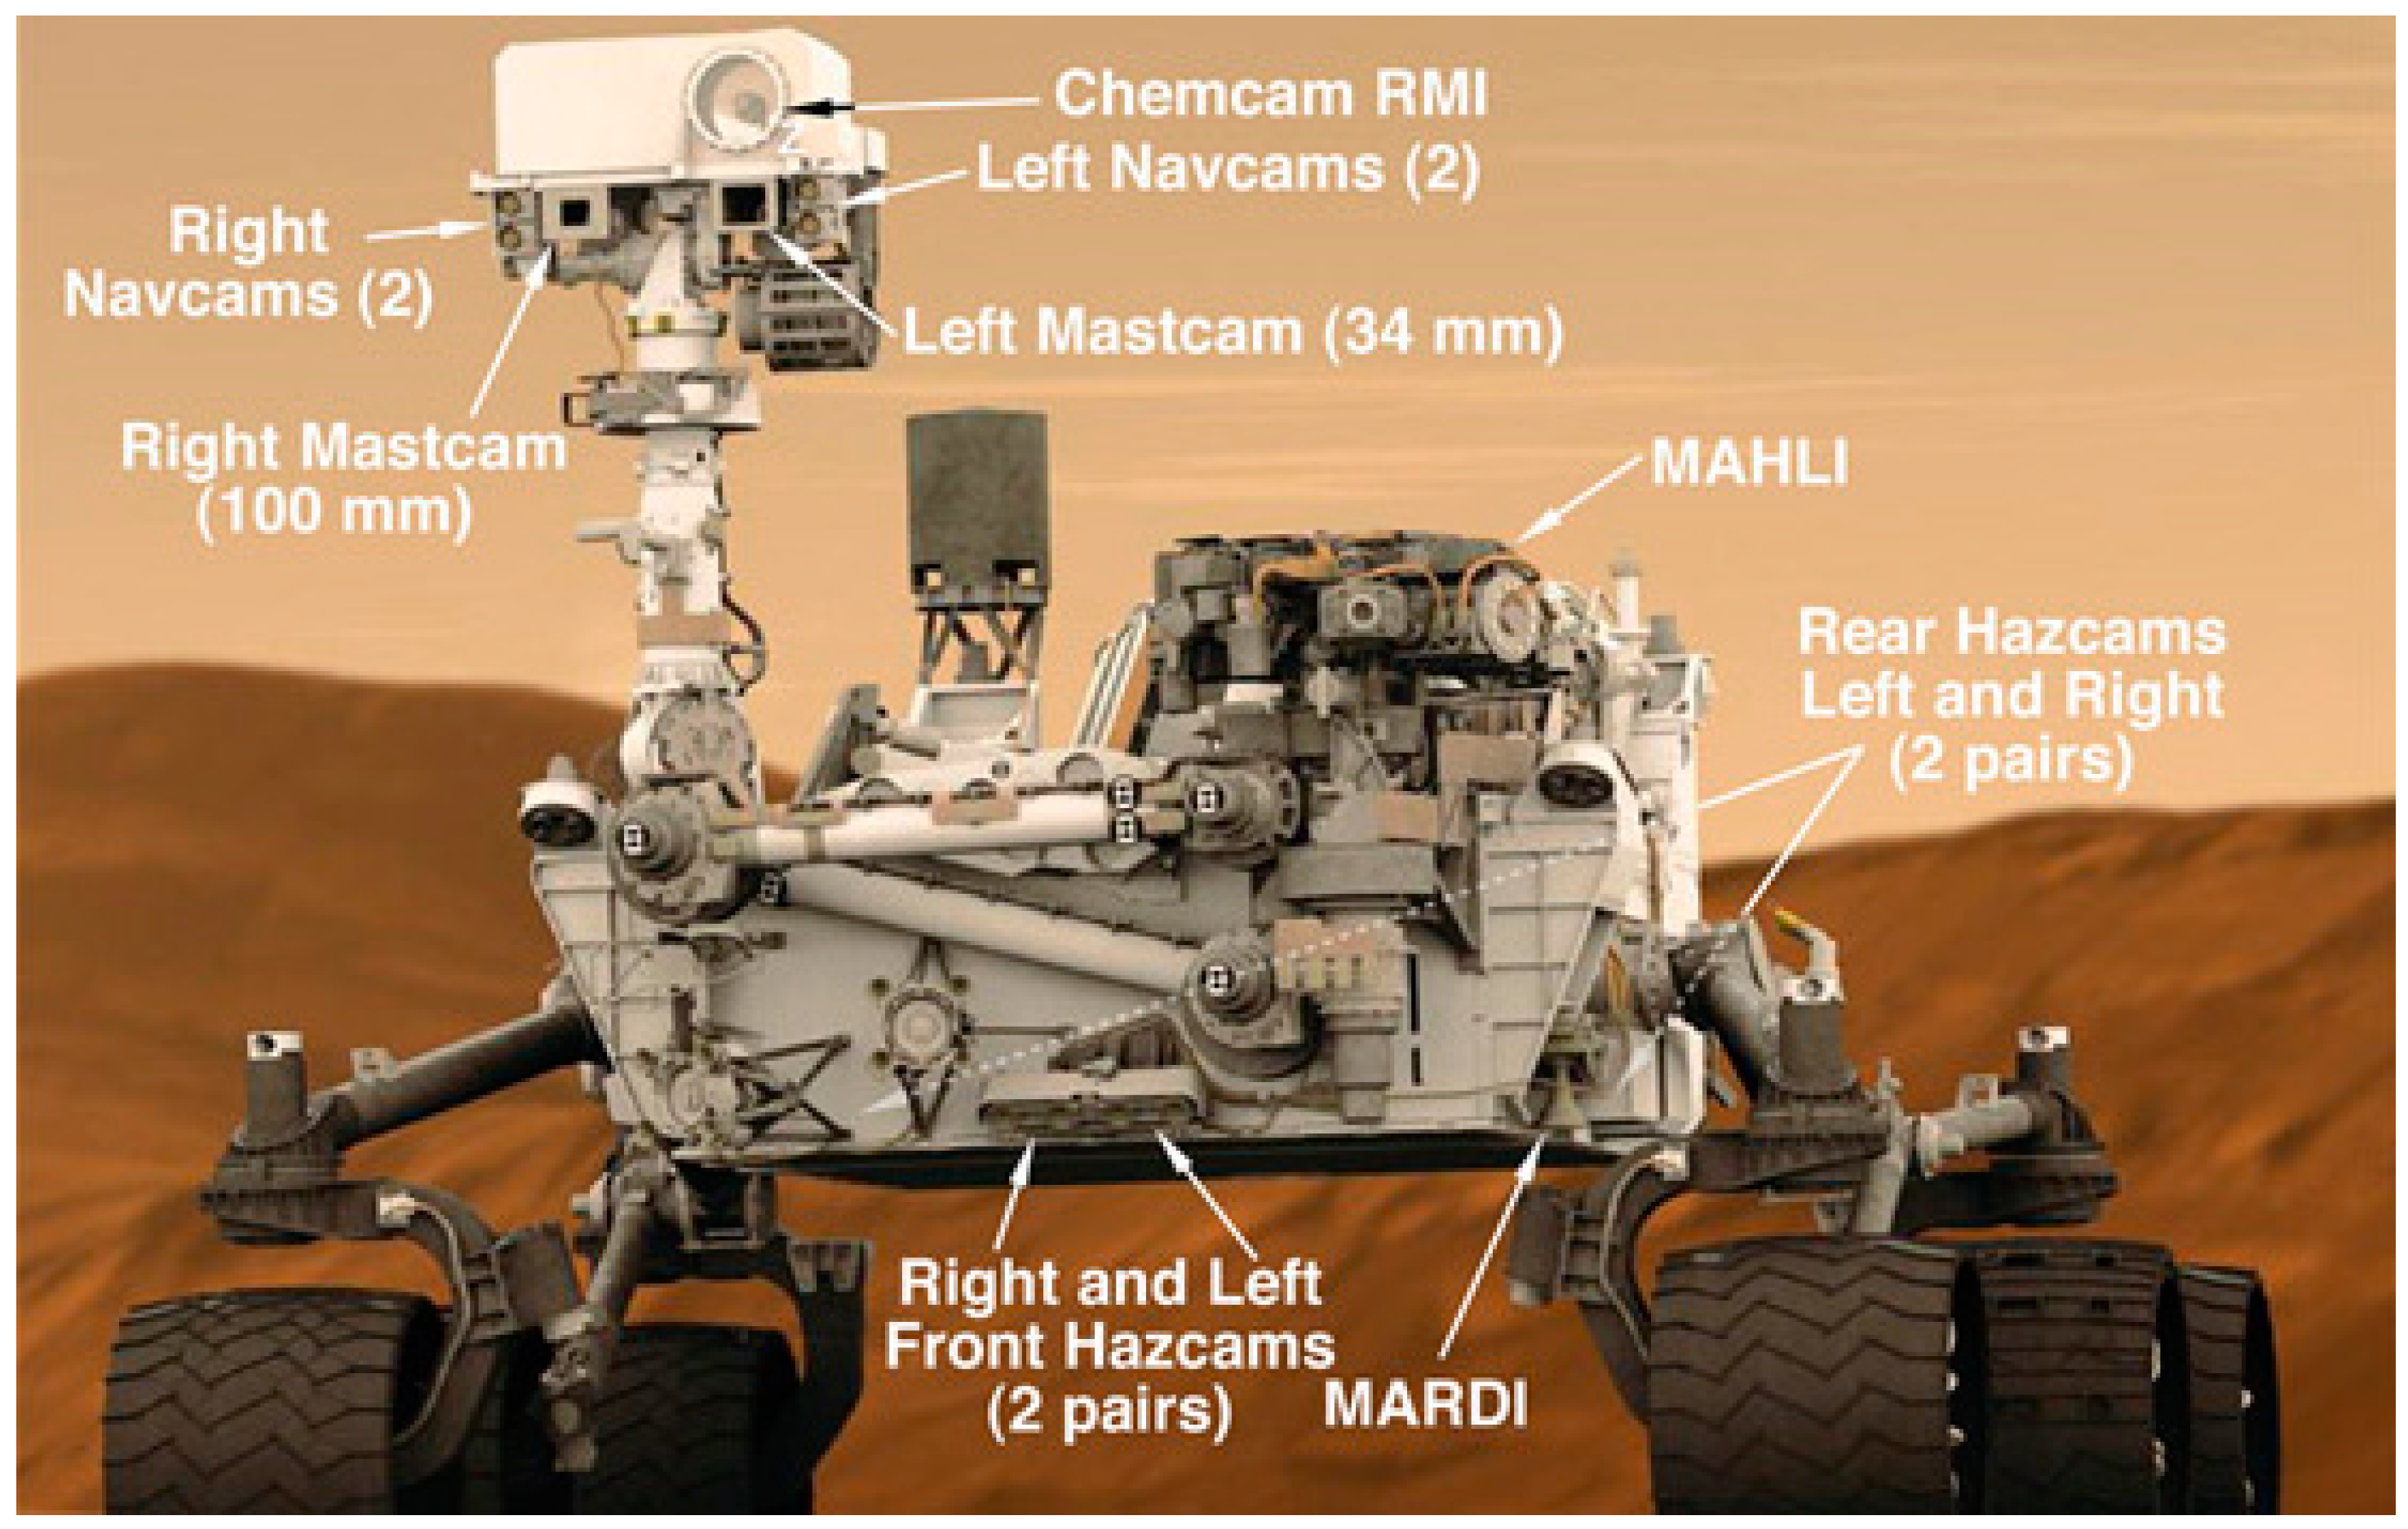
:1. Introduction
2. Perceptually Lossless Compression for Mastcam Images
- Comparison of different approachesFor the nine-band multispectral Mastcam images, we compared several approaches (principal component analysis (PCA), split band (SB), video, and two-step). It was observed that the SB approach performed better than others using actual Mastcam images.
- Codec comparisonsIn each approach, five codecs were evaluated. In terms of those objective metrics (HVS and HVSm), Daala yielded the best performance amongst the various codecs. At ten to one compression, more than 5 dBs of improvement was observed by using Daala as compared to JPEG, which is the default codec by NASA.
- Computational complexityDaala uses discrete cosine transform (DCT) and is more amenable for parallel processing. J2K is based on wavelet which requires the whole image as input. Although X265 and X264 are also based on DCT, they did not perform well at ten to one compression in our experiments.
- Subjective comparisonsUsing visual inspections on RGB images, it was observed that at 10:1 and 20:1 compression, all codecs have almost no loss. However, at higher compression ratios such as 40 to 1 compression, it was observed that there are noticeable color distortions and block artifacts in JPEG, X264, and X265. In contrast, we still observe good compression performance in Daala and J2K even at 40:1 compression.
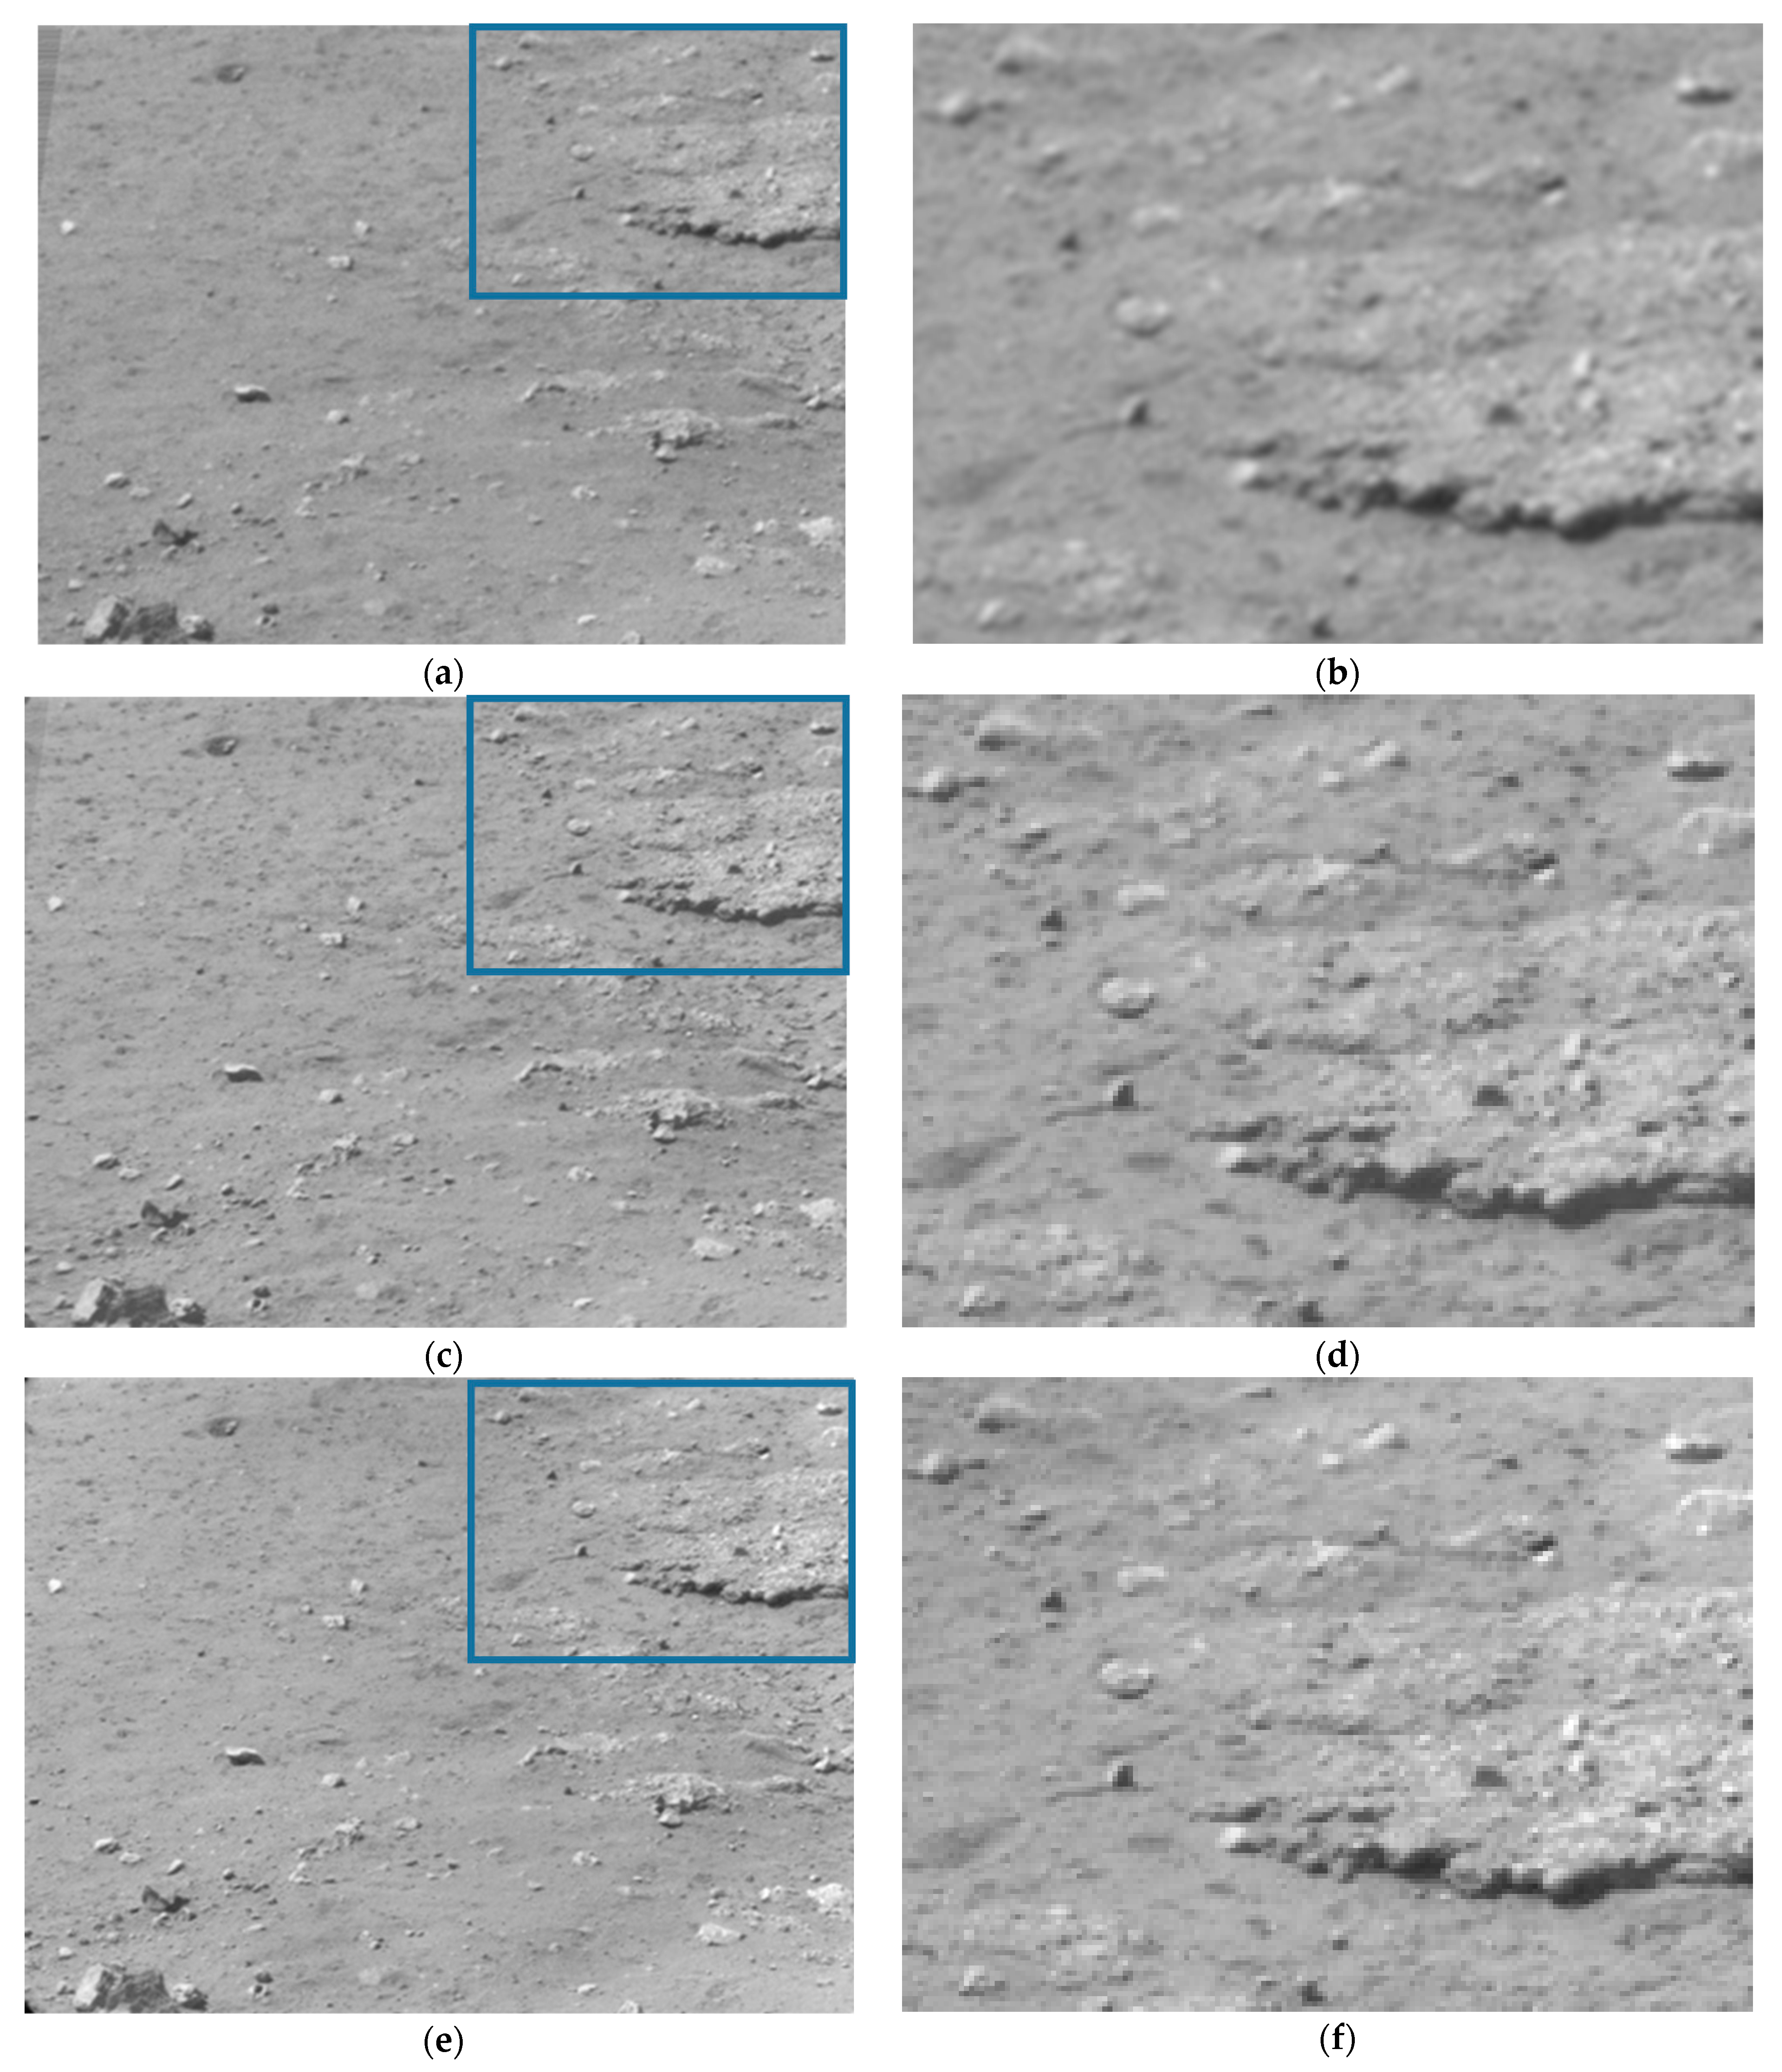
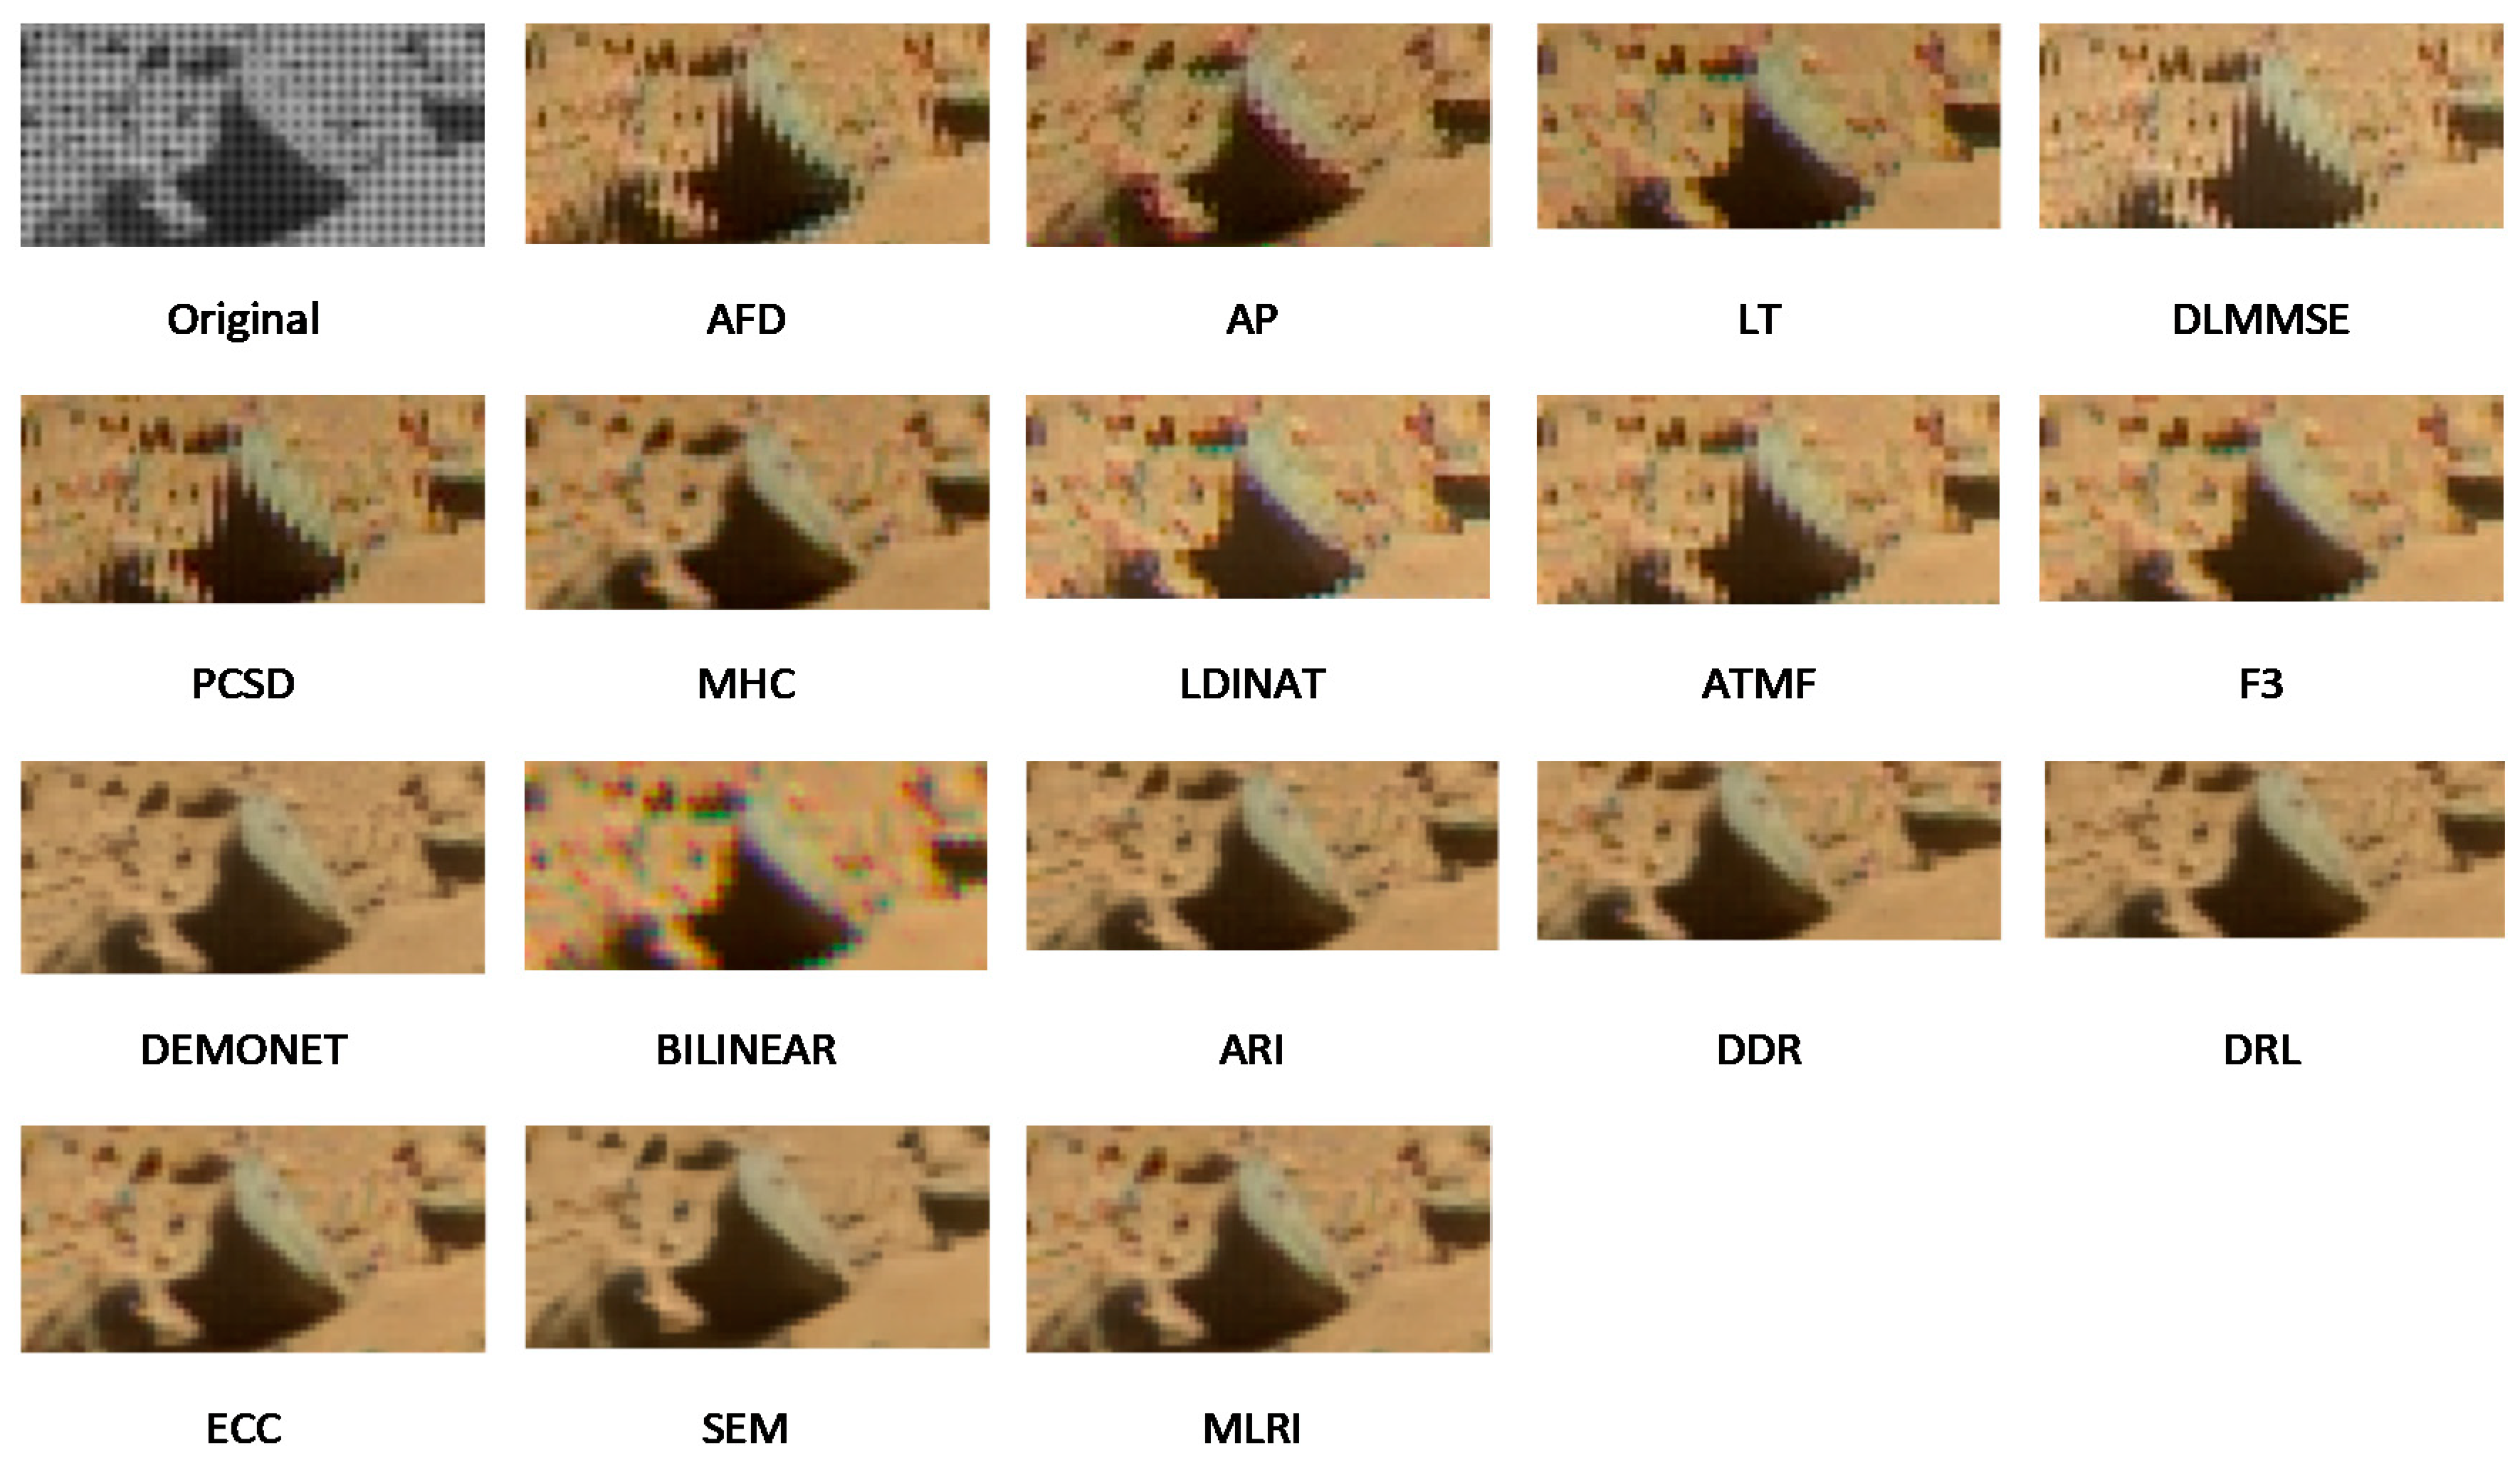
3. Debayering for Mastcam Images
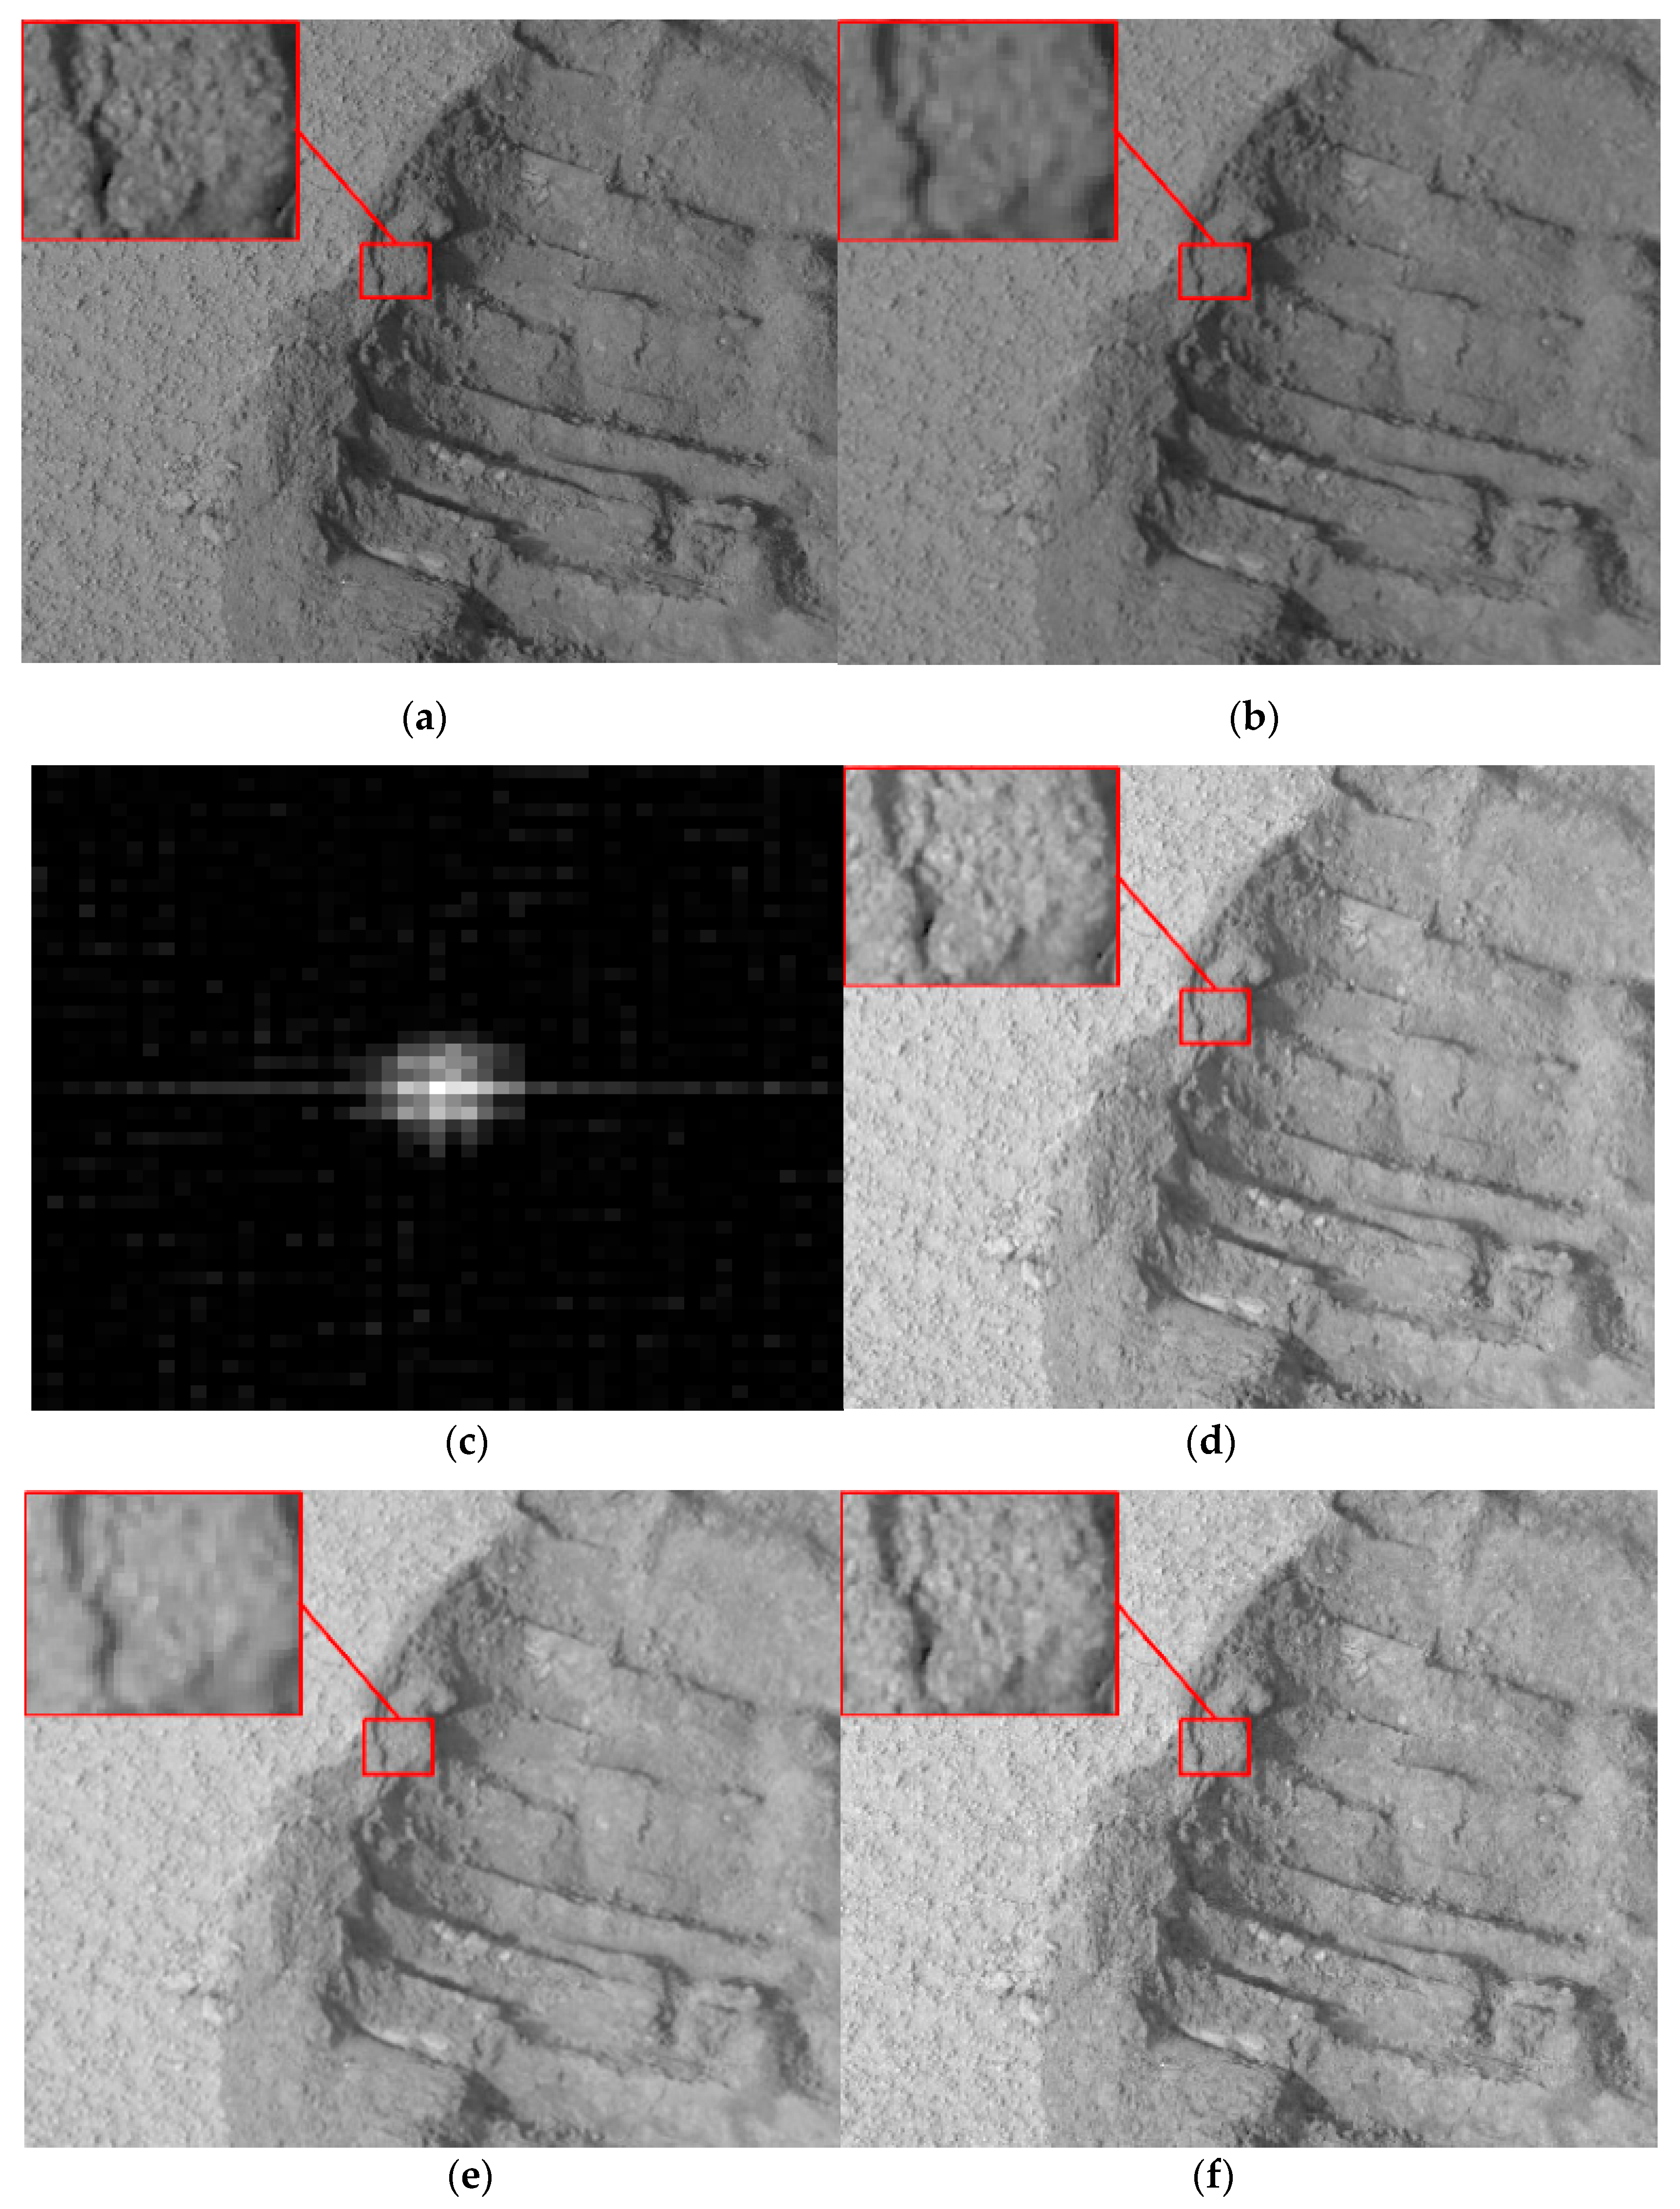
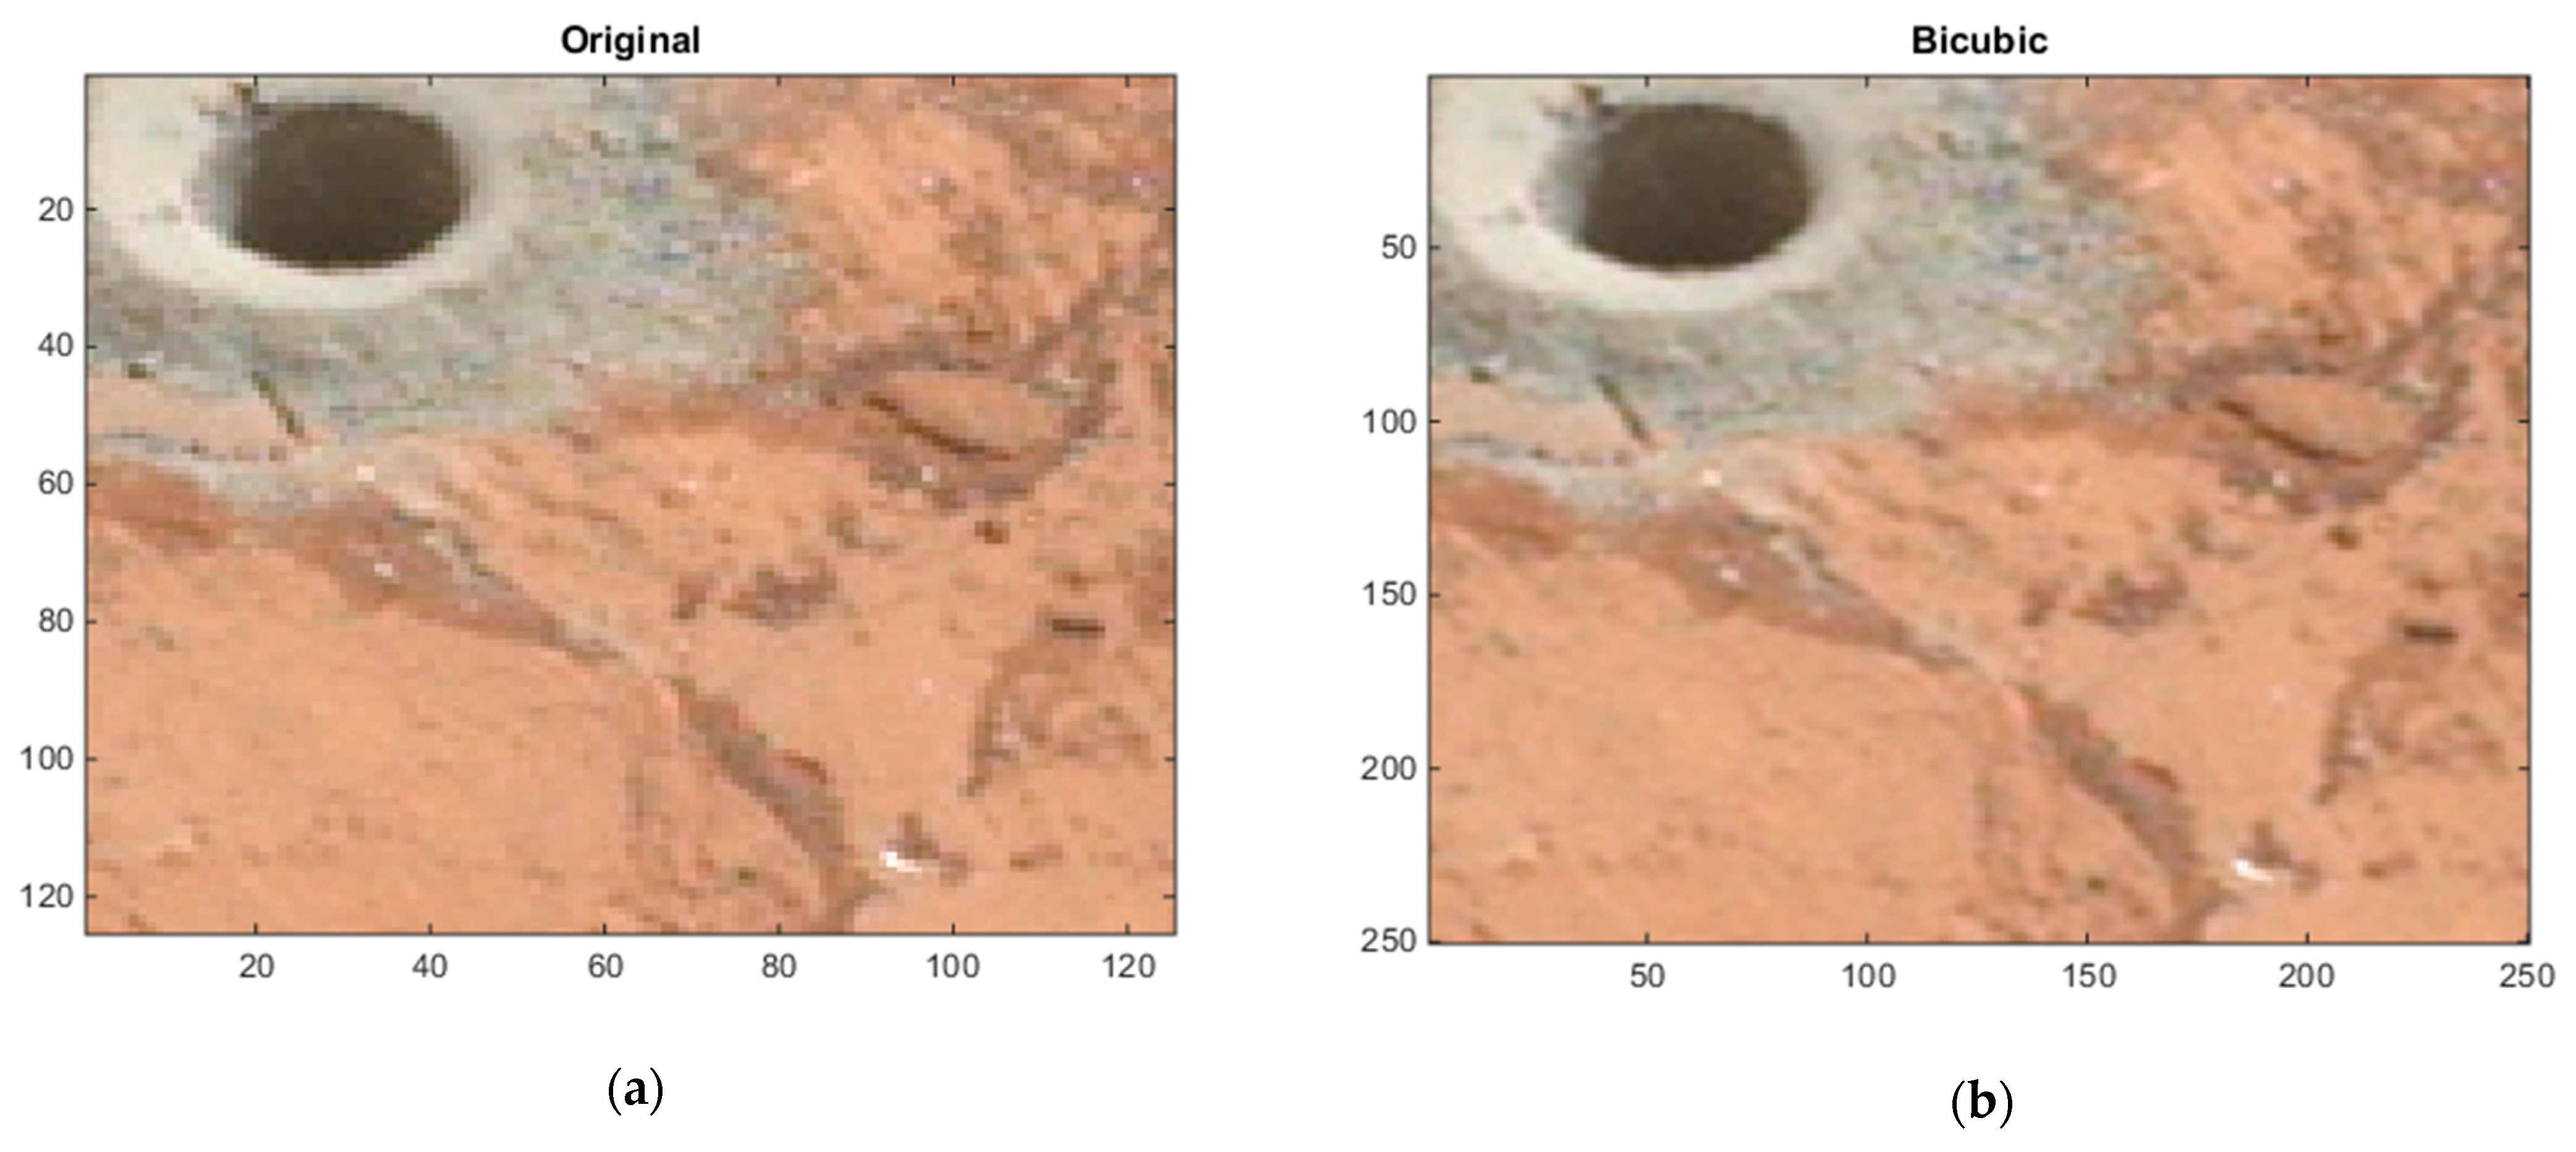
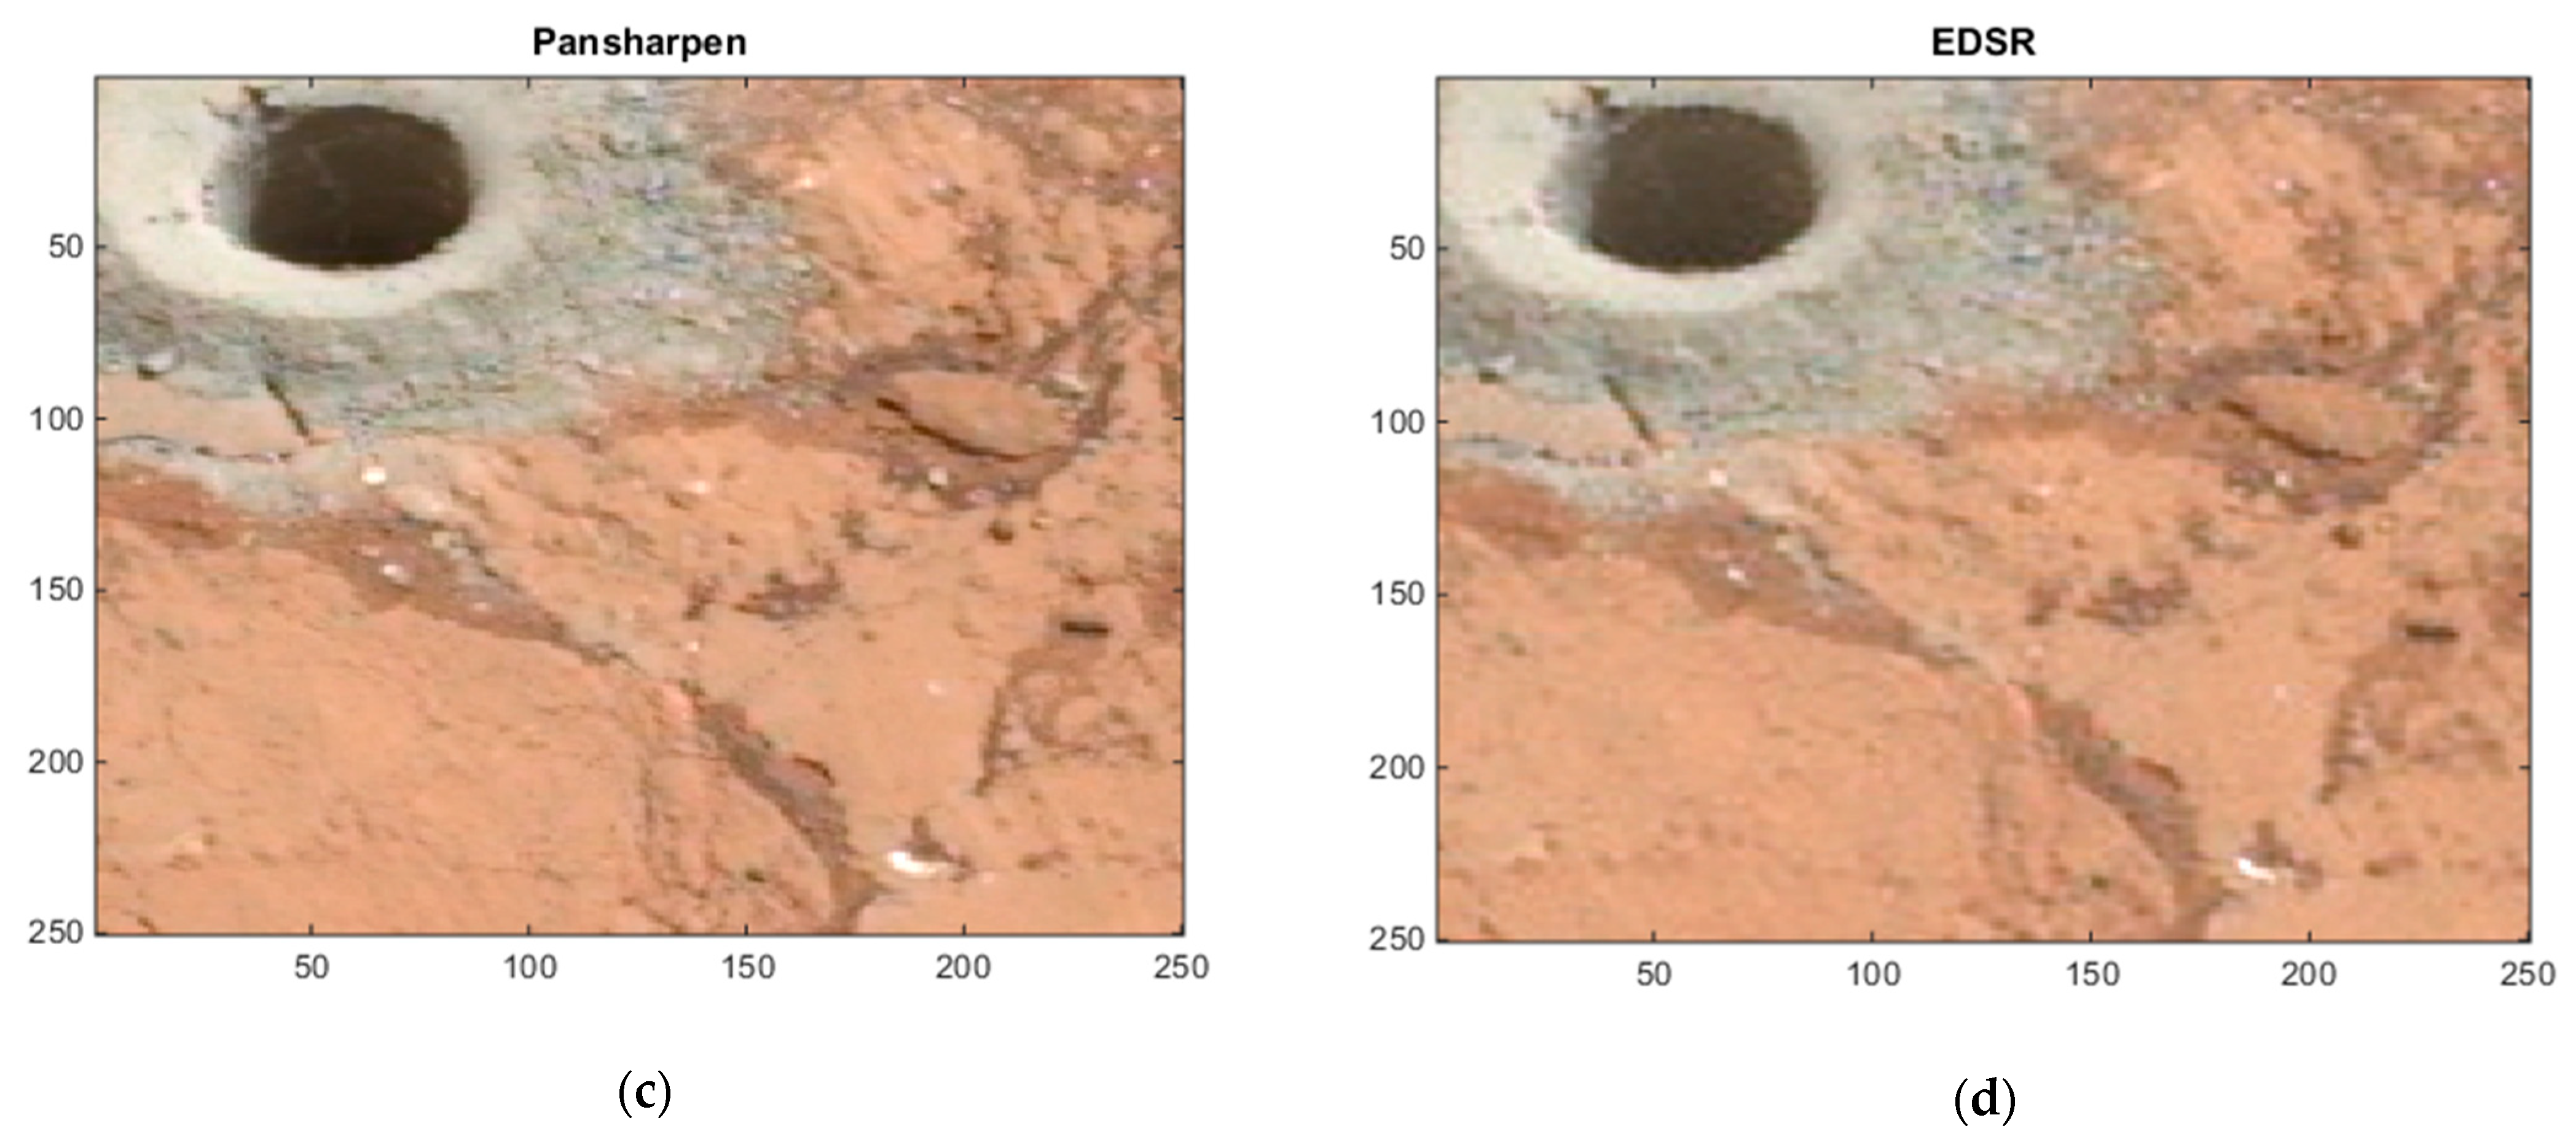
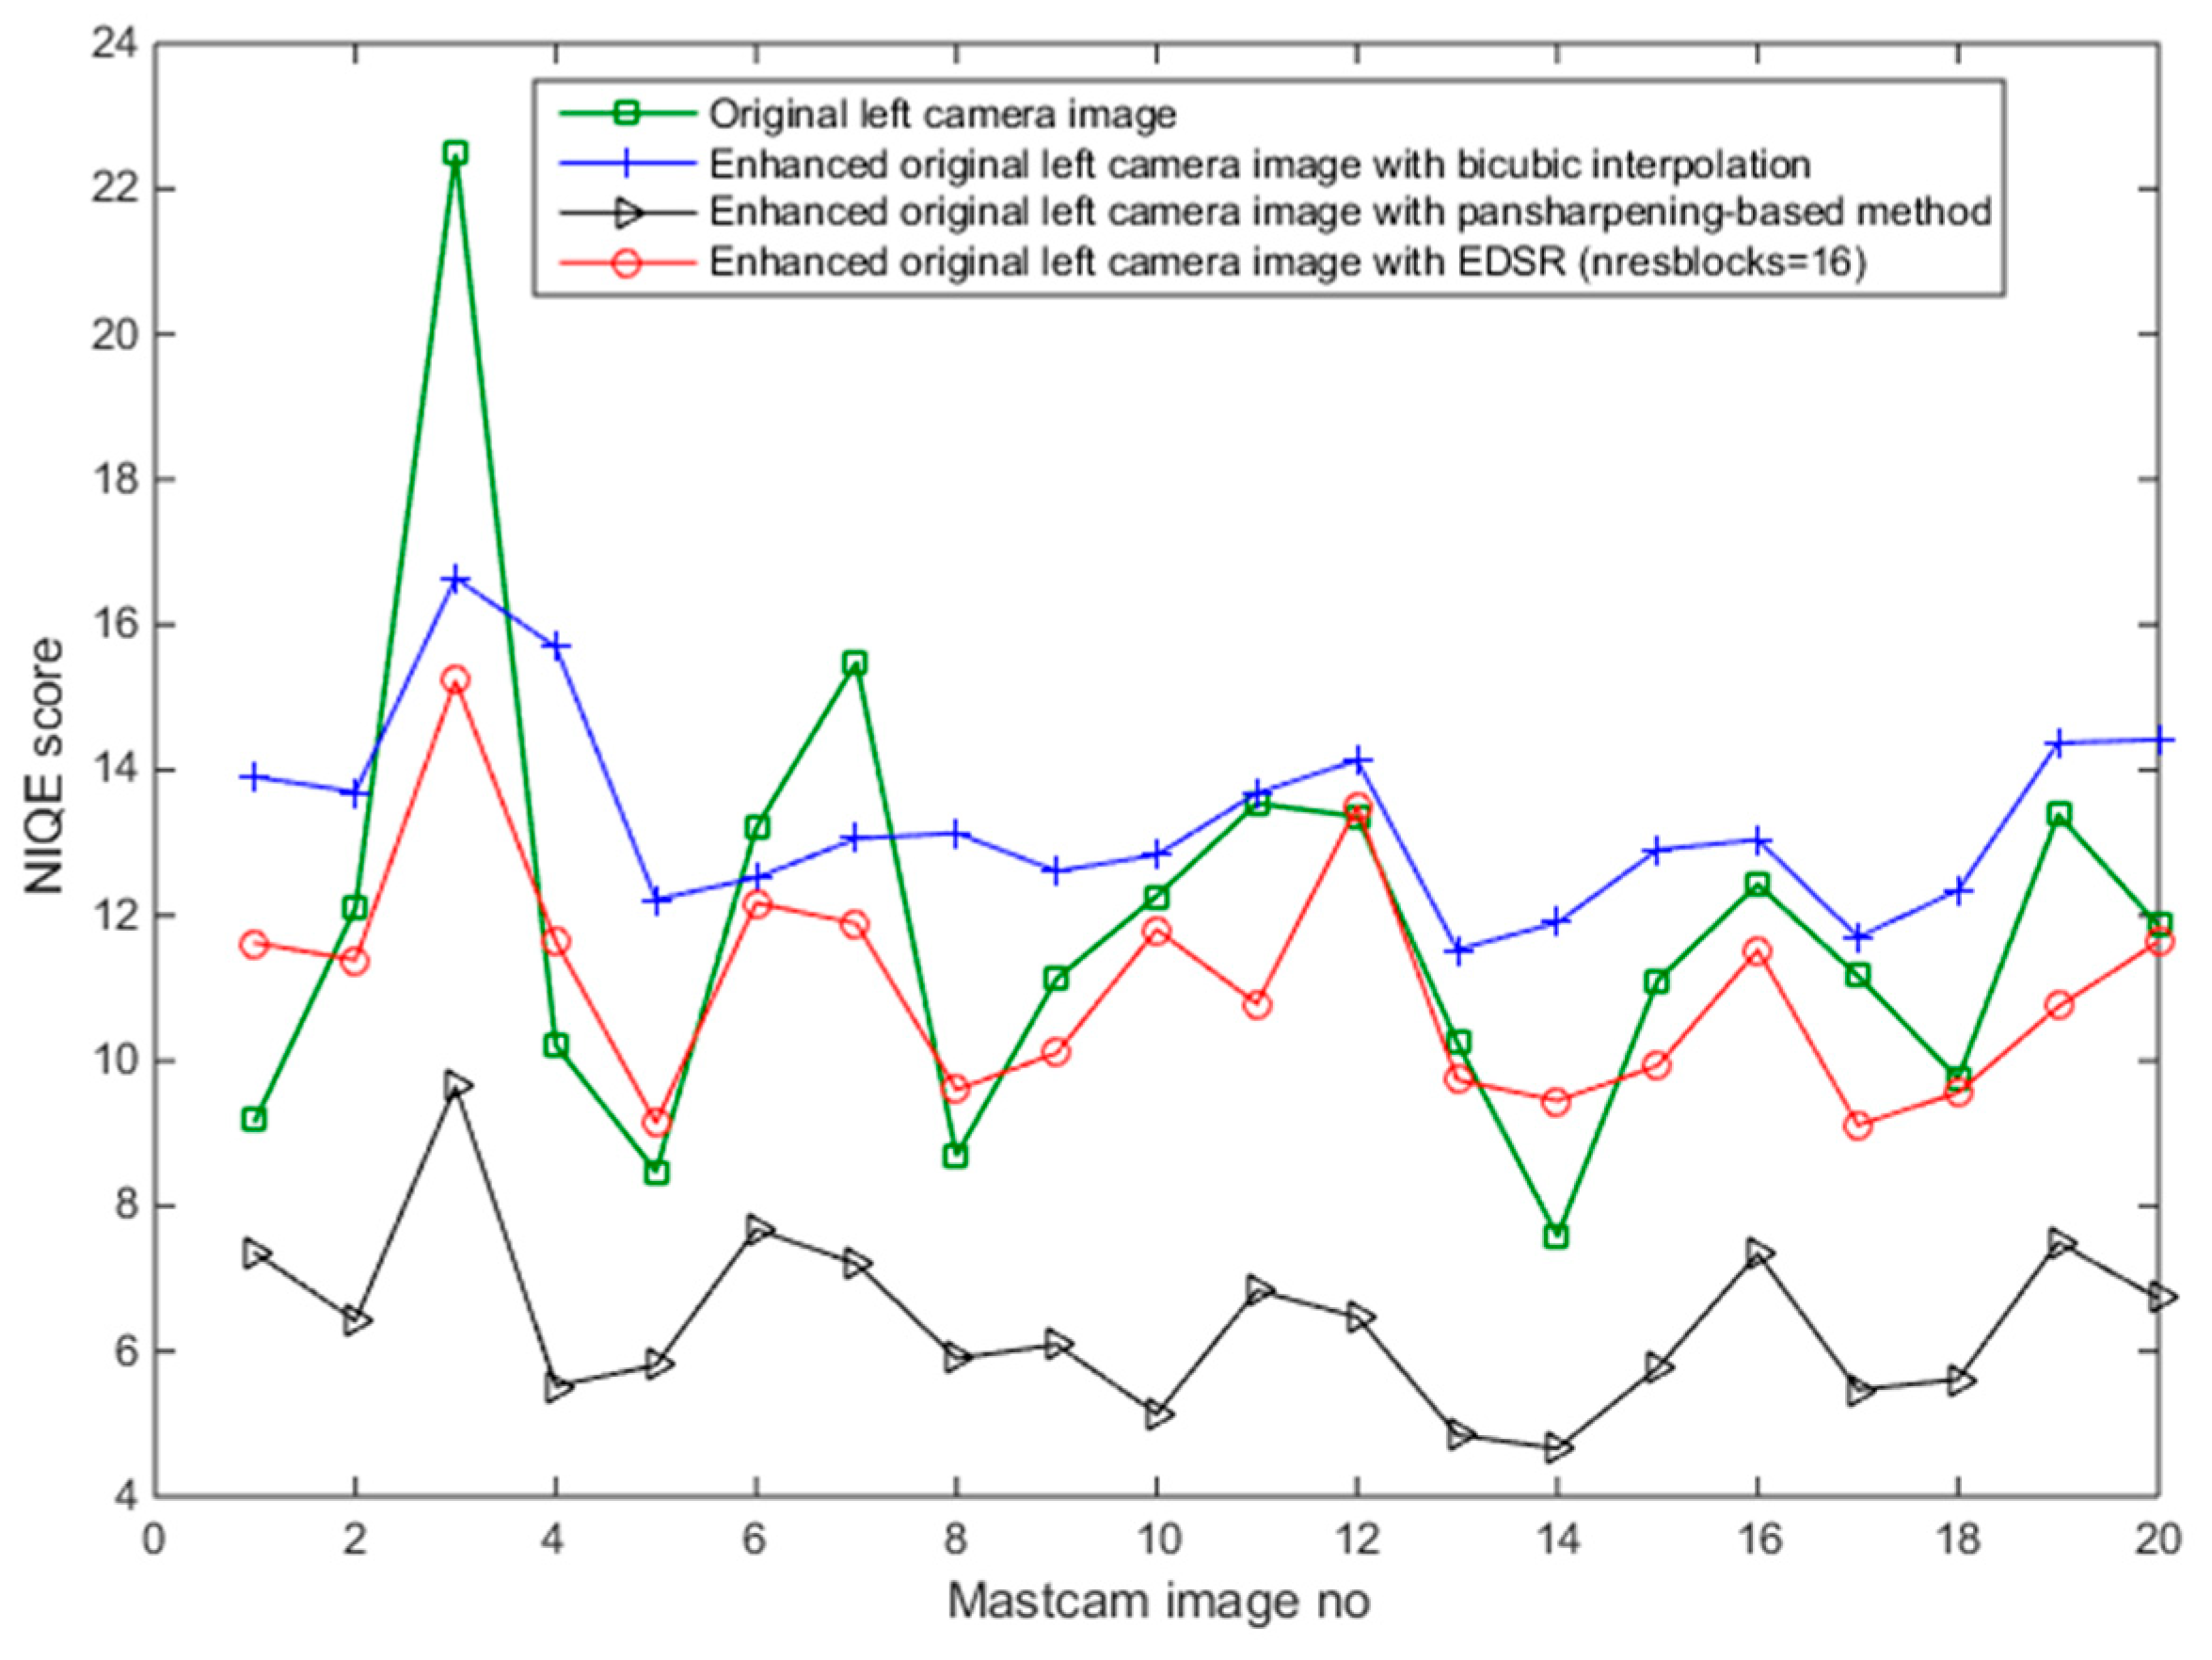
4. Mastcam Image Enhancement
4.1. Model Based Enhancement
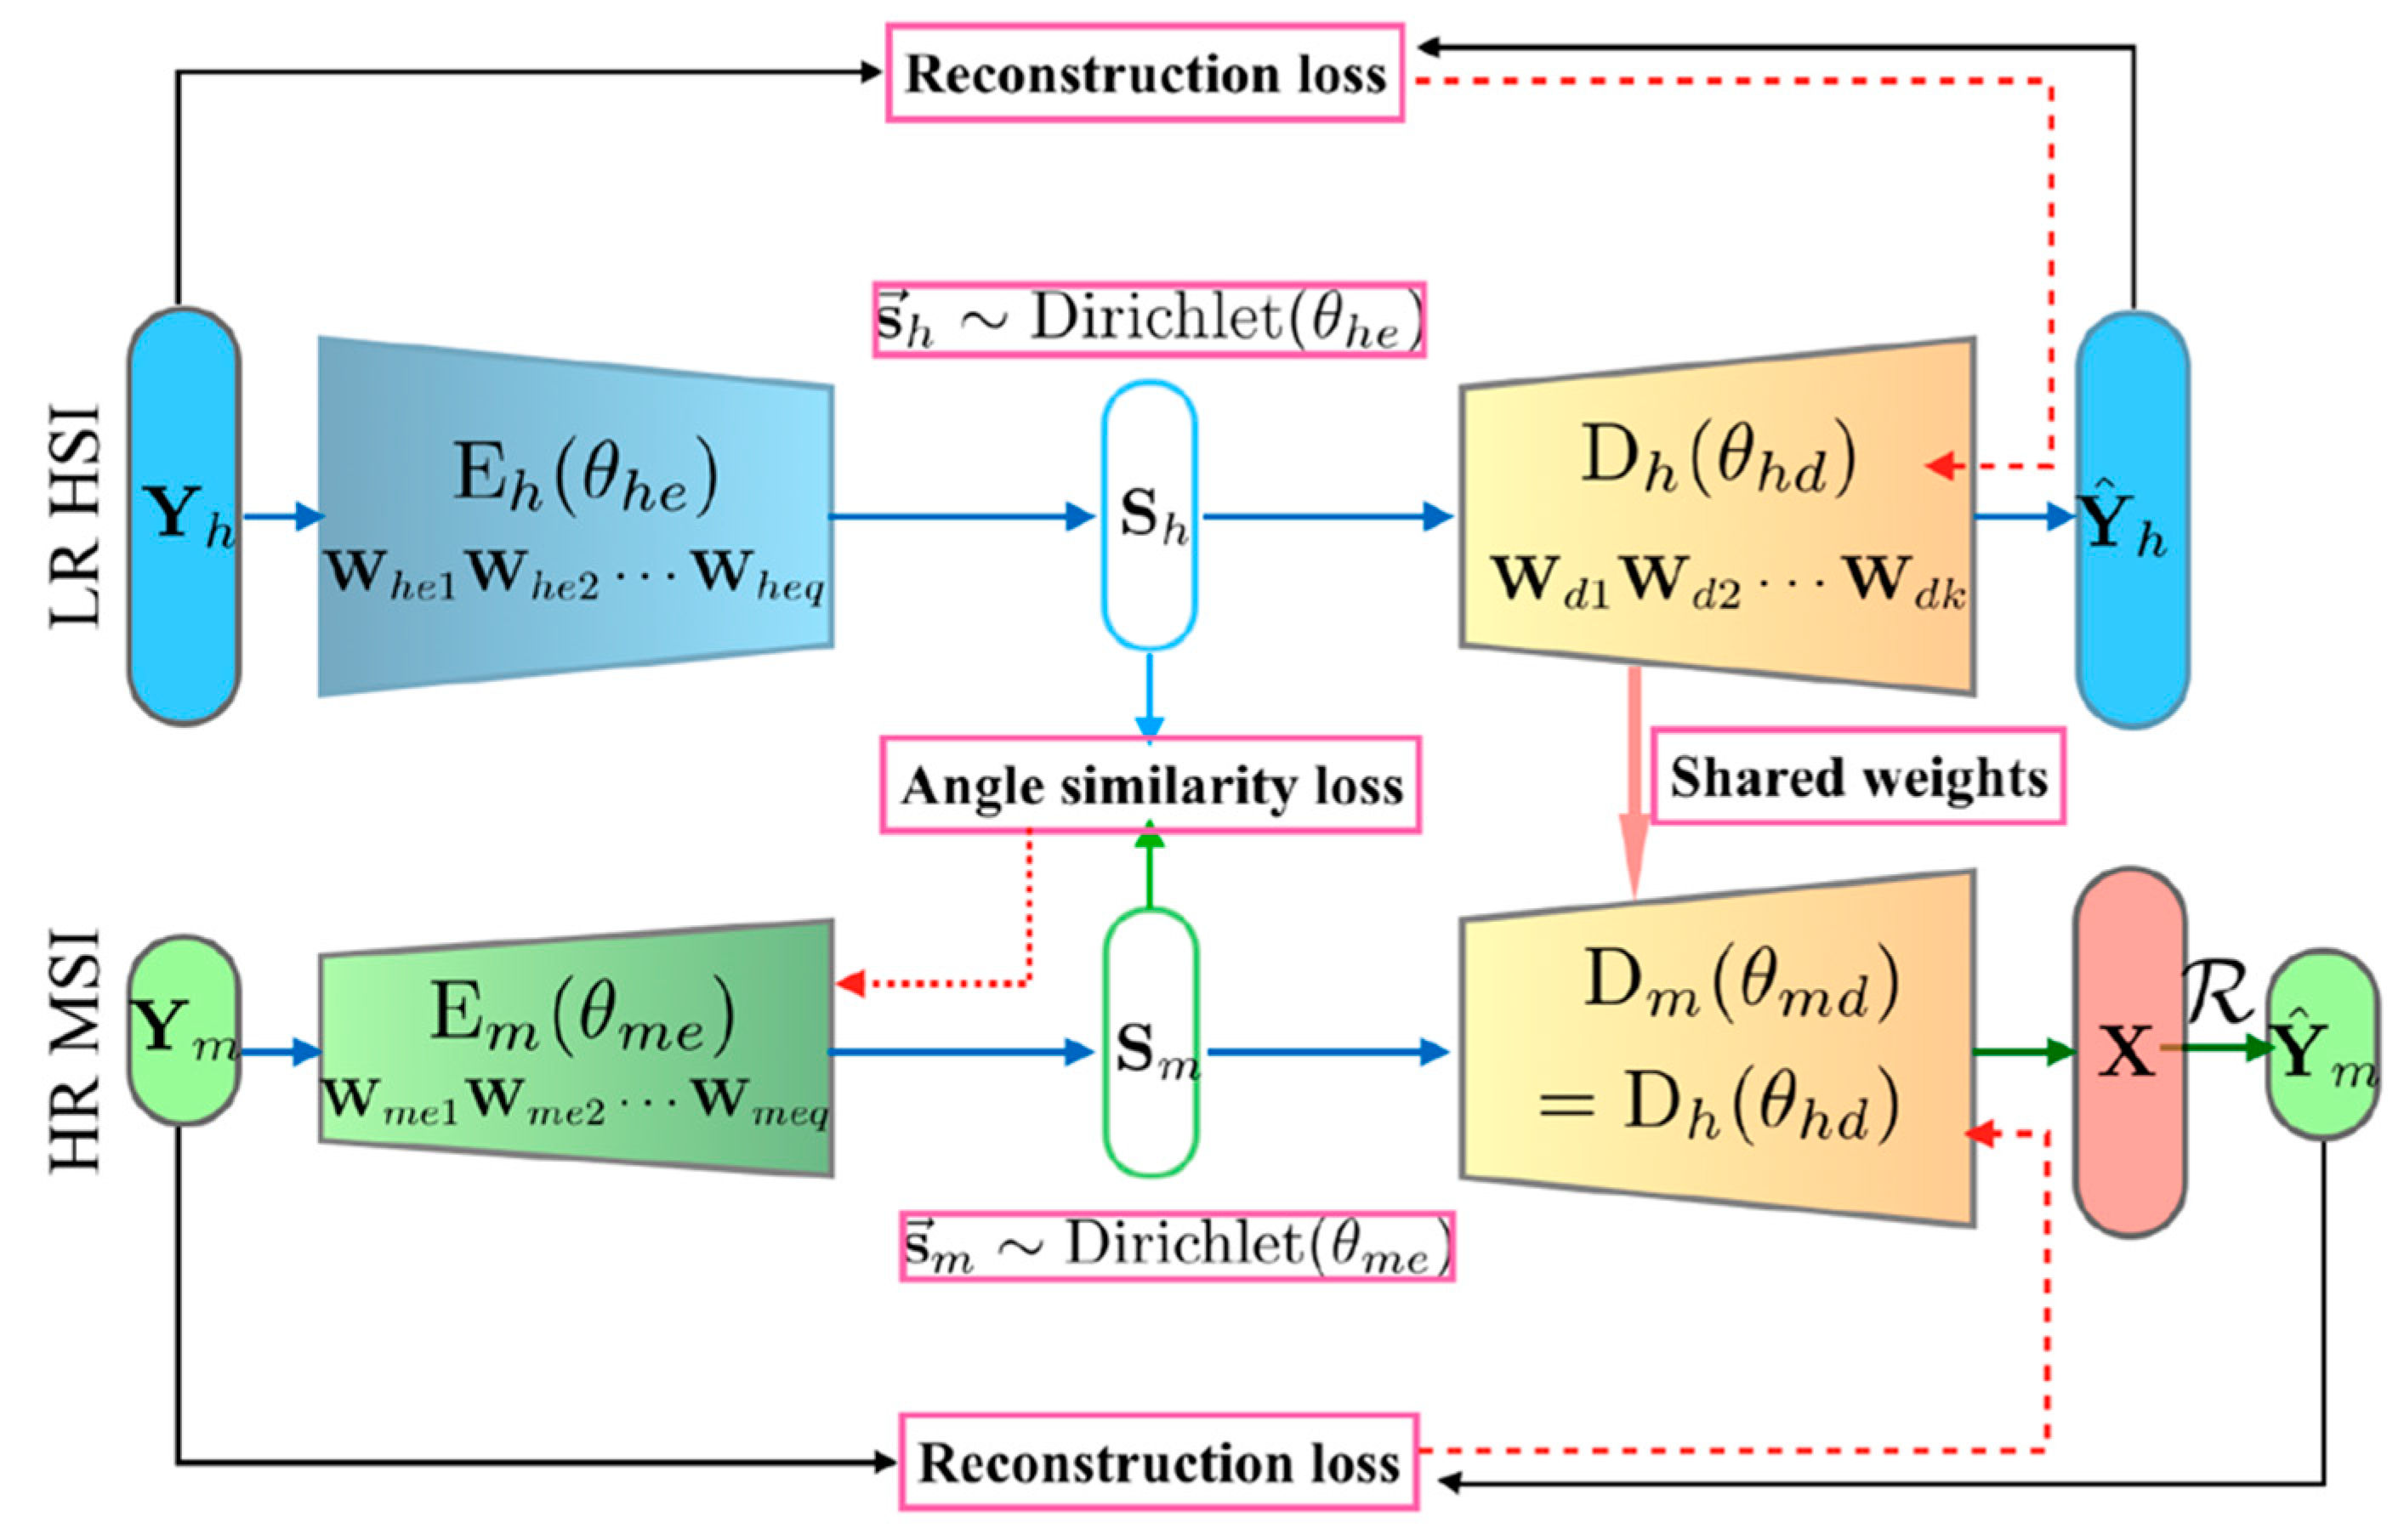
4.2. Deep Learning Approach
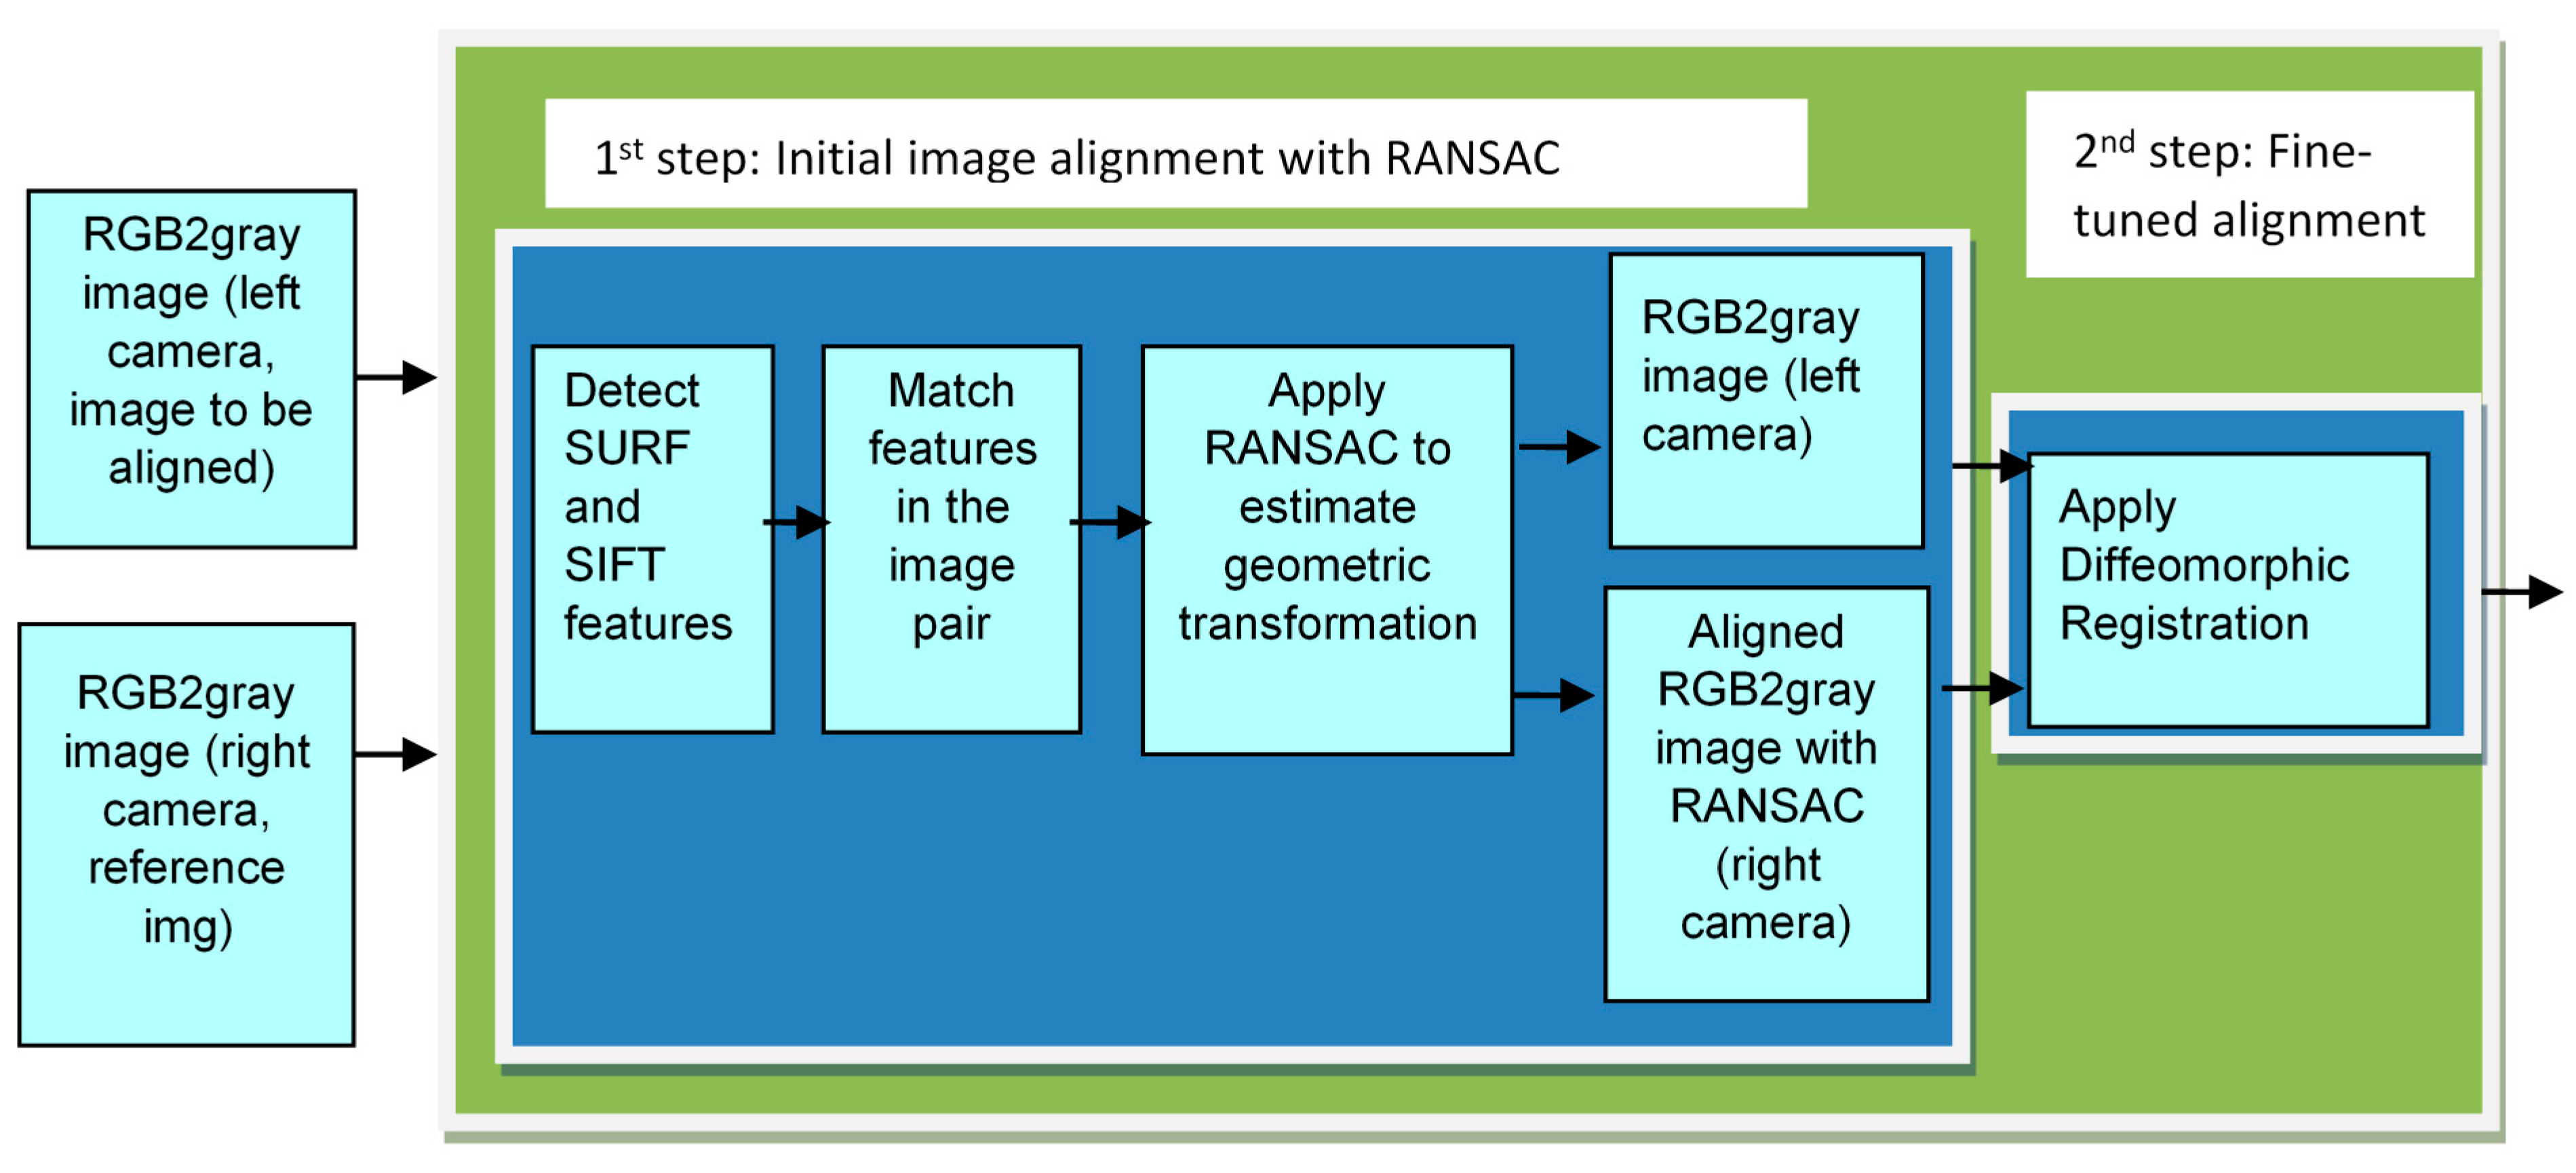
5. Stereo Imaging and Disparity Map Generation for Mastcam Images
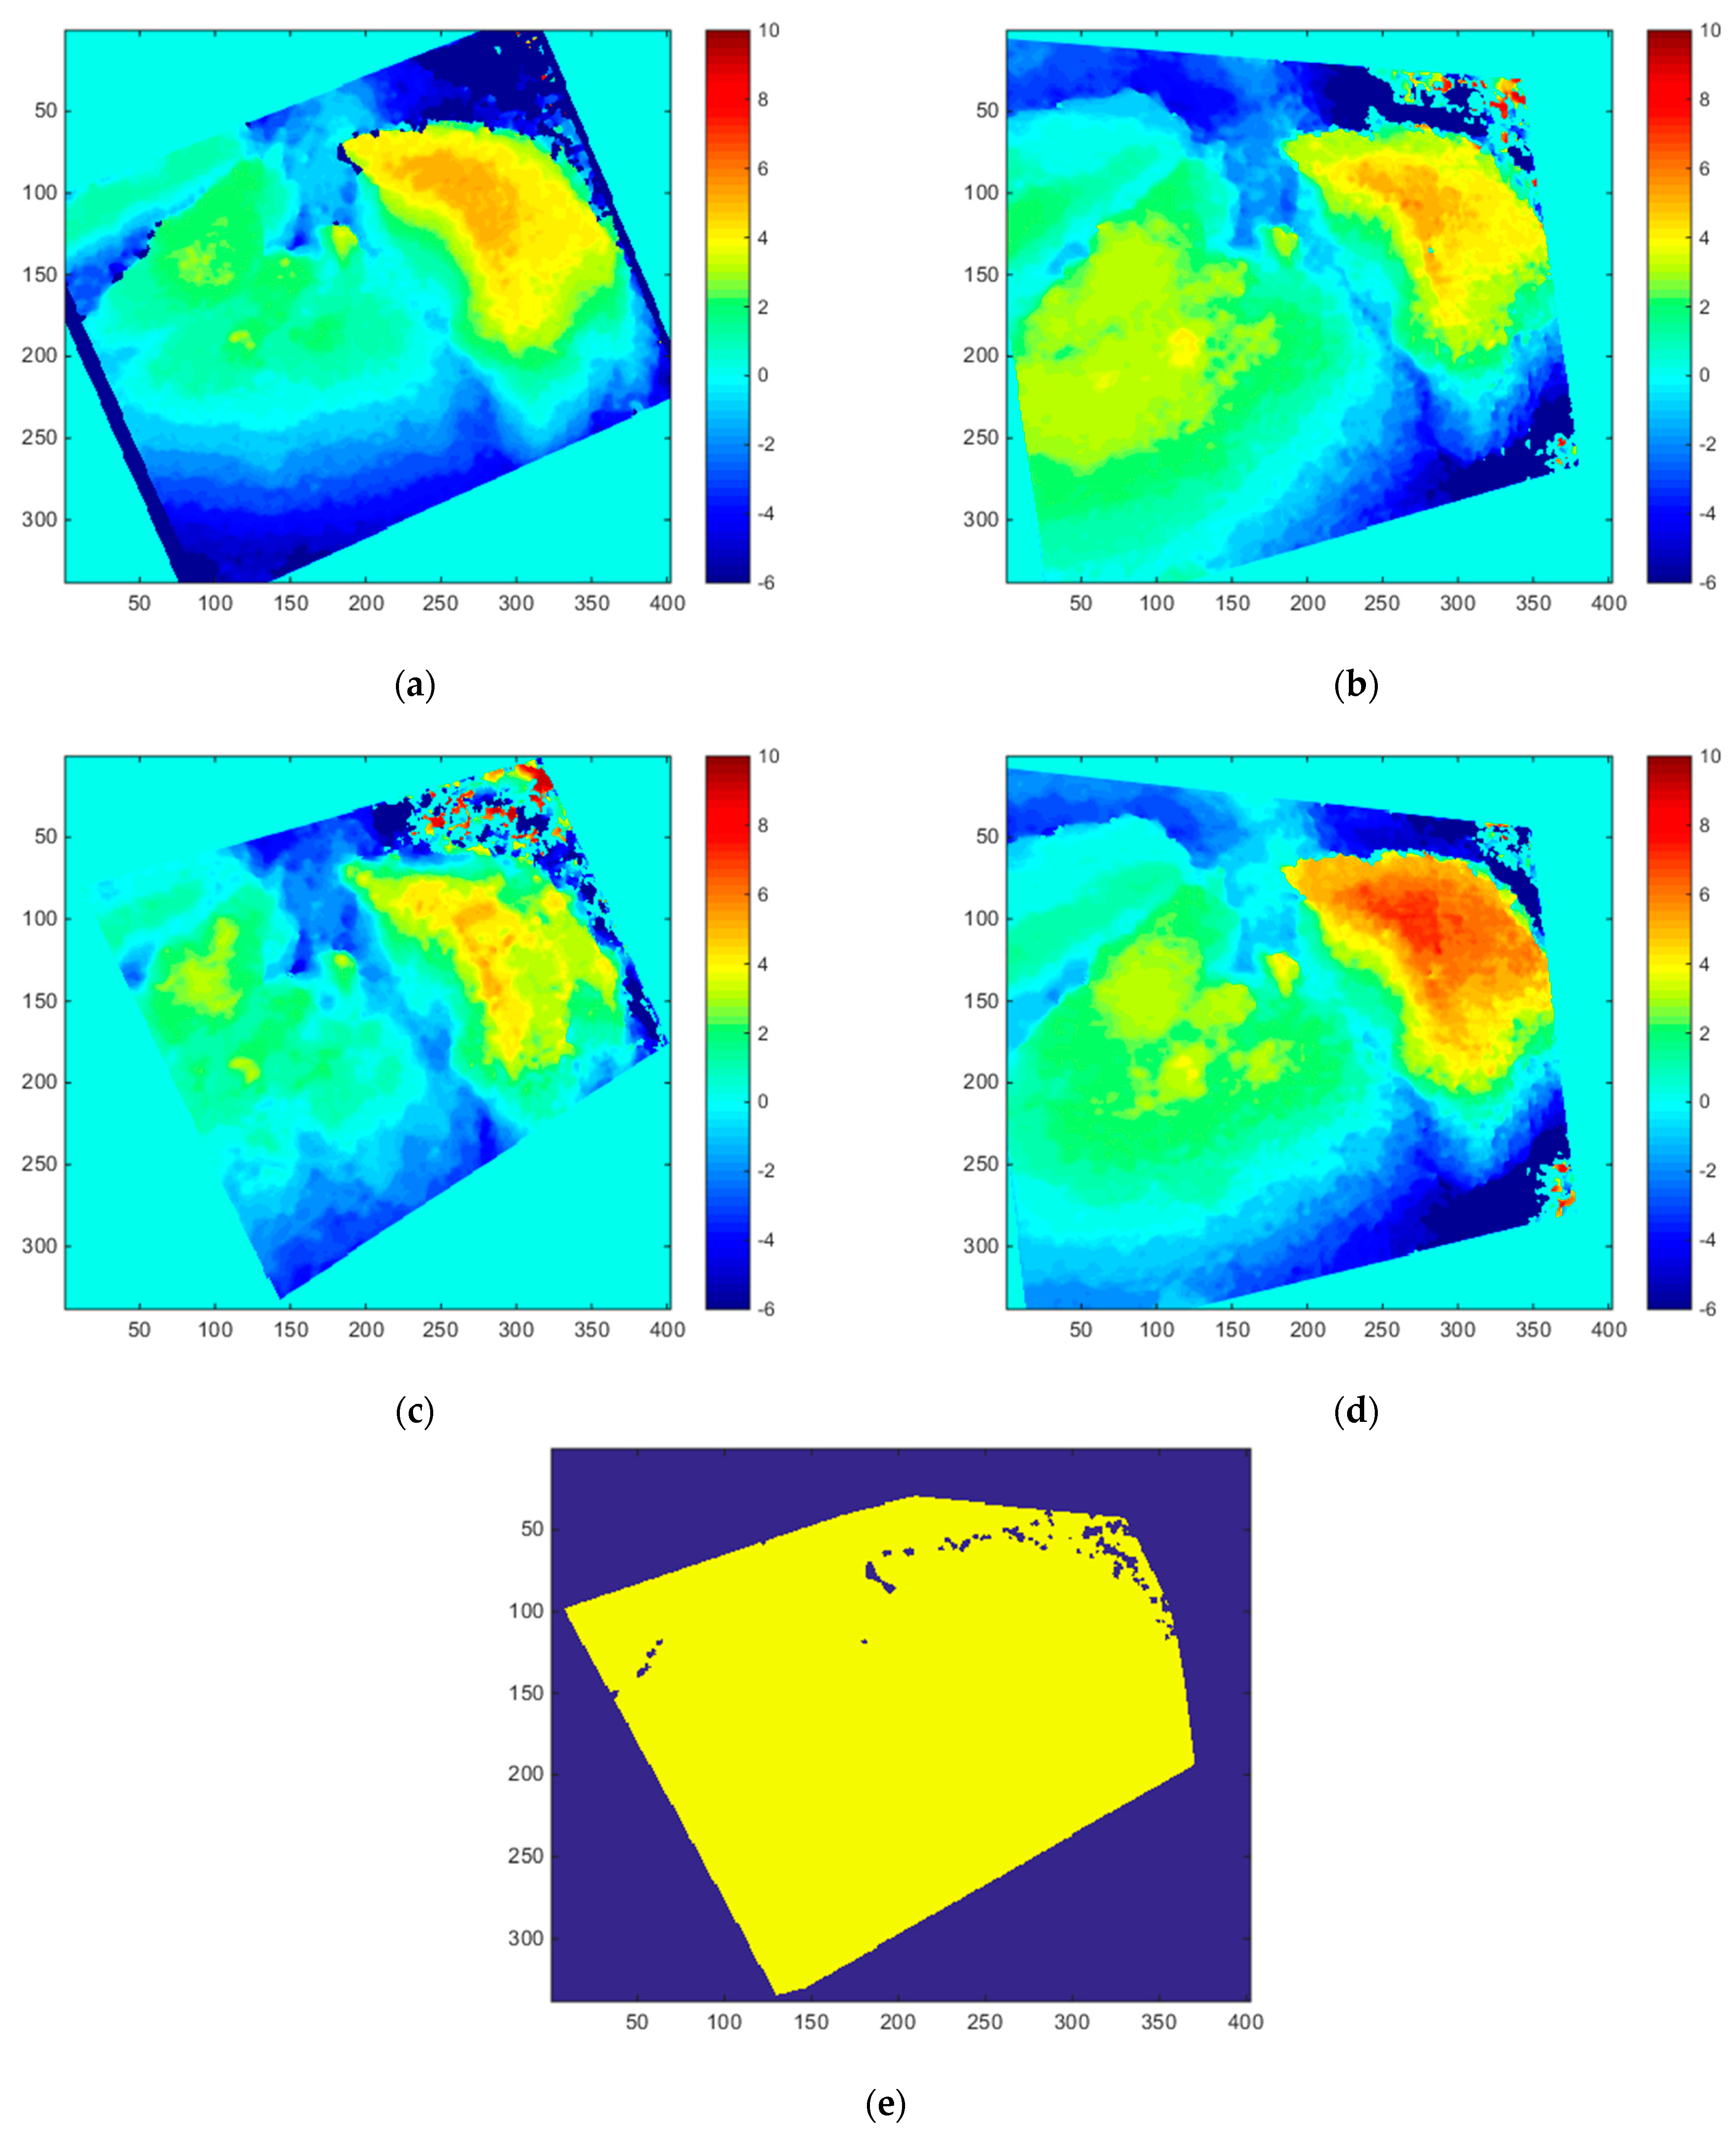
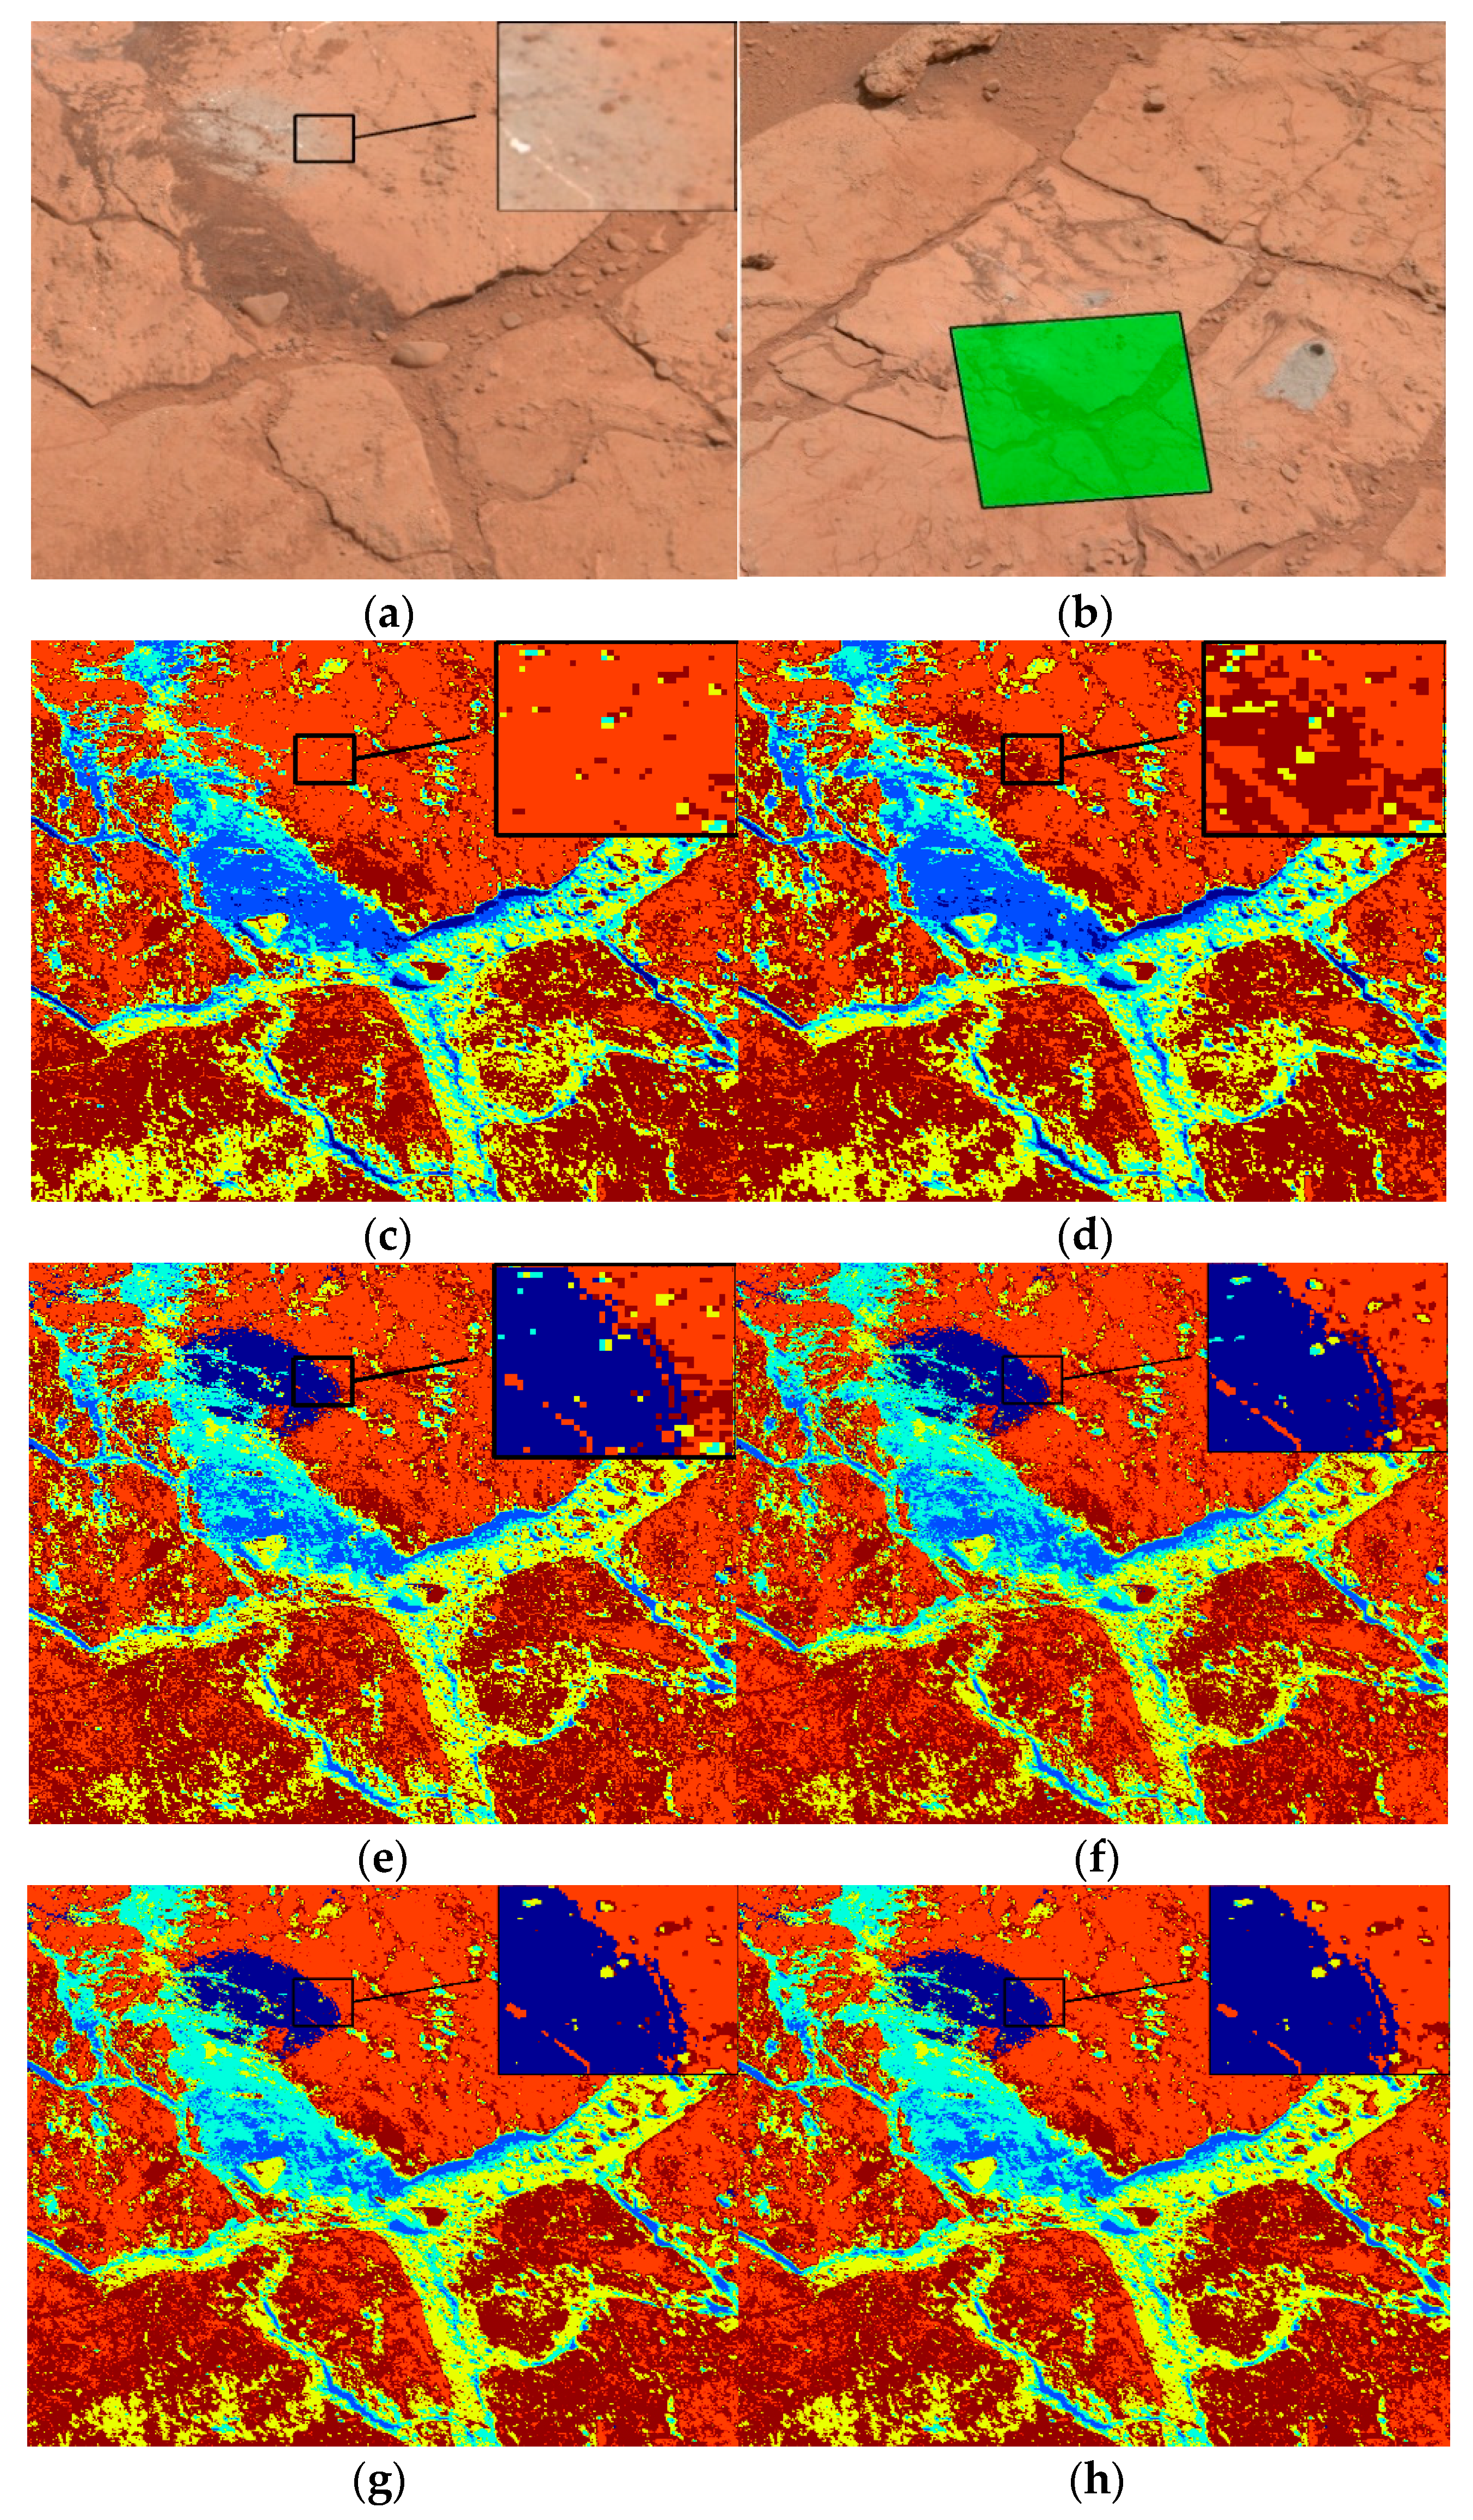
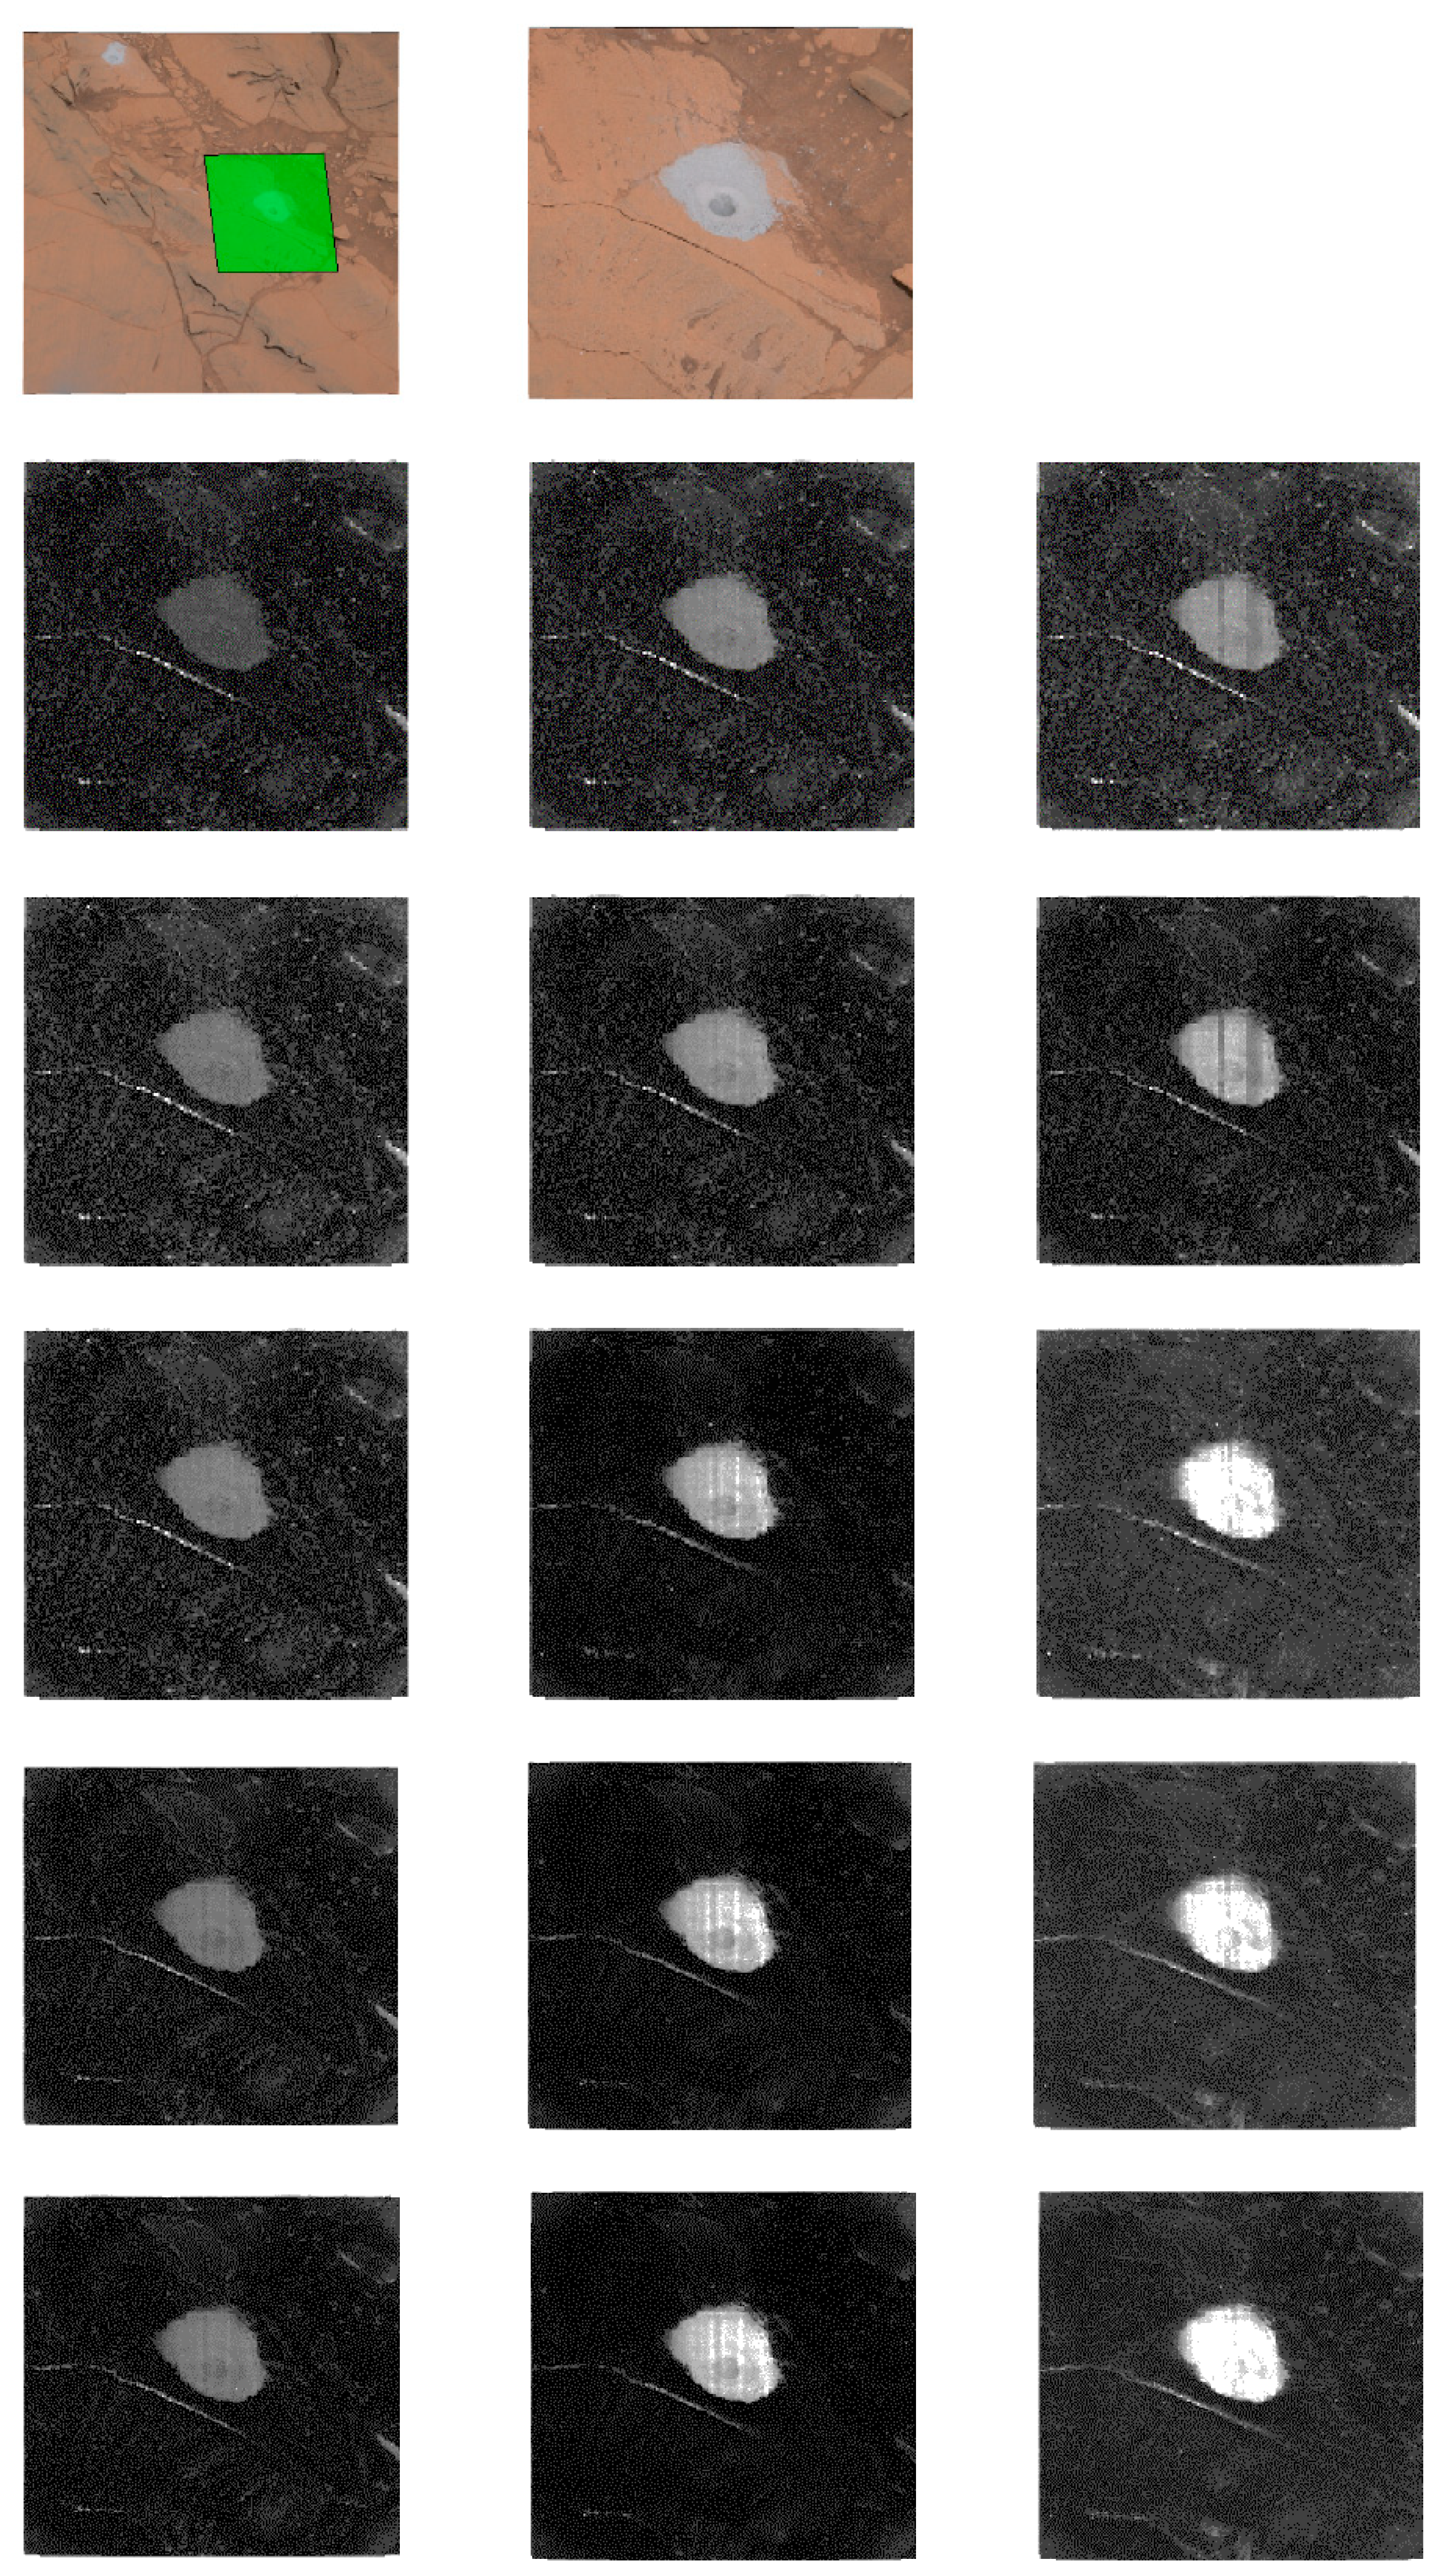
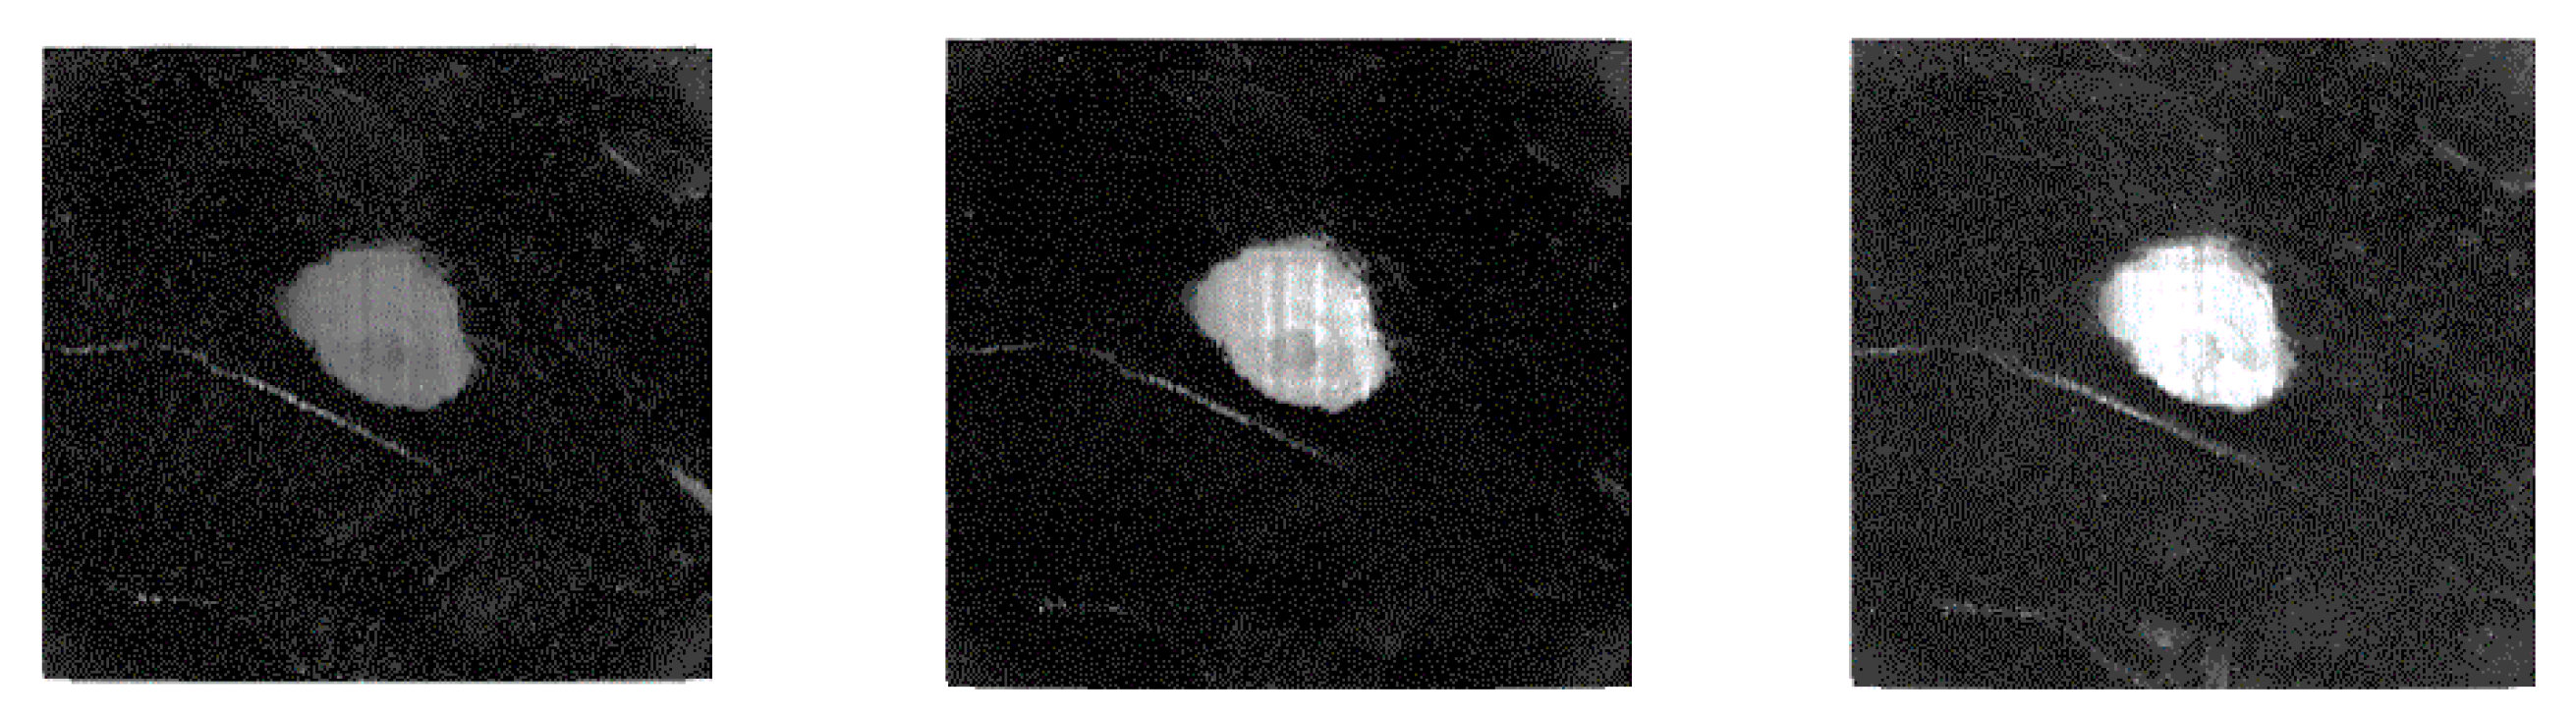
6. Anomaly Detection Using Mastcam Images
- (i)
- We observe that the clustering performance is improved after the first and second registration step of our proposed two-step framework;
- (ii)
- The clustering performance of the two-step registration for the M34-resolution and M100-resolution is comparable;
- (iii)
- The pansharpened data show the best clustering results with fewer randomly clustered pixels.
7. Conclusions and Future Work
Funding
Data Availability Statement
Conflicts of Interest
References
- Mars Rover. Available online: https://en.wikipedia.org/wiki/Mars_rover#cite_note-Mars2_NSSDC-17 (accessed on 7 September 2021).
- Wang, W.; Li, S.; Qi, H.; Ayhan, B.; Kwan, C.; Vance, S. Revisiting the Preprocessing Procedures for Elemental Concentration Estimation based on CHEMCAM LIBS on MARS Rover. In Proceedings of the 6th Workshop on Hyperspectral Image and Signal Processing: Evolution in Remote Sensing (WHISPERS), Lausanne, Switzerland, 24–27 June 2014. [Google Scholar]
- Bell, J.F., III; Godber, A.; McNair, S.; Caplinger, M.A.; Maki, J.N.; Lemmon, M.T.; Van Beek, J.; Malin, M.C.; Wellington, D.; Kinch, K.M.; et al. The Mars Science Laboratory Curiosity Rover Mast Camera (Mastcam) Instruments: Pre-Flight and In-Flight Calibration, Validation, and Data Archiving. AGU J. Earth Space Sci. 2018. [Google Scholar] [CrossRef] [Green Version]
- Kwan, C.; Chou, B.; Bell, J.F., III. Comparison of Deep Learning and Conventional Demosaicing Algorithms for Mastcam Images. Electronics 2019, 8, 308. [Google Scholar] [CrossRef] [Green Version]
- Ayhan, B.; Dao, M.; Kwan, C.; Chen, H.; Bell, J.F.; Kidd, R. A Novel Utilization of Image Registration Techniques to Process Mastcam Images in Mars Rover with Applications to Image Fusion, Pixel Clustering, and Anomaly Detection. IEEE J. Sel. Top. Appl. Earth Obs. Remote Sens. 2017, 10, 4553–4564. [Google Scholar] [CrossRef]
- JPEG. Available online: http://en.wikipedia.org/wiki/JPEG (accessed on 30 March 2021).
- JPEG-2000. Available online: http://en.wikipedia.org/wiki/JPEG_2000 (accessed on 30 March 2021).
- X264. Available online: http://www.videolan.org/developers/x264.html (accessed on 30 March 2021).
- X265. Available online: https://www.videolan.org/developers/x265.html (accessed on 30 March 2021).
- Tran, T.D.; Liang, J.; Tu, C. Lapped transform via time-domain pre-and post-filtering. IEEE Trans. Signal Process. 2003, 51, 1557–1571. [Google Scholar] [CrossRef]
- Daala. Available online: http://xiph.org/daala/ (accessed on 30 March 2021).
- Kwan, C.; Larkin, J. Perceptually Lossless Compression for Mastcam Multispectral Images: A Comparative Study. J. Signal Inf. Process. 2019, 10, 139–166. [Google Scholar] [CrossRef] [Green Version]
- Ponomarenko, N.; Silvestri, F.; Egiazarian, K.; Carli, M.; Astola, J.; Lukin, V. On between-coefficient contrast masking of DCT basis functions. In Proceedings of the Third International Workshop on Video Processing and Quality Metrics for Consumer Electronics VPQM-07, Scottsdale, AZ, USA, 25–26 January 2007. [Google Scholar]
- Bayer, B.E. Color Imaging Array. U.S. Patent 3971065, 20 July 1976. [Google Scholar]
- Li, X.; Gunturk, B.; Zhang, L. Image demosaicing: A systematic survey. In Proceedings of the Visual Communications and Image Processing 2008, San Jose, CA, USA, 28 January 2008; Volume 6822. [Google Scholar]
- Losson, O.; Macaire, L.; Yang, Y. Comparison of color demosaicing methods. Adv. Imaging Electron Phys. Elsevier 2010, 162, 173–265. [Google Scholar]
- Kwan, C.; Chou, B.; Kwan, L.M.; Budavari, B. Debayering RGBW color filter arrays: A pansharpening approach. In Proceedings of the IEEE Ubiquitous Computing, Electronics & Mobile Communication Conference, New York, NY, USA, 19–21 October 2017; pp. 94–100. [Google Scholar]
- Kwan, C.; Chou, B. Further Improvement of Debayering Performance of RGBW Color Filter Arrays Using Deep Learning and Pansharpening Techniques. J. Imaging 2019, 5, 68. [Google Scholar] [CrossRef] [PubMed] [Green Version]
- Zhang, L.; Wu, X.; Buades, A.; Li, X. Color demosaicking by local directional interpolation and nonlocal adaptive thresholding. J. Electron. Imaging 2011, 20. [Google Scholar] [CrossRef] [Green Version]
- Malvar, H.S.; He, L.-W.; Cutler, R. High-quality linear interpolation for demosaciking of color images. In Proceedings of the 2004 IEEE International Conference on Acoustics, Speech, and Signal Processing, Montreal, QC, Canada, 17–21 May 2004; Volume 3, pp. 485–488. [Google Scholar]
- Zhang, L.; Wu, X. Color demosaicking via directional linear minimum mean square-error estimation. IEEE Trans. Image Process. 2005, 14, 2167–2178. [Google Scholar] [CrossRef]
- Gharbi, M.; Chaurasia, G.; Paris, S.; Durand, F. Deep joint demosaicking and denoising. ACM Trans. Graph 2016, 35. [Google Scholar] [CrossRef]
- Tan, R.; Zhang, K.; Zuo, W.; Zhang, L. Color image demosaicking via deep residual learning. In Proceedings of the IEEE International Conference on Multimedia and Expo (ICME), Hong Kong, China, 10–14 July 2017; pp. 793–798. [Google Scholar]
- Klatzer, T.; Hammernik, K.; Knobelreiter, P.; Pock, T. Learning joint demosaicing and denoising based on sequential energy minimization. In Proceedings of the IEEE International Conference on Computational Photography (ICCP), Evanston, IL, USA, 13–15 May 2016; pp. 1–11. [Google Scholar]
- Kwan, C.; Chou, B.; Kwan, L.M.; Larkin, J.; Ayhan, B.; Bell, J.F.; Kerner, H. Demosaicking enhancement using pixel-level fusion. J. Signal Image Video Process. 2018. [Google Scholar] [CrossRef]
- Bednar, J.; Watt, T. Alpha-trimmed means and their relationship to median filters. IEEE Trans. Acoust. Speech Signal Process. 1984, 32, 145–153. [Google Scholar] [CrossRef]
- Lu, W.; Tan, Y.P. Color filter array demosaicking: New method and performance measures. IEEE Trans. Image Process. 2003, 12, 1194–1210. [Google Scholar]
- Dubois, E. Frequency-domain methods for demosaicking of Bayer-sampled color images. IEEE Signal Proc. Lett. 2005, 12, 847–850. [Google Scholar] [CrossRef]
- Gunturk, B.; Altunbasak, Y.; Mersereau, R.M. Color plane interpolation using alternating projections. IEEE Trans. Image Process. 2002, 11, 997–1013. [Google Scholar] [CrossRef] [PubMed]
- Wu, X.; Zhang, N. Primary-consistent soft-decision color demosaicking for digital cameras. IEEE Trans. Image Process. 2004, 13, 1263–1274. [Google Scholar] [CrossRef] [PubMed]
- Jaiswal, S.P.; Au, O.C.; Jakhetiya, V.; Yuan, Y.; Yang, H. Exploitation of inter-color correlation for color image demosaicking. In Proceedings of the 2014 IEEE International Conference on Image Processing (ICIP), Paris, France, 27–30 October 2014; pp. 1812–1816. [Google Scholar]
- Kiku, D.; Monno, Y.; Tanaka, M.; Okutomi, M. Beyond color difference: Residual interpolation for color image demosaicking. IEEE Trans. Image Process. 2016, 25, 1288–1300. [Google Scholar] [CrossRef]
- Monno, Y.; Kiku, D.; Tanaka, M.; Okutomi, M. Adaptive Residual Interpolation for Color and Multispectral Image Demosaicking. Sensors 2017, 17, 2787. [Google Scholar] [CrossRef] [Green Version]
- Wu, J.; Timofte, R.; Gool, L.V. Demosaicing based on directional difference regression and efficient regression priors. IEEE Trans. Image Process. 2016, 25, 3862–3874. [Google Scholar] [CrossRef]
- Kwan, C.; Dao, M.; Chou, B.; Kwan, L.M.; Ayhan, B. Mastcam Image Enhancement Using Estimated Point Spread Functions. In Proceedings of the IEEE Ubiquitous Computing, Electronics & Mobile Communication Conference, New York, NY, USA, 19–21 October 2017; pp. 186–191. [Google Scholar]
- Aiazzi, B.; Alparone, L.; Baronti, S.; Garzelli, A.; Selva, M. Mtf-tailored multiscale fusion of high-resolution ms and pan imagery. Photogramm. Eng. Remote Sens. 2006, 72, 591–596. [Google Scholar] [CrossRef]
- Aiazzi, B.; Baronti, S.; Selva, M. Improving component substitution pansharpening through multivariate regression of ms+ pan data. IEEE Trans. Geosci. Remote Sens. 2007, 45. [Google Scholar] [CrossRef]
- Akhtar, N.; Shafait, F.; Mian, A. Bayesian sparse representation for hyperspectral image super resolution. In Proceedings of the IEEE Conference on Computer Vision and Pattern Recognition, Boston, MA, USA, 7–12 June 2015; pp. 3631–3640. [Google Scholar]
- Akhtar, N.; Shafait, F.; Mian, A. Hierarchical beta process with Gaussian process prior for hyperspectral image super resolution. In Proceedings of the European Conference on Computer Vision, Amsterdam, The Netherlands, 8–16 October 2016; pp. 103–120. [Google Scholar]
- Borengasser, M.; Hungate, W.S.; Watkins, R. Hyperspectral Remote Sensing: Principles and Applications; CRC Press: Boca Raton, FL, USA, 2007. [Google Scholar]
- Qu, Y.; Qi, H.; Kwan, C. Unsupervised Sparse Dirichlet-Net for Hyperspectral Image Super-Resolution. In Proceedings of the IEEE Conference on Computer Vision and Pattern Recognition (CVPR), Salt Lake City, UT, USA, 18–23 June 2018; pp. 2511–2520. [Google Scholar]
- Qu, Y.; Qi, H.; Kwan, C. Unsupervised and Unregistered Hyperspectral Image Super-Resolution with Mutual Dirichlet-Net. arXiv 2019, arXiv:1904.12175. [Google Scholar]
- Qu, Y.; Qi, H.; Kwan, C. Application of Deep Learning Approaches to Enhancing Mastcam Images. In Recent Advances in Image Restoration with Application to Real World Problems; InTech: Ahmedabad, India, 2020. [Google Scholar]
- Yasuma, F.; Mitsunaga, T.; Iso, D.; Nayar, S.K. Generalized assorted pixel camera: Postcapture control of resolution, dynamic range, and spectrum. IEEE Trans. Image Process. 2010, 19, 2241–2253. [Google Scholar] [CrossRef] [PubMed] [Green Version]
- Chakrabarti, A.; Zickler, T. Statistics of real-world hyperspectral images. In Proceedings of the IEEE Conference on Computer Vision and Pattern Recognition (CVPR), Colorado Springs, CO, USA, 20–25 June 2011; pp. 193–200. [Google Scholar]
- Yokoya, N.; Yairi, T.; Iwasaki, A. Coupled nonnegative matrix factorization unmixing for hyperspectral and multispectral data fusion. IEEE Trans. Geosci. Remote Sens. 2017, 50, 528–537. [Google Scholar] [CrossRef]
- Arya, M.; Hassan, S.; Binjola, S.; Verma, P. Exploration of Mars Using Augmented Reality. In Proceedings of the International Conference on Intelligent Computing and Applications, Wuhan, China, 15–18 August 2018; Springer: Singapore. [Google Scholar]
- Casini, A.E.; Maggiore, P.; Viola, N.; Basso, V.; Ferrino, M.; Hoffman, J.A.; Cowley, A. Analysis of a Moon outpost for Mars enabling technologies through a Virtual Reality environment. Acta Astronaut. 2018, 143, 353–361. [Google Scholar] [CrossRef]
- Mars Virtual Reality Software Wins NASA Award. Available online: https://www.jpl.nasa.gov/news/news.php?feature=7249 (accessed on 30 March 2021).
- Boyle, R. NASA uses Microsoft’s HoloLens and ProtoSpace to build its Next Mars rover in augmented reality. GeekWire 2016. Available online: https://www.geekwire.com/2016/nasa-uses-microsoft-hololens-build-mars-rover-augmented-reality/ (accessed on 7 September 2021).
- Alhashim, I.; Wonka, P. High Quality Monocular Depth Estimation via Transfer Learning. arXiv 2018, arXiv:1812.11941. [Google Scholar]
- Poggi, M.; Tosi, F.; Mattoccia, S. Learning monocular depth estimation with unsupervised trinocular assumptions. In Proceedings of the IEEE International Conference on 3D Vision (3DV), Verona, Italy, 5–8 September 2018. [Google Scholar]
- Godard, C.; Mac Aodha, O.; Brostow, G.J. Unsupervised monocular depth estimation with left-right consistency. In Proceedings of the IEEE Conference on Computer Vision and Pattern Recognition, Honolulu, HI, USA, 21–26 July 2017. [Google Scholar]
- Ayhan, B.; Kwan, C. Mastcam Image Resolution Enhancement with Application to Disparity Map Generation for Stereo Images with Different Resolutions. Sensors 2019, 19, 3526. [Google Scholar] [CrossRef] [Green Version]
- Kwan, C.; Chou, B.; Ayhan, B. Enhancing Stereo Image Formation and Depth Map Estimation for Mastcam Images. In Proceedings of the IEEE Ubiquitous Computing, Electronics & Mobile Communication Conference, New York, NY, USA, 8–10 November 2018. [Google Scholar]
- Keys, R. Cubic convolution interpolation for digital image processing. IEEE Trans. Acoust. Speech Signal Process. 1981, 29, 1153–1160. [Google Scholar] [CrossRef] [Green Version]
- Qu, Y.; Qi, H.; Ayhan, B.; Kwan, C.; Kidd, R. Does Multispectral/Hyperspectral Pansharpening Improve the Performance of Anomaly Detection? In Proceedings of the IEEE International Geoscience and Remote Sensing Symposium (IGARSS), Fort Worth, TX, USA, 23–28 July 2017; pp. 6130–6133. [Google Scholar]
- Kwan, C.; Budavari, B.; Bovik, A.C.; Marchisio, G. Blind Quality Assessment of Fused WorldView-3 Images by Using the Combinations of Pansharpening and Hypersharpening Paradigms. IEEE Geosci. Remote Sens. Lett. 2017, 1835–1839. [Google Scholar] [CrossRef]
- Loncan, L.; de Almeida, L.B.; Bioucas-Dias, J.M.; Briottet, X.; Chanussot, J.; Dobigeon, N.; Fabre, S.; Liao, W.; Licciardi, G.A.; Simoes, M. Hyperspectral pansharpening: A review. IEEE Geosci. Remote Sens. Mag. 2015, 27–46. [Google Scholar] [CrossRef] [Green Version]
- Vivone, G.; Alparone, L.; Chanussot, J.; Dalla Mura, M.; Garzelli, A.; Licciardi, G.A.; Restaino, R.; Wald, L. A critical comparison among pansharpening algorithms. IEEE Trans. Geosci. Remote Sens. 2015, 2565–2586. [Google Scholar] [CrossRef]
- Kwan, C.; Budavari, B.; Dao, M.; Ayhan, B.; Bell, J.F. Pansharpening of Mastcam images. In Proceedings of the IEEE International Geoscience and Remote Sensing Symposium (IGARSS), Fort Worth, TX, USA, 23–28 July 2017; pp. 5117–5120. [Google Scholar]
- Dong, C.; Loy, C.; He, K.; Tang, X. Learning a deep convolutional network for image super-resolution. In Proceedings of the European Conference on Computer Vision, Zurich, Switzerland, 6–12 September 2014; pp. 184–199. [Google Scholar]
- Yu, J.; Fan, Y.; Yang, J.; Xu, N.; Wang, Z.; Wang, X.; Huang, T. Wide activation for efficient and accurate image super-resolution. arXiv 2018, arXiv:1808.08718. [Google Scholar]
- Kim, J.; Lee, J.K.; Lee, K.M. Accurate image super-resolution using very deep convolutional networks. In Proceedings of the IEEE Conference on Computer Vision and Pattern Recognition, Las Vegas, NV, USA, 27–30 June 2016; pp. 1646–1654. [Google Scholar]
- Lim, B.; Son, S.; Kim, H.; Nah, S.; Lee, K.M. Enhanced Deep Residual Networks for Single Image Super-Resolution. In Proceedings of the 2017 IEEE Conference on Computer Vision and Pattern Recognition Workshops (CVPRW), Honolulu, HI, USA, 21–26 July 2017. [Google Scholar]
- Hartley, R.; Zisserman, A. Multiple View Geometry in Computer Vision; Cambridge University Press: Cambridge, UK, 2003. [Google Scholar]
- Bay, H.; Ess, A.; Tuytelaars, T.; Van Gool, L. SURF: Speeded Up Robust Features. Comput. Vis. Image Underst. (CVIU) 2008, 110, 346–359. [Google Scholar] [CrossRef]
- Lowe, D.G. Object recognition from local scale-invariant features. In Proceedings of the IEEE International Conference on Computer Vision, Kerkyra, Greece, 20–27 September 1999; Volume 2, pp. 1150–1157. [Google Scholar]
- Chen, H.; Goela, A.; Garvin, G.J.; Li, S. A Parameterization of Deformation Fields for Diffeomorphic Image Registration and Its Application to Myocardial Delineation. Med. Image Comput. Comput.-Assist. Interv. 2010, 13, 340–348. [Google Scholar] [PubMed]
- Tibshirani, R.; Walther, G.; Hastie, T. Estimating the number of data clusters via the gap statistic. J. R. Stat. Soc. B 2001, 63, 411–423. [Google Scholar] [CrossRef]
- Garzelli, A.; Nencini, F.; Capobianco, L. Optimal MMSE Pan sharpening of very high resolution multispectral images. IEEE Trans. Geosci. Remote Sens. 2008, 46, 228–236. [Google Scholar] [CrossRef]
- Choi, J.; Yu, K.; Kim, Y. A new adaptive component-substitution-based satellite image fusion by using partial replacement. IEEE Trans. Geosci. Remote Sens. 2011, 49, 295–309. [Google Scholar] [CrossRef]
- Reed, I.S.; Yu, X. Adaptive multiple-band CFAR detection of an optical pattern with unknown spectral distribution. IEEE Trans. Acoust. Speech Signal Proc. 1990, 38, 1760–1770. [Google Scholar] [CrossRef]
- Li, W.; Tramel, E.W.; Prasad, S.; Fowler, J.E. Nearest regularized subspace for hyperspectral classification. IEEE Trans. Geosci. Remote Sens. 2014, 52, 477–489. [Google Scholar] [CrossRef] [Green Version]


| The Left Mastcam | The Right Mastcam | ||
|---|---|---|---|
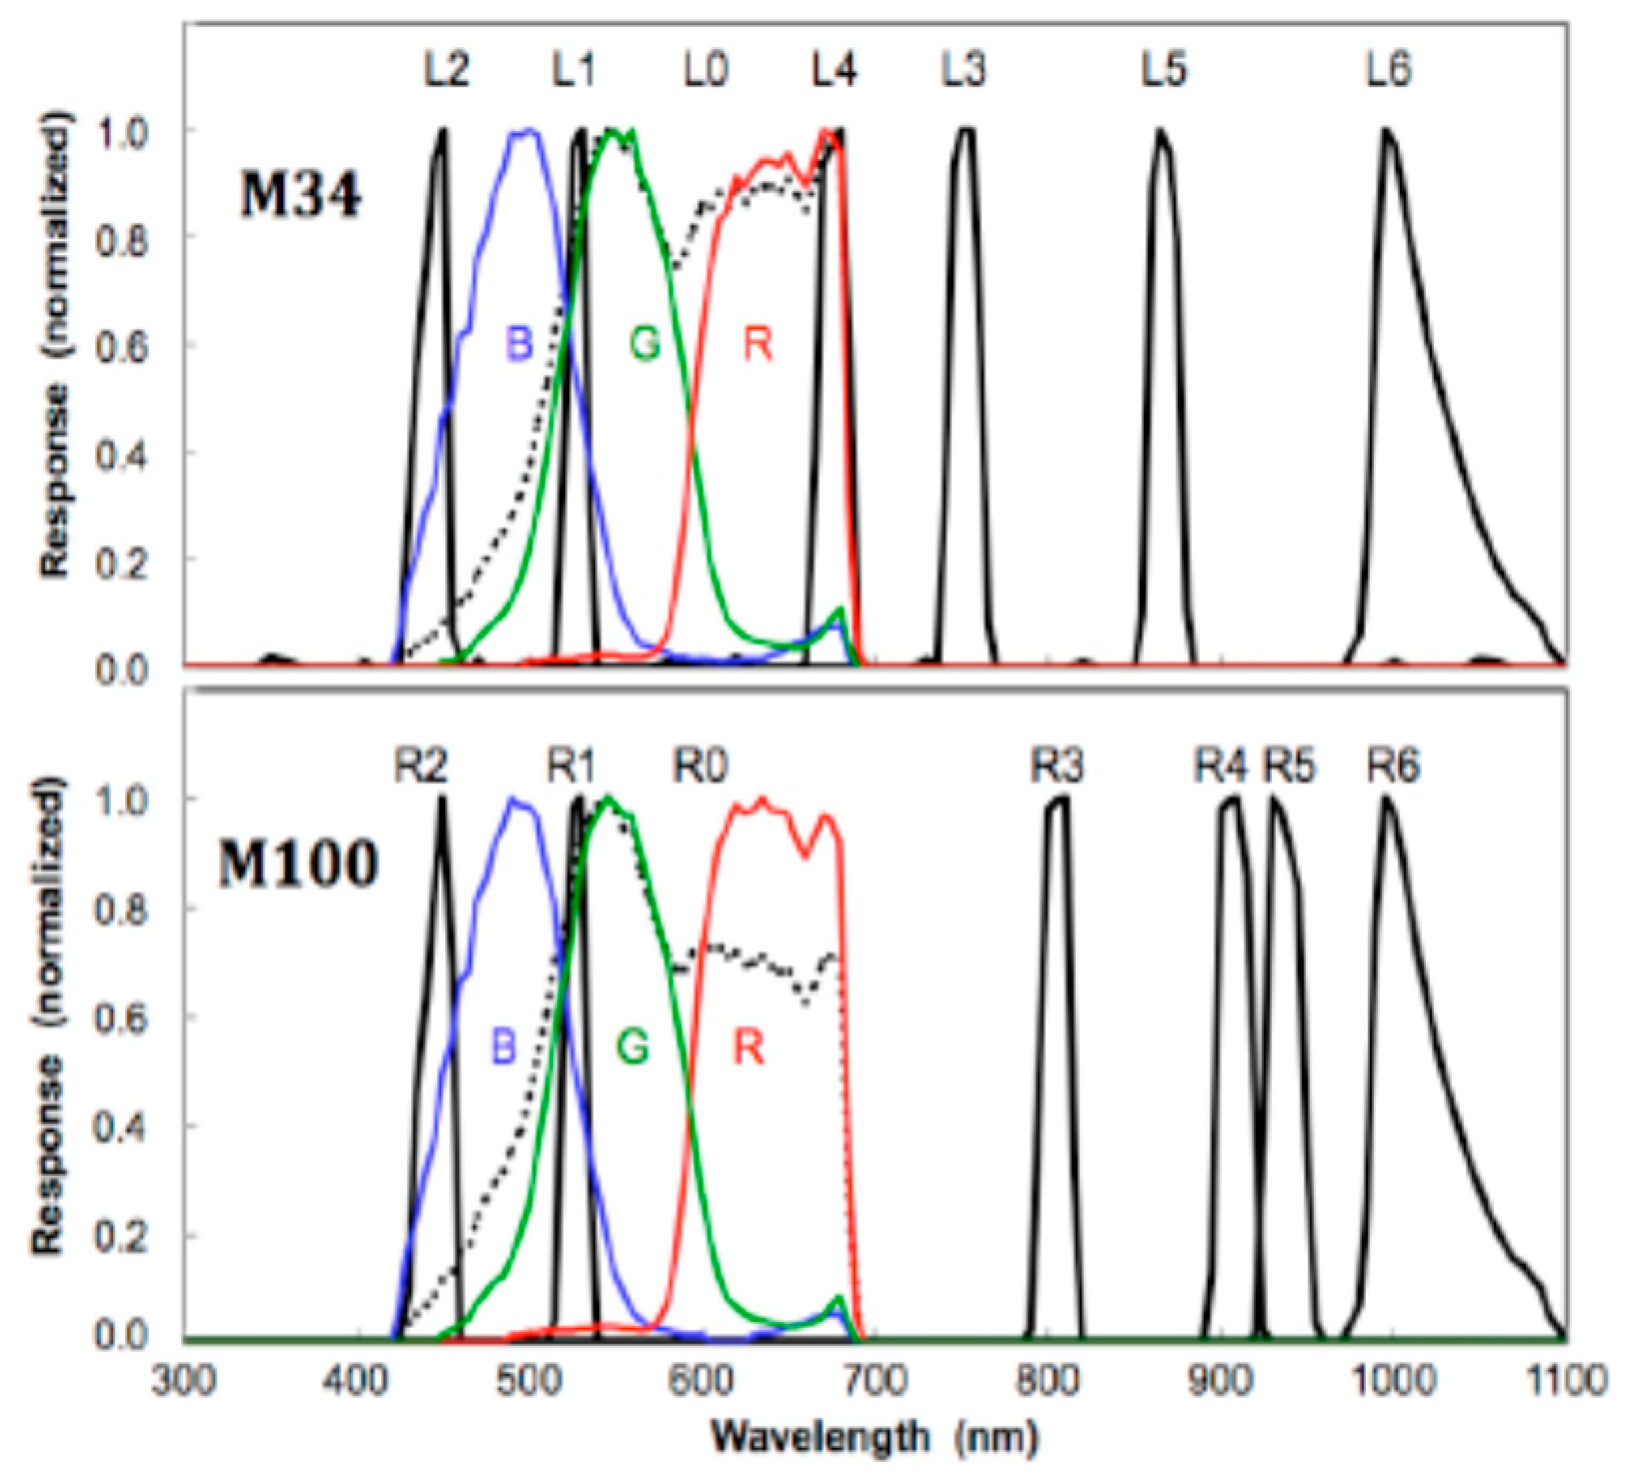
| Filter | Wavelength (nm) | Filter | Wavelength (nm) |
| L2 | 445 | R2 | 447 |
| L0B | 495 | R0B | 493 |
| L1 | 527 | R1 | 527 |
| L0G | 554 | R0G | 551 |
| L0R | 640 | R0R | 638 |
| L4 | 676 | R3 | 805 |
| L3 | 751 | R4 | 908 |
| L5 | 867 | R5 | 937 |
| L6 | 1012 | R6 | 1013 |
| Methods | RMSE | SAM |
|---|---|---|
| CNMF | 0.056 | 2.48 |
| Proposed | 0.033 | 2.09 |
Publisher’s Note: MDPI stays neutral with regard to jurisdictional claims in published maps and institutional affiliations. |
© 2021 by the author. Licensee MDPI, Basel, Switzerland. This article is an open access article distributed under the terms and conditions of the Creative Commons Attribution (CC BY) license (https://creativecommons.org/licenses/by/4.0/).
Share and Cite
Kwan, C. A Brief Review of Some Interesting Mars Rover Image Enhancement Projects. Computers 2021, 10, 111. https://doi.org/10.3390/computers10090111
Kwan C. A Brief Review of Some Interesting Mars Rover Image Enhancement Projects. Computers. 2021; 10(9):111. https://doi.org/10.3390/computers10090111
Chicago/Turabian StyleKwan, Chiman. 2021. "A Brief Review of Some Interesting Mars Rover Image Enhancement Projects" Computers 10, no. 9: 111. https://doi.org/10.3390/computers10090111
APA StyleKwan, C. (2021). A Brief Review of Some Interesting Mars Rover Image Enhancement Projects. Computers, 10(9), 111. https://doi.org/10.3390/computers10090111