


Design of Vehicle Tunnel Illumination Measurement Device Based on STC12C5A60S2 Single-Chip Microcomputer


Abstract
:1. Introduction
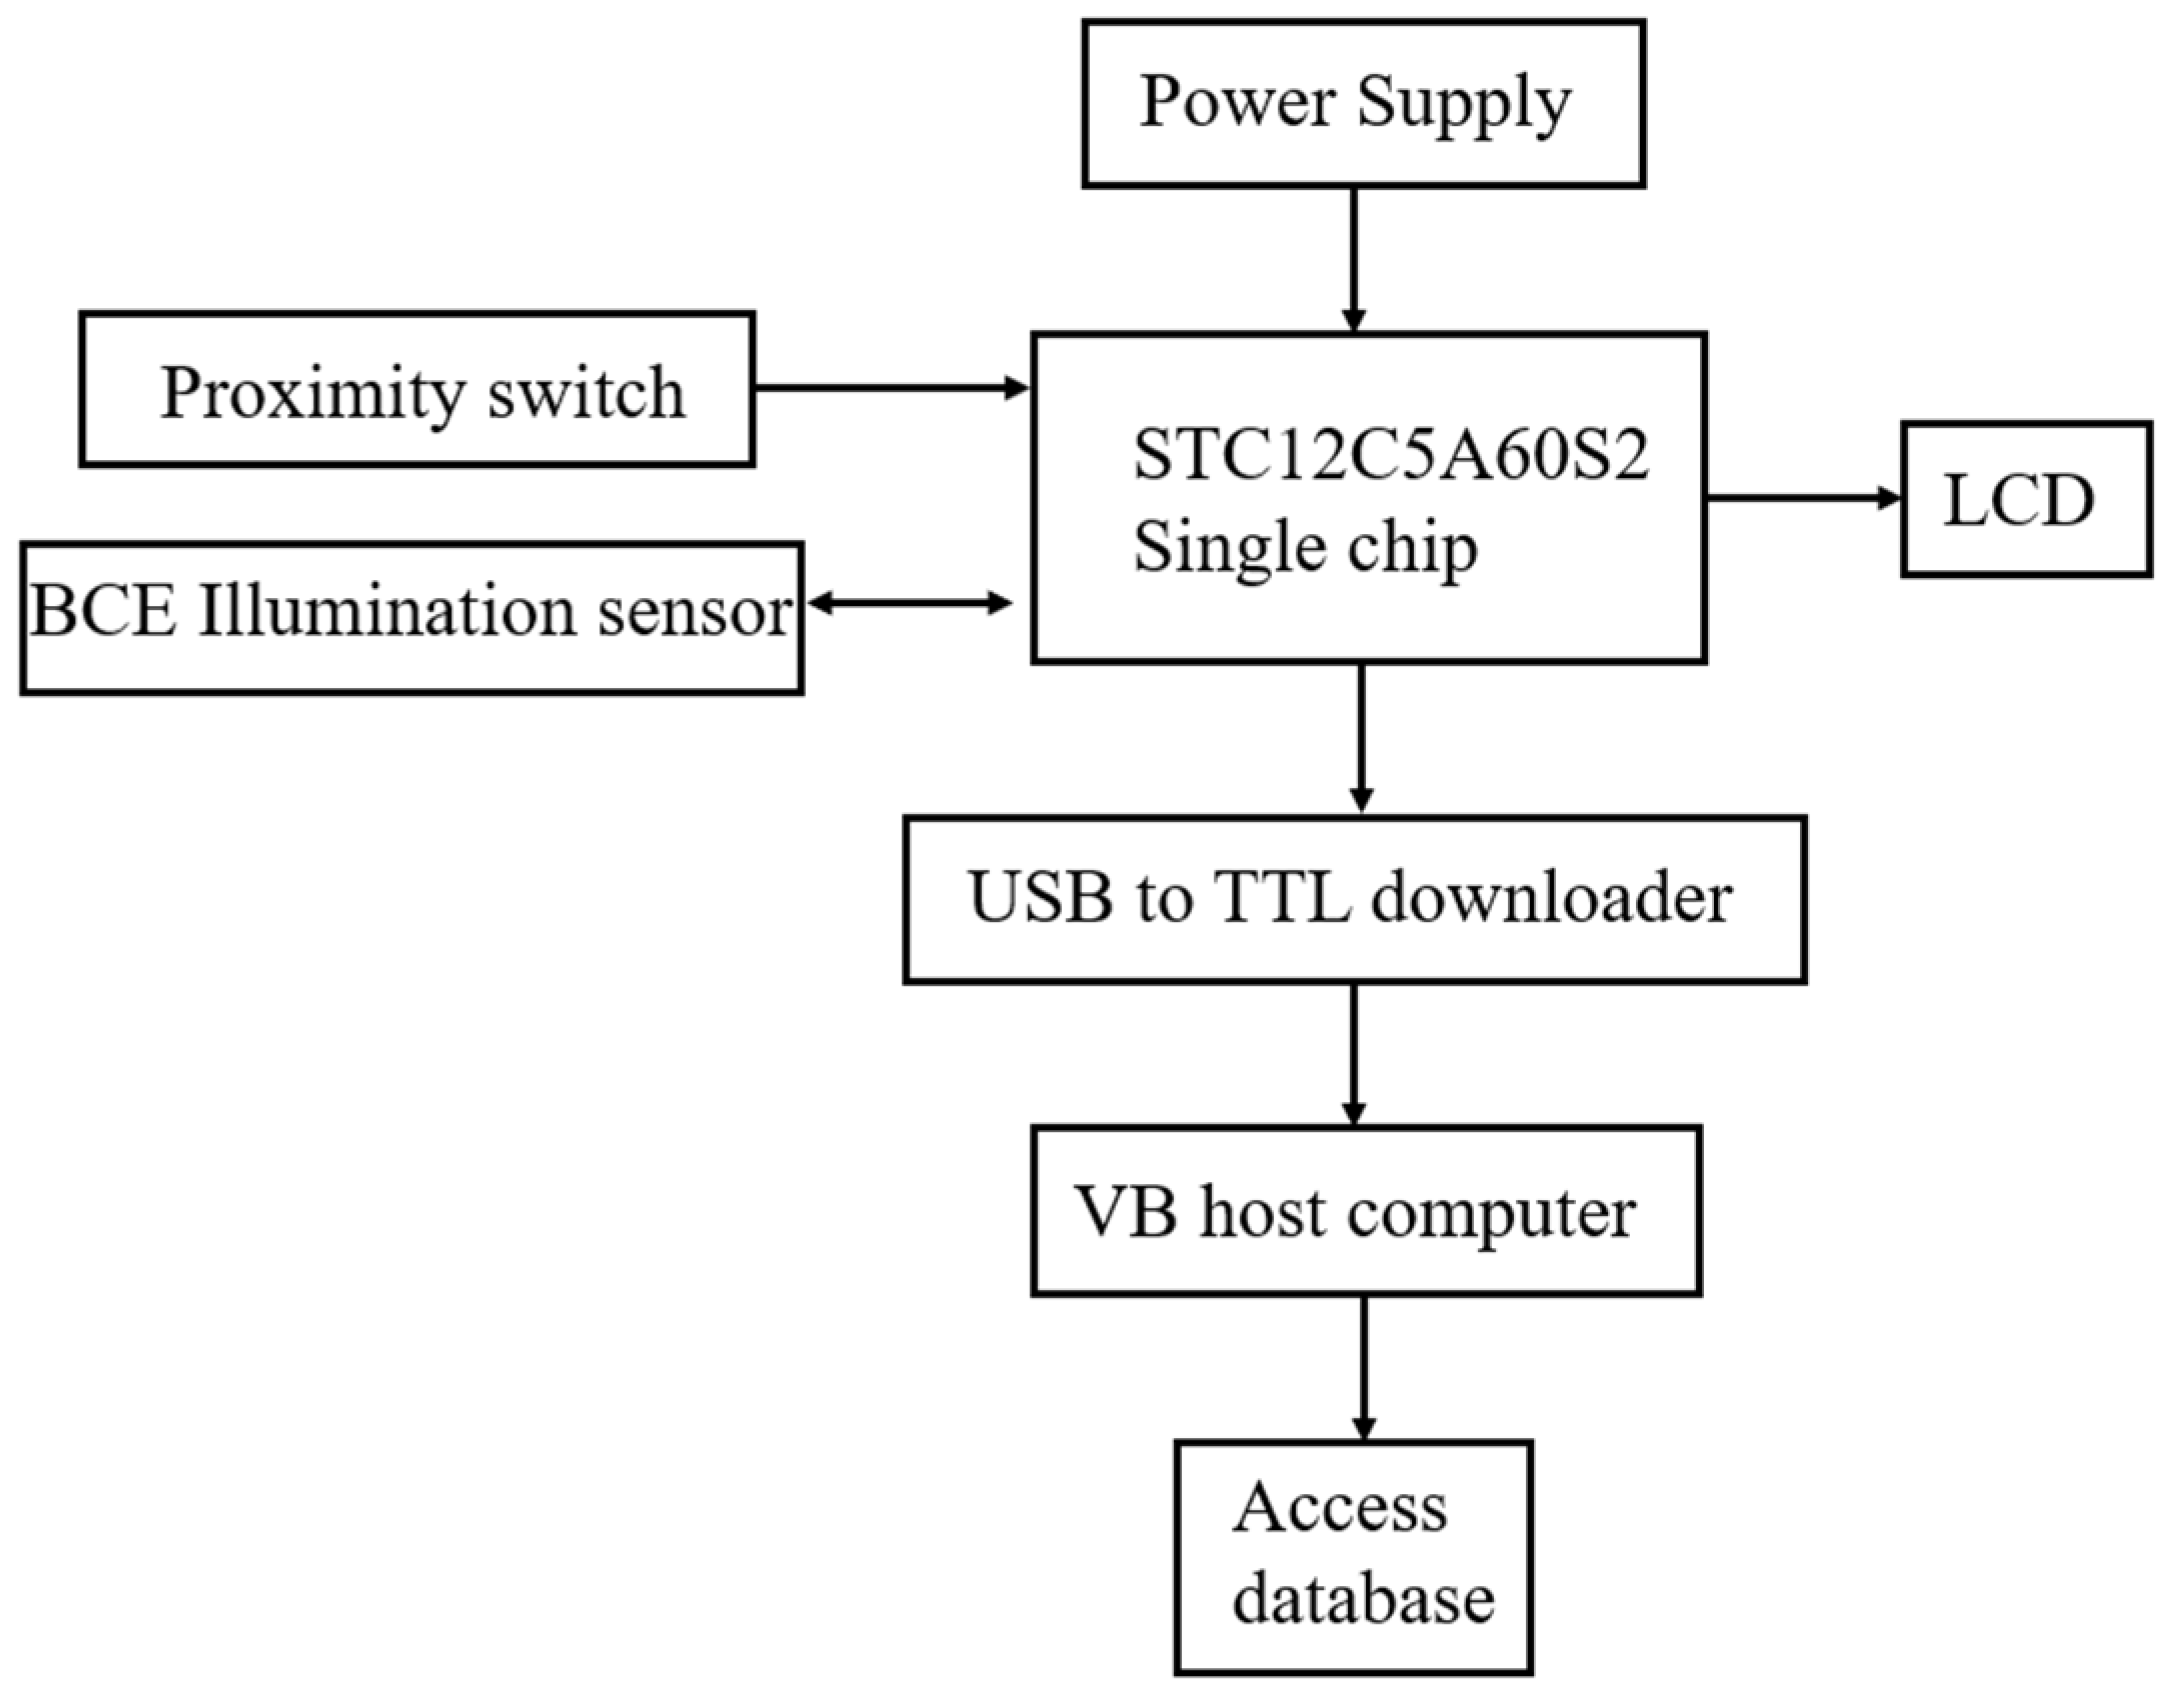
2. Working Principle and Hardware Design
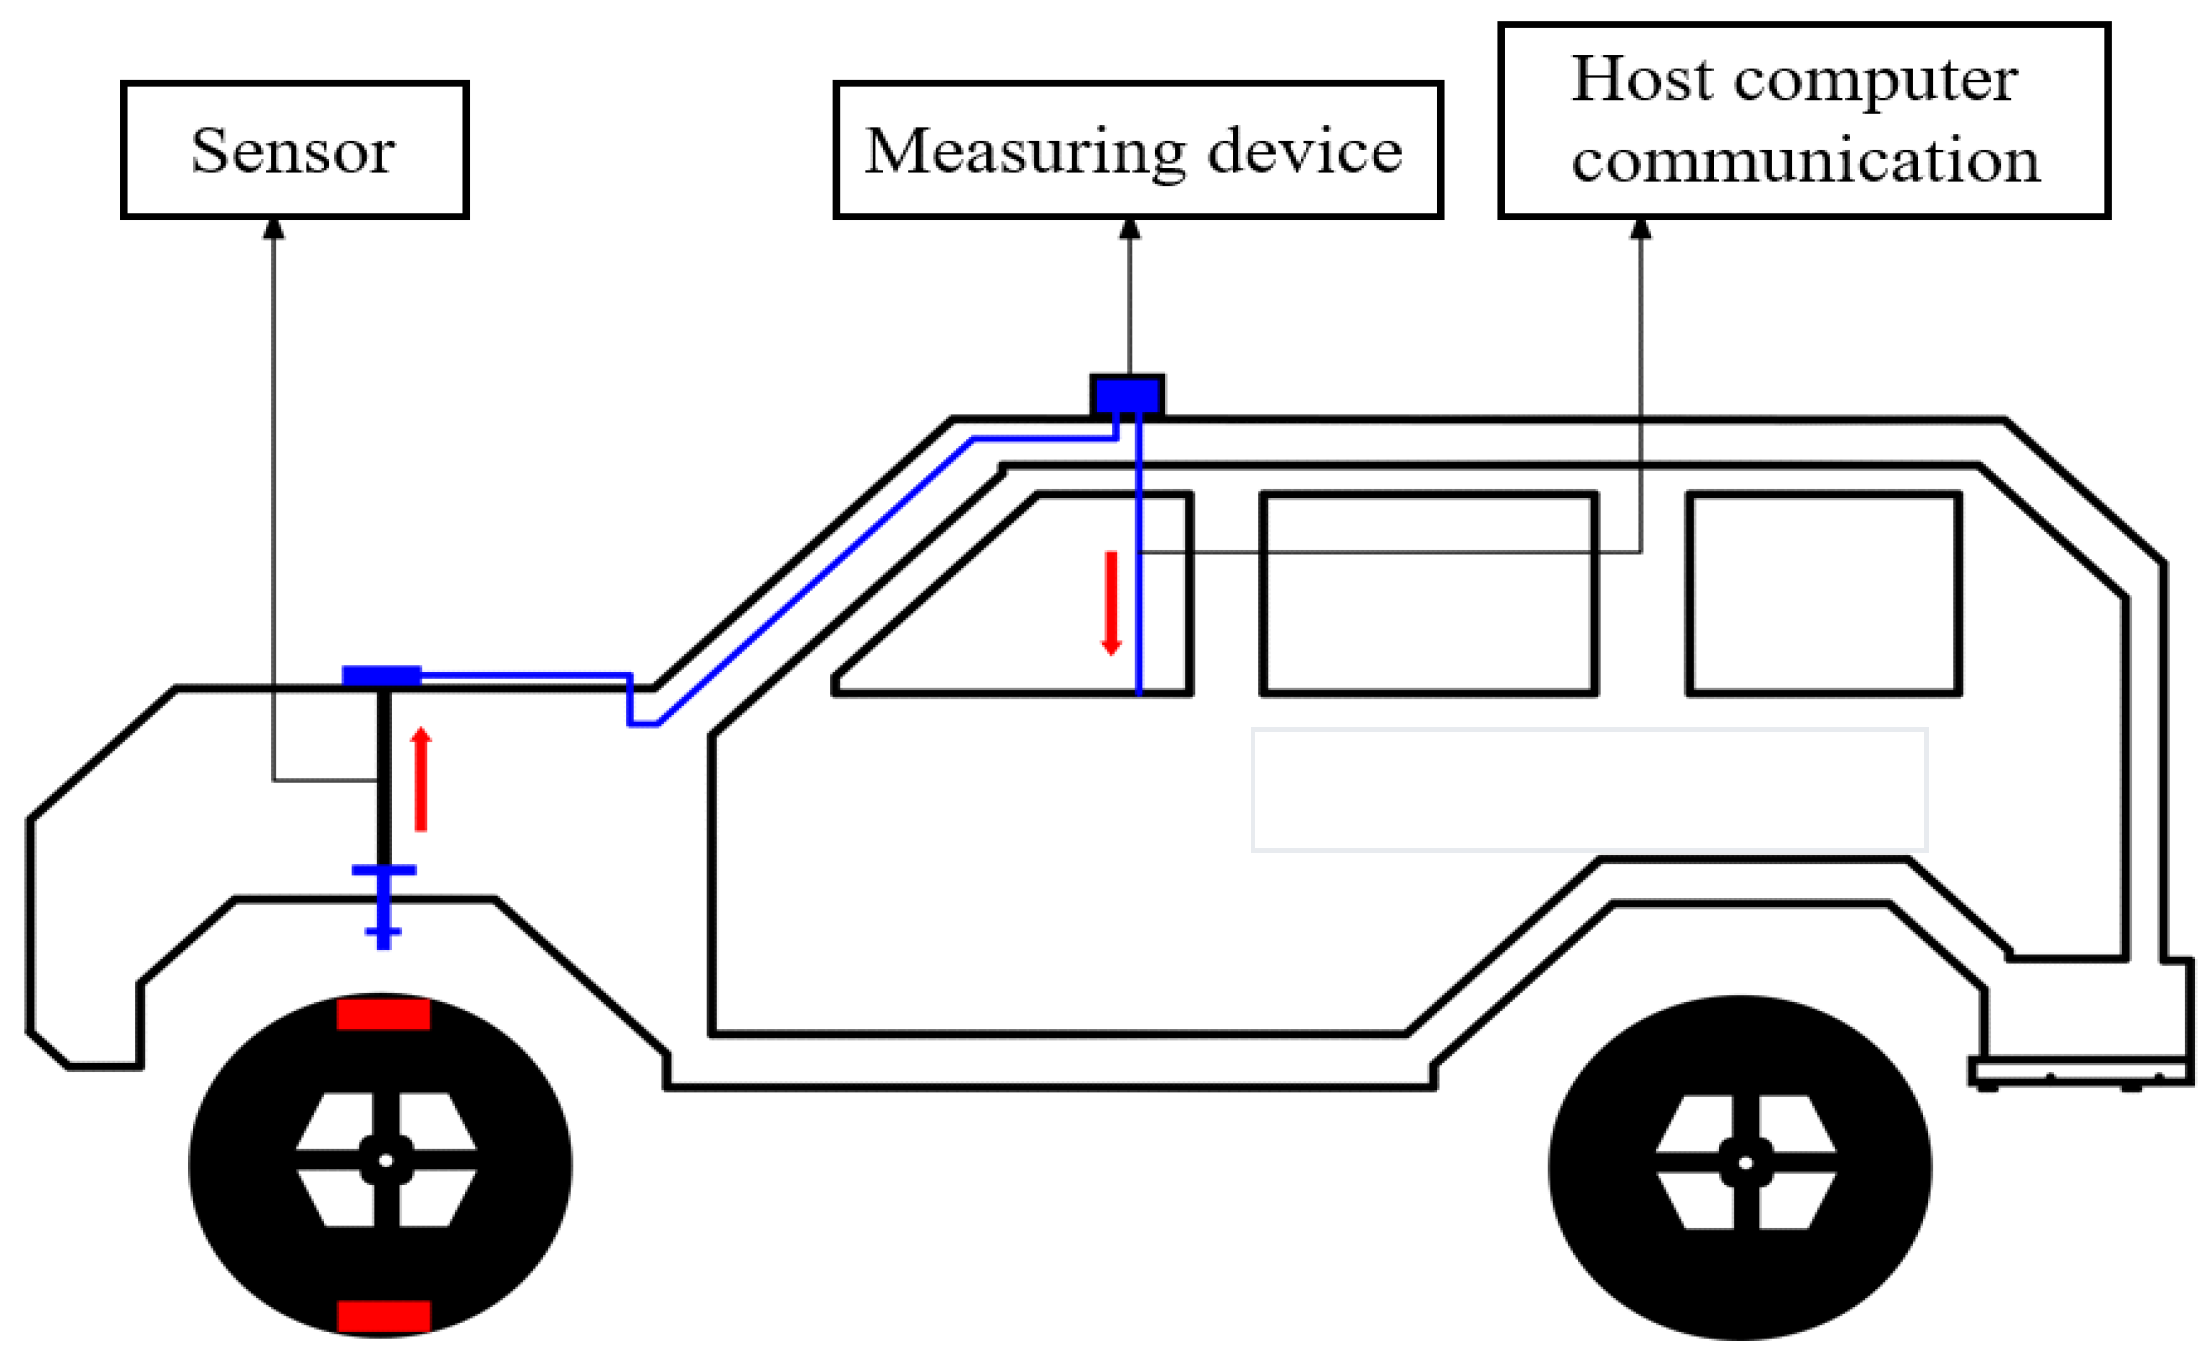
2.1. Working Principle of Measuring Device
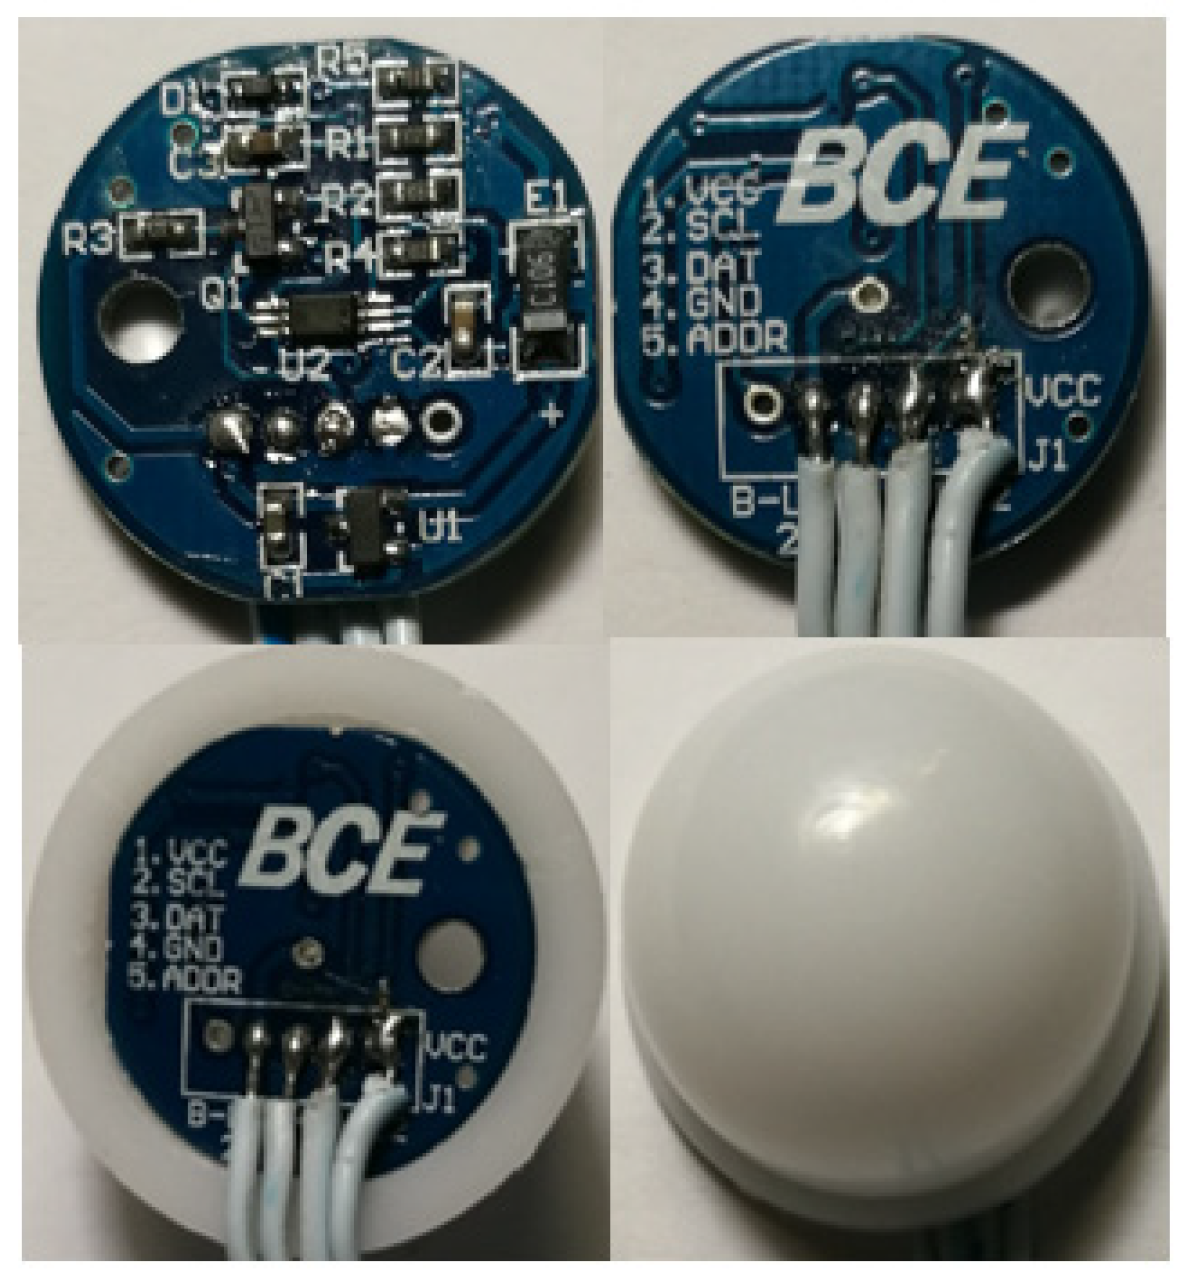
2.2. Measuring Module
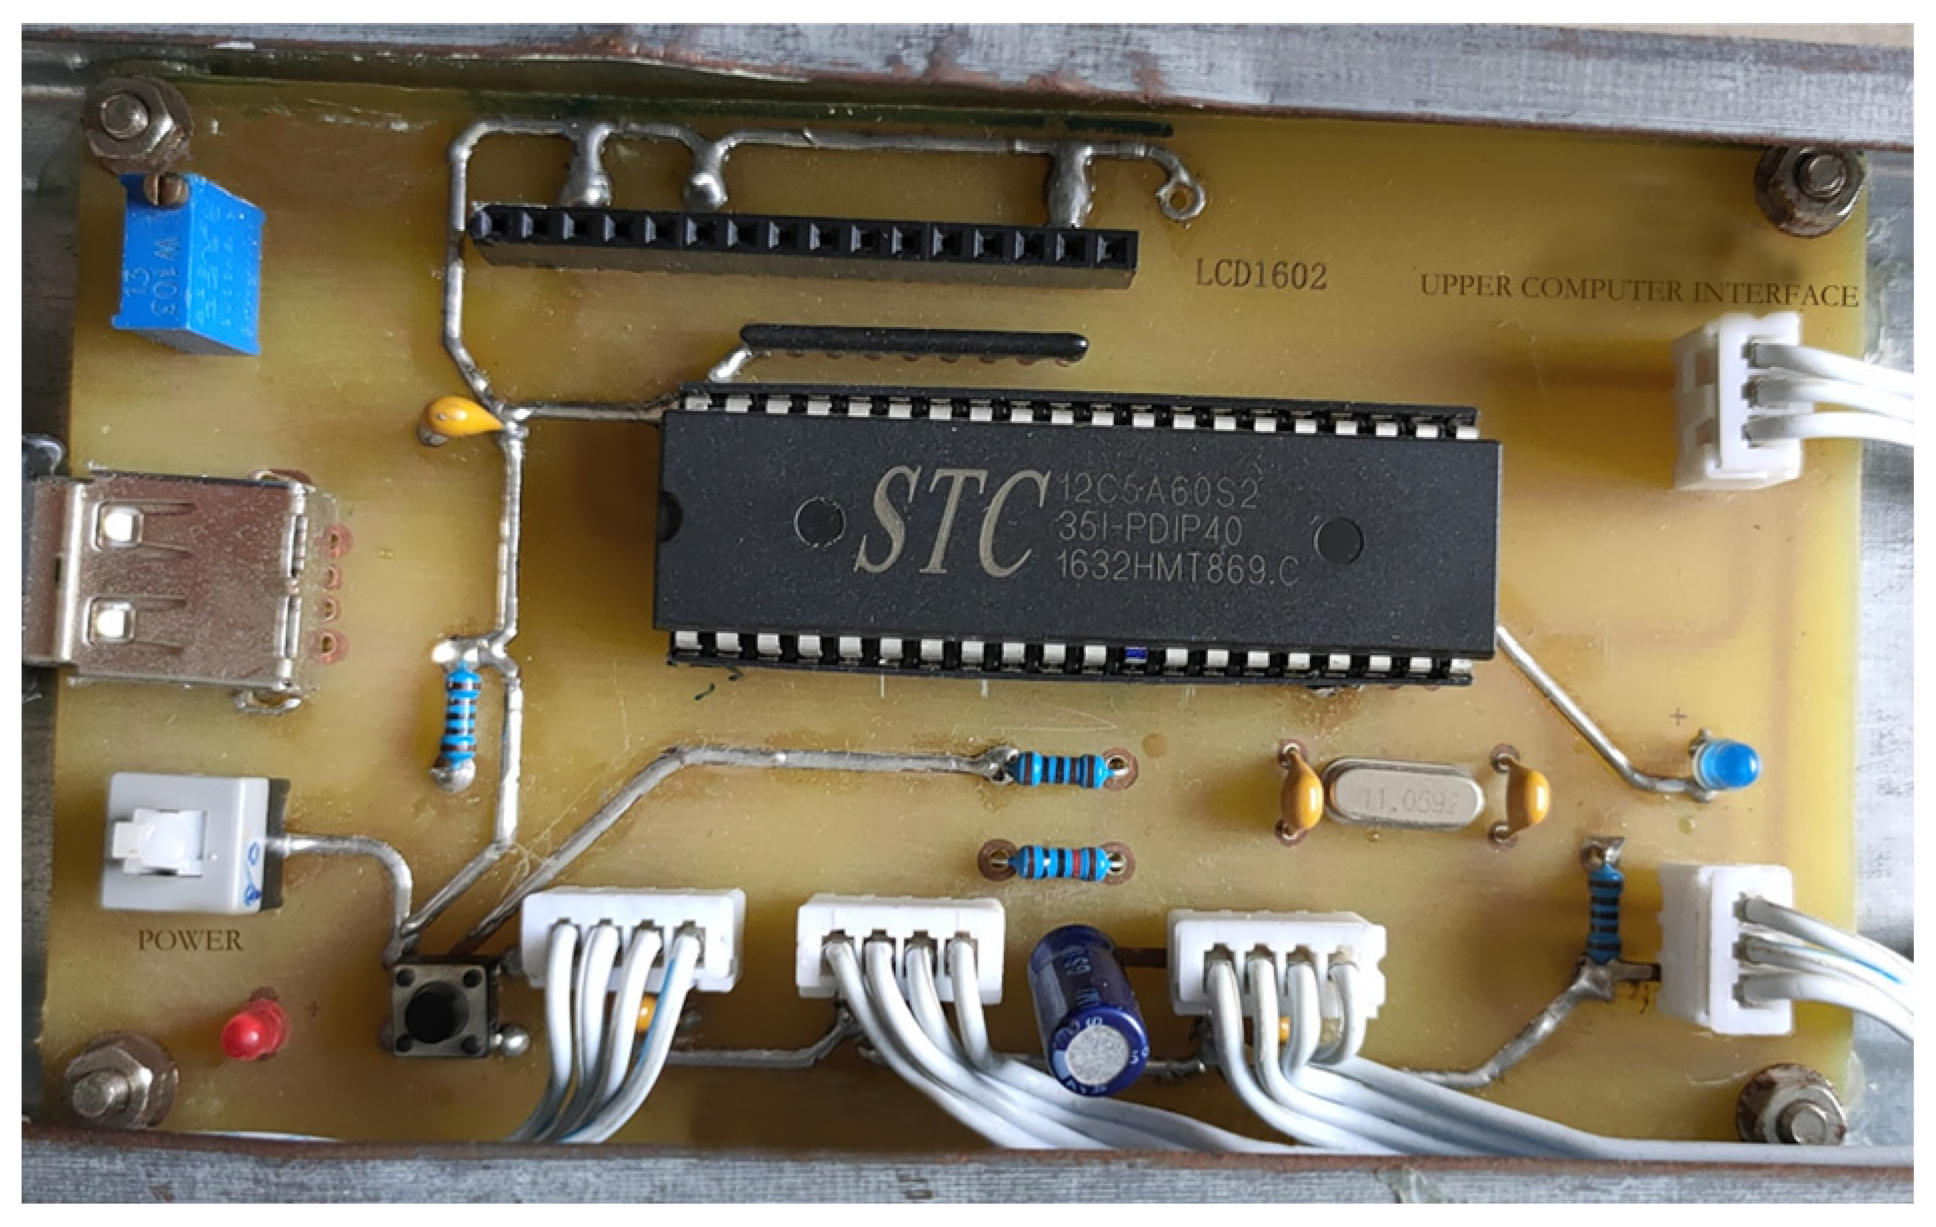
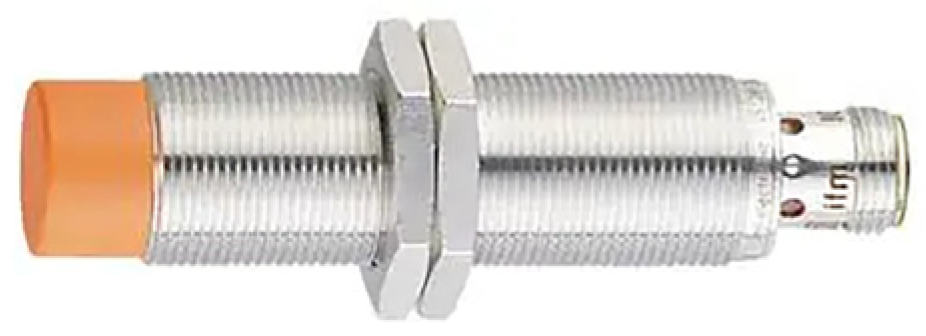
2.3. Control Module
2.4. Display Module
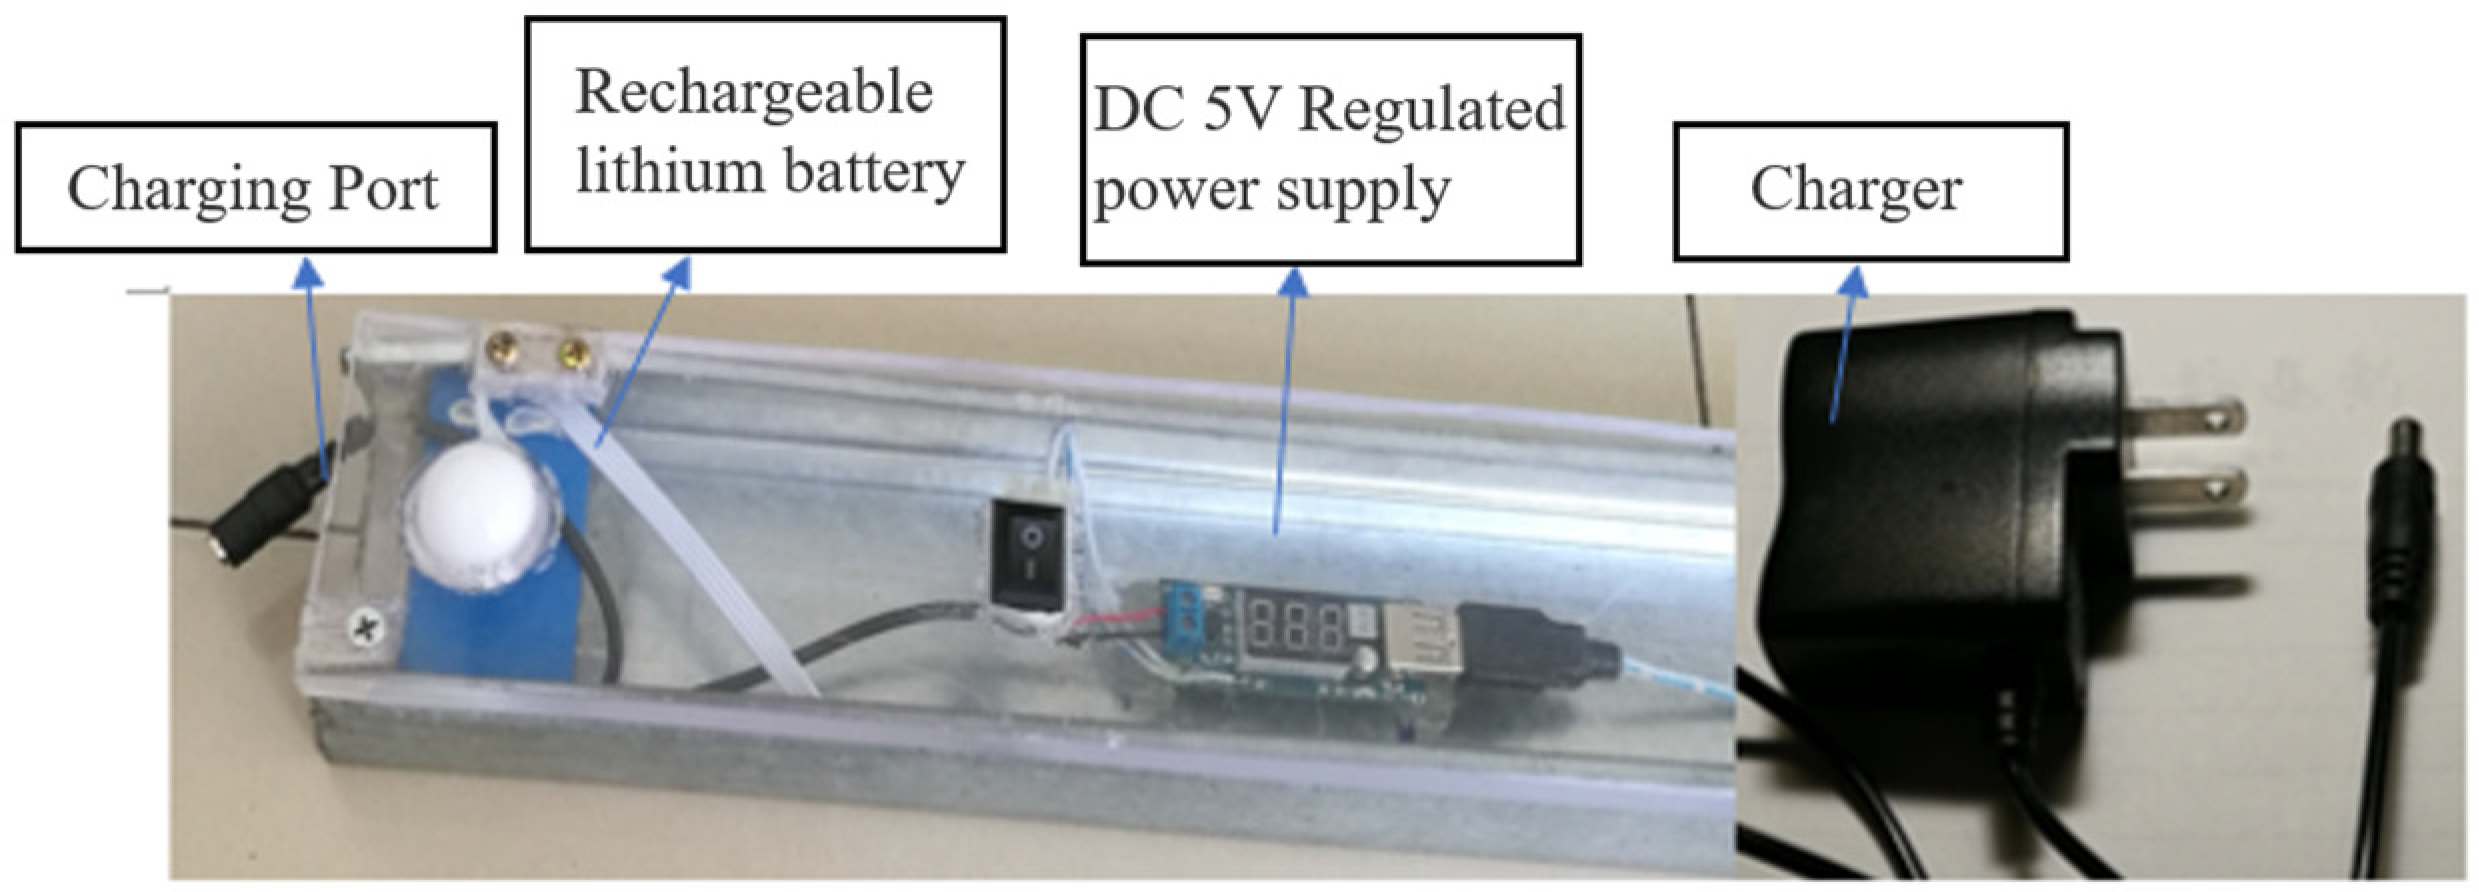
2.5. Power Module
3. Measuring Device Software Design
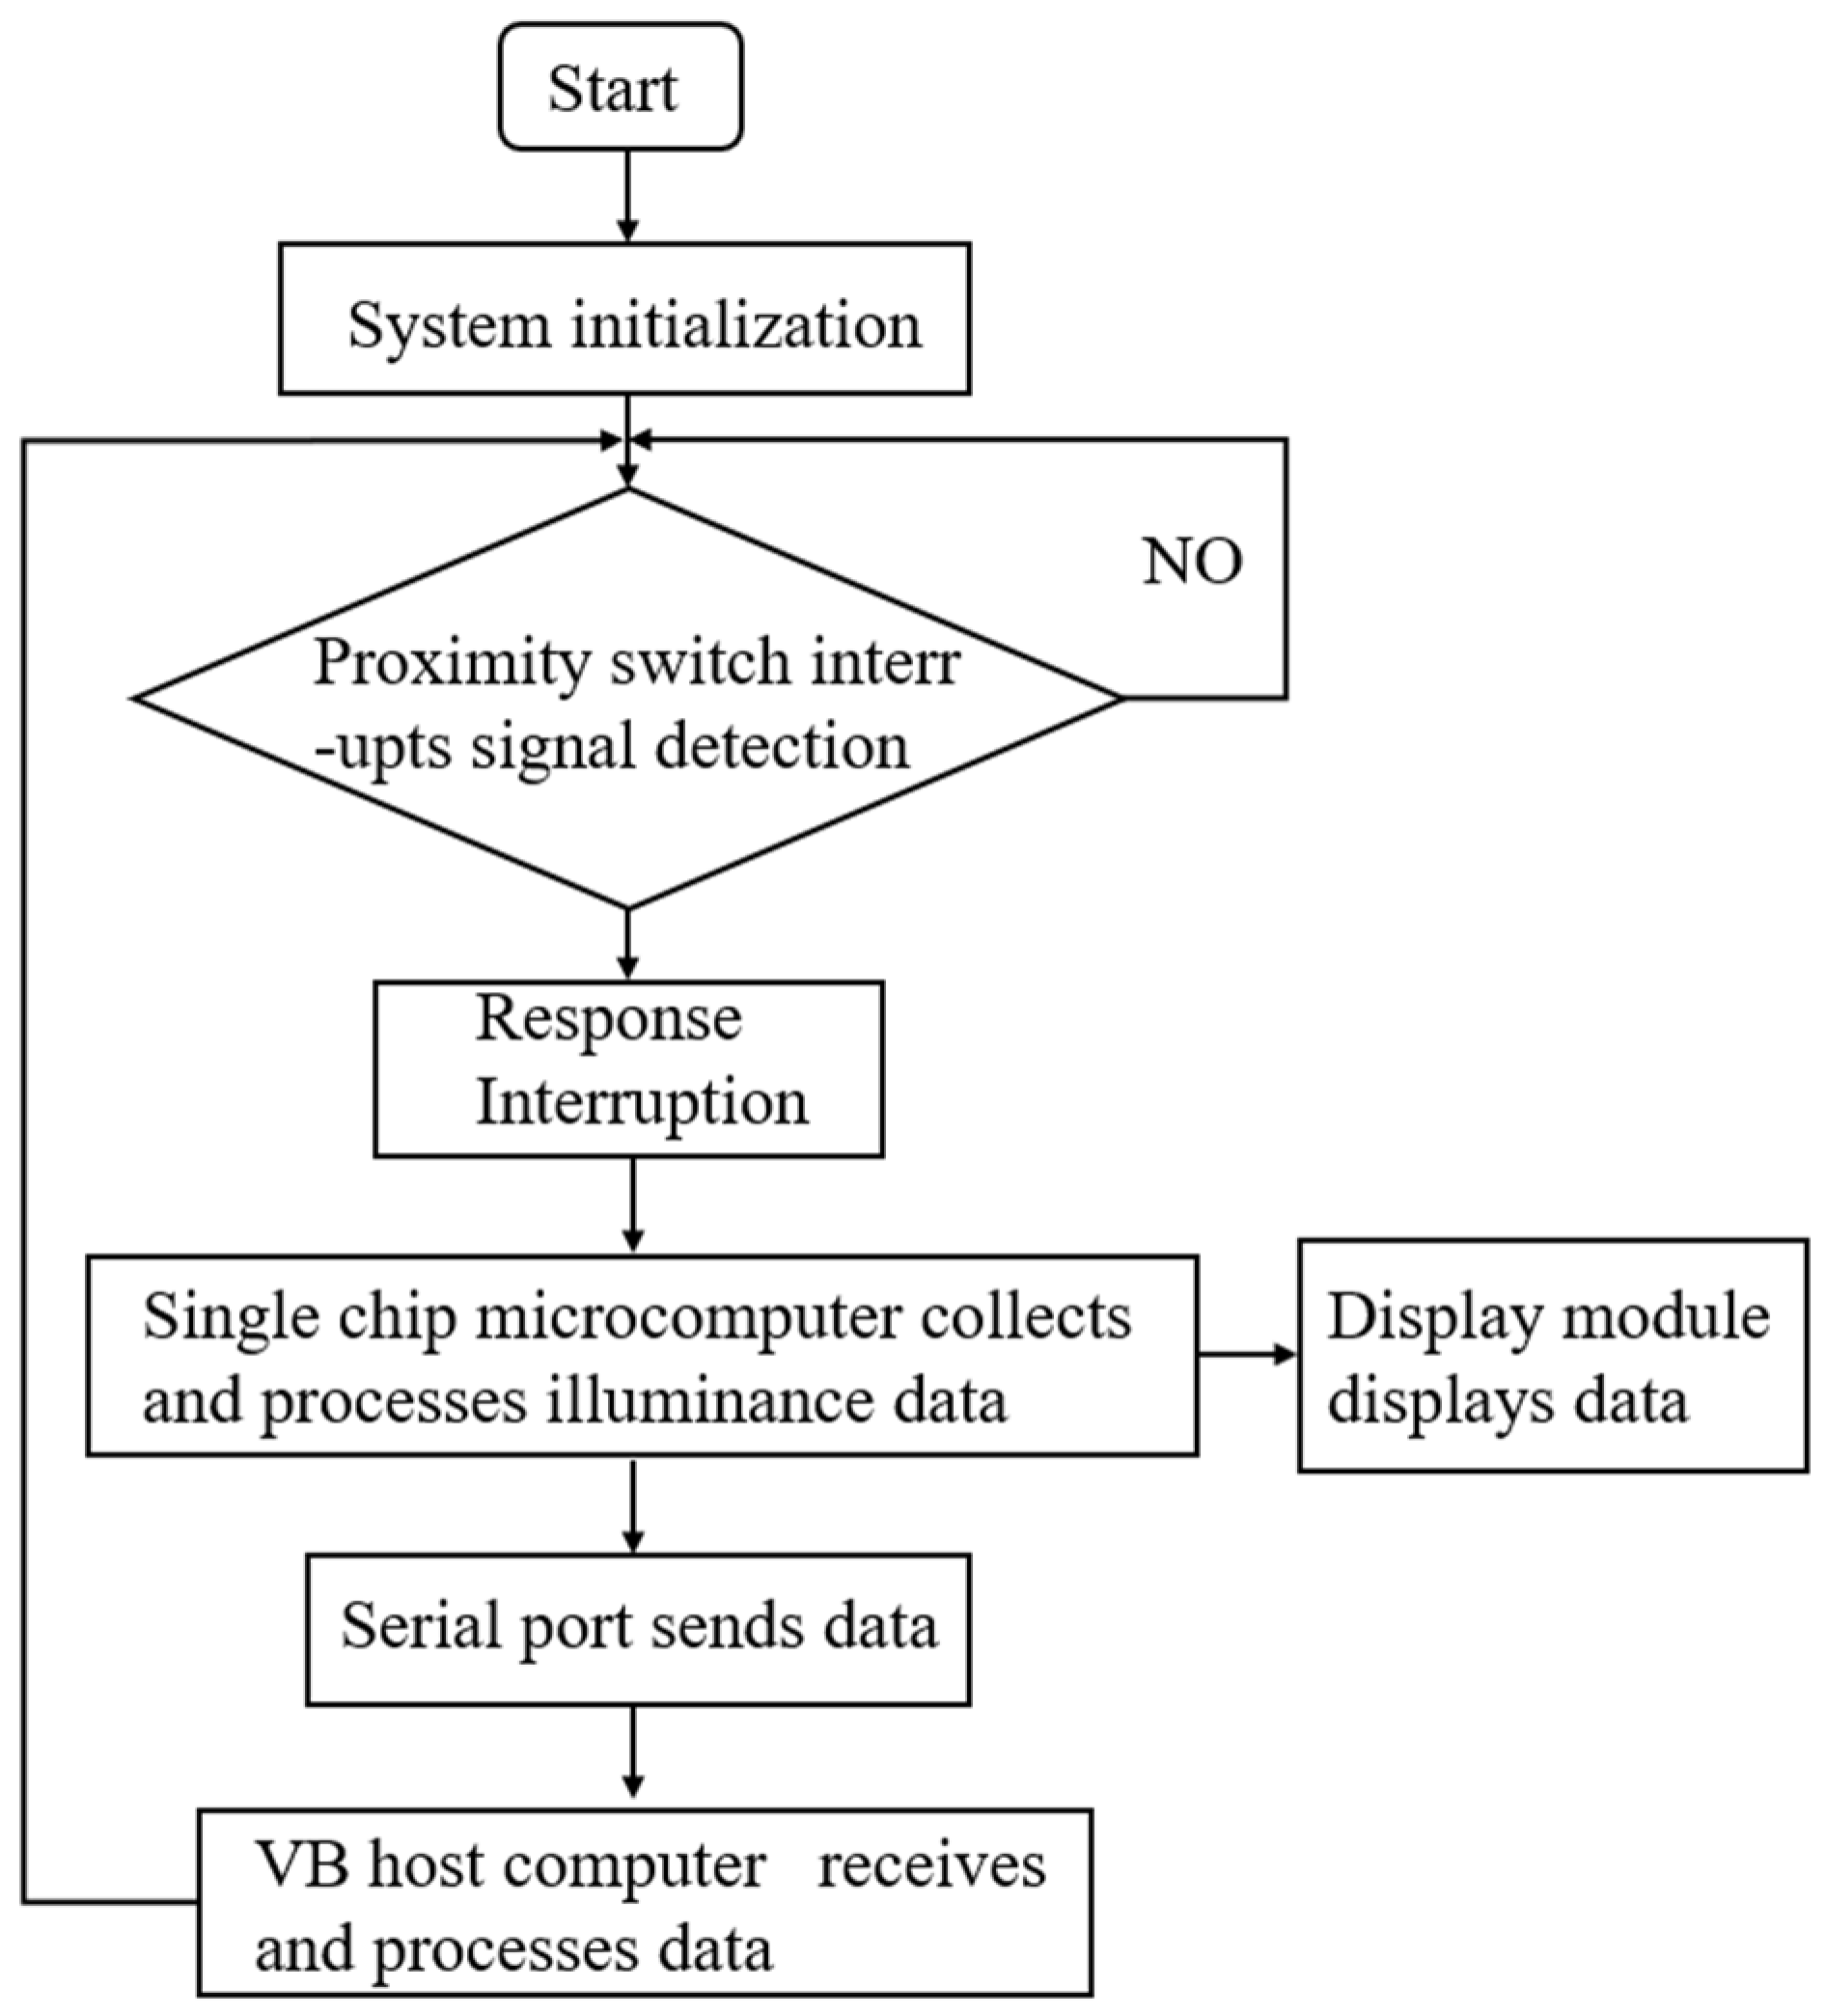
3.1. Single-Chip Microcomputer Program
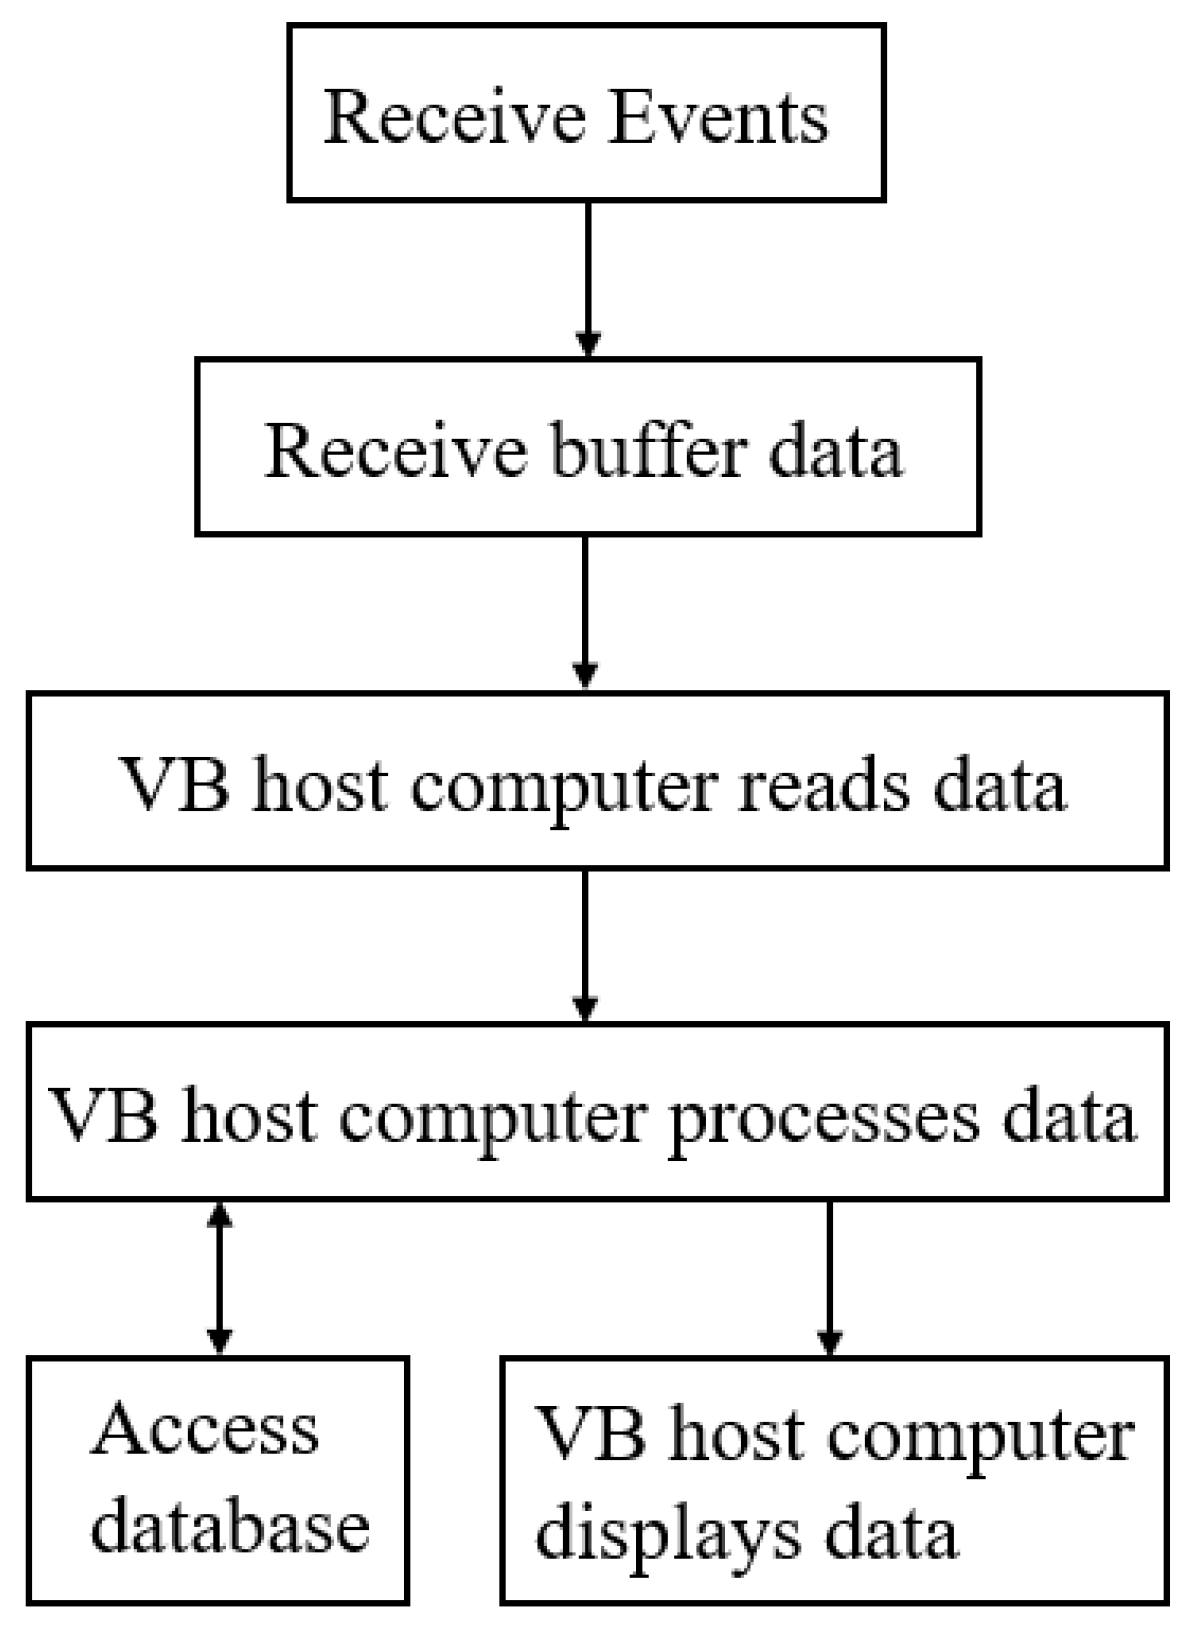
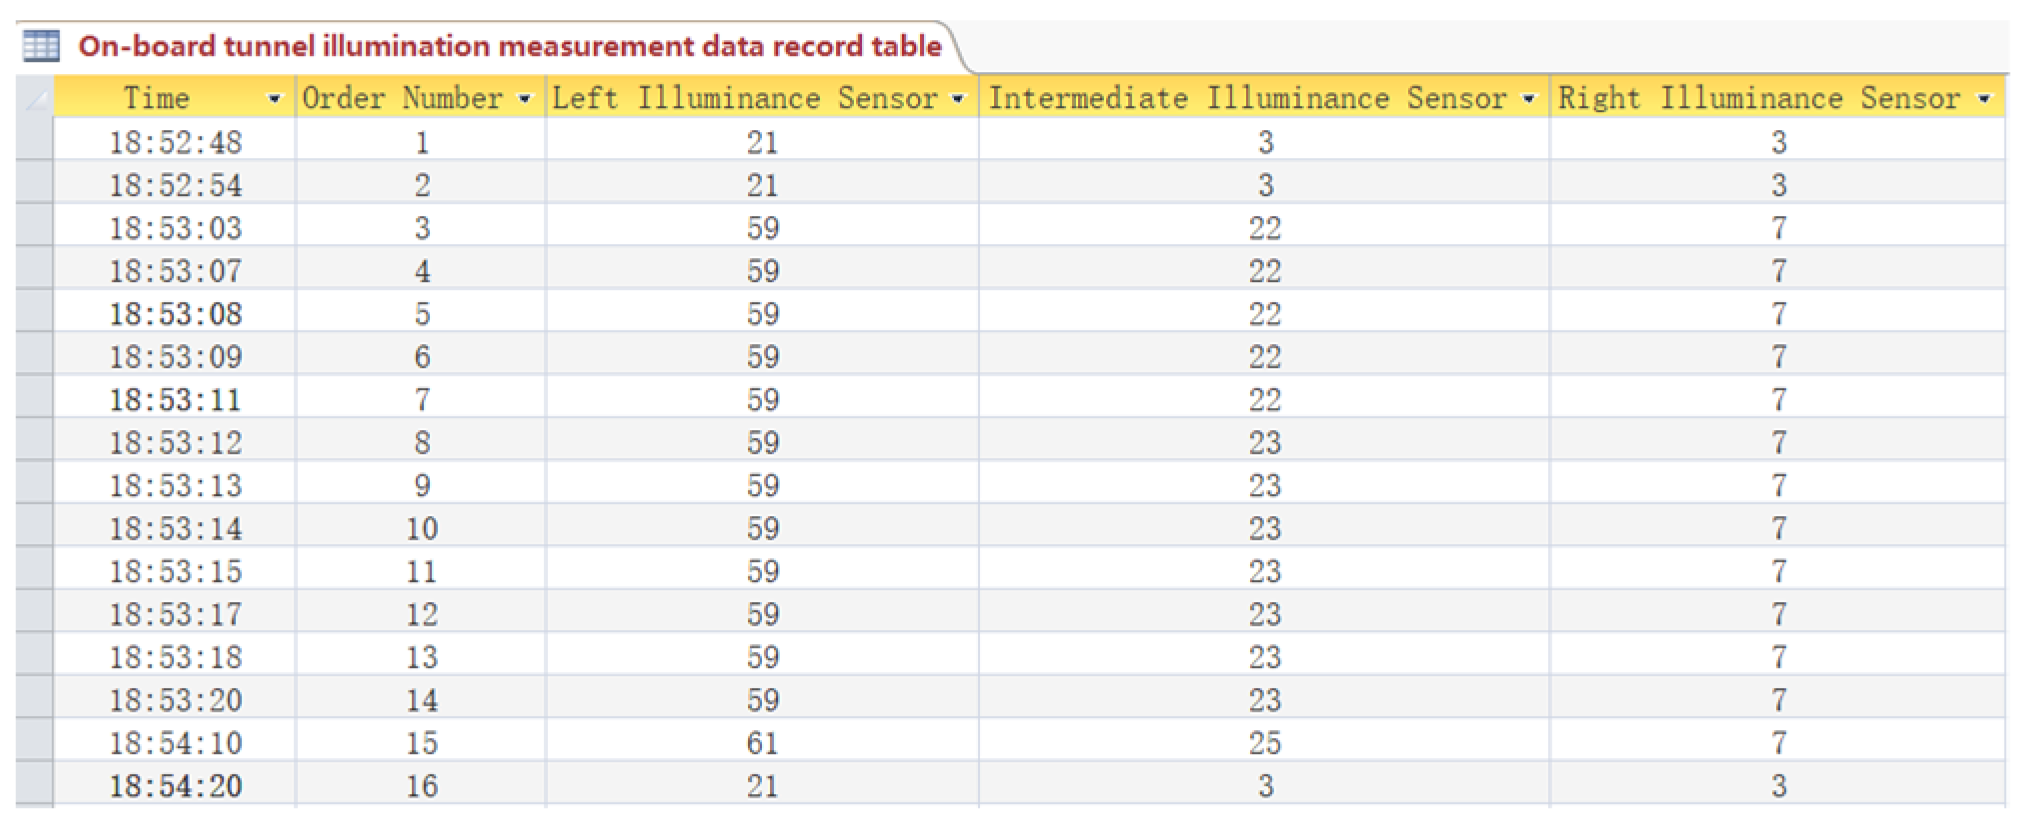
3.2. Upper Computer Program
4. Joint Debugging of Hardware and Software
4.1. Simulated Environment Test
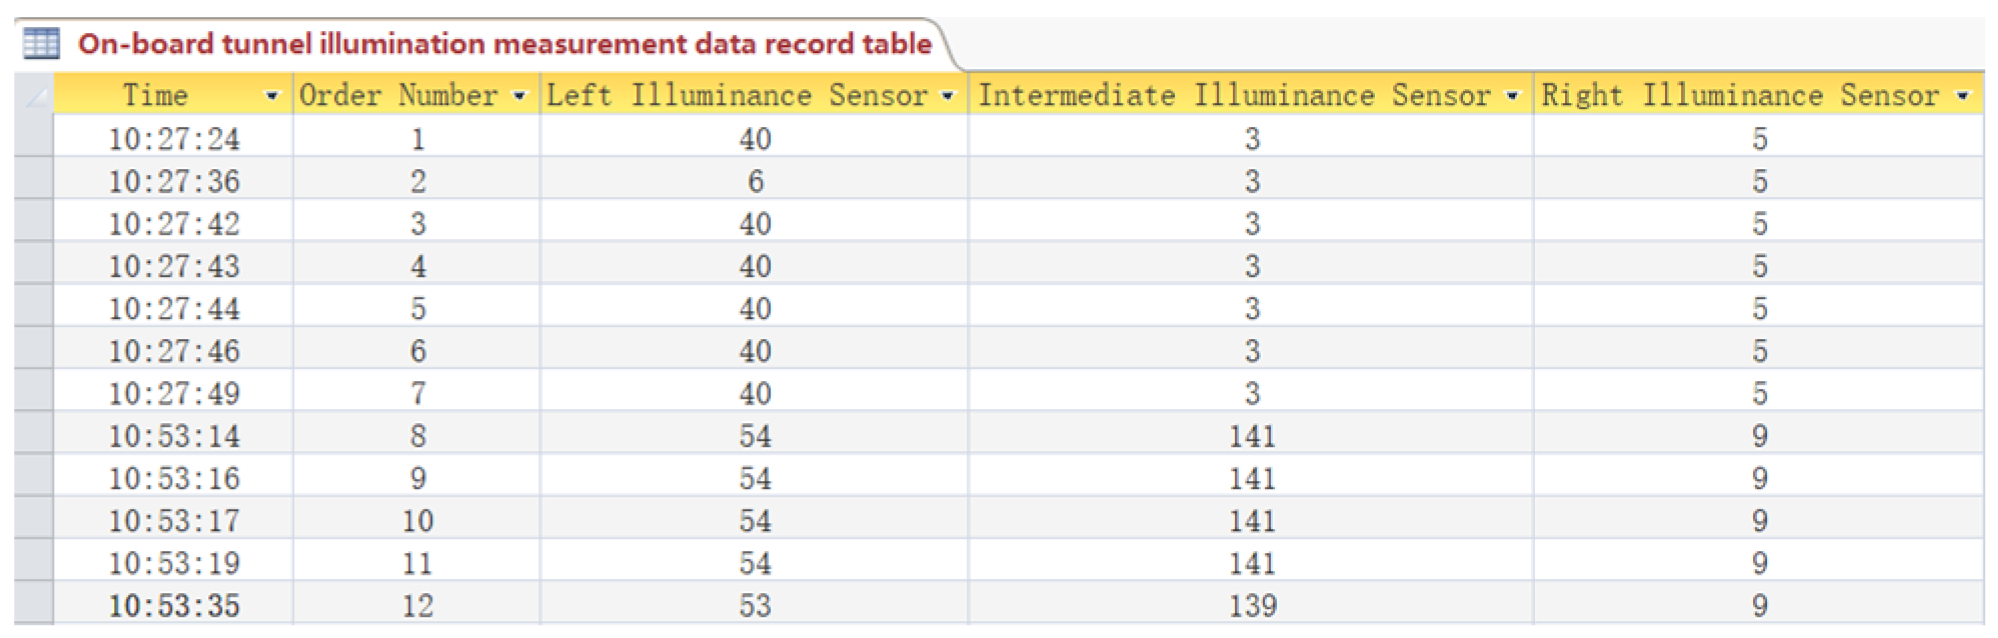
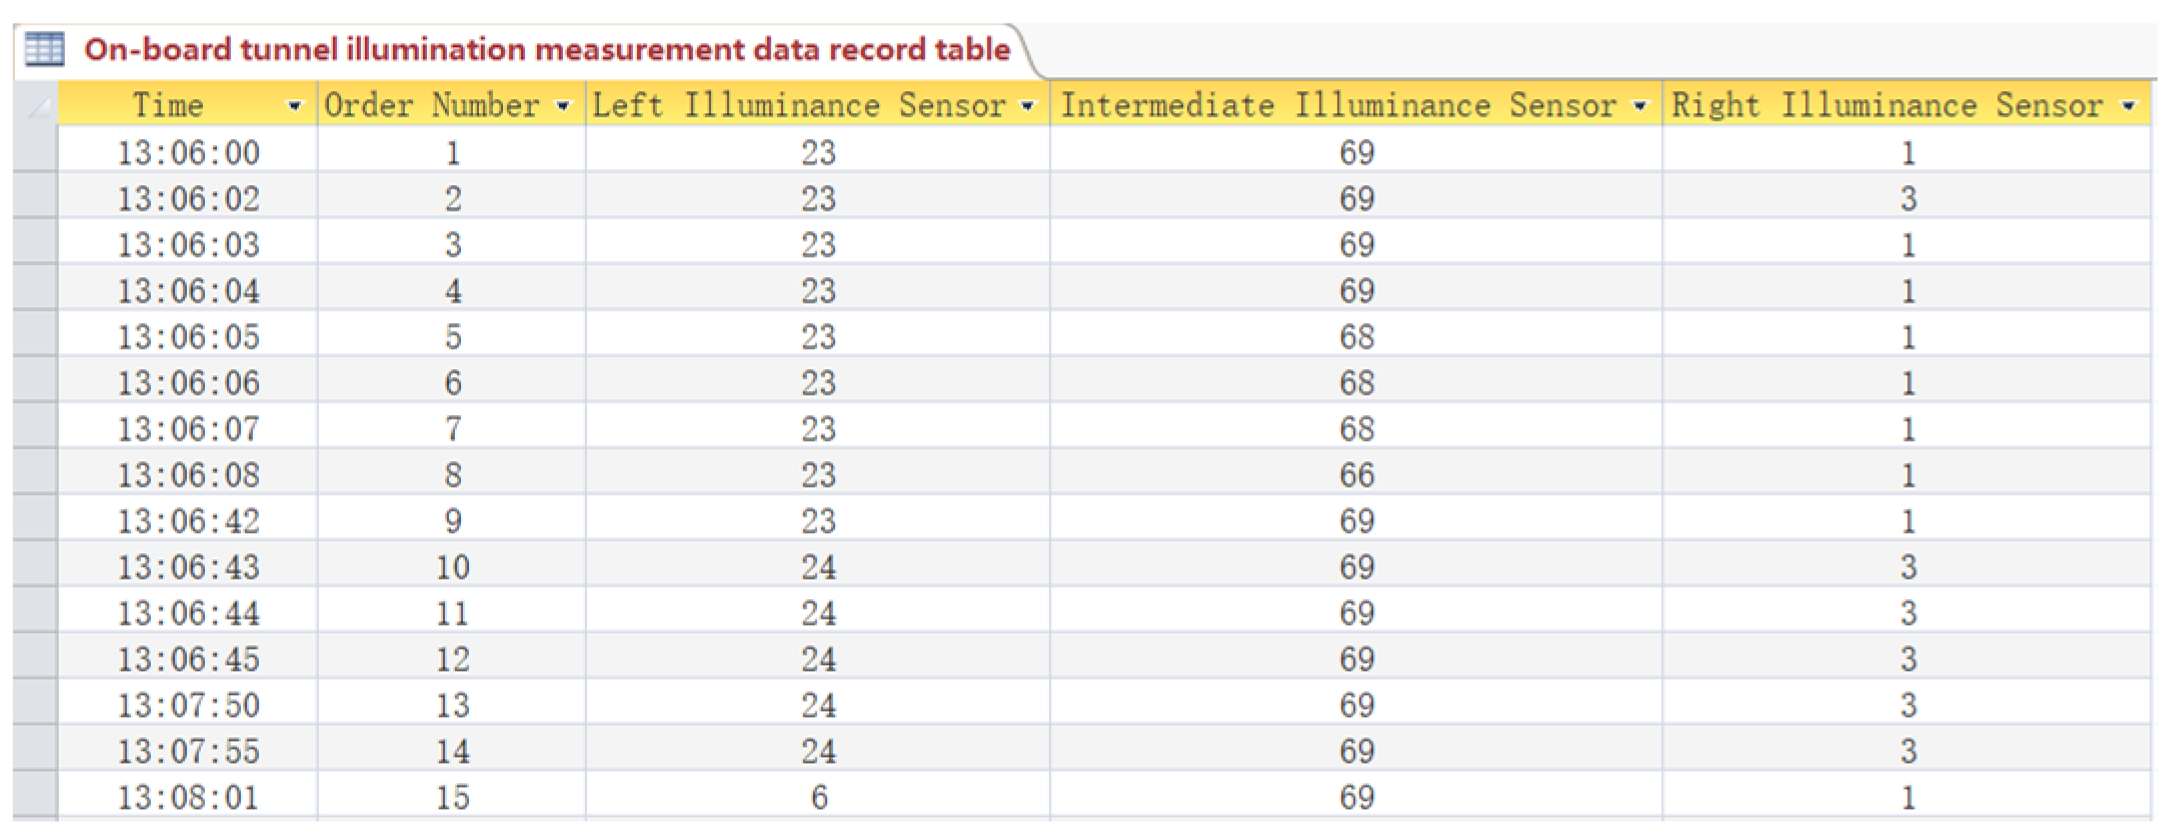
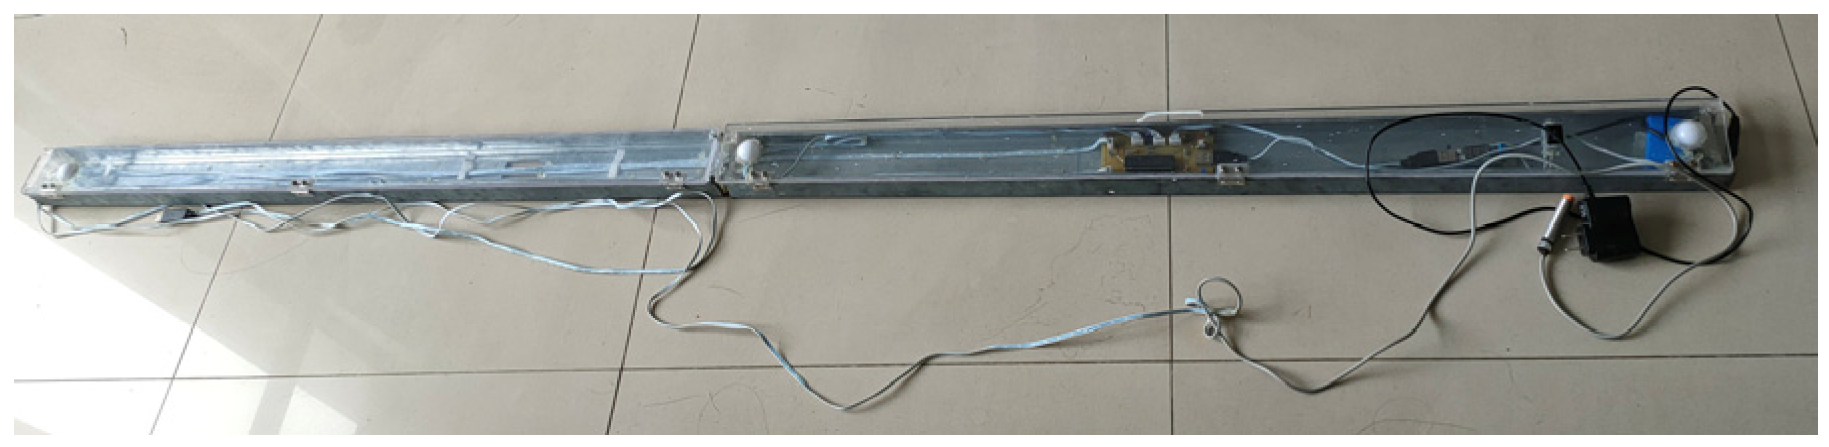
4.2. Actual Tunnel Test
5. Summary
Author Contributions
Funding
Institutional Review Board Statement
Informed Consent Statement
Data Availability Statement
Conflicts of Interest
References
- Ma, J. Research on Measure and Control Technology of Highway Tunnel Lighting; Tianjin University: Tianjin, China, 2006. [Google Scholar]
- Yang, F.; Zhu, S. Analysis of Environmental Characteristics of Insufficient Dynamic Illumination in Zhongnan Mountain Tunnel. Sci. Technol. Eng. 2015, 15, 214–218. [Google Scholar]
- Yang, Y.; Du, Z.; Jiao, F.; Pan, F. Analysis of EEG characteristics of drivers and driving safety in undersea tunnel. Int. J. Environ. Res. Public Health 2021, 18, 9810. [Google Scholar] [CrossRef] [PubMed]
- Qiao, J.; Xie, Y. Safety of Expressway Tunnel Entrance Based on Psychophysiological Response. Sci. Technol. Eng. 2021, 21, 10074–10079. [Google Scholar]
- Sun, Y.; Ding, J.; Zhang, J. Research on the Measurement and Control Technology of Highway Tunnel Lighting. Sichuan Cem. 2017, 46. [Google Scholar]
- Ma, Y. Discussion on the Detection Method of Highway Tunnel Illumination. Guangdong Highw. Commun. 2015, 57–60. [Google Scholar]
- Zhang, J. Discussion on Highway Tunnel Illumination Inspection. Guangdong Highw. Commun. 2020, 46, 43–46. [Google Scholar]
- Song, C. Discussion on Illumination Detection Method of Highway Tunnel. Transpo World 2018, 119–122. [Google Scholar]
- Li, W.; Qiu, X.; Cui, Y.; Zheng, G. Numerical Analysis and Design Program Development of Tunnel Lighting. China Illum. Eng. J. 2018, 29, 74–79. [Google Scholar]
- Zhao, H. Design of Illumination Improvement Scheme for the Entrance Section of Expressway Tunnel. Sci. Technol. Assoc. 2012, 25–27. [Google Scholar]
- Liang, B.; Cui, L.; Pan, G.; Luo, H. Auxiliary Tunnel Lighting Technology Based on the Light Reflection and Energy Storage Concept. Mod. Tunn. Technol. 2014, 51, 15–22. [Google Scholar]
- Wang, X.; Li, F.; Yang, K. Study on the Design of Dimming Structure for the Road Tunnel Entrance. Mod. Tunn. Technol. 2019, 56, 134–139. [Google Scholar]
- Bao, Y.; Wang, M.; Qin, P.; Chen, J.; Yan, T.; Han, C. Design of the Shading Shed for Highway Tunnel Groups Based on the Visual Adaptation Curve. Mod. Tunn. Technol. 2020, 57, 120–126. [Google Scholar]
- Bao, Y.; Wang, M.; Qin, P.; Chen, Z.; Han, C. Research on the Influence of Awning on Light-dark Adaptation at Tunnel Entrance and Exit. Mod. Tunn. Technol. 2021, 1–9. [Google Scholar]
- Zhang, Q.; Tu, Y.; Hu, Y.; Weng, J.; Chen, J.; Huang, K. Highway Tunnel Entrance Illumination Measurement Method Based on Physiological and Psychological Effects. China Illum. Eng. J. 2012, 23, 8–14. [Google Scholar]
- Cheng, Q. Design of A Dynamic Detection System for Long Tunnel of Highway. China Illum. Eng. J. 2016, 27, 53–57. [Google Scholar]
- Cheng, Z.; Yang, J.; Yang, S.; Wang, L. Research on Intelligent Detection Technology of Highway Tunnel Lighting. Mech. Electr. Inf. 2020, 127+129. [Google Scholar]
- Zeng, W.F.; Li, S.P.; Li, L.; Liu, J.; Wang, L.D.; Yi, Z.G. Fault diagnosis system for microwave range finders constructed by using PIC single-chip computer. 2007, 14, 195–197. Dianguang Yu Kongzhi (Electron. Opt. Control.) 2007, 14, 195–197. [Google Scholar]
- Lin, Z.H.; Liu, X.; Wang, L.; Zhang, S.M. Application of MSP430 in Autofocus System of Theodolite. Electron. Opt. Control. 2011, 18, 48–52. [Google Scholar]
- Liu, F.; Wang, H.; Ding, Y. Design of a Single-chip Computer Controlled Infrared Bait System for Target Drone Use. Electron. Opt. Control. 2006, 13, 3. [Google Scholar]
- Liu, X.; Hu, L.; Dong, Q.; Liu, Y.; Zhang, R. Design of Single-Chip Based BCD Encoder with Dual Input Channels for Transformer Tap Position Monitoring. Electr. Meas. Instrum. 2014, 118, 110–113. [Google Scholar]
- Zhou, J.; Zhang, D.; Ren, W.; Zhang, W. Auto Color Correction of Underwater Images Utilizing Depth Information. IEEE Geosci. Remote Sens. Lett. 2022, 19, 1–5. [Google Scholar] [CrossRef]
- Zhang, C.; Xie, T.; Yang, K.; Ma, H.; Xie, Y.; Xu, Y.; Luo, P. Positioning optimisation based on particle quality prediction in wireless sensor networks. IET Netw. 2019, 8, 107–113. [Google Scholar] [CrossRef]
- Ma, S.; Meng, F.; Ma, Y.; Su, J. Automatic integrated exhaust fan based on AT89S51 single chip microcomputer. In International Conference on Cloud Computing and Security; Springer: Cham, Switzerland, 2018; pp. 118–127. [Google Scholar]
- Guo, W.; Qiao, Y. Design and development of vehicle reversing brake assist system. Open Access Libr. J. 2017, 4, 81452. [Google Scholar] [CrossRef]
- Yin, Q.; Zhang, J.; Wang, X.; Liu, S. The video intelligent car based on wireless sensor. Clust. Comput. 2019, 22, 5135–5150. [Google Scholar] [CrossRef]


| Measuring Point Serial Number | Left Sensor Data/(Lux) | Illuminance Meter Data/(Lux) | Relative Deviation |
|---|---|---|---|
| point1-1 | 31 Lux | 28.7 Lux | 7.7% |
| point 2-1 | 75 Lux | 73.9 Lux | 0.7% |
| point 3-1 | 914 Lux | 917 Lux | −0.2% |
| point 4-1 | 51 Lux | 53.8 Lux | −2.7% |
| point 5-1 | 49 Lux | 48.0 Lux | 1.0% |
| point 6-1 | 114 Lux | 116.6 Lux | −1.0% |
| point 7-1 | 119 Lux | 118.5 Lux | 0.2% |
| point 8-1 | 78 Lux | 79.1 Lux | −0.7% |
| point 9-1 | 71 Lux | 74.2 Lux | −2.2% |
| point 10-1 | 65 Lux | 67.7 Lux | −2.0% |
| Measuring Point Serial Number | Intermediate Sensor Data/(Lux) | Illuminance Meter Data/(Lux) | Relative Deviation |
|---|---|---|---|
| point 1-2 | 28 Lux | 25.5 Lux | 4.7% |
| point 2-2 | 69 Lux | 65.7 Lux | 2.4% |
| point 3-2 | 890 Lux | 893.8 Lux | −0.2% |
| point 4-2 | 46 Lux | 45.6 Lux | 0.4% |
| point 5-2 | 46 Lux | 45.8 Lux | 0.2% |
| point 6-2 | 90 Lux | 93.4 Lux | −1.9% |
| point 7-2 | 120 Lux | 118.5 Lux | 0.6% |
| point 8-2 | 80 Lux | 82.2 Lux | −1.4% |
| point 9-2 | 65 Lux | 64.2 Lux | 0.6% |
| point 10-2 | 58 Lux | 57.7 Lux | 0.3% |
| Measuring Point Serial Number | Right Sensor Data/(Lux) | Illuminance Meter Data/(Lux) | Relative Deviation |
|---|---|---|---|
| point 1-3 | 29 Lux | 26.5 Lux | 4.5% |
| point 2-3 | 67 Lux | 65.3 Lux | 1.3% |
| point 3-3 | 881 Lux | 877.9 Lux | 0.2% |
| point 4-3 | 41 Lux | 44.3 Lux | −3.9% |
| point 5-3 | 40 Lux | 37.0 Lux | 3.9% |
| point 6-3 | 120 Lux | 118.4 Lux | 0.7% |
| point 7-3 | 118 Lux | 116.3 Lux | 0.7% |
| point 8-3 | 76 Lux | 77.4 Lux | −0.9% |
| point 9-3 | 69 Lux | 66.5 Lux | 1.8% |
| point 10-3 | 58 Lux | 57.9 Lux | 0.1% |
| Measuring Point Serial Number | Top Sensor Data/(Lux) | Illuminance Meter Data/(Lux) | Relative Deviation |
|---|---|---|---|
| point ① | 234 Lux | 156 Lux | 78 Lux |
| point ② | 142 Lux | 89 Lux | 53 Lux |
| point ③ | 101 Lux | 57 Lux | 44 Lux |
| Measuring Point Serial Number | Sensor Data/(Lux) | Illuminance Meter Data/(Lux) | Relative Deviation |
|---|---|---|---|
| point ④ | 185 Lux | 188.9 Lux | −1.0% |
| point ⑤ | 93 Lux | 89.3 Lux | 2.0% |
| point ⑥ | 61 Lux | 56.7 Lux | 3.7% |
| point ⑦ | 77 Lux | 74.1 Lux | 1.9% |
| point ⑧ | 106 Lux | 101.9 Lux | 2.0% |
| point ⑨ | 158 Lux | 165.4 Lux | −2.3% |
Disclaimer/Publisher’s Note: The statements, opinions and data contained in all publications are solely those of the individual author(s) and contributor(s) and not of MDPI and/or the editor(s). MDPI and/or the editor(s) disclaim responsibility for any injury to people or property resulting from any ideas, methods, instructions or products referred to in the content. |
© 2023 by the authors. Licensee MDPI, Basel, Switzerland. This article is an open access article distributed under the terms and conditions of the Creative Commons Attribution (CC BY) license (https://creativecommons.org/licenses/by/4.0/).
Share and Cite
Wang, Z.; Gao, H. Design of Vehicle Tunnel Illumination Measurement Device Based on STC12C5A60S2 Single-Chip Microcomputer. Electronics 2023, 12, 443. https://doi.org/10.3390/electronics12020443
Wang Z, Gao H. Design of Vehicle Tunnel Illumination Measurement Device Based on STC12C5A60S2 Single-Chip Microcomputer. Electronics. 2023; 12(2):443. https://doi.org/10.3390/electronics12020443
Chicago/Turabian StyleWang, Ziyan, and Hui Gao. 2023. "Design of Vehicle Tunnel Illumination Measurement Device Based on STC12C5A60S2 Single-Chip Microcomputer" Electronics 12, no. 2: 443. https://doi.org/10.3390/electronics12020443
APA StyleWang, Z., & Gao, H. (2023). Design of Vehicle Tunnel Illumination Measurement Device Based on STC12C5A60S2 Single-Chip Microcomputer. Electronics, 12(2), 443. https://doi.org/10.3390/electronics12020443