1. Introduction
MTAP deficiency resulting from homozygous deletion of the chromosomal region 9p21.3 is prevalent across various cancer types [
1], particularly in pleural mesotheliomas, malignant glioma, urothelial carcinoma and pancreatic adenocarcinoma [
2]. MTAP is a key enzyme in the salvage synthesis pathway of adenine and methionine, catalyzing the phosphorylation and cleavage of S-methyl-5′-thioadenosine (MTA) into adenine and 5-methylthioribose-1-phosphate (MTR), which is subsequently converted into methionine [
3]. Methionine could be utilized to synthesize S-adenosylmethionine (SAM), the major methyl donor in biochemical processes and substrate for the protein arginine N-methyltransferase 5 (PRMT5) [
4], a type II arginine methyltransferase involved in numerous cancer-associated regulatory pathways, including cell proliferation and differentiation, DNA repair, apoptosis and immune evasion [
5,
6,
7]. The loss of MTAP leads to an accumulation of MTA that partially inactivates PRMT5 [
1], rendering MTAP-deficient tumors heavily reliant on residual PRMT5 activity; this dependency provides an opportunity for therapeutic intervention based on synthetic lethality [
1,
8].
Poly (ADP-ribose) polymerases (PARPs) comprise a family of 17 proteins involved in the DNA damage repair, stress response and apoptosis [
9]. PARP inhibitors (PARPis) are a class of anticancer agents approved for treating homologous recombination (HR) repair-deficient tumors such as BRCA1/2 mutated breast, ovarian, and pancreatic cancers [
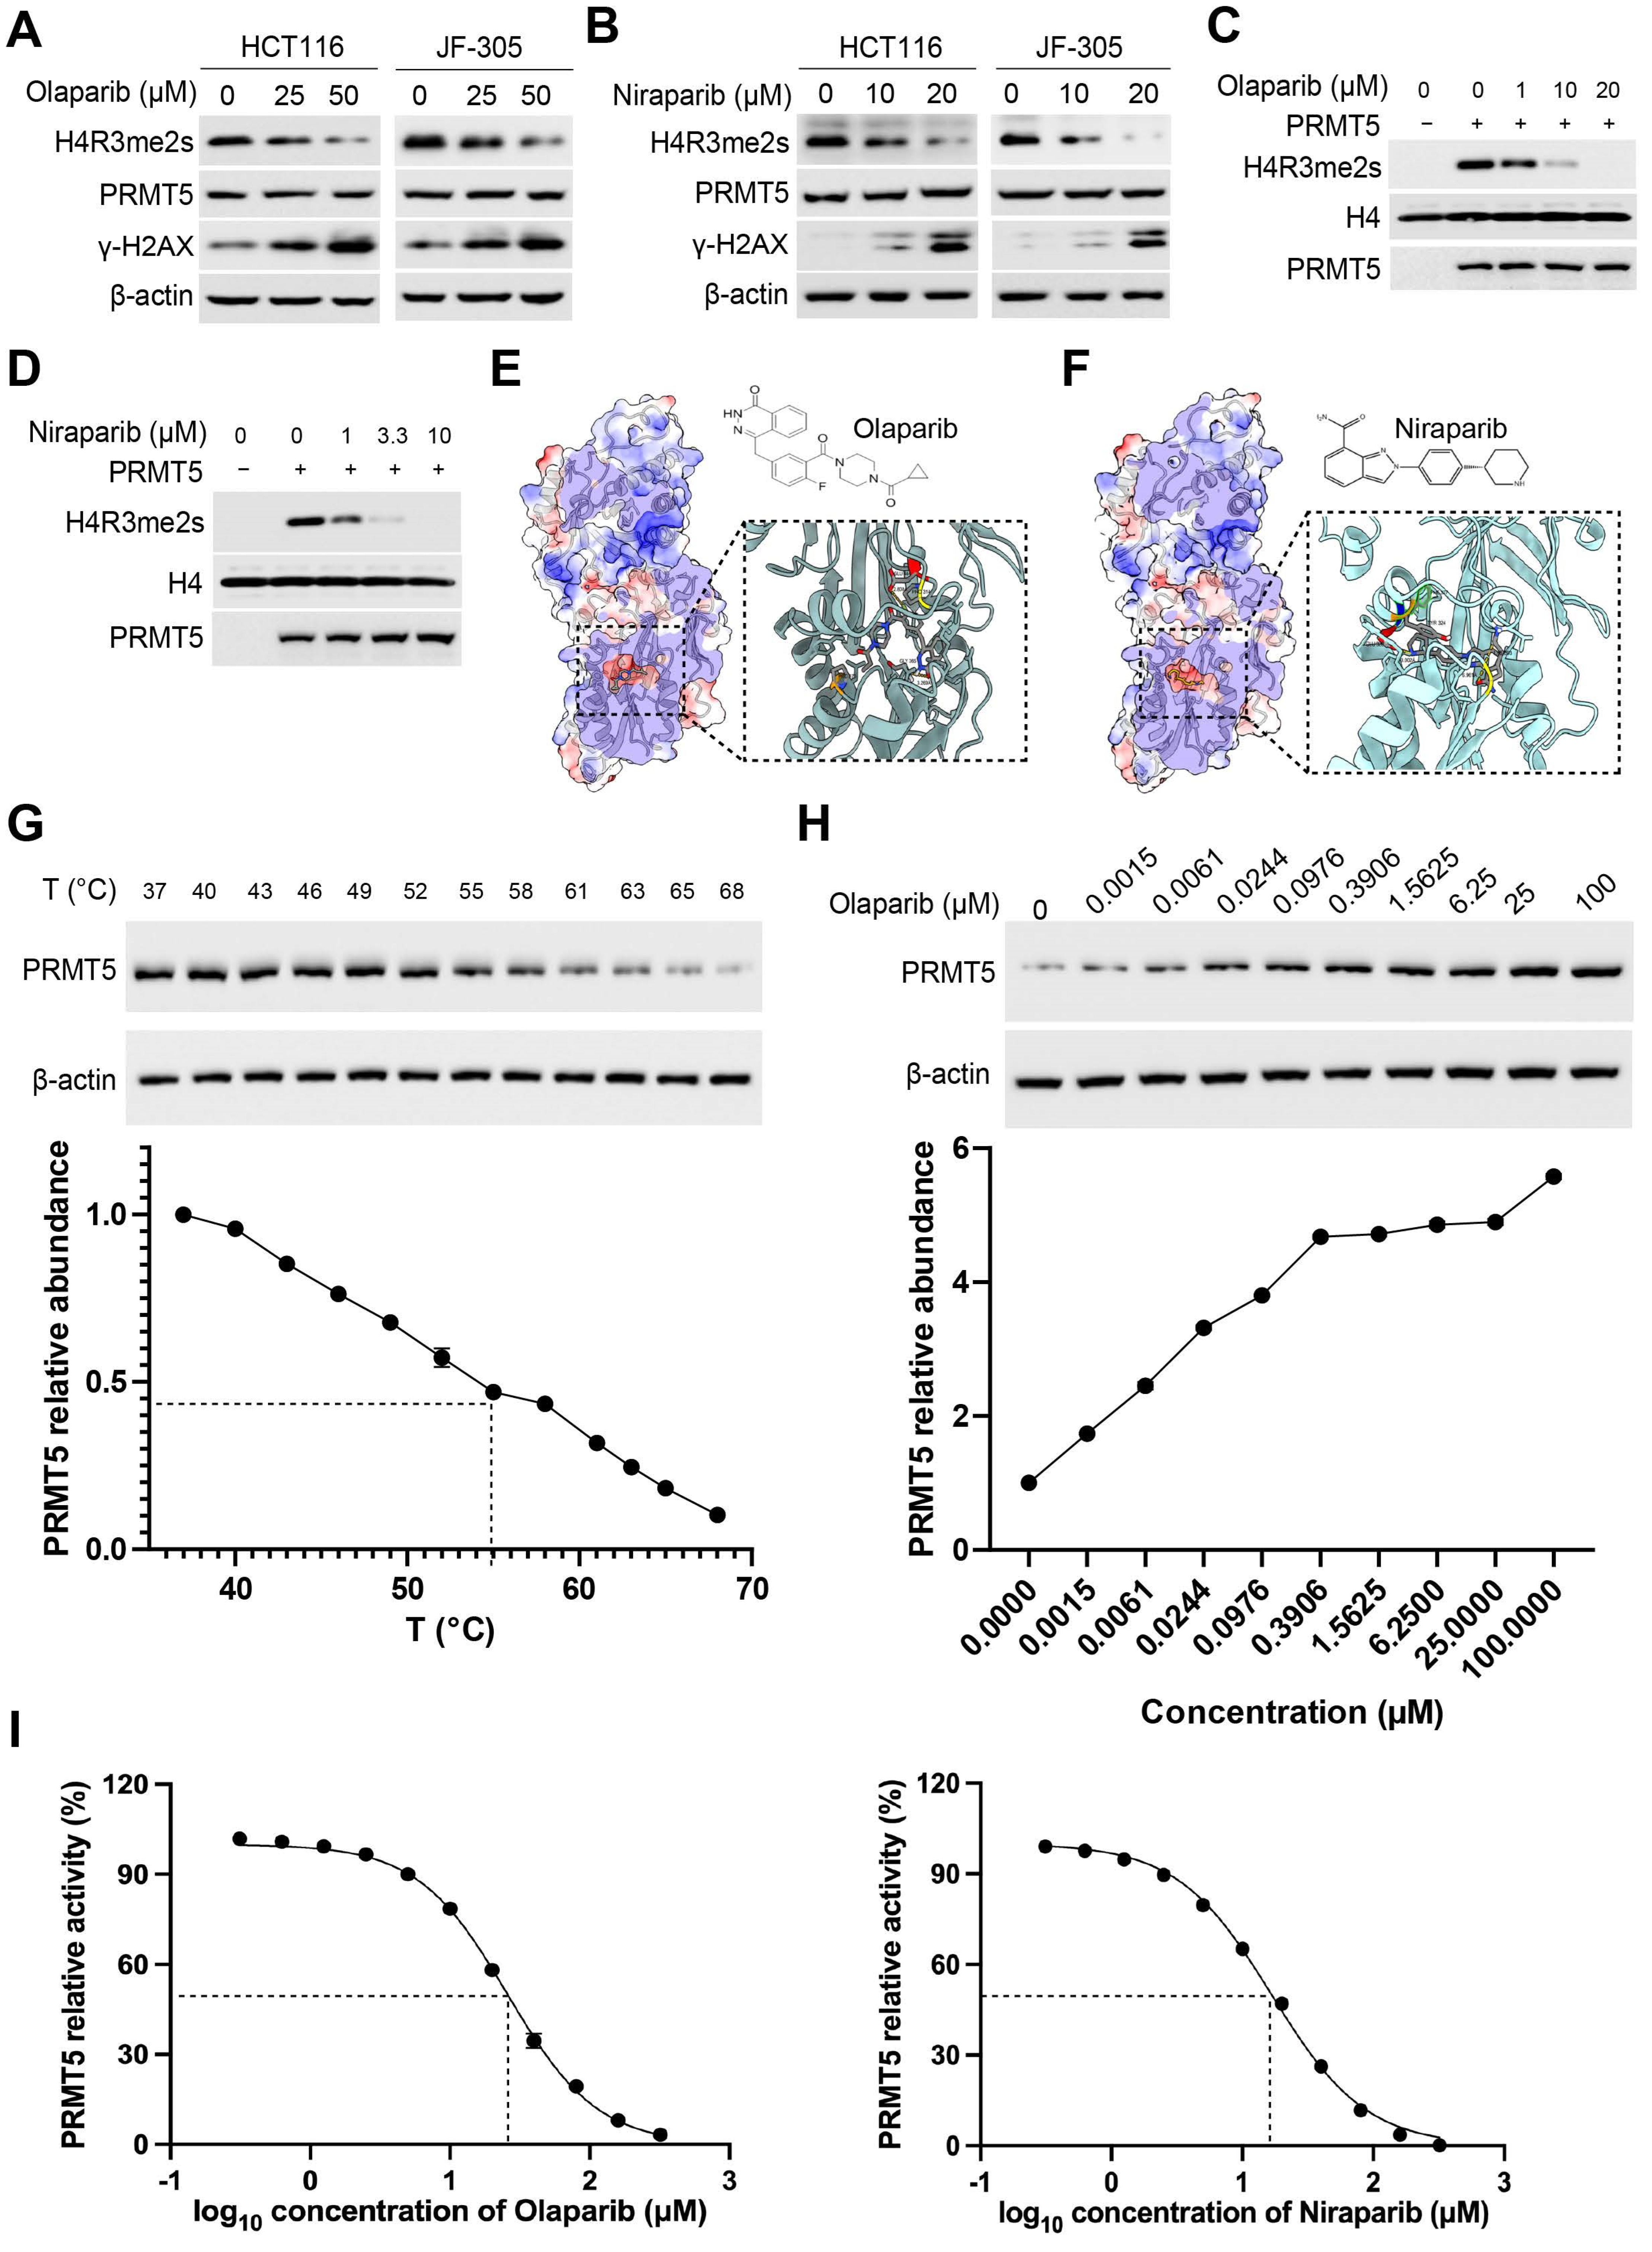
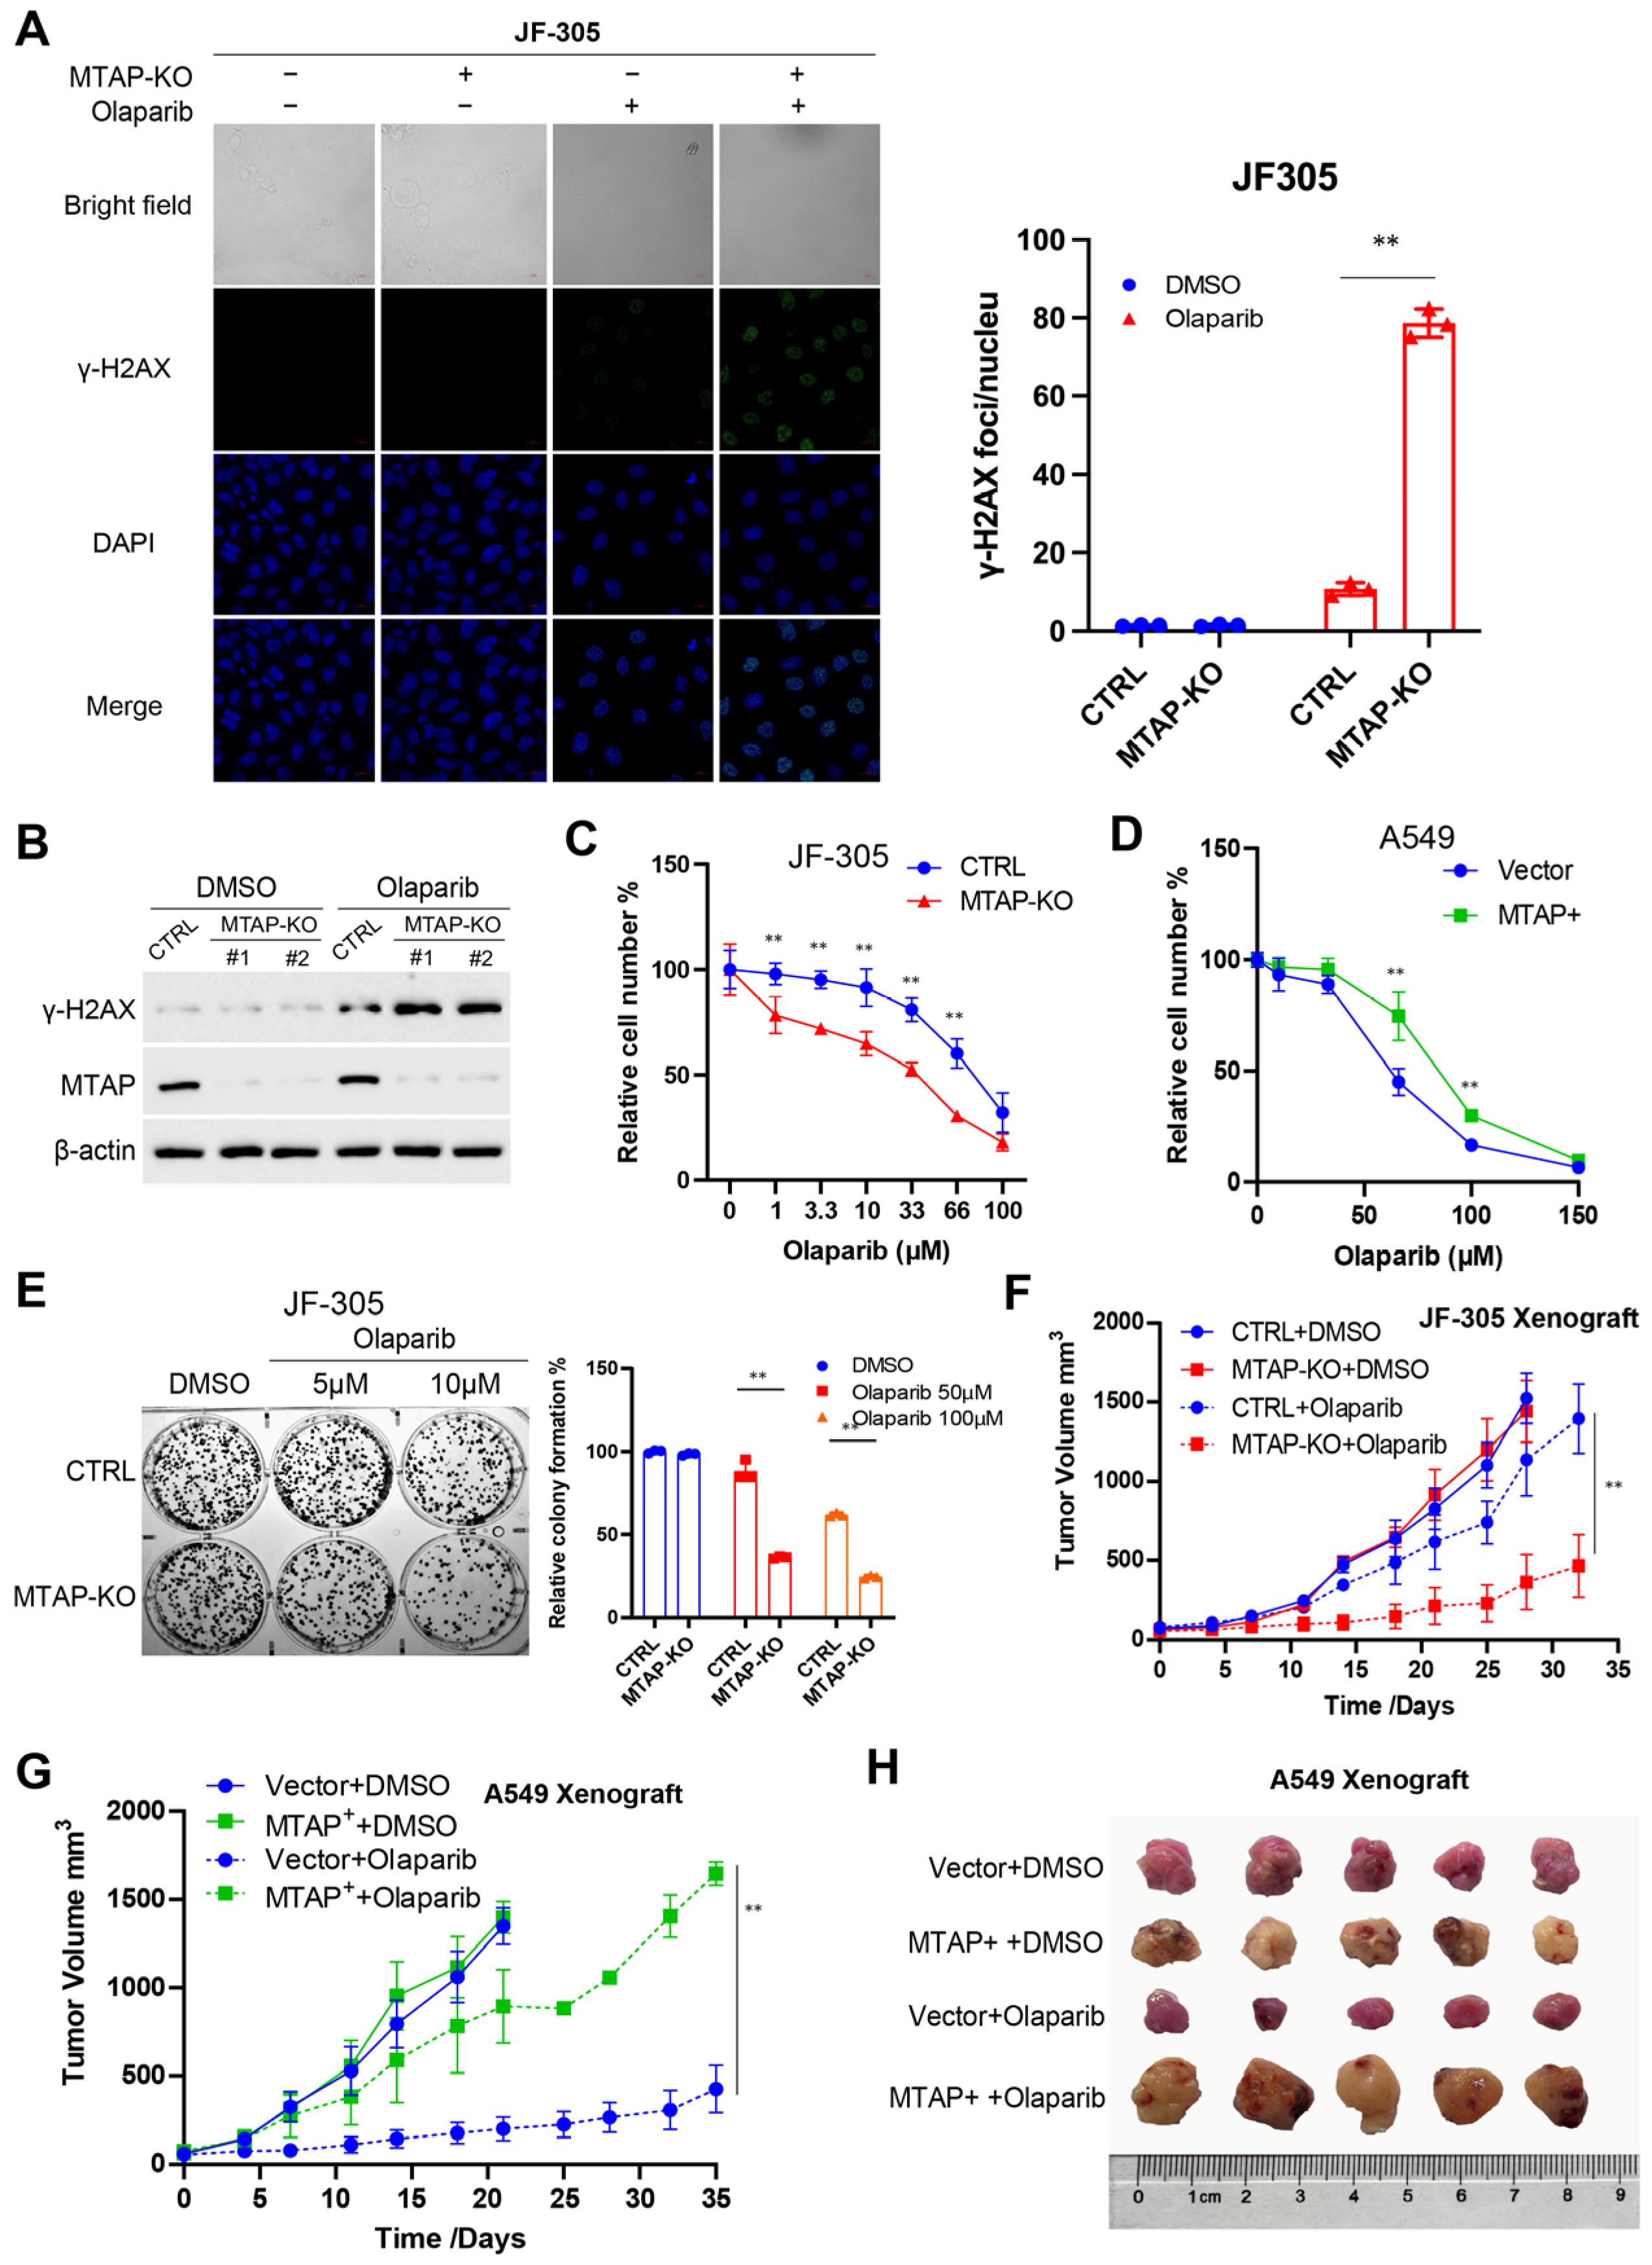
10]. In this study, we reveal that PARPis directly inhibit PRMT5 in vitro and in vivo, rendering the MTAP-deficient tumors highly vulnerable to PARPi treatment. This discovery offers a novel strategy for the treatment of MTAP-deficient cancers.
3. Materials and Methods
3.1. Cell Lines and Cell Culture
HT-29, HCT116 and HEK-293T cells were purchased from Pricella Biotechnology, Co., Ltd. (Wuhan, China) which were obtained from the American Type Culture Collection (ATCC) or European Collection of Authenticated Cell Cultures (ECACC). JF-305 cells were kindly provided by Prof. Jing Gao, and A549 cells were a gift from Prof. Guoan Chen. Cell line identity was verified through short tandem repeat (STR) profiling. HT-29, JF-305, and A549 cells were maintained in RPMI-1640 medium (Gibco, Thermo Fisher Scientific, Waltham, MA, USA, Cat#61870036) containing 10% fetal bovine serum (FBS; Gibco, Thermo Fisher Scientific, Waltham, MA, USA, Cat#10099141C) and 1% penicillin–streptomycin (Gibco, Thermo Fisher Scientific, Waltham, MA, USA, Cat#15140122). In contrast, HCT116 and HEK293T cells were grown in Dulbecco’s Modified Eagle Medium (DMEM; Gibco, Thermo Fisher Scientific, Waltham, MA, USA, Cat#11995065). All cultures were kept in a humidified incubator at 37 °C with 5% CO2. Each cell line was used within 20 passages and was routinely screened to exclude mycoplasma contamination.
3.2. Plasmids, Chemicals and Antibodies
A complete list of reagents, including chemicals and antibodies, is provided in
Table S3. Stable knockdown of
PRMT5 was achieved by introducing two shRNAs into the pLKO.1-TRC vector (Addgene, Watertown, MA, USA, #10878). For
MTAP editing, lentiCRISPR v2 (Addgene, Watertown, MA, USA, #52961) containing two sgRNAs was used to generate knockout clones in JF-305 cells, while
MTAP overexpression in A549 cells was established with the pLV [Exp]-EGFP/Puro-EF1A > mCherry construct (VectorBuilder, Guangzhou, China). Correct insertion of all plasmids was validated through Sanger sequencing. Lentiviral particles were produced in HEK293T cells (ATCC, Manassas, VA, USA, Cat#CRL-3216), and target cells were infected followed by selection using 1 µg/mL puromycin (MedChemExpress, Monmouth Junction, NJ, USA, #HY-K1057). The primers applied in plasmid assembly are listed in
Table S4.
3.3. Cell Proliferation and Viability Assays
Cell viability and proliferation were measured using the Cell Counting Kit-8 (Beyotime, Shanghai, China, Cat#C0040). Approximately 1 × 10³ cells were plated in each well of a 96-well plate and cultured for 24 h prior to treatment with different concentrations of the indicated compounds. Subsequently, 10% CCK-8 reagent was added to each well and incubated at 37 °C for 1–4 h. The absorbance at 450 nm was recorded using a Synergy HTX microplate reader (BioTek Instruments, Winooski, VT, USA). Cell viability was expressed relative to untreated controls, which were set as 100%. GraphPad Prism v10 (GraphPad Software, San Diego, CA, USA) was employed to generate dose–response curves using its built-in simulation function. Each dose was tested in quintuplicate, and three independent experiments were performed.
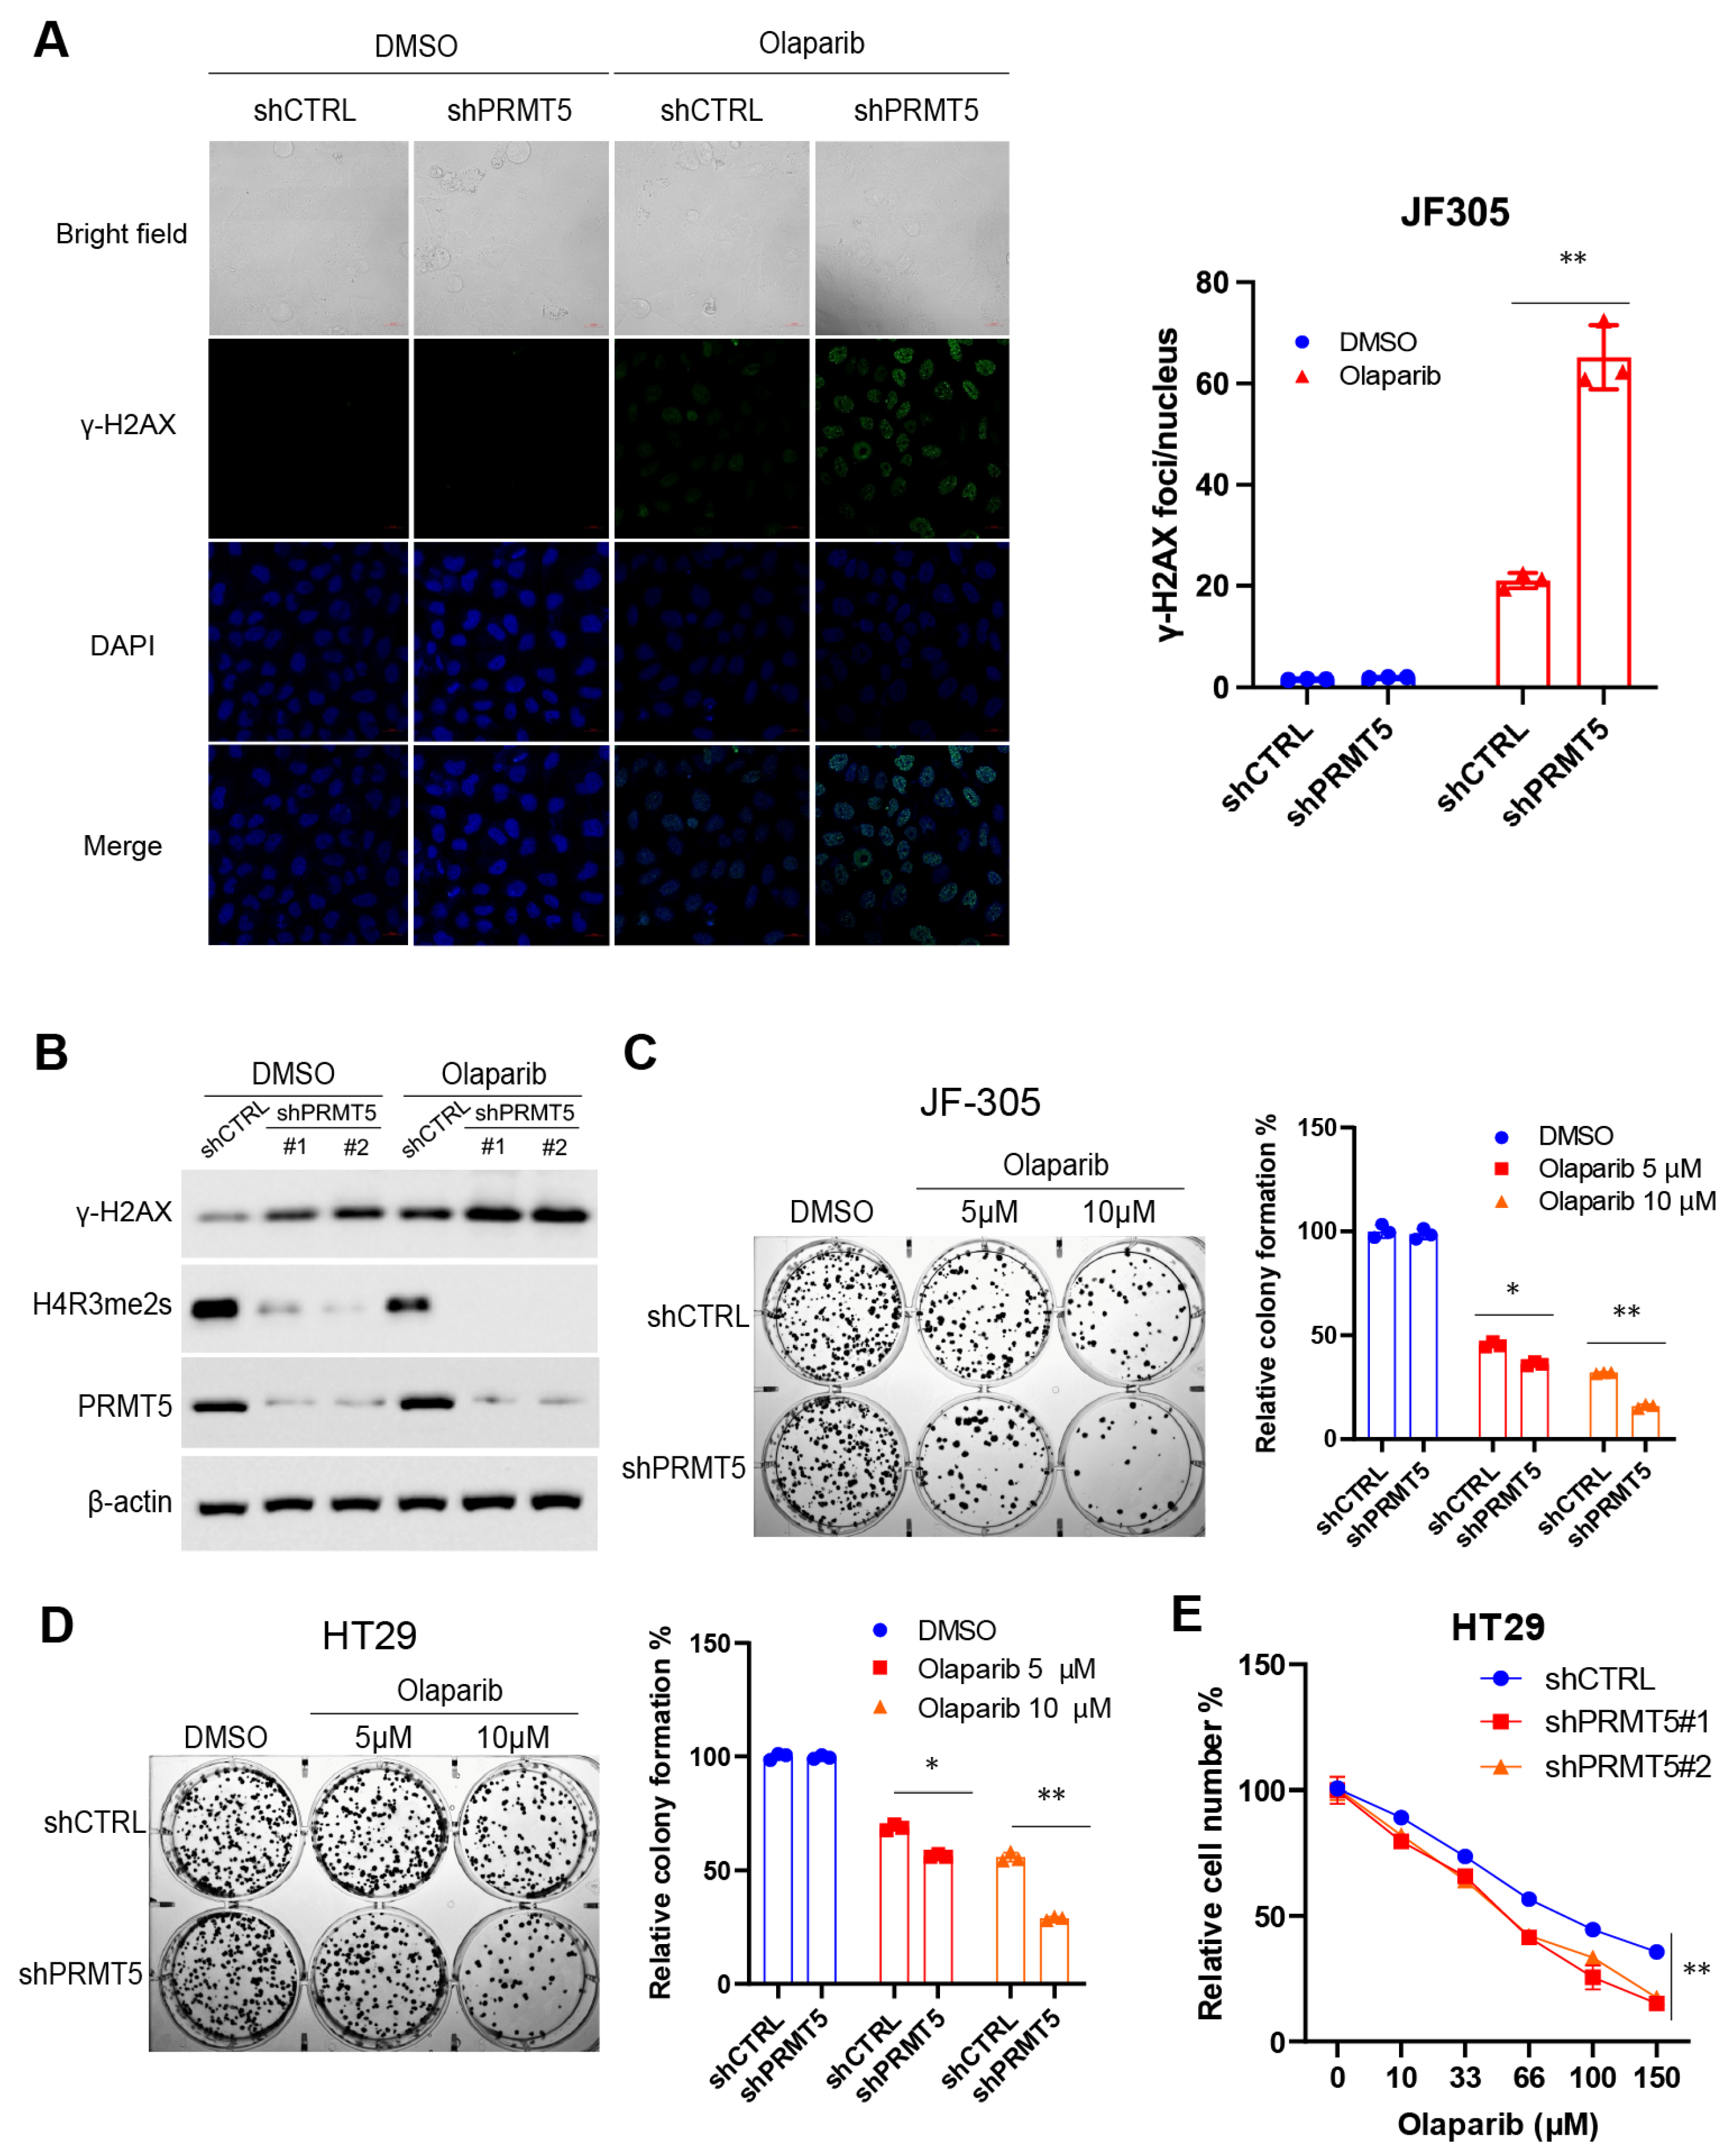
To further evaluate proliferative capacity, a colony formation assay was conducted. 500 cells were seeded per well in 6-well plates with fresh medium and cultured for 12–18 days. Colonies containing ≥50 cells were fixed with 4% paraformaldehyde and stained with 0.1% crystal violet solution. Colonies were photographed and quantified using ImageJ software (v1.54, NIH, USA). Plating efficiency (PE) was calculated as the number of colonies divided by the number of seeded cells, expressed as a percentage. For drug-treated samples, the surviving fraction (SF) was calculated by normalizing the colony formation rate to the PE of untreated controls. All experiments were carried out in triplicate, and significance testing was performed using Student’s t-test.
3.4. RNA Extraction, Reverse Transcription and Quantitative Real-Time PCR (RT-qPCR)
Total RNA was isolated from cultured cells using the RNA extraction kit (Vazyme, Nanjing, China, Cat# RC112-01) according to the manufacturer’s instructions. One microgram of RNA was reverse-transcribed into complementary DNA (cDNA) using the reverse transcription kit (Vazyme, Nanjing, China, Cat# R312-02). Quantitative PCR was then performed on a QuantStudio 7 Flex instrument (Life Technologies, Carlsbad, CA, USA) using the SYBR Green PCR kit (TransGen, Beijing, China, Cat# AQ132-21). Primer sequences are provided in
Table S4. Gene expression was normalized to
B2M as the internal control. All experiments were conducted in triplicate.
3.5. Protein Extraction and Immunoblots
Whole-cell lysates were generated using RIPA buffer supplemented with protease inhibitor cocktail (Beyotime, Shanghai, China, Cat# P1005). Following PBS washes, cells were lysed and the extracts were heated to 100 °C for 10 min. Protein levels were quantified with the BCA assay kit (Thermo Fisher Scientific, Waltham, MA, USA, Cat# 23227). Approximately 40–50 µg of protein per lane was loaded onto 8–12% SDS-PAGE gels for electrophoretic separation and subsequently transferred onto PVDF membranes (Millipore, Burlington, MA, USA, Cat# IPFL00010). The membranes were blocked in 5% skim milk for 1 h at room temperature, then probed with primary antibodies overnight at 4 °C. After incubation with HRP-linked secondary antibodies (ZSGB-Bio, Beijing, China, Cat# ZB-2301, ZB-2305) for 1 h, protein bands were detected by enhanced chemiluminescence (Advansta, San Jose, CA, USA, Cat# K-12045-D50). Images were acquired with a ChampChemi 610 Plus imaging platform (Sage Creation, Beijing, China), and band intensity was quantified using ImageJ software (v1.54, NIH, Bethesda, MD, USA). Details of antibody information are provided in
Table S3.
3.6. Immunofluorescent Staining
Cells were plated on µ-Slide 8-well chambers (ibidi, Gräfelfing, Germany, Cat#80806) and cultured until they reached 60–70% confluence. Cultures were then exposed to either PARP inhibitor or vehicle (DMSO) for 24 h in a humidified incubator. Following treatment, cells were washed with PBS and fixed for 1 h in 4% paraformaldehyde. Permeabilization was achieved by incubation with 0.25% Triton X-100 (Thermo Fisher Scientific, Waltham, MA, USA, Cat#85111) for 10 min. Non-specific binding was blocked with 5% BSA for 1 h, after which cells were incubated overnight at 4 °C with an antibody against γ-H2AX (Abcam, Cambridge, UK, Cat# Ab26350). After washing, fluorescently labeled secondary antibody (HUABIO, Hangzhou, China, Cat# HA1112) was applied for 1 h in the dark. Nuclei were counterstained with DAPI (Beyotime, Shanghai, China, Cat# C1341S) for 10 min, and samples were maintained in PBS (150 µL per well). Fluorescence images were collected on a Zeiss LSM 980 confocal microscope (Carl Zeiss, Oberkochen, Germany), and γ-H2AX foci were analyzed with ImageJ software (v1.54, NIH Bethesda, MD, USA).
3.7. Mouse Xenografts and Treatments
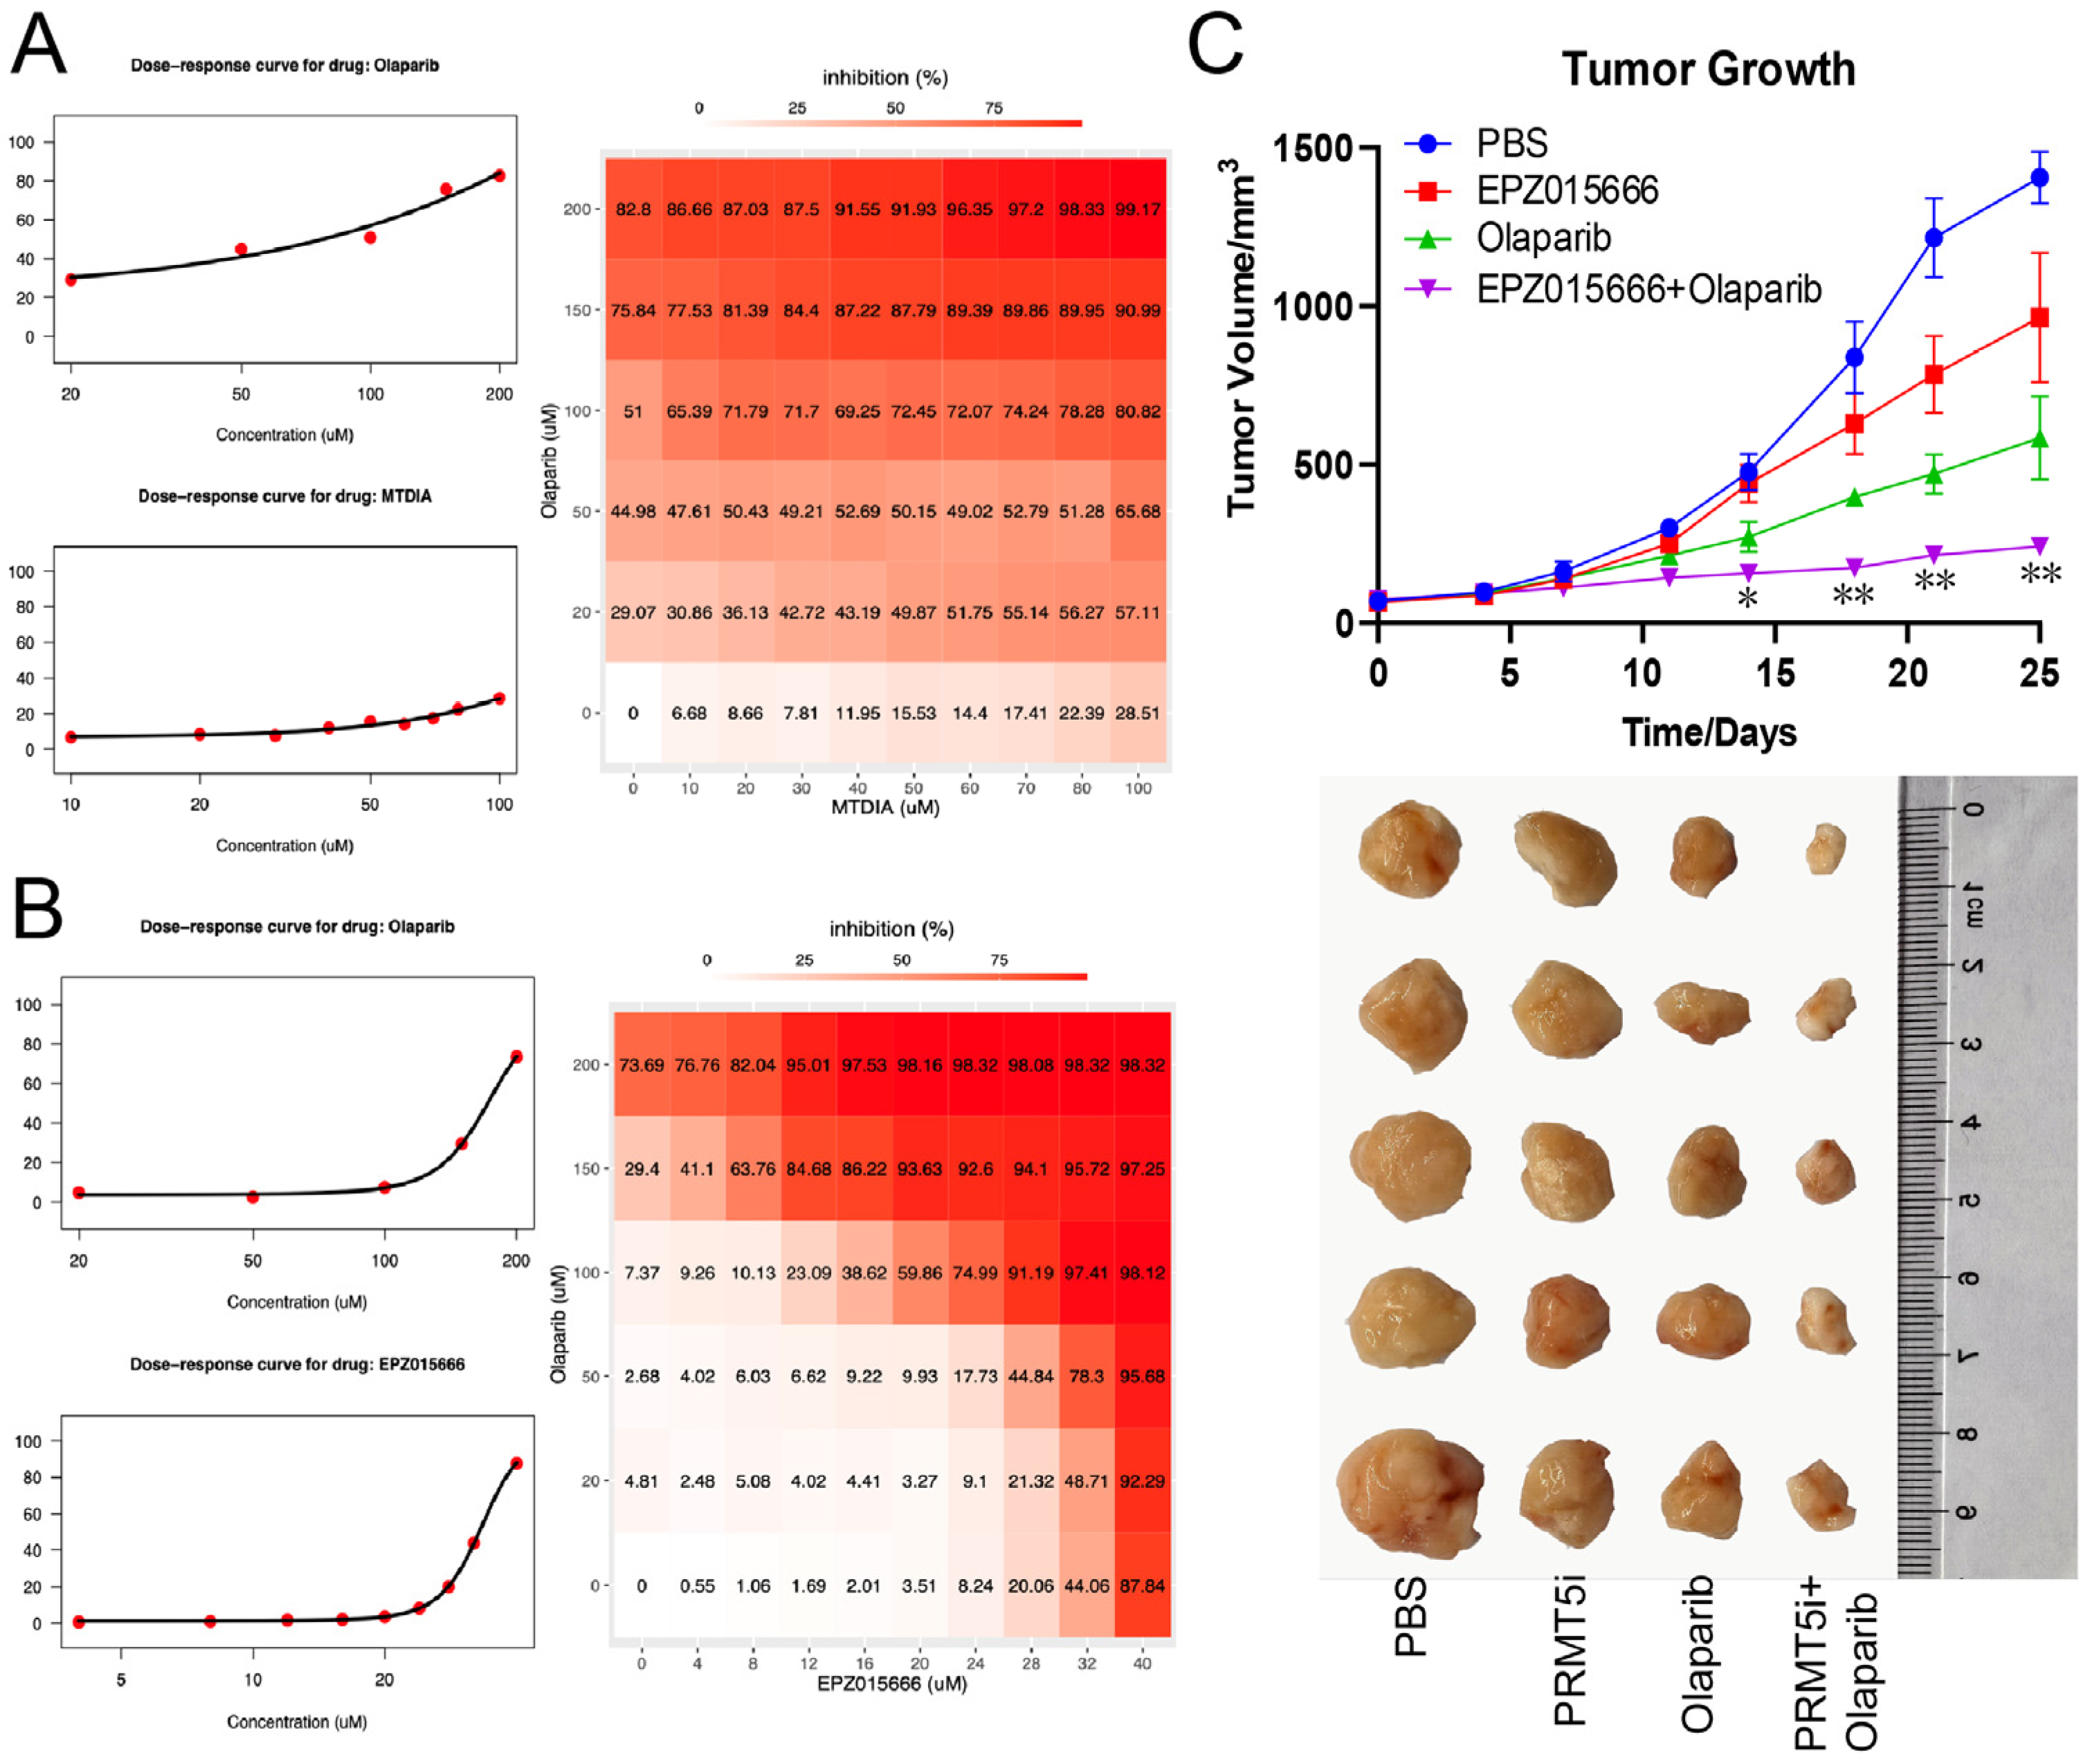
NCG male mice aged 4–6 weeks were purchased from the Shanghai Model Organisms Center (Shanghai, China). Mice were maintained in a specific pathogen-free (SPF) facility, and all procedures were approved by the Animal Ethics Committee of the Southern University of Science and Technology. To establish subcutaneous xenografts, 3 × 10⁶ tumor cells were injected into the dorsal flank region. Body weight and tumor volume were recorded twice per week. Tumor volume was calculated using the formula: V = (length × width2)/2. When tumor size reached approximately 100 mm3, animals were randomly allocated to one control group and three treatment groups. Treatments consisted of intraperitoneal administration of the test compounds formulated in corn oil, given every 3 days for a total of 3 weeks. Mice were euthanized by CO2 exposure followed by cervical dislocation if tumors grew beyond 15 mm in diameter or 1500 mm3 in volume. Tumors were removed post-mortem and photographed.
3.8. In Vitro Methylation Assay
For in vitro methylation assays, 0.5 µg of purified histone H4 protein (Abcam, Cat#198115) was combined with 0.3 µg of recombinant PRMT5 enzyme (Active Motif, Carlsbad, CA, USA, Cat#31393). Reactions (30 µL) were assembled in buffer containing 50 mM Tris-HCl (pH 8.6), 0.02% Triton X-100, 2 mM MgCl2, 1 mM TCEP, and 50 µM S-adenosyl-L-methionine (SAM). Mixtures were incubated for 3 h at room temperature under five specified conditions. Reactions were terminated by addition of 2× SDS sample buffer, followed by heat denaturation at 100 °C for 10 min. 6 µL of each reaction were resolved on 12% SDS-PAGE gels and analyzed by immunoblotting with antibodies against H4R3me2s (Abcam, Cambridge, UK, Cat#5823), PRMT5 (Cell Signaling Technology, Danvers, MA, USA, Cat#79998S), and H4 (Cell Signaling Technology, Danvers, MA, USA, Cat#2935T).
PRMT5 methyltransferase activity was measured using the MTase-Glo™ Methyltransferase Assay (Promega, Madison, WI, USA), which detects the reaction product S-adenosylhomocysteine (SAH) through a luminescence-based readout. Each 20 µL reaction contained 0.1 µg recombinant PRMT5, 0.1 µg histone H4, 10 µM S-adenosyl-L-methionine (SAM), and olaparib/niraparib at the indicated concentrations in 1× reaction buffer. Olaparib was tested using a serial dilution gradient, while vehicle control wells received an equal volume of DMSO; the final DMSO concentration was maintained at 1% in all wells. Reactions were incubated for 3 h at room temperature, followed by addition of 5 µL 5× MTase-Glo™ Reagent and 25 µL MTase-Glo™ Detection Solution according to the manufacturer’s instructions. Luminescence was measured on a GloMax® Navigator Microplate Luminometer (Promega, Madison, WI, USA). Background-subtracted signals were normalized to the vehicle control, and apparent IC50 values were determined by nonlinear regression in GraphPad Prism 10 (GraphPad Software, San Diego, CA, USA). Each condition was assayed in triplicate.
3.9. Cellular Thermal Shift Assay (CETSA)
CETSA was performed by first washing cells twice with ice-cold PBS and harvesting them by scraping. Cell pellets were lysed in buffer containing 50 mM HEPES (pH 7.5), 5 mM β-glycerophosphate, 0.1 mM activated Na3VO4, 10 mM MgCl2, and 1 mM TCEP, supplemented with freshly added EDTA-free protease inhibitor cocktail (Beyotime, Shanghai, China, Cat# P1005). Lysis was facilitated by three freeze–thaw cycles alternating liquid nitrogen and a 37 °C water bath for 10 min each, followed by 10 passages through a pipette tip for mechanical disruption. The lysates were centrifuged at 21,000× g for 20 min at 4 °C, and the supernatants were collected. Protein concentrations were determined using the BCA Protein Assay Kit (Thermo Fisher Scientific, Waltham, MA, USA, Cat# 23227).
For thermal gradient CETSA, JF-305 cell lysates (100 µg of total protein per reaction) were preincubated with either 10 µM Olaparib (MedChemExpress, Monmouth Junction, NJ, USA, Cat# HY-10162) or DMSO (Thermo Fisher Scientific, Waltham, MA, USA, Cat# D12345) for 10 min at room temperature. Aliquots (30 µL) were heated in a PCR instrument for 3 min at 12 different temperatures ranging from 37 to 68 °C, and then rapidly cooled to 4 °C. Reactions were terminated by adding 2× SDS loading buffer (Beyotime, Shanghai, China, Cat# P0015).
For isothermal dose–response (ITDR) CETSA, 55 °C was selected as the optimal assay temperature based on the thermal gradient results. JF-305 lysates (100 µg protein per sample) were incubated with Olaparib across 10 concentrations prepared by 4-fold serial dilutions starting from 100 µM. Following a 10 min incubation, samples were heated at 55 °C for 3 min in a PCR cycler, cooled on ice, and then boiled at 100 °C for 10 min. All samples were subsequently analyzed by Western blotting to assess PRMT5 protein levels using specific antibodies (Cell Signaling Technology, Danvers, MA, USA, Cat# 79998S).
3.10. Synergistic Effect Analysis
Drug combination assays were conducted using a dose–response matrix design. Olaparib, EPZ015666 (MedChemExpress, Monmouth Junction, NJ, USA, Cat#HY-12727), and MTDIA (MCE, Cat#HY-101496) were tested individually and in pairwise combinations (Olaparib + EPZ015666, Olaparib + MTDIA) across serial dilutions. After drug treatment, cell viability was measured by CCK-8 assay, and data were analyzed using the SynergyFinder Plus platform (
https://synergyfinder.org) [
14]. Single-agent dose–response curves were fitted to calculate expected additive effects. Combination effects were evaluated using multiple reference models, including Bliss independence, Loewe additivity, highest single agent (HSA), and zero interaction potency (ZIP). Synergy scores were generated to quantify synergistic interactions. Z scores ≥ 10 was considered statistically significant.
3.11. Molecular Docking
Molecular docking simulation was performed using AutoDock Tools v1.5.7. The crystal structure of PRMT5 (PDB ID: 7MXA) served as the receptor. Ligand structures of Olaparib and Niraparib were obtained from the PubChem database. Both the receptor and pre-optimized ligand were converted to the required pdbqt format. A docking grid was defined as a 15 Å cube centered at coordinates (x = −32.711, y = 30.678, z = −4.597), and 50 binding poses were generated. The resulting poses were ranked by binding free energy, with the lowest energy conformation selected for subsequent analysis. PyMOL v3.1 (Schrödinger, New York, NY, USA) and ChimeraX v1.5 (University of California, San Francisco, CA, USA) were used for all molecular visualization tasks.
3.12. RNA Sequencing and Analysis
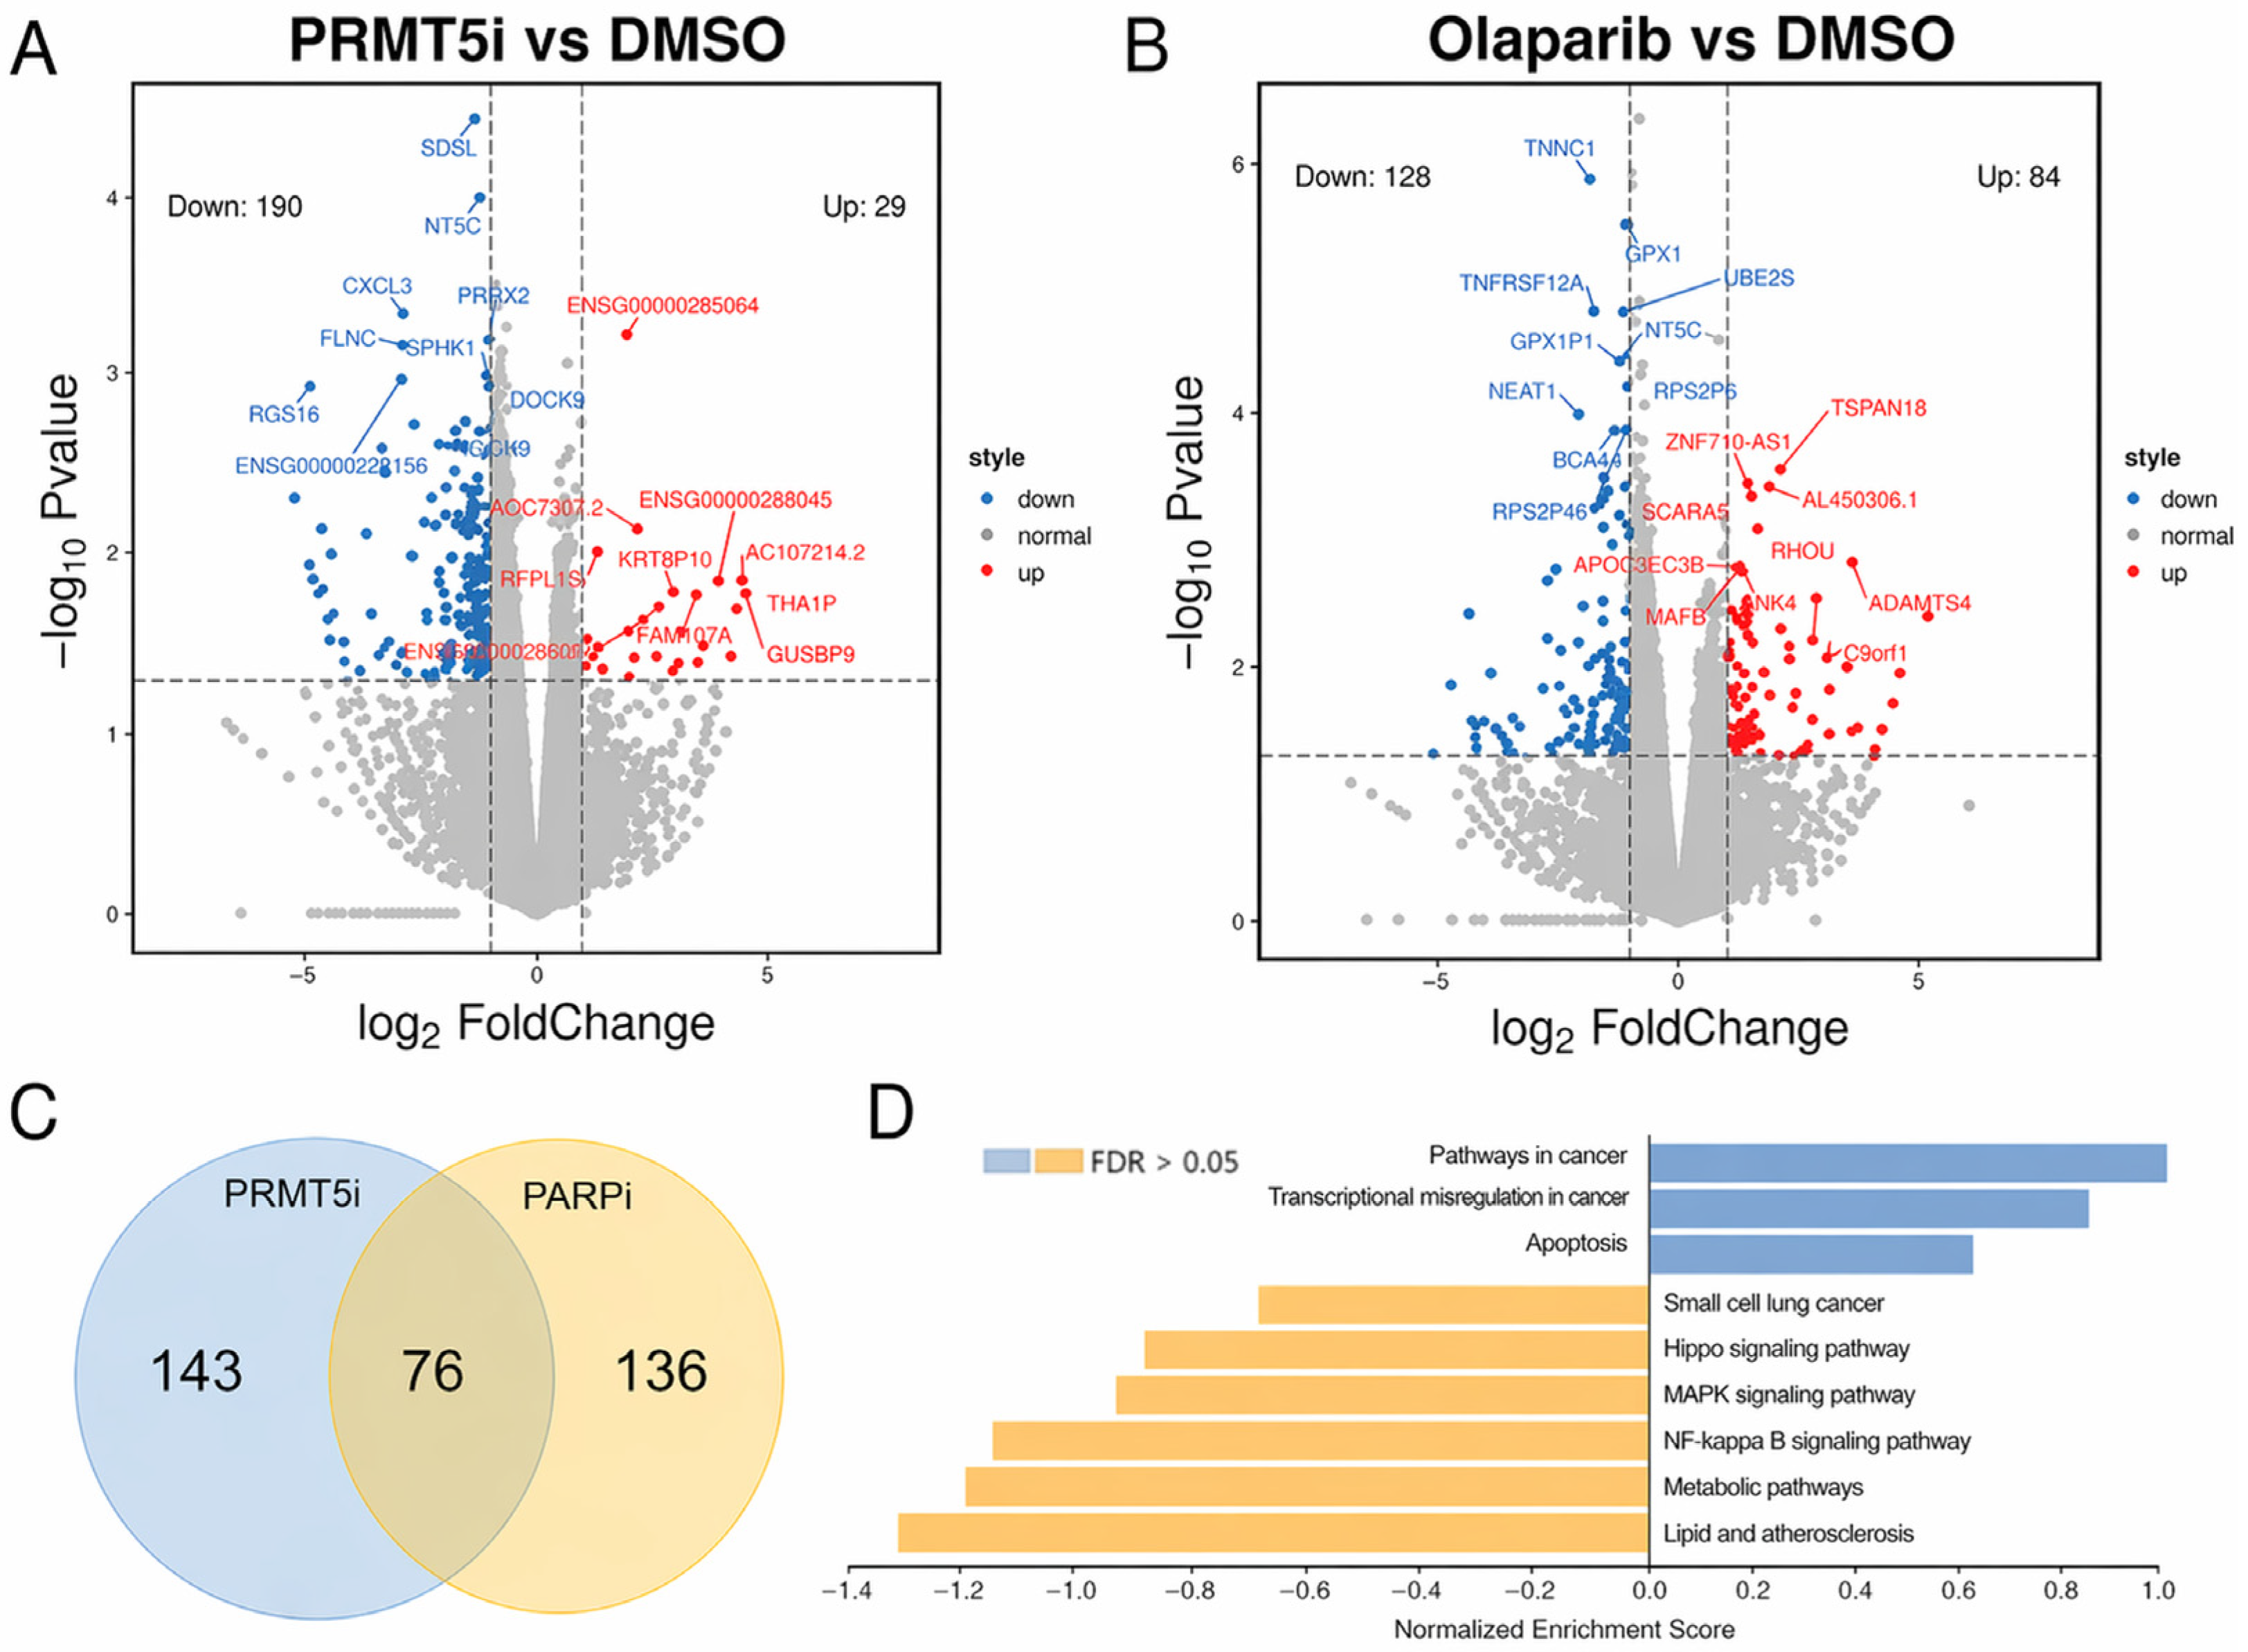
Total RNA was extracted from cultured cells for the construction of libraries using the Fast RNA-seq Lib Prep Kit V2 for Illumina (ABclonal, Wuhan, China, #RK20306) according to manufacturer’s instructions. The sequencing process was performed on the Illumina NovaSeq xplus platform (Illumina, San Diego, CA, USA) with an average of 60 million total reads per sample for RNA-seq by Haplox Biotechnology Co., Ltd. (Shenzhen, China). The raw read data underwent quality control and preprocessing by Fastp (v0.23.2), followed by mapping to the human genome through HISAT2 software (v2.2.0). Differential expression analysis of two conditions/groups (three biological replicates percondition) was performed using the DESeq R package (v1.18.1). Genes with |log2(FoldChange)| > 1 and adjusted p value < 0.05 found by DESeq were assigned as differentially expressed. The functional enrichment analysis was performed by the clusterProfiler software package v4.8.2, which incorporates the functional annotations from Kyoto Encyclopedia of Genes and Genomes (KEGG) and Reactome databases. p value < 0.05 was considered significantly enriched by differential expressed genes. Gene Set Enrichment Analysis (GSEA) v4.3.2 was used to analyze the signaling pathways enriched based on the DEGs.
3.13. Statistical Analysis
All data are expressed as mean ± standard deviation (SD). Differences between two groups were evaluated using a two-tailed Student’s t-test, whereas one-way ANOVA was applied for comparisons involving more than two groups. Statistical analyses were carried out with GraphPad Prism v10 (GraphPad Software, San Diego, CA, USA) and SPSS v24.0 (IBM, Armonk, NY, USA). A p value < 0.05 (two-tailed) was considered to indicate statistical significance.
4. Discussion
PRMT5 plays a complex role in cancer, involved in promoting numerous oncogenic processes including proliferation, migration, immune evasion and DNA damage repair via different pathways [
7]; within which, the essential function of PRMT5 in accelerating DNA repair and anti-apoptosis have been well established [
15]. As a major type II PRMT, PRMT5 catalyzes symmetric dimethylation of arginine residues in histone N-terminal tails, activating the expression of DNA repair genes such as RNF168 and FANCD2 [
6,
16]; on the other hand, PRMT5 methylates and activates DNA repair proteins such as TIP60 and TP53, to enhance the repair process and maintain the genome stability [
17,
18]. Therefore, inhibition of PRMT5 sensitizes cancer cells to DNA damage agents. In this context, our findings fit well with growing evidence that PRMT5 is an important regulator of homologous recombination and non-homologous end joining, and that PRMT5 inhibition reshapes DNA damage response programs in cancer cells [
19,
20]. Interestingly, we show that the typical DNA breaking agents PARPi could inhibit PRMT5, leading to severe DNA damage in MTAP-deficient tumor cells. This finding not only reveals a novel pharmacological effect of PARPi, but also provides a significant clue for the clinical application of PARPi. Because the SAM-dependent catalytic region is structurally conserved across the PRMT family, the selectivity of PARPi toward PRMT5 relative to other PRMTs will require further biochemical characterization. Recent studies on MTA-cooperative PRMT5 inhibitors have shown that selective engagement of PRMT5 within this conserved methyl-transferase architecture is achievable, but only after rigorous optimization and counter-screening for family selectivity [
21,
22]. Therefore, future work should examine whether olaparib or niraparib affects the enzymatic activity and canonical substrate methylation of additional PRMT family members.
The classic pharmacological mechanism of PARPi is the formation and trapping of a PARP-DNA complex at the site of single-strand damage, preventing DNA repair, leading to the accumulation of lethal double-strand break [
23,
24], which is the basis of the synthetic lethality of PARPi and HR repair deficiency. Therefore, PARPi is approved for the cancers with DNA repair deficiency, such as BRCA1/2-mutant breast, prostate, and pancreatic cancers [
25,
26,
27]. Independent studies have shown that pharmacologic PRMT5 inhibition increases DNA damage and improves the antitumor activity of PARPi in breast and ovarian cancer models [
28], further supporting the biological rationale for the synergistic effects observed here with olaparib plus EPZ015666. However, clinicians observed that PARPi is also effective in certain cancers that lack HR deficiency. For example, in patients with ovarian cancer without germline BRCA1/2 mutations, both niraparib and olaparib have prolonged progression-free survival [
29,
30]. Recently, Zeng reported that MTAP-deficient triple-negative breast cancer is susceptible to PARPi since PARPi down-regulates MAT2A by mediating METTL16 phosphorylation [
12]. Although MAT2A was demonstrated not affected in non-breast cancer cells by PARPi in this study, it suggests that MTAP deficiency may enhance the cellular sensitivity to PARPi treatment. From a translational perspective, our data are also consistent with the recent emergence of MTA-cooperative PRMT5 inhibitors, such as MRTX1719 and AMG 193, which have shown selective antitumor activity in MTAP-deleted cancers in preclinical models and early clinical studies [
21,
22]. These advances suggest that MTAP deletion is becoming an increasingly actionable biomarker, and they position PARPi-based combinations as a potentially practical means to exploit the same vulnerability using agents that are already clinically available [
31]. Recently, Zeng reported that MTAP-deficient triple-negative breast cancer is susceptible to PARPi since PARPi down-regulates MAT2A by mediating METTL16 phosphorylation [
12]. In this study, we reveal that PARPi has a direct inhibitory effect on PRMT5 activity, which constitutes a synthetic lethality for MTAP-deficient tumors, enhancing DNA damage and the subsequent apoptosis.
In addition, the 76 overlapping differentially expressed genes identified after PARPi and PRMT5i treatment are best interpreted as evidence of pathway-level convergence, rather than as proof that individual genes are causal mediators of the observed phenotype. This interpretation is consistent with previous studies showing that PRMT5 inhibition downregulates DNA damage repair and DNA replication programs and can enhance response to PARP inhibition [
19,
28]. Although additional knockdown or rescue experiments for selected candidate genes would be valuable in future work, the positive ZIP scores observed in our combination analyses support a synergistic interaction under the analytical framework used in this study [
14].
More broadly, tumor heterogeneity, lineage-specific biology, and differences in DNA repair capacity may influence the magnitude of response to this strategy across broader clinical settings. Thus, although our data support the existence of this vulnerability in the models examined here, broader validation across additional tumor types and molecular backgrounds will be important in future studies. In addition, potential toxicity in normal tissues remains an important translational consideration. In this regard, recent studies of MTA-cooperative PRMT5 inhibitors support the existence of a therapeutic window in MTAP-deleted tumors while emphasizing the need for careful evaluation in MTAP-wild-type contexts [
21,
22,
31].



 ,
,