Article

Overexpression of the Ubiquitin Ligase RNF182 Is Associated with High-Grade Gliomas

1
IRCCS Neuromed, 86077 Pozzilli, Italy
2
Department of Neuroscience, Mental Health and Sensory Organs, Sapienza University of Rome, 00189 Rome, Italy
3
Department of Physiology and Pharmacology, Sapienza University, 00185 Rome, Italy
*
Author to whom correspondence should be addressed.
Cancers 2026, 18(8), 1217; https://doi.org/10.3390/cancers18081217
Submission received: 19 March 2026 / Revised: 8 April 2026 / Accepted: 9 April 2026 / Published: 11 April 2026

Simple Summary

Glioblastoma (GBM) is the most common and aggressive brain tumor affecting adults. Dysregulation of the ubiquitination system has been shown to reduce treatment efficacy and contribute to uncontrolled tumor growth in various cancers, particularly in GBM. However, the specific targets and regulatory components of the ubiquitin–proteasome system involved in GBM remain largely unexplored. Our analyses show that aggressive gliomas exhibit increased expression of the RING ligase RNF182, with significantly higher levels in GBM than in low-grade gliomas. Silencing of rnf182 in the GBM cell line U87MG reduces cell proliferation, suggesting that the protein promotes tumor growth. Overall, RNF182 emerges as a potential biomarker and therapeutic target, linking the ubiquitin–proteasome system to GBM progression.

Abstract

Background: Glioblastoma (GBM) is the most common and aggressive brain tumor in adults. Changes in the ubiquitination system in GBM cells can promote uncontrolled tumor growth and reduce the effectiveness of treatments. However, the exact targets and regulatory elements of the ubiquitin–proteasome system involved in GBM are still not well understood. Methods: All data were obtained by using in silico analysis, immunohistochemistry, Western blot, RT-qPCR, gene silencing and proliferation assay. Results: Computational and protein analyses show that aggressive gliomas have higher expression of the RING ligase RNF182, with significantly greater levels in glioblastoma (GBM) than in low-grade gliomas. Elevated RNF182 is strongly associated with GBM growth. Experiments using siRNA to inhibit RNF182 in the human glioblastoma cell line U87MG significantly reduced cell proliferation, suggesting that RNF182 promotes tumor growth and may be a potential therapeutic target. Conclusions: These findings create a connection between the ubiquitin–proteasome system and the unchecked growth observed in GBM, identifying RNF182 as a new marker associated with GBM proliferation and an additional target for GBM treatment.

1. Introduction

Glioblastoma (GBM), which accounts for 60% of all gliomas, is the most common primary intracranial tumor. Also referred to as primary or de novo GBM, it makes up around 90% of GBM cases and usually impacts individuals who are 62 years old and above [1,2]. These tumors can be further classified according to the mutation of the IDH1 gene; generally, IDH-mutated GBM represent secondary GBM (about 10% of cases), which gradually progresses from low-grade astrocytoma and often occurs in patients aged 40–50 years [3,4,5]. In a recent study, the molecular profile of glioma shows a new classification: IDH1-mutated glioma is clinically associated with a long survival and a good prognosis, and aggressiveness and poor survival have instead been associated with the TERT promoter mutation, which is mainly represented in primary GBM [6,7]. A poor prognosis has also been linked to the deletion of CDKN2A-p16 [8,9]. Additionally, five molecular subclasses—mesenchymal, classical (or proliferative), proneural, neural, and G-CIMP—have been identified by genomic investigations [10,11]. Both primary and secondary glioblastomas have a mean lifespan of 12 to 15 months and a high rate of tumor recurrence, indicating that there is no discernible difference in patient survival between them despite advancements in our understanding and molecular characterization of glioblastomas [1,12]. The standard treatment for patients with GBM involves surgical resection, complemented by radiotherapy and adjuvant chemotherapy using the alkylating agent temozolomide (TMZ) [13]. While certain molecular characteristics have been suggested as predictive biomarkers for treatment response to alkylating agents, such as the methylation status of the O6-methylguanine-DNA-methyltransferase (MGMT) promoter, their clinical applicability remains limited [14,15]. Several factors have been proposed to explain the gliomas resistance, including the diffuse infiltrative nature of GBM, which complicates complete resection; the significant heterogeneity of GBM, which encompasses various molecular pathways; and, more recently, the identification of stem cell-like tumorigenic traits, such as promoting angiogenesis, uncontrolled cell proliferation, resistance to cell death, and genomic instability and mutation [16,17]. Although efforts have been made to identify molecular pathways and potential therapeutic targets involved in gliomagenesis, total tumor resection followed by adjuvant chemotherapy and radiotherapy remains the standard of care [13,18,19]. However, in most cases, therapy is ineffective in controlling the tumor growth, which often recurs after a period of time that varies from patient to patient. Furthermore, the intratumoral heterogeneity of GBM complicates the clinical outcome of the therapy, demanding the discovery of novel therapeutic targets for this disease [20,21]. The ubiquitin–proteasome system (UPS) emerged as an important component of the cellular machinery that controls protein fate and activity. By modulating the ubiquitylation state of a target protein, the UPS regulates key biological functions, including growth, metabolism, differentiation and development [22,23]; therefore, it represents a promising target for developing new therapeutic strategies for GBM. RNF182 promotes the ubiquitination and proteasomal degradation of ATP6V0C [24]. Yeast two-hybrid screening, overexpression, and co-immunoprecipitation have demonstrated an interaction between RNF182 and ATP6V0C both in vitro and in vivo. Additionally, RNF182 contributes to the suppression of TLR-mediated innate immune responses by inducing Lys48-linked ubiquitination and degradation of the NF-κB subunit RELA [25]. RNF182 is a low-abundance cytoplasmic protein expressed preferentially in the brain. Its expression was elevated in post-mortem Alzheimer’s disease (AD) brain tissue [24]. RNF182 protein possessed an E3 ubiquitin ligase activity and stimulated the E2-dependent polyubiquitination in vitro. The role of this protein has not previously been investigated in GBM. In this study, for the first time we propose to analyze the expression of RNF182 in GBM. The aim of our investigation is to elucidate the role of RNF182 and its involvement in gliomagenesis, with the final goal of identifying a novel biomarker for glioblastoma.

2. Materials and Methods

2.1. Computational Analysis

We analyzed two public RNA-seq datasets: TCGA and CPTAC. TCGA and CPTAC contain 166 and 99 primary GBM samples, respectively. Several clinical variables, including overall survival, were available and obtained from both cBioPortal (https://www.cbioportal.org/datasets, accessed on 21 March 2025) and Gliovis (https://gliovis.bioinfo.cnio.es/, accessed on 21 March 2025).
Data were analyzed with RStudio (RStudio: Integrated Development for R. RStudio, PBC, Boston, MA, USA) using the following packages: “survival,” “survminer,” “ggplot2,” “readxl,” “RCircos,” “WGCNA,” “clusterProfiler,” “org.Hs.eg.db,” “AnnotationDbi,” and “KEGGREST.” For all analyses, the latest available versions of the respective packages as of April 2025 were used.
The RNF183 family was presented using the R package RCircos. Global expression profiles were standardized using a base-2 logarithmic transformation (log2). Standard statistical analyses and density plots were generated for each dataset to assess RNF182 gene expression levels.
The Shapiro–Wilk test was employed to assess the normality of RNF182 expression. Considering the non-normal distribution (p < 0.0001), differences in gene expression among groups were analyzed using the Mann–Whitney test and the Kruskal–Wallis test. Statistical analyses were performed using RStudio (Version 2023.06.02+561) and Microsoft Excel (Version 16.16.3).

2.2. Cell Culture and Human Tissue Biopsies

The continuous human GBM cell line (U87MG) was purchased from Sigma Aldrich Collection (LGCPromochem, Teddington, UK). The cells were cultured in DMEM (Dulbecco’s Modified Eagle’s Medium) supplemented with 10% FBS (Fetal Bovine Serum), 2 mmol/L-glutamine, 100 IU/mL of Penicillin, and 100 g/mL of Streptomycin, at 37 °C, 5% CO2, and 95% humidity. The human tissue biopsies were obtained from Neuromed patients who had their gliomas and GBM surgically removed. They granted their informed consent to proceed with scientific research.

2.3. Immunohistochemistry

RNF182 protein expression was analyzed by immunohistochemistry in tissues from 18 patients with low-grade glioma and 18 patients with GBM. Paraffin-embedded tissue sections, 4 micrometers thick, were deparaffinized, rehydrated, and subjected to antigen retrieval in pH 6 Citrate buffer, at 96 °C for 30 min. After application of 0.4% Triton for 30 min, 3% H2O2 for 30 min and 10% Normal Goat Serum (Vector Laboratories, Newark, CA, USA) for 1 h, the sections were incubated overnight at 4 °C with a rabbit polyclonal antibody anti-RNF182 (Invitrogen; 1:100, Carlsbad, CA, USA). After washing in PBS, we applied a biotinylated anti-rabbit secondary antibody (1:100; Vector Laboratories) for 1 h, Streptavidin (1:100; Vector Laboratories, Newark, CA, USA) for 1 h and finally DAB (Sigma Aldrich, St. Louis, MO, USA). After counterstaining with Mayer’s hematoxylin (Diapath, Bergamo, IT, Italy), the sections were analyzed under a light microscope, at 100× magnification. In each section we performed a count of RNF182-positive cells compared to the total cells in 10 different fields. Statistical significance was determined by Unpaired t-test, considering a p-value * < 0.0001 statistically significant.

2.4. Protein Extraction and Western Blot Analysis

Proteins were extracted from frozen tissues of patients with Triton X-100 lysis buffer (10 mM Tris-HCl, 1 mM EDTA, 150 mM NaCl, 1% Triton X-100, 1 mM NaF, 1 mM Na4P2O7, 1 mM Na3VO4, and 1× protease inhibitors). After quantitation by Bradford Assay, 20 µg of total lysate were separated by sodium dodecyl sulfate-polyacrylamide gel electrophoresis (SDS-PAGE) and transferred onto Immuno-Blot® PVDF Membrane. The membrane was incubated with 5% milk solution for 1 h at room temperature and then overnight at 4 °C with rabbit polyclonal anti-RNF182 (dilution 1:500, Invitrogen). The signals were detected by a digital scanner and quantified with Image Lab 6.1 Software (Bio-Rad Laboratories, Inc., Hercules, CA, USA). For protein normalization, the membrane was incubated with mouse monoclonal antibody anti-GAPDH (dilution 1:1000; Santa Cruz Biotechnology, Dallas, TX, USA). Data analysis and graphic representation were carried out by GraphPad Prism 8. Experiments were performed in quadruplicate and data were expressed as fold change. Statistical significance was determined by Unpaired t-test, considering a p-value * < 0.05 statistically significant.

2.5. RT-qPCR

Total RNA was extracted from a cohort of frozen tissues biopsies of patients by using the Direct-zol RNA MicroPrep (ZYMO RESEARCH, Irvine, CA, USA), while cDNA was synthesized using the SuperScript™ III First-Strand Synthesis System (Invitrogen). cDNA was then amplified by using the predesigned rnf182 gene-specific primers (Forward 5′-TTGTGCCAAATGCCTCTACA-3′ and reverse 5′-GTGAGCAGCAGCTCAGTAGG-3′) with a sensitive Real-Time 2xHS-PCR SYBR Master Mix (A&A Biotechnology, Gdynia, Poland). All samples were run in triplicate on quantitative PCR plates and β-actin (Forward 5′-GCCAGACAGCACTGTGT-3′ and reverse 5′-GTGCGTGACATTAAGGAG-3′) was used as a reference gene. Data analysis and graphic representation were carried out by GraphPad Prism 8. The relative abundances of mRNA were subsequently analyzed using the 2(−ΔCt) method.

2.6. RNF182 Gene Silencing

Continuous GBM cell line U87MG was seeded with 4 × 10⁵ cells in DMEM (Dulbecco’s Modified Eagle’s Medium) with 10% FBS (Fetal Bovine Serum) and without antibiotics. Cells were transiently transfected with RNF182 siRNA (sc-95222, Santa Cruz Biotechnology, Inc.) at a final concentration of 100 nM by using Lipofectamine 2000 (Invitrogen). U87MG CT were also transfected with a scrambled RNA, which does not target any gene, to simulate the same experimental condition and used as a negative control. The transfections have been verified by Western blot analysis using specific antibody anti-RNF182 (dilution 1:500, Invitrogen). As loading control an antibody anti-GAPDH (dilution 1:1000; Santa Cruz Biotechnology) was used. Data analysis and graphic representation were carried out by GraphPad Prism 8. Experiments were performed in triplicate and data were expressed as fold change. For Western blotting analysis, statistical significance was determined by Unpaired t-test, considering a p-value of ** <0.005 statistically significant.

2.7. Proliferation Assay

U87MG at 72 h of transfection with rnf182 siRNA were seeded in 48-multiwell plates, 1 × 10⁴ cells per well, in DMEM supplemented with 10% FBS (Fetal Bovine Serum), 2 mmol/L-glutamine, 100 IU/mL of Penicillin, and 100 g/mL of Streptomycin. Cell counts were performed at 24, 48, and 72 h using a Burker chamber. Graphs were plotted with GraphPad Prism 8. Statistical analysis of plotted curve was performed using 2-way ANOVA, multiple comparison **** p value < 0.0001. The images were acquired by EVOS FL Microscope at 10× magnification: scale bar 400 μm.

3. Results

3.1. In Silico Characterization of RNF182 in GBM

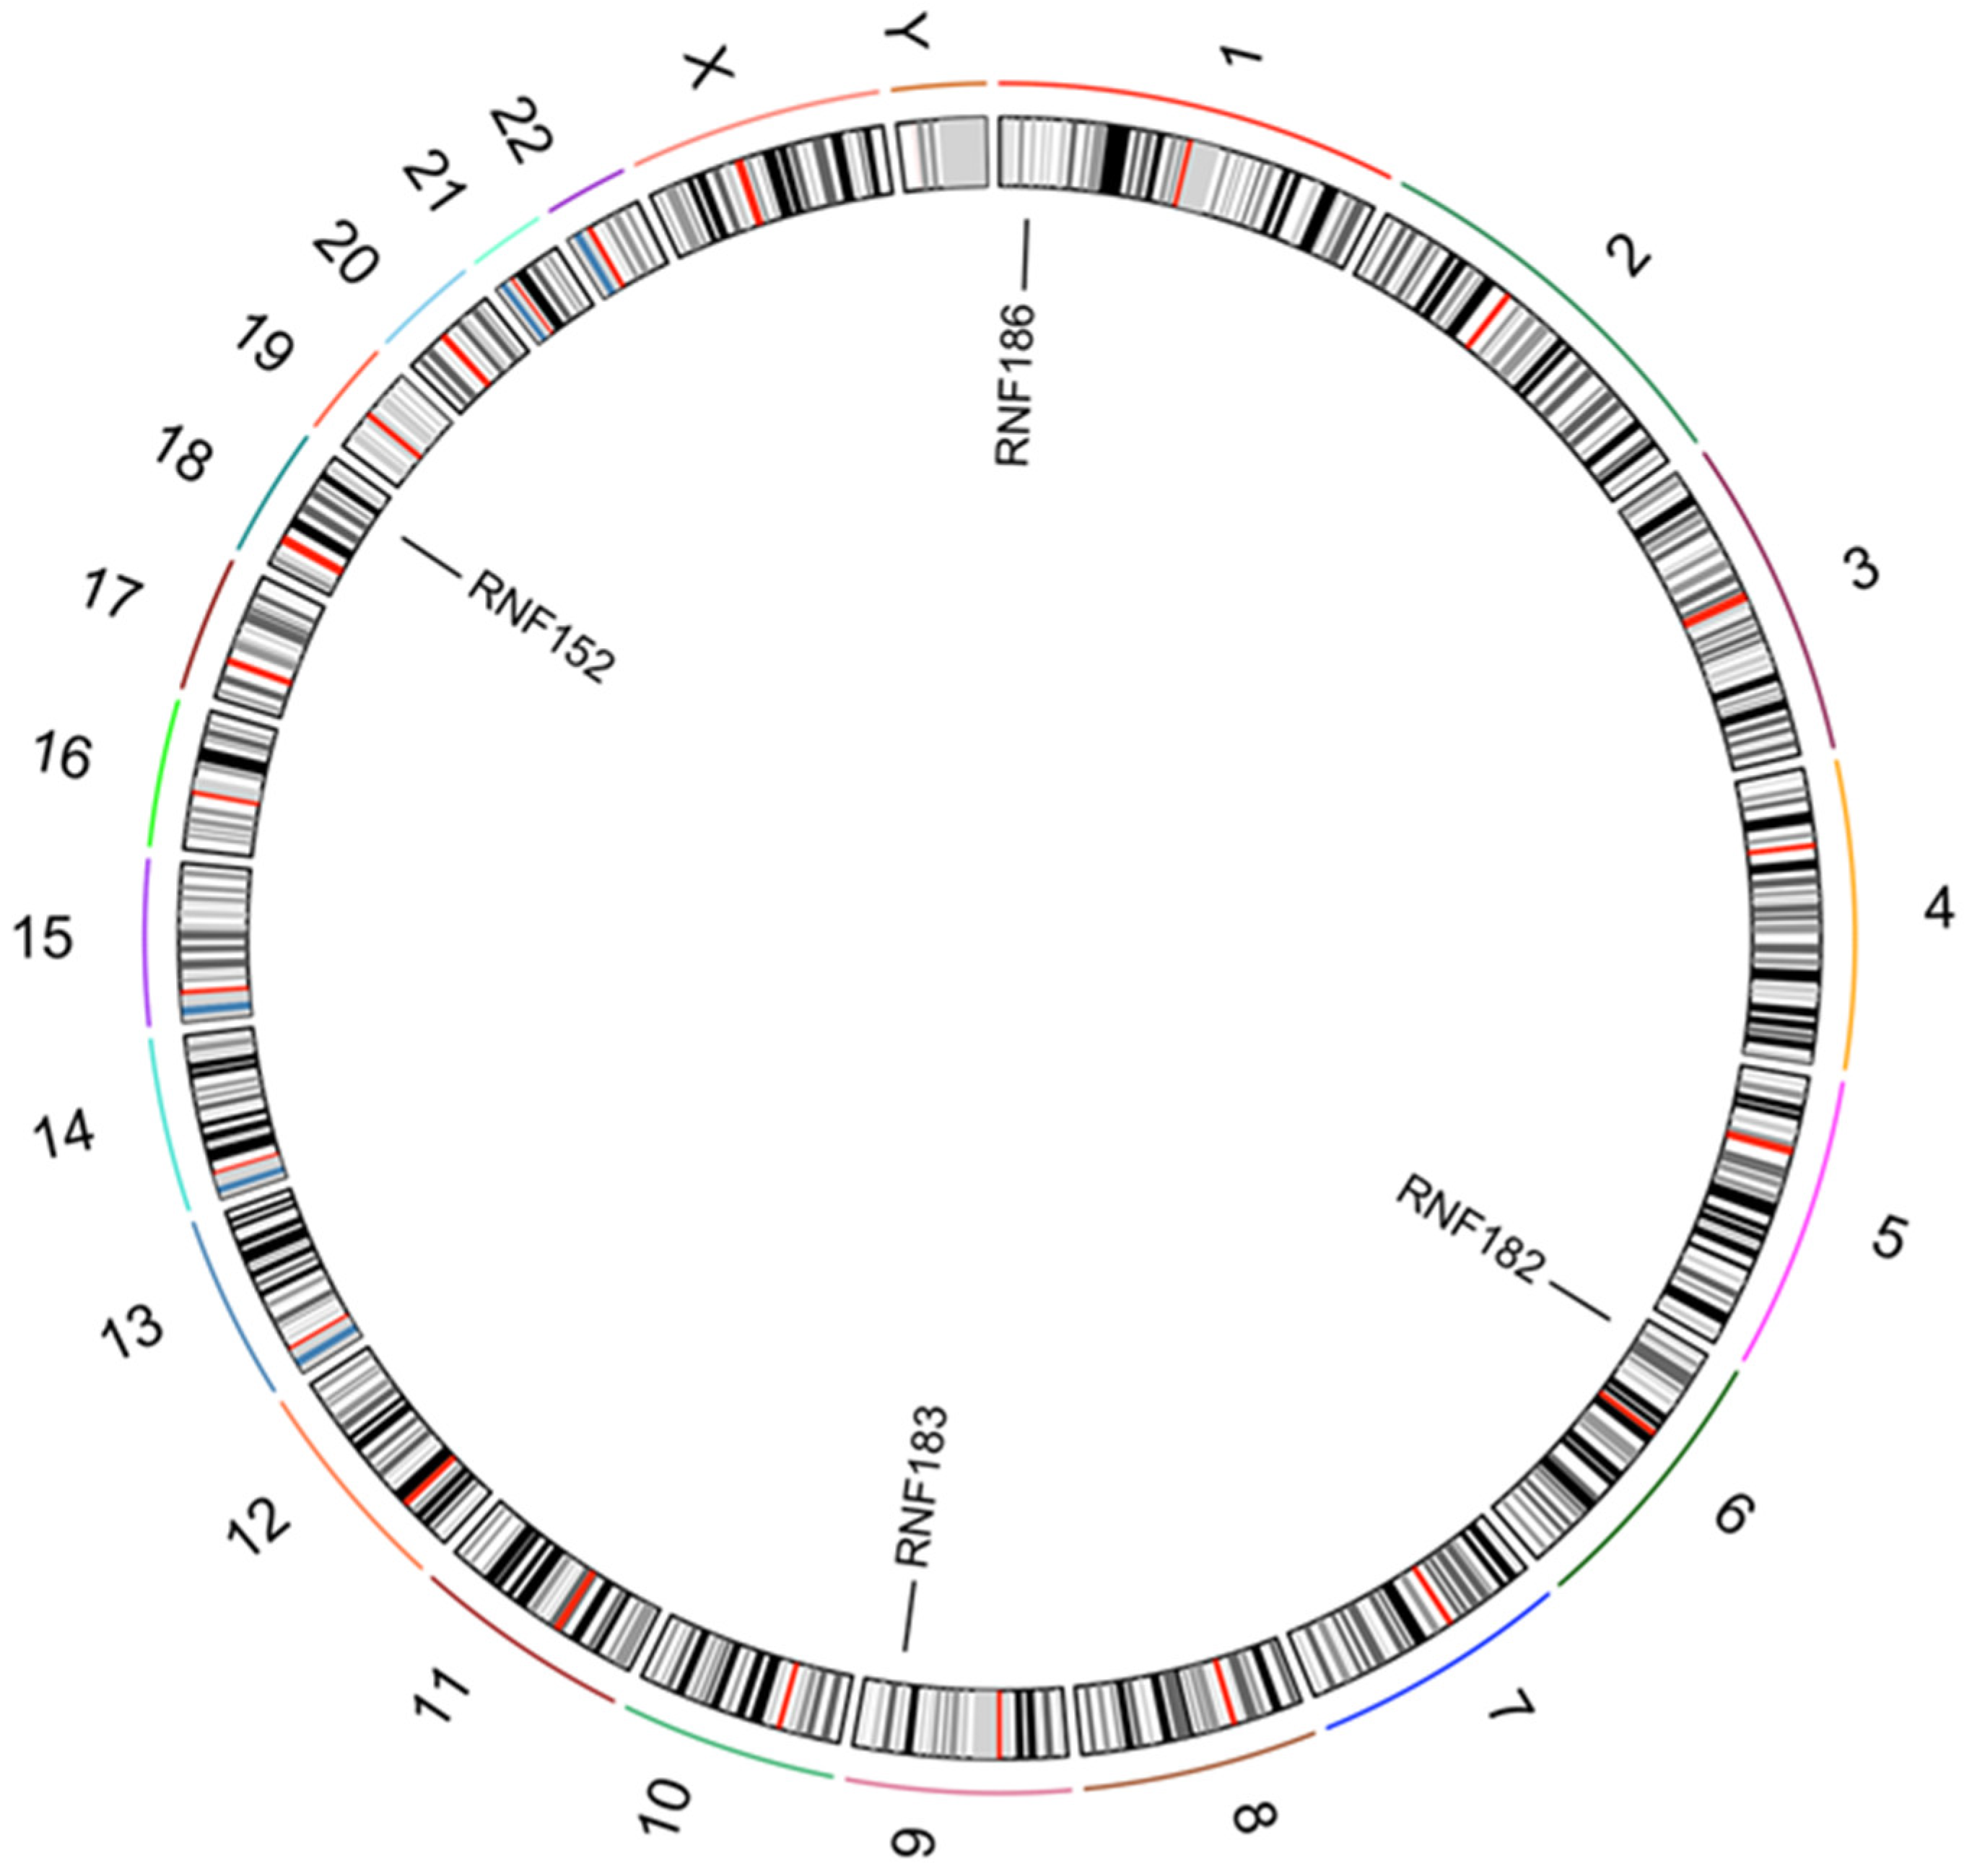
In this paper, we focus on RNF182, an E3 ligase predominantly expressed in the nervous system and belonging to the RNF183 family. This family is characterized by closely related genes encoding a RING-finger domain (C3HC4) at the N-terminus and one or two predicted transmembrane domains at the C-terminus, demonstrating high homology. Among the RNF183 family members (Figure 1), RNF182 is the least reported. Initially identified as a gene upregulated in the postmortem brains of patients with Alzheimer’s disease, RNF182 is also expressed in differentiated Ntera2 neurons and has been shown to be upregulated in response to oxygen and glucose deprivation [24]. However, its expression and role in glioblastoma have not yet been investigated.
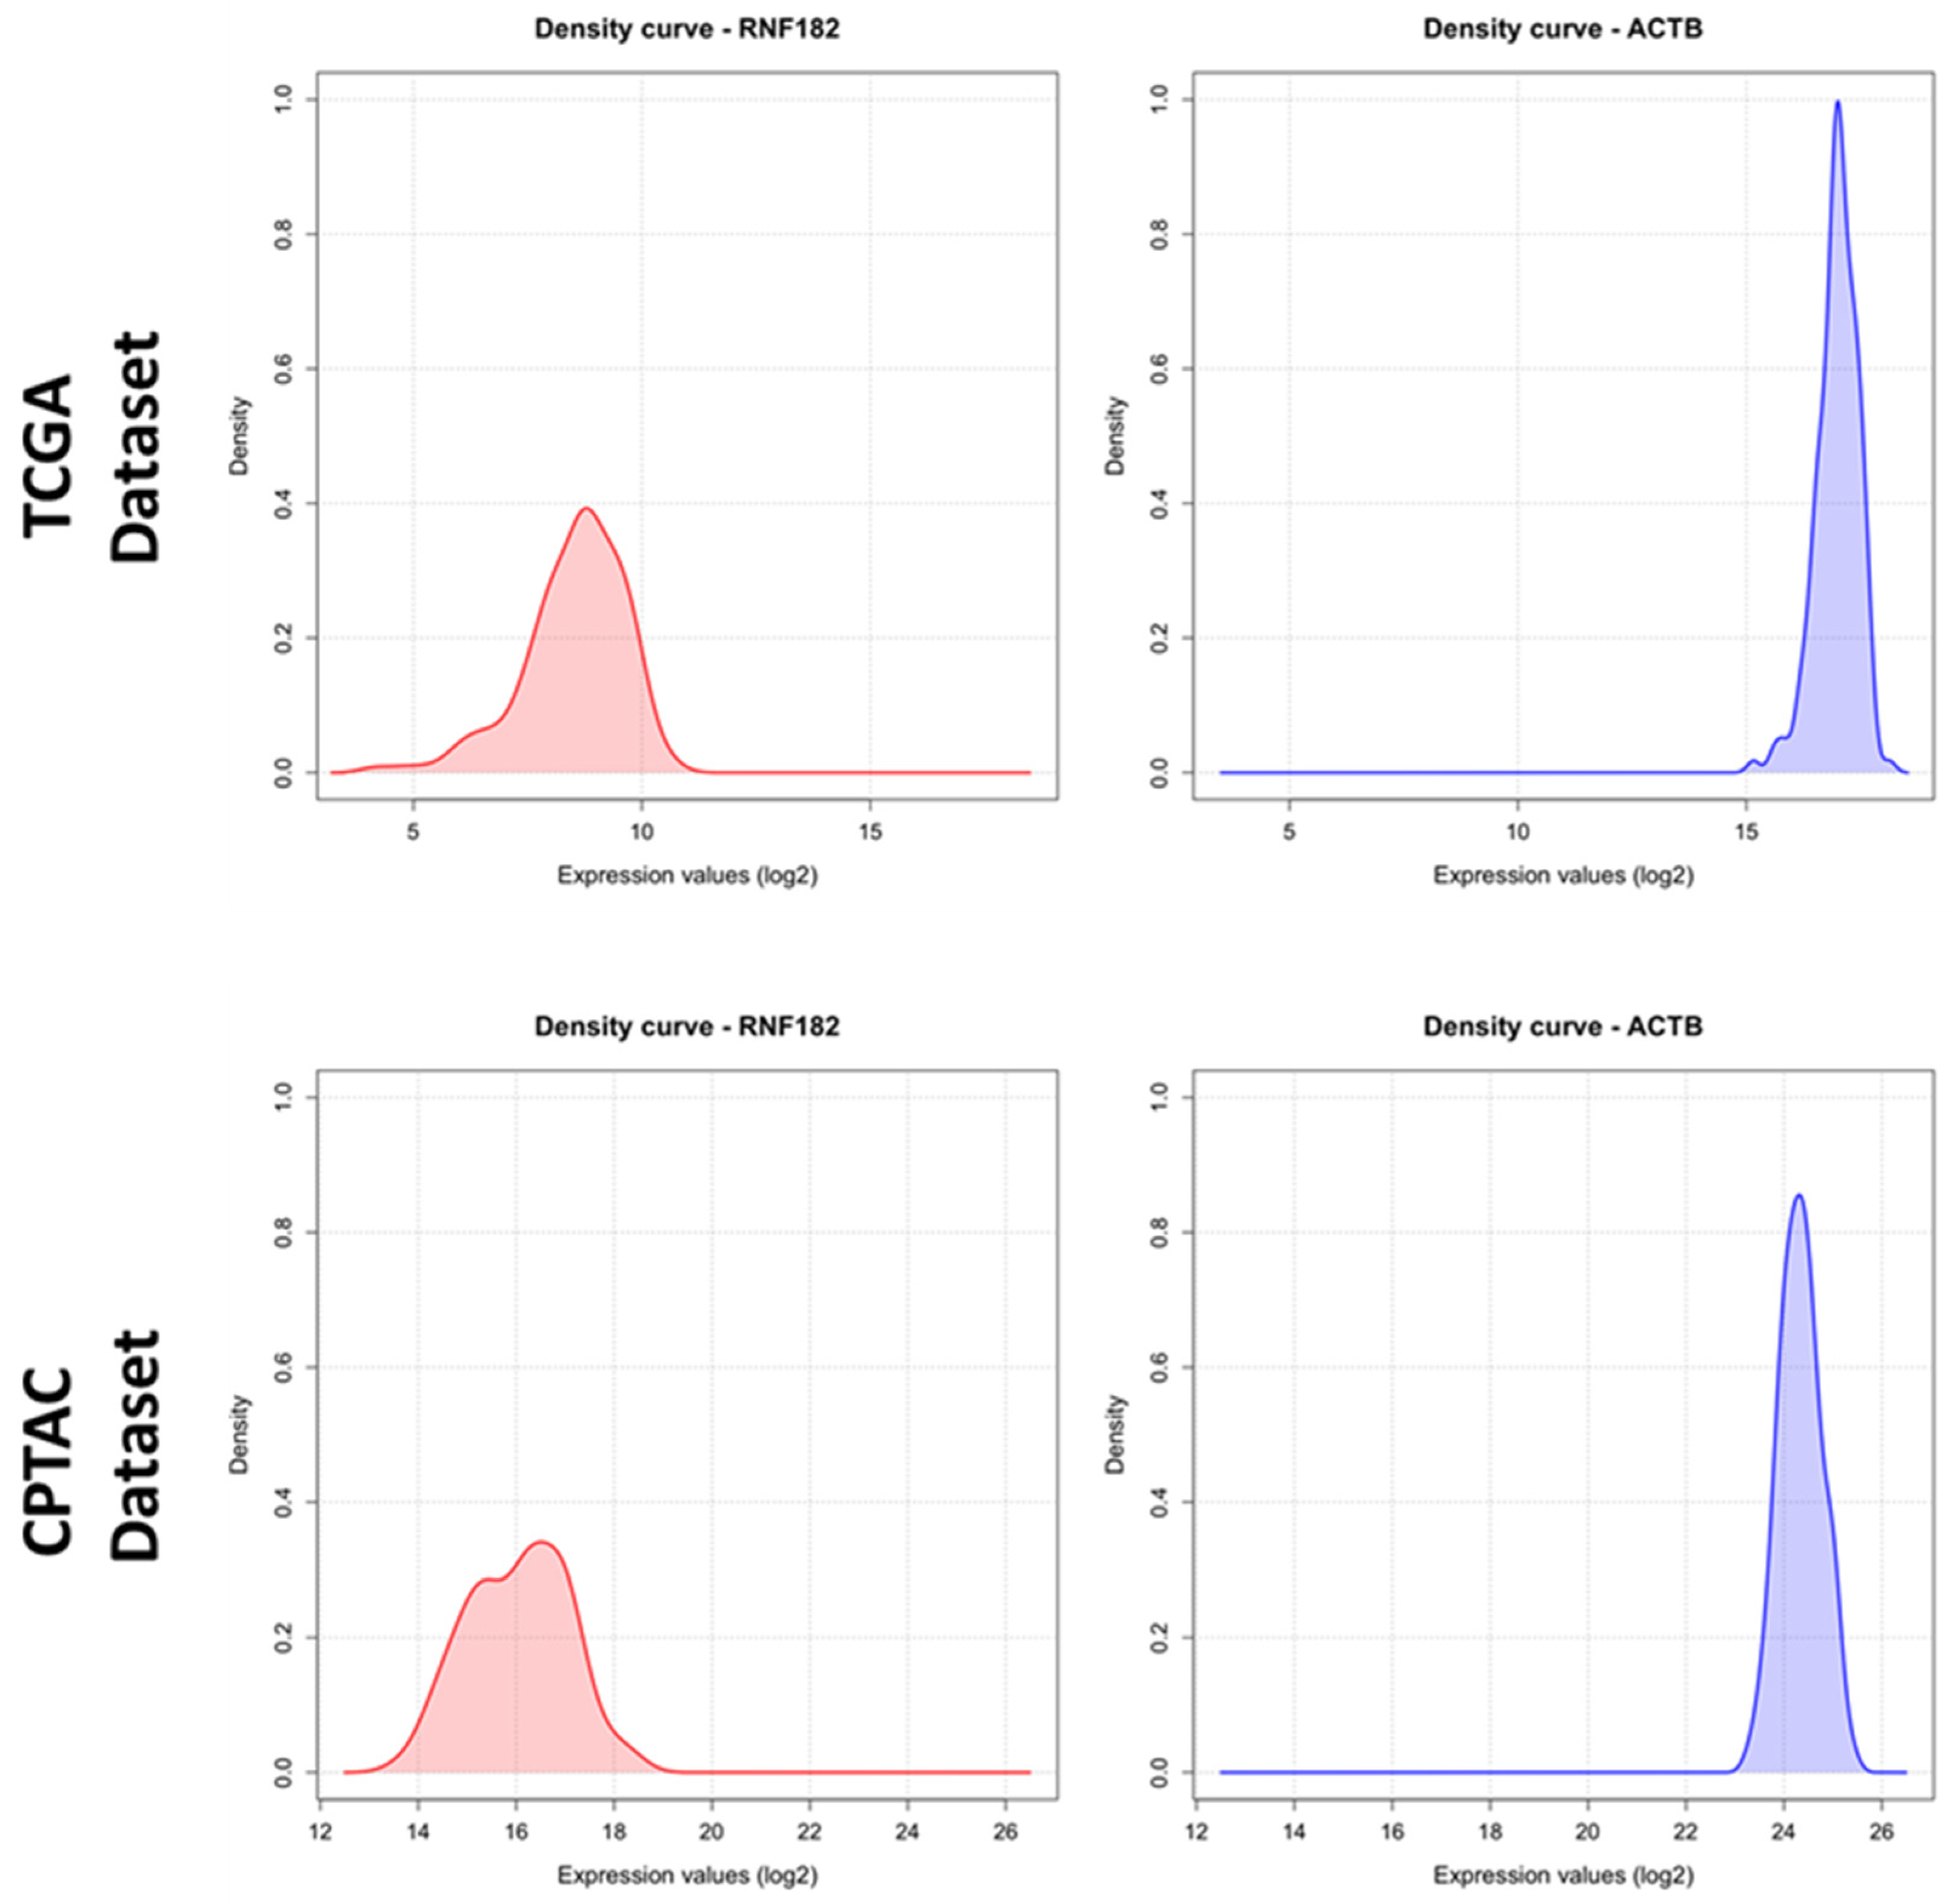
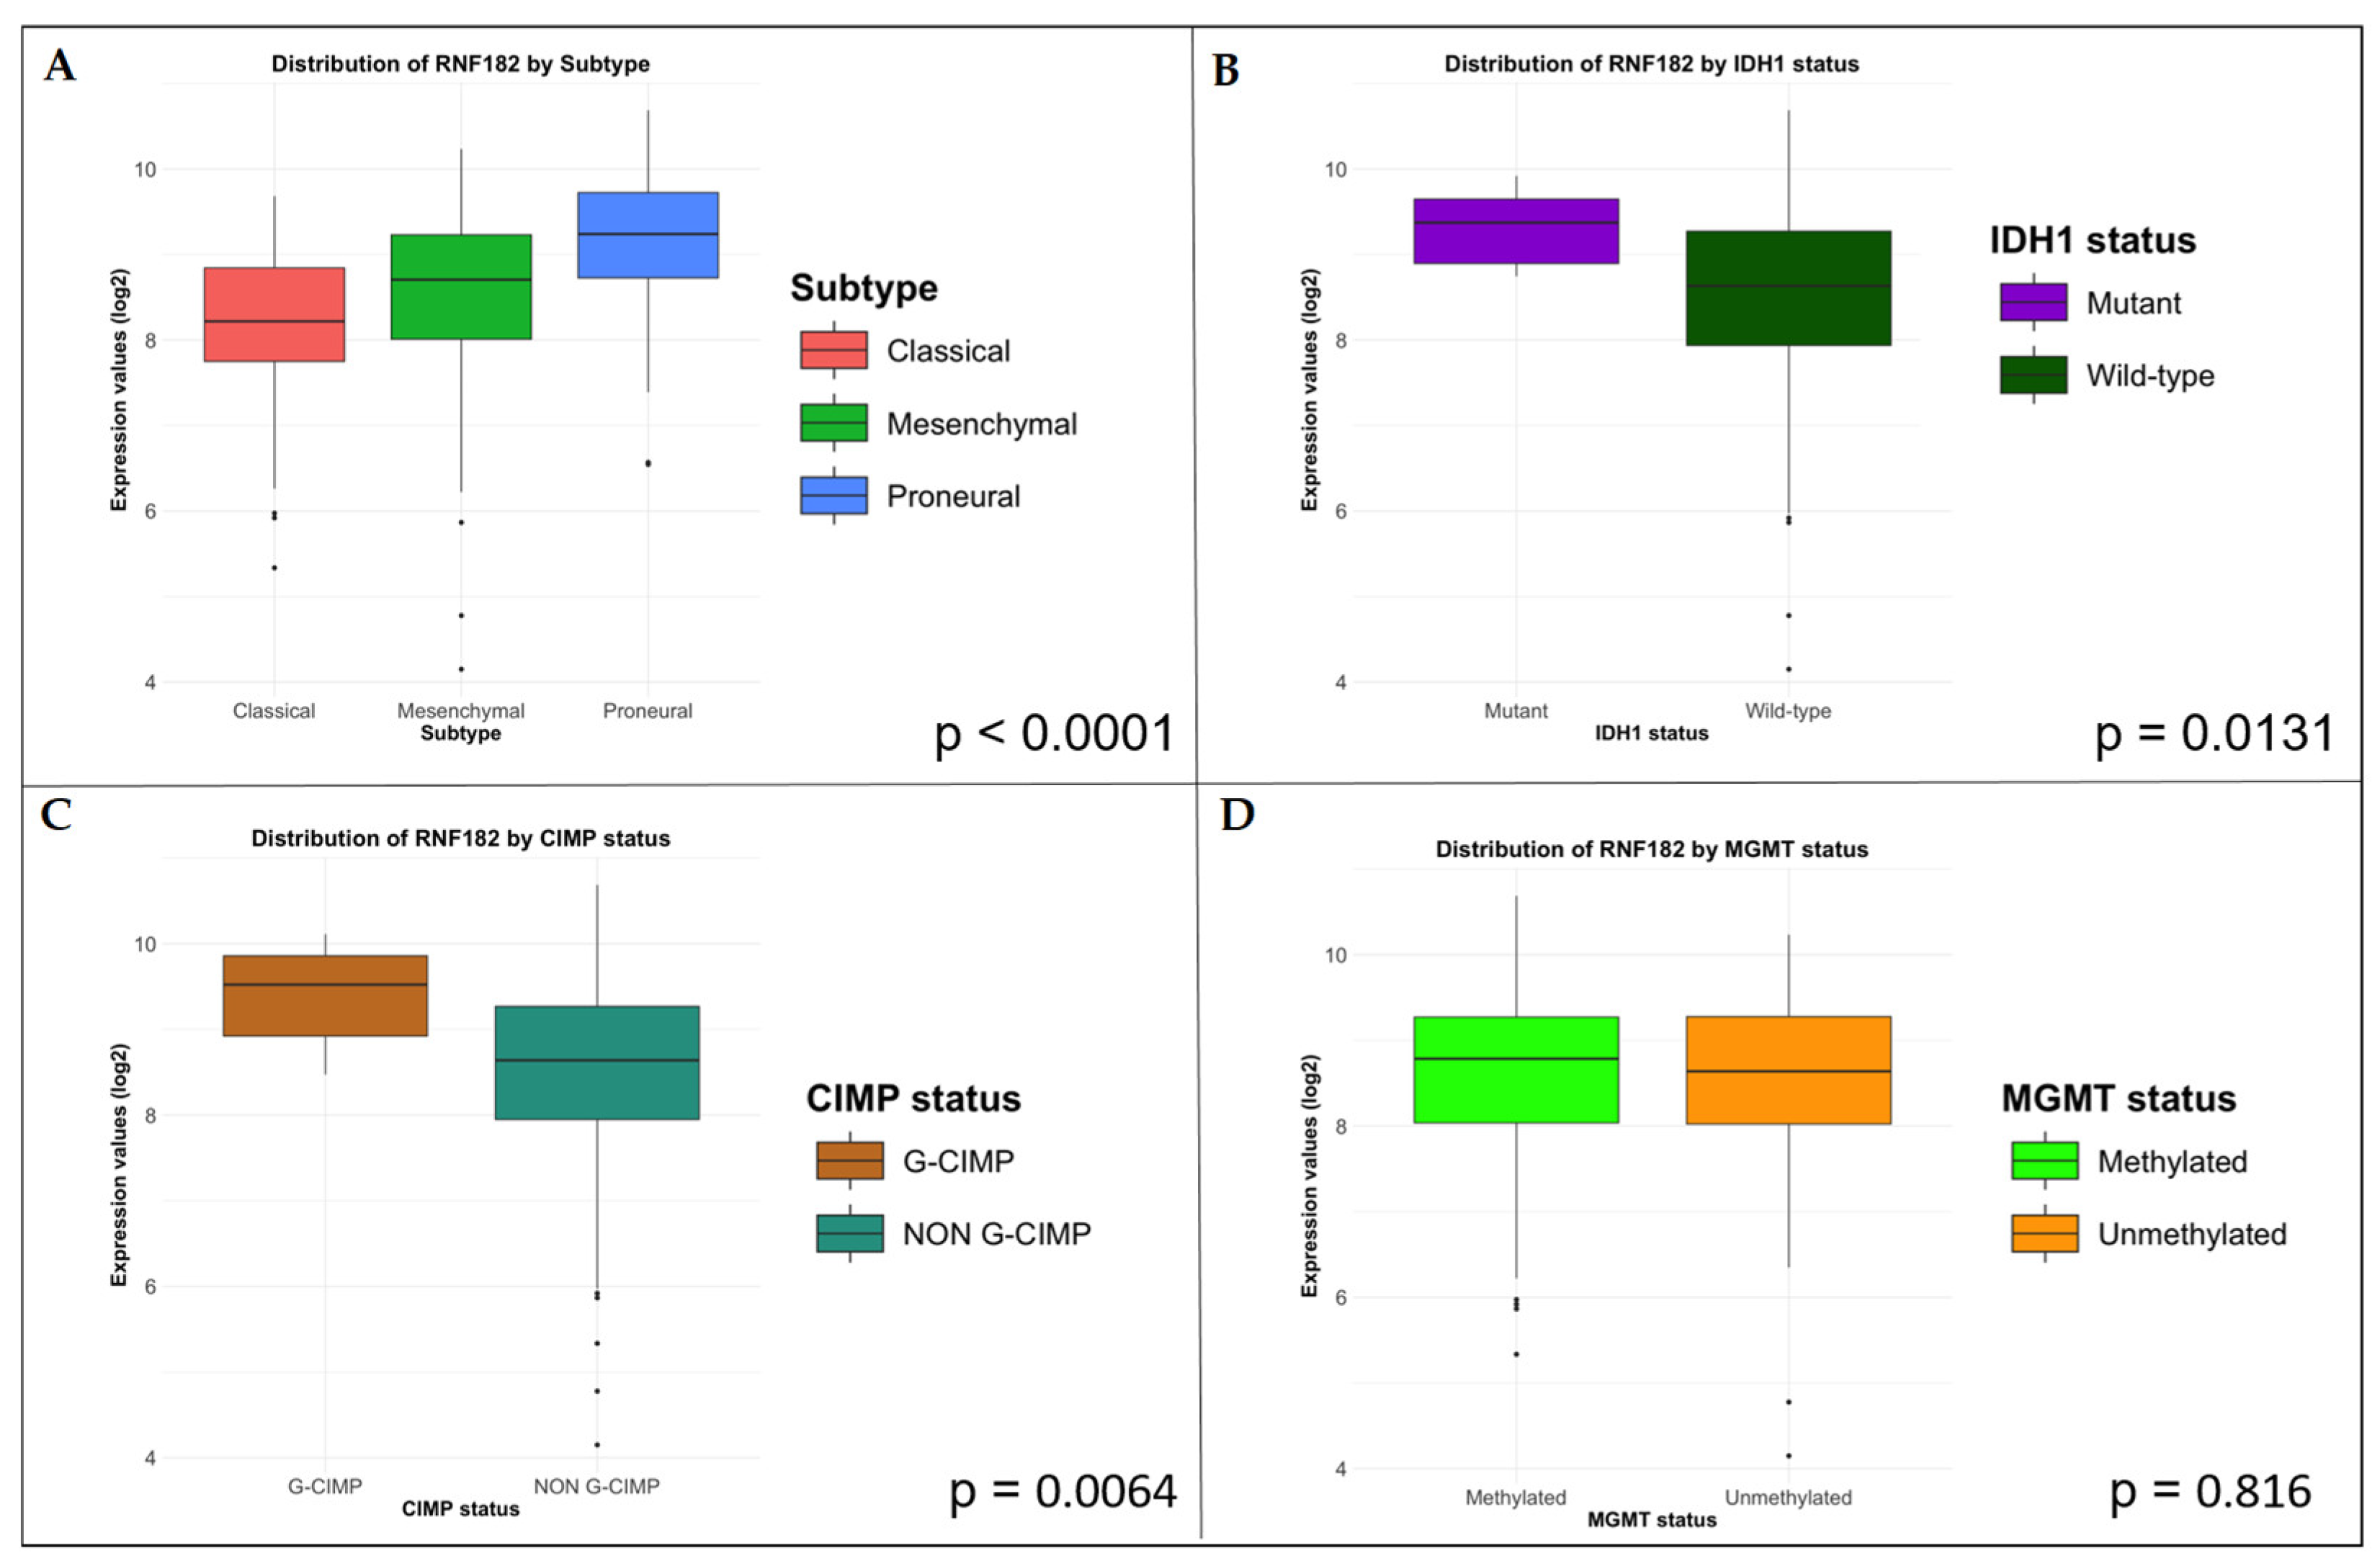
RNF182 exhibits a wide range of expression in GBM (Figure 2). Standard statistical analyses are summarized in Supplementary Figures S1 and S2. Statistical analysis revealed a significantly higher expression of RNF182 in the Proneural subtype (p < 0.0001), in tumors with IDH1 mutations (p = 0.0131), and in cases exhibiting the CpG island methylator phenotype (p = 0.0064) (Figure 3A–C). However, no significant differences were observed in the methylation status of the MGMT promoter (p = 0.816) (Figure 3D).

3.2. Biological Relevance of RNF182 in Gliomas

In order to understand the complex signaling networks of RNF182 in gliomas of different grades it was essential to quantify protein and gene expression and to examine the biological relevance of RNF182 in GBM. We analyzed 36 biopsy samples obtained from Neuromed patients following surgical resection of brain tumors, who provided informed consent for research studies. Of these 36 patients, 18 were affected by low-grade glioma and 18 were affected by GBM. The low-grade glioma group consisted of a heterogeneous adult population with a mean age of 50 years; most patients harbored an IDH1 mutation and 1p/19q co-deletion. The GBM group comprised a heterogeneous adult population with a mean age of approximately 60 years; among these, only four patients carried an IDH1 gene mutation (Table 1).
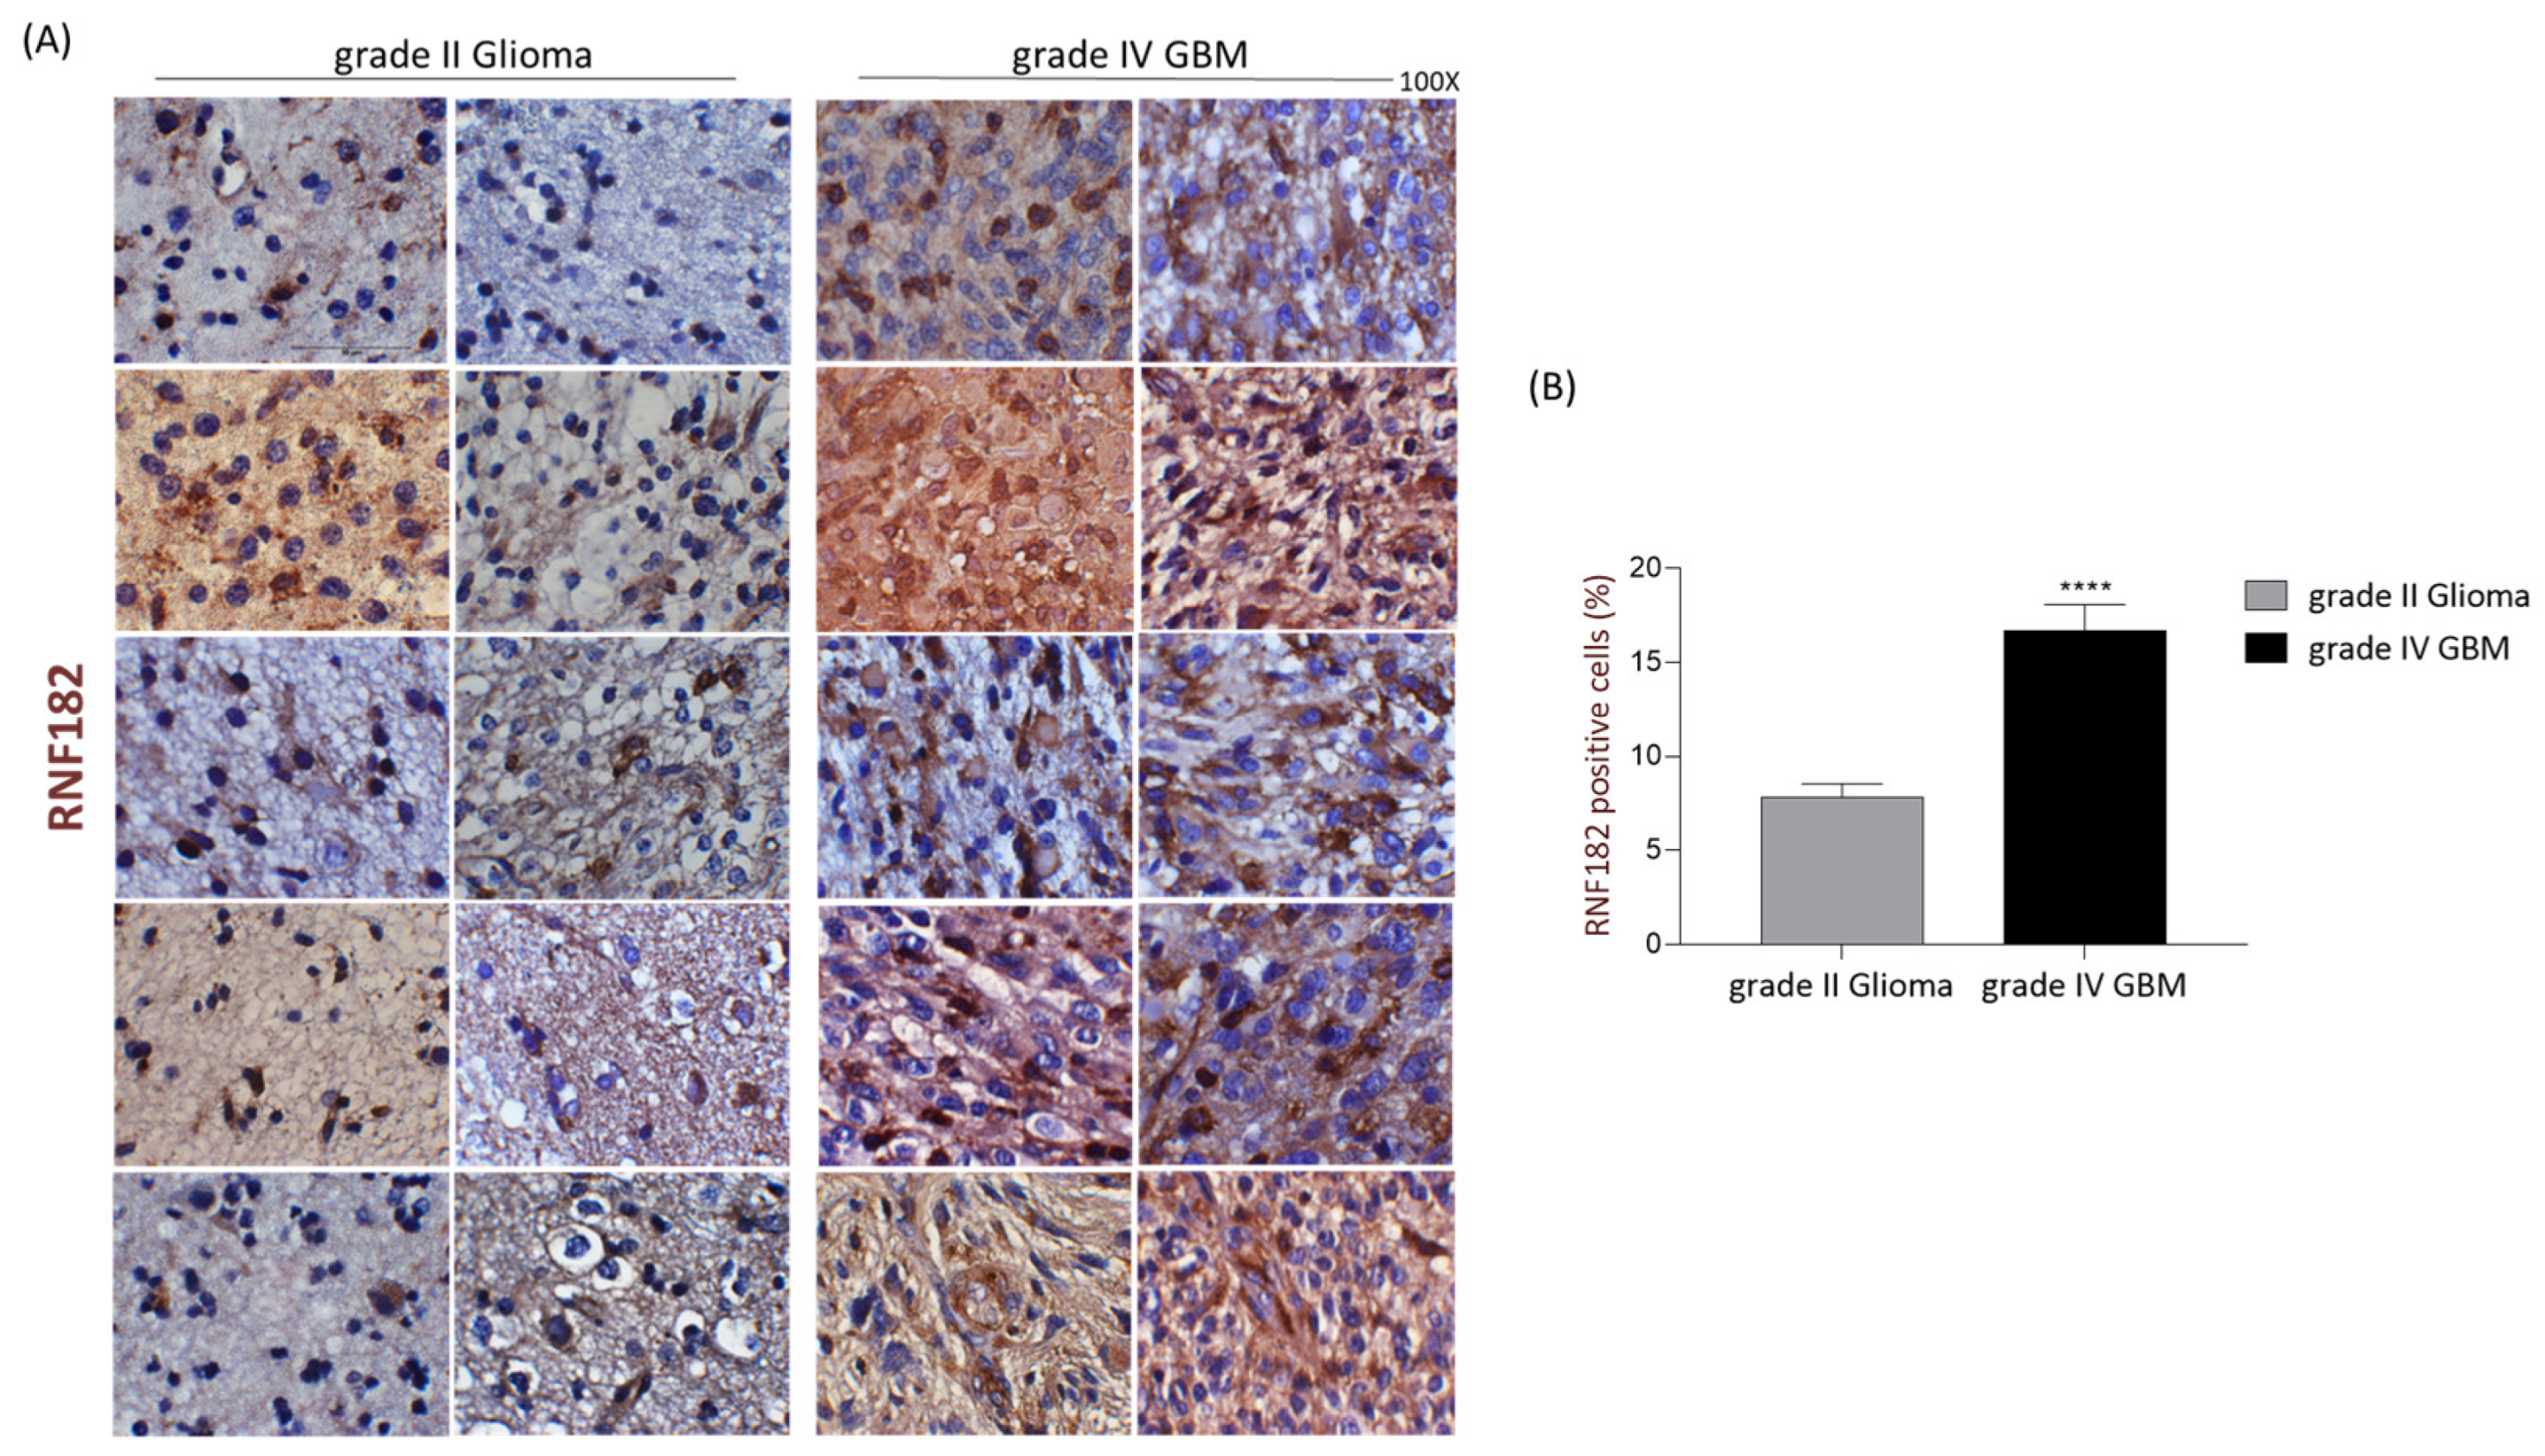
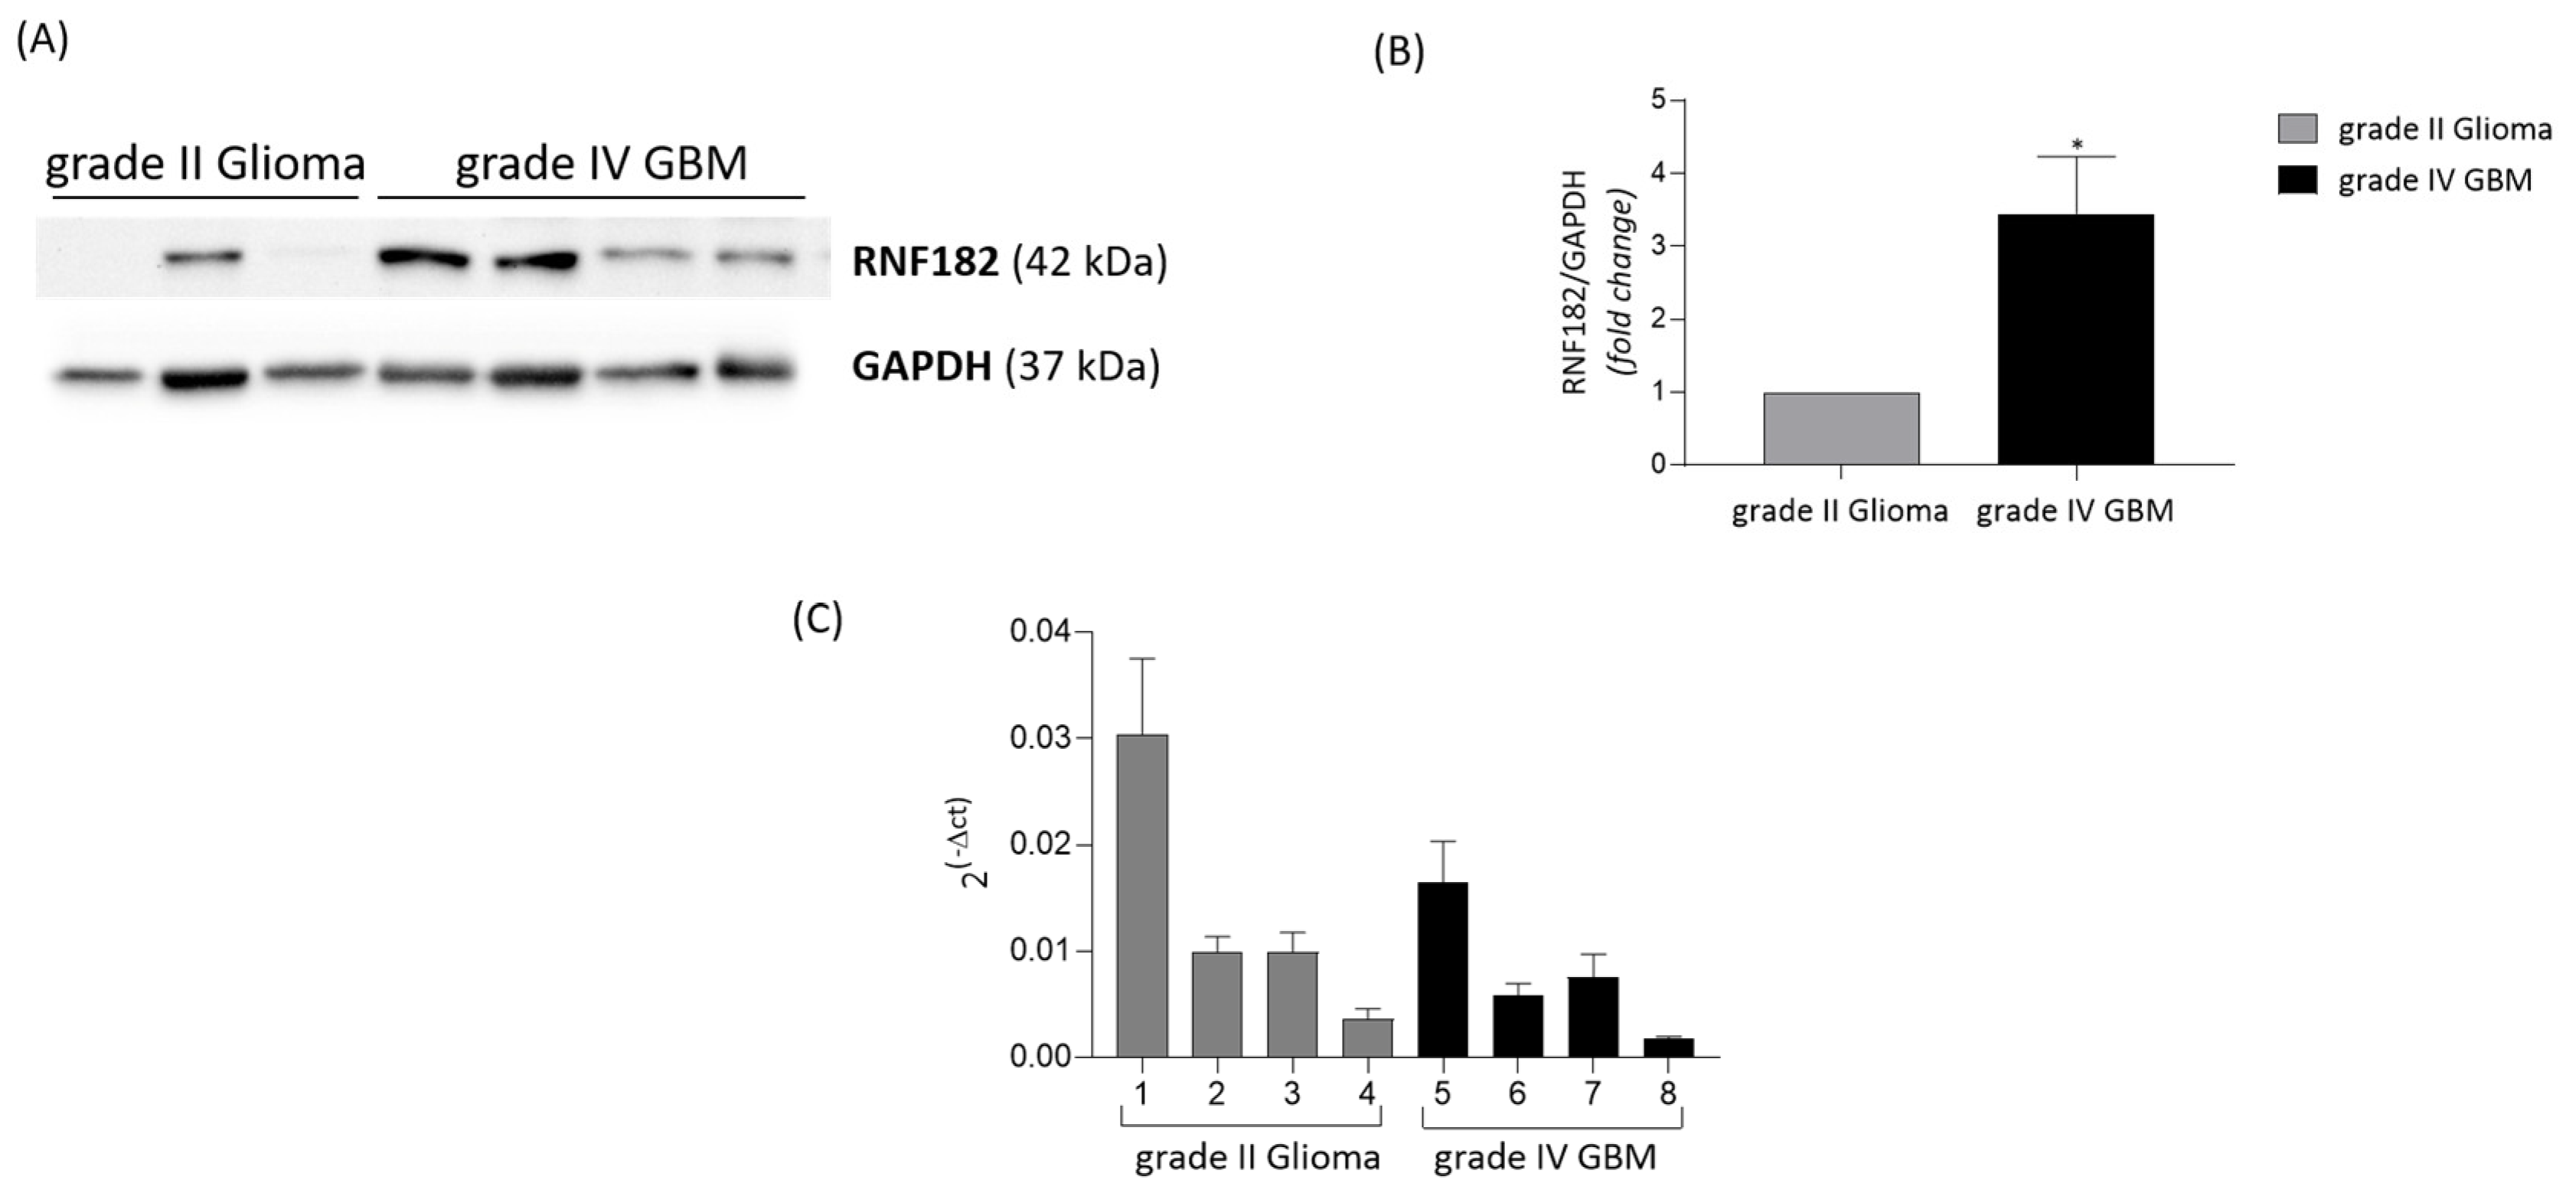
We initially examined the expression profile of RNF182 in 36 human glioma samples performing a comparative immunohistochemistry analysis on tissue slides with various grades of glioma. As shown in Figure 4A,B, the immunohistochemical analysis revealed a significant increment of RNF182 protein in high-grade compared to low-grade gliomas. In comparison to low-grade gliomas, GBM samples seem to have a greater percentage of RNF182-positive cells, exceeding 50%. The total proteins were extracted from frozen tissue biopsies and then analyzed by using Western blot analysis, in order to validate the immunohistochemistry results. Grade IV gliomas exhibited higher RNF182 protein expression than grade II gliomas, confirming outcomes reported in a previous investigation (Figure 5A,B). Therefore, we used reverse transcription-real-time quantitative polymerase chain reaction (RT-qPCR) to examine the expression of rnf182 in a cohort of tissues from grade II and grade IV gliomas. rnf182 RT-qPCR normalized with the control gene β-actin did not show significant expression changes in various grades of gliomas analyzed (Figure 5C).

3.3. RNF182-Mediated Regulation of GBM Cell Proliferation

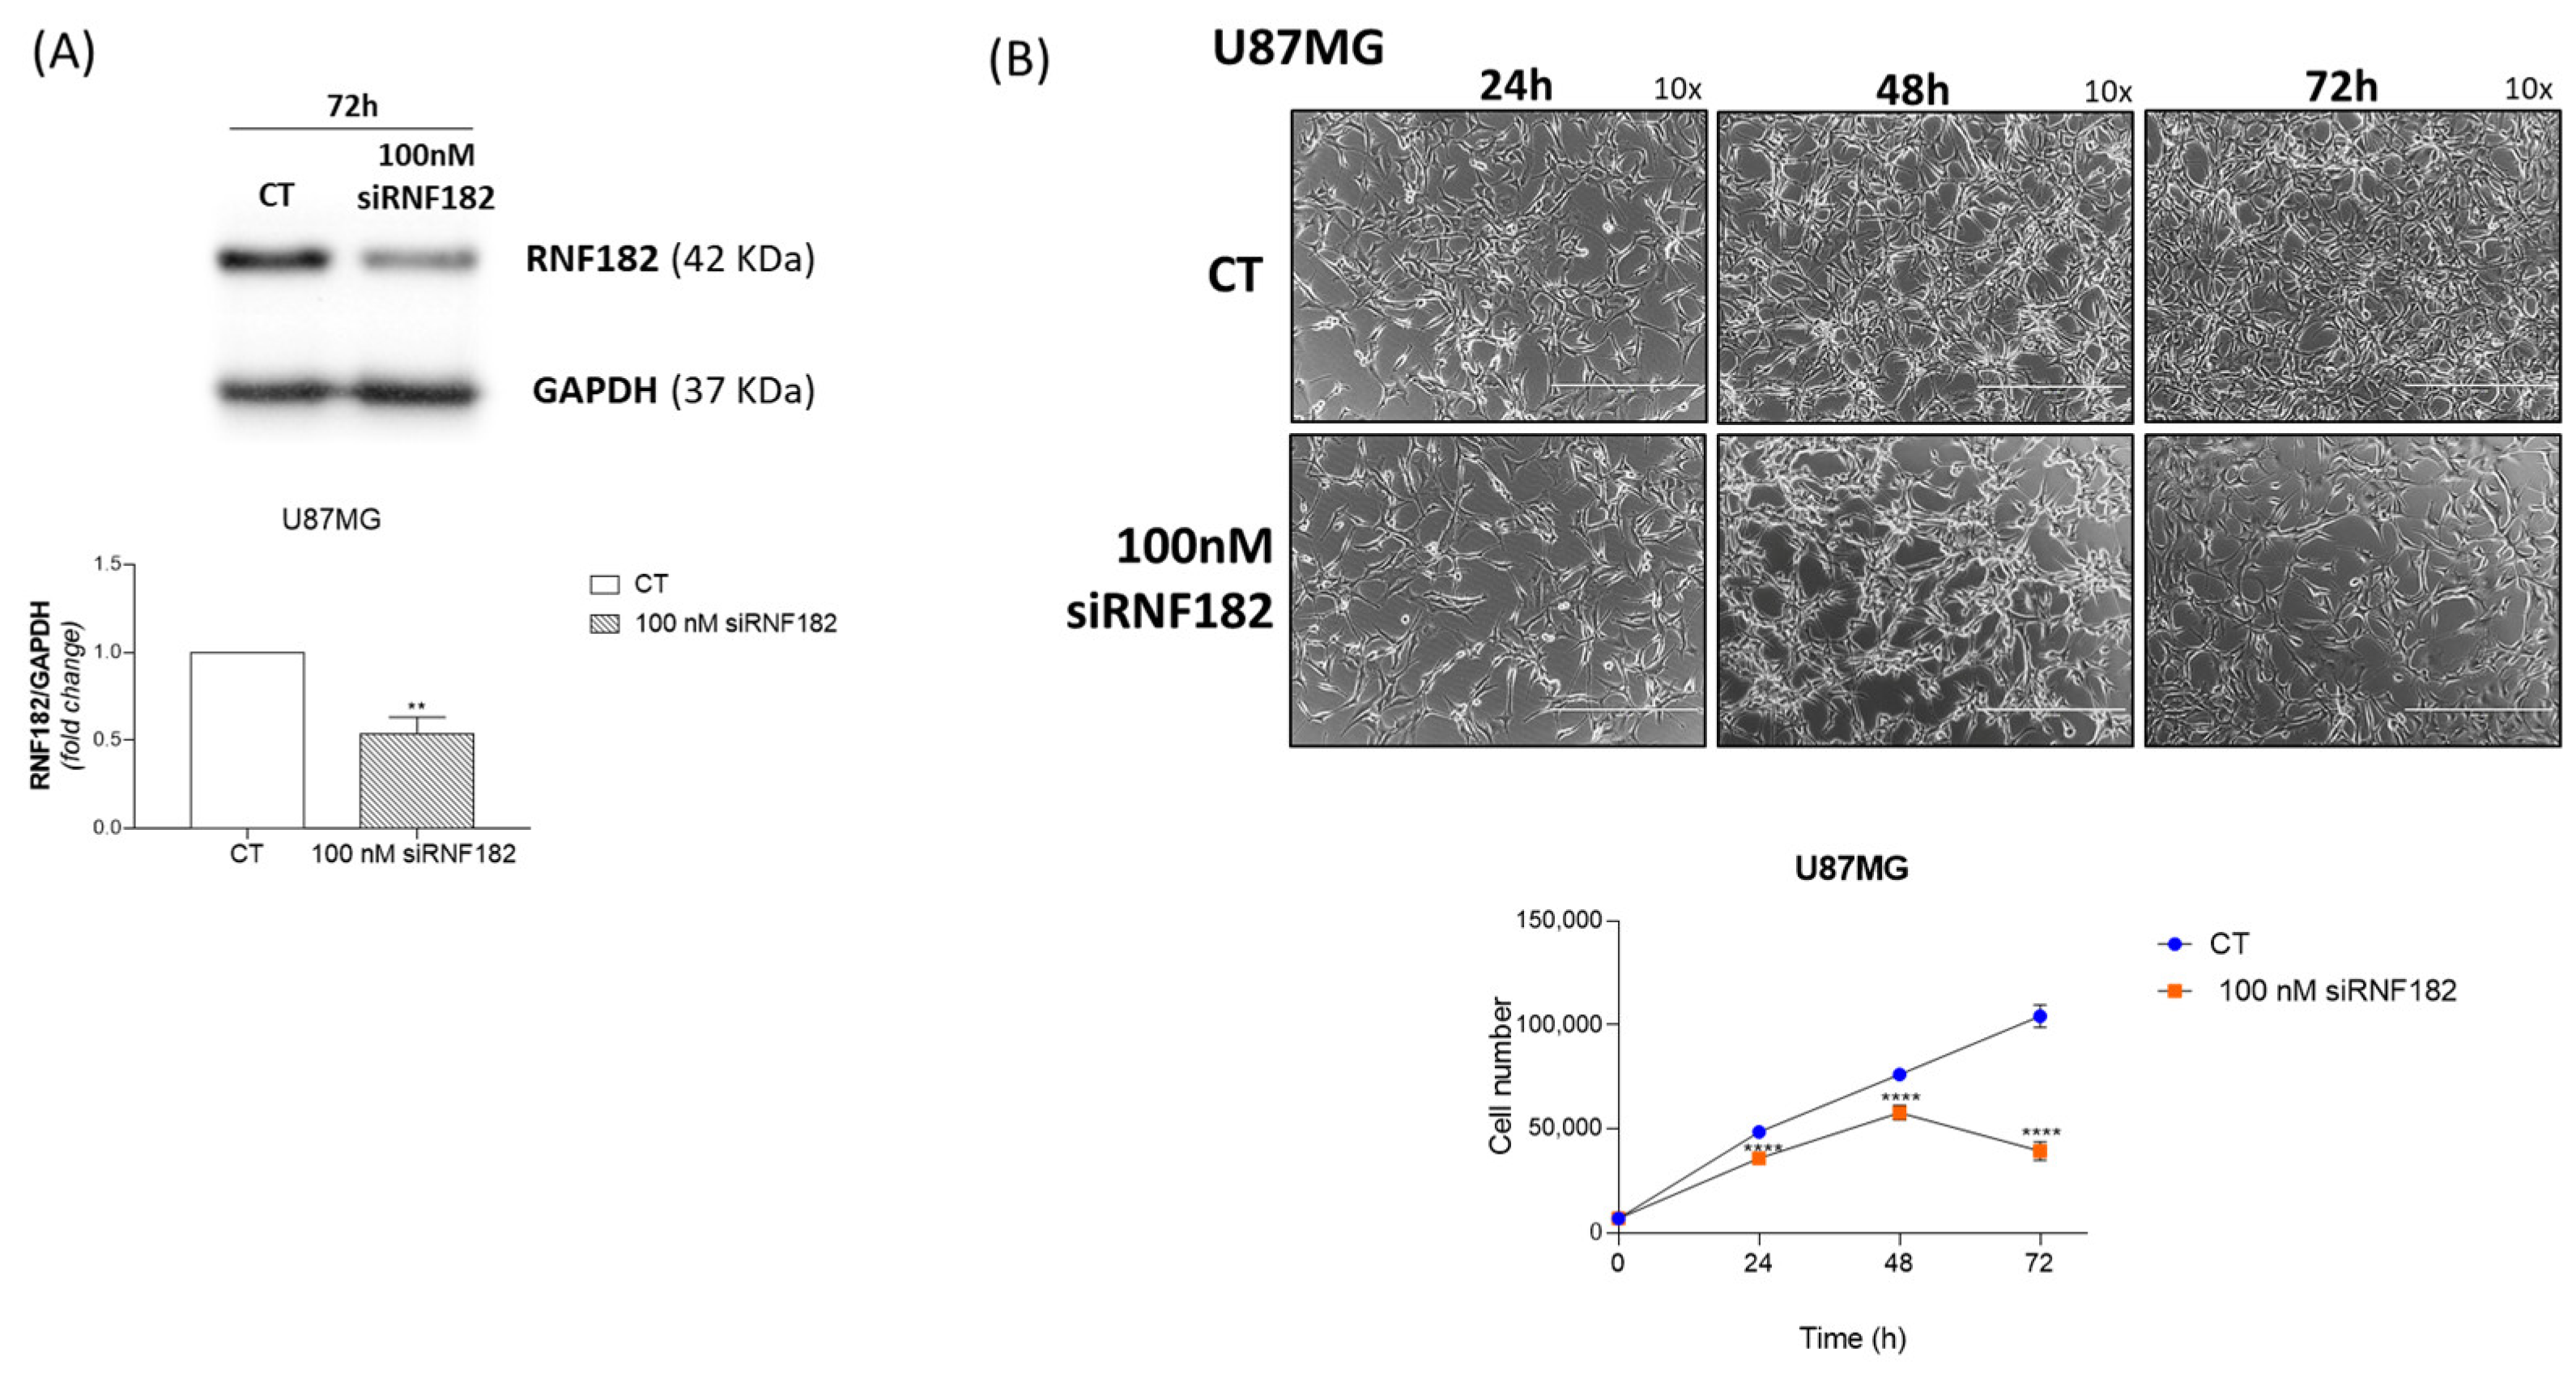
To evaluate the putative involvement of RNF182 protein in GBM development and in growth regulation, we performed the silencing of the rnf182 gene and evaluated cell proliferation. U87MG GBM continuous cell line was starved with complete DMEM 0.5% FBS for 48 h and subsequently transfected with duplex RNA RNF182 antisense for 72 h in order to evaluate the effect of the silencing on cell proliferation. Western blot examination clearly demonstrated the inhibitory effect of siRNA RNF182 on the expression of RNF182 protein. Treatment with 100 nM RNF182 siRNA reduced RNF182 protein expression at 72 h post-transfection (Figure 6A). In order to investigate the effects of siRNA RNF182 on GBM cell growth over time, cells were transfected with either siRNA scramble control or 100 nM siRNA RNF182. The cells were then harvested at different time points (24, 48, and 72 h) for cell proliferation assay and Western blot analysis at 72 h. The results showed that RNF182 siRNA significantly suppressed the proliferation of U87MG cells in a time-dependent manner. Compared with control cells, a significant growth-inhibitory effect was observed as early as 24 h post-transfection, with inhibition progressively increasing and reaching a maximum at 72 h after transfection (Figure 6B).

4. Discussion

Glioblastoma multiforme (GBM) is the most aggressive glioma, marked by invasive tumor cells, cellular heterogeneity, and glioma stem-like cells. Key dysregulated pathways include p53, RTK/RAS/PI3K, and RB [26,27,28]. Standard treatment combines surgery, radiotherapy, and temozolomide [13]. However, this treatment has limited effectiveness due to the tumor location and infiltration extent, and the potential brain damage from high doses of radiation. The TMZ effect, which blocks the cell cycle and activates apoptosis, is often hindered by DNA repair systems, which rely on O6-methylguanine methyltransferase (MGMT) [29]. Studies have been conducted to develop more effective therapies for GBM. New strategies, such as nanoparticles, immunotherapy, oncolytic viruses, or compounds with synergistic effects to TMZ, have been suggested to improve treatment efficiency. The chance of survival is significantly worse for older individuals with the disease [30,31]. Due to a lack of knowledge regarding the molecular pathways behind gliomagenesis, drug-based curative treatments are not the best option for treating gliomas. Furthermore, therapeutic delays for gliomas are caused by the imprecise and limited detection of early-stage gliomas gliomagenesis [32,33].
It has recently been established that genetic markers are useful clinical indicators that can be precisely assessed to forecast the course of gliomas [34]. Accordingly, optimizing current methodologies and introducing innovative techniques are imperative to improve the prognosis of patients with gliomas. The UPS-mediated proteolysis of cellular proteins is a complex mechanism regulating intricate biological interactions essential for cell survival, growth, and metabolism [35,36]. Consequently, the dysregulation of the UPS is causally linked to numerous human diseases, such as neurodegeneration and cancer [37]. Adjusting the total UPS function is a treatment approach currently undergoing evaluation for addressing various human conditions. Nonetheless, the use of it is restricted due to non-specific side effects and toxicity issues. A different strategy, focusing on the activity levels of particular E3 ligases, is appealing and potentially a more successful therapeutic approach [38,39]. Changes in the expression profile of components of the ubiquitin ligase complexes have been reported in diverse tumors [40,41]. Ubiquitin Conjugating Enzyme E2 S (UBE2S), an ub-conjugating enzyme that regulates cell cycle progression, is upregulated in high-grade astrocytoma [42]. The UBE2S was first recognized as an essential component in regulating substrate ubiquitination during the later stages of the complex’s functionality. In recent years, UBE2S has gained prominence as a vital epigenetic modification associated with various diseases, such as myocardial ischemia, viral hepatitis, and particularly, cancer. Increasing evidence indicates that UBE2S is instrumental in several human cancers, including breast cancer, lung cancer, and hepatocellular carcinoma, among others [43]. Nevertheless, a thorough review of UBE2S in the context of human tumor research is still lacking. Furthermore, the investigation into the role of UBE2S in developing resistance to cancer treatments is also addressed. The results imply that UBE2S presents potential as both a diagnostic and therapeutic target across multiple malignancies, thus paving the way for innovative cancer treatment strategies [44]. Somatic mutations of ubiquitin ligases have been identified in GBM and in other human malignancies, further supporting a pathogenic role of deregulated UPS in brain tumors [45]. Changes in E3 ubiquitin ligases, whether they are excessively produced or not produced enough, can cause cancer cells to become resistant to drugs. This happens because these changes affect important cell functions like fixing damaged DNA, programmed cell death, and how cells communicate with each other. For instance, when the E3 ligase UBR5 is produced in larger amounts, it is connected to resistance against platinum drugs in ovarian cancer [46]. On the other hand, when there is less of the ligase RNF125, it is linked to resistance against BRAF inhibitors in melanoma by influencing how cells signal. Alternatively, specifically stopping or changing these altered ligases could be a treatment approach to get around drug resistance [47]. Based on these findings, in our study, we investigated the role of a new ubiquitin ligase with unknown activity in glioblastoma. Our computational analysis suggested that RNF182 is upregulated in glioblastoma. Notably, RNF182 exhibits variable expression in GBM and is predominantly expressed in the proneural subtype, IDH1-mutated GBM and CpG island methylator phenotype. This in silico approach allowed us to assess whether RNF182 upregulation correlates with tumor grade and to assess its potential relevance to glioma progression. Motivated by these findings, we analyzed RNF182 expression in a cohort of 36 gliomas of different histopathological grades. Immunohistochemical analysis of tissue biopsies revealed that RNF182 expression progressively increases from low-grade astrocytomas to GBMs, indicating a strong association between RNF182 E3 ligase levels and tumor malignancy. The observed correlation implies that higher RNF182 expression may contribute to the advancement of glioma. Since RNF182 has been reported to regulate the ubiquitination and degradation of p65 (RELA), a key subunit of the nuclear factor kappa B (NF-κB) pathway that drives target gene transcription and promotes tumor progression [48], the distinct pattern of RNF182 protein expression observed in our study led us to hypothesize that this protein may play a pivotal role in the transition of gliomas from low-grade to high-grade forms. Consistently, Western blot analyses confirmed a significant increase in RNF182 protein abundance in grade IV GBM samples compared with grade II gliomas, reinforcing the notion that RNF182 upregulation is a molecular feature of high-grade tumors. Moreover, quantitative RT-qPCR analysis revealed no significant differences in RNF182 mRNA expression between low-grade and high-grade gliomas. This apparent discrepancy between unchanged transcript levels and increased protein abundance suggests that RNF182 regulation in gliomas occurs predominantly at the post-transcriptional level, potentially involving altered protein stability, translation efficiency, or degradation pathways associated with tumor progression. To elucidate the functional significance of RNF182 in gliomagenesis, its expression was suppressed in U87MG cells for 72 h using an antisense RNA duplex. Silencing of RNF182 resulted in a pronounced decrease in cell proliferation, with up to 50% inhibition of cell growth. Taken together, these findings provide functional evidence supporting a pivotal role for RNF182 in sustaining GBM cell growth and tumorigenic potential. Importantly, this evidence positions RNF182 as a promising molecular target and may inform the development of more effective, target-oriented therapeutic strategies for aggressive human GBM.

5. Conclusions

In conclusion, genetic or proteomic alterations affecting components of the ubiquitin–proteasome system (UPS), or their regulatory partners, can disrupt protein homeostasis, leading either to the pathological accumulation of oncoproteins or to the accelerated degradation of tumor suppressors. In this context, elucidating the functional interplay between RNF182, the ubiquitin–proteasome system (UPS), and glioma progression is particularly relevant for the development of selective, effective, and less toxic therapeutic strategies. Although classical proteasome inhibitors have demonstrated antitumor potential in glioma models, their clinical application is limited by systemic toxicity and lack of specificity. Consequently, alternative approaches such as selectively targeting UPS-associated proteins or exploiting emerging technologies like proteolysis-targeting chimeras (PROTACs) represent promising avenues to modulate proteasomal degradation pathways with greater precision and therapeutic benefit in gliomas.

Supplementary Materials

The following supporting information can be downloaded at: https://www.mdpi.com/article/10.3390/cancers18081217/s1, Files S1 and S2: The original Western blot figures; Supplementary Figures S1 and S2: Standard statistical analysis.

Author Contributions

Conceptualization, A.A. and F.G.; computational analysis, M.C.; formal analysis, V.R., M.R. and M.A.O.; investigation, V.R., M.R. and M.A.O.; data curation, V.R., M.R. and M.A.O.; writing, A.A.; review and editing, V.R., M.R. and M.A.O.; visualization, M.A.; supervision, A.A. All authors have read and agreed to the published version of the manuscript.

Funding

This research was funded by the PNRR-TR1-2023-12377378 “Piano Nazionale di Ripresa e Resilienza- Missione 6 Salute” (National Recovery and Resilience Plan, Mission 6 Health.); CUP: F53C23000230001.

Institutional Review Board Statement

This study was conducted in accordance with the Declaration of Helsinki, and approved by the Territorial Ethics Committee ASREM of Molise (protocol of 16 July 2024).

Informed Consent Statement

Informed consent was obtained from all Neuromed patients involved in the study.

Data Availability Statement

The data that support the findings of this study are available from the corresponding author upon reasonable request.

Acknowledgments

I would like to express my sincere gratitude to Felice Giangaspero for introducing me to the field of brain tumor research and for guiding and mentoring me over the past 20 years.

Conflicts of Interest

The authors declare no conflicts of interest.

Abbreviations

GBMGlioblastoma
IDH1Isocitrate dehydrogenase 1
TERTTelomerase reverse transcriptase
CDKN2ACyclin-dependent kinase inhibitor 2°
G-CIMPGlioma CpG island methylator phenotype
TMZTemozolomide
MGMTO6-methylguanine-DNA-methyltransferase
UPSUbiquitin–proteasome system
ATP6V0CATPase H+ transporting V0 subunit c
RNF182Ring finger protein 182
TLRTool-like receptors
NF-κBNuclear Factor kappa-light-chain-enhancer of activated B cells
RELAv-rel avian reticuloendotheliosis viral oncogene homolog A
ADAlzheimer’s disease
WGCNAWeighted gene co-expression network analysis
GOGene ontology
DAVIDVisualization and integrated discovery
U87MGUppsala 87 malignant glioma
PBSPhosphate-buffered saline
DAB3,3′-diaminobenzidina
SDS-PAGESodium dodecyl sulfate-polyacrylamide gel electrophoresis
DMEMDulbecco’s modified Eagle’s medium
FBSFetal bovine serum
RTK/RAS/PI3KTyrosine kinase receptor/Rat sarcoma virus/phosphoinositide 3-kinase
EDTAEthylenediaminetetraacetic acid
GAPDHGlyceraldehyde-3-phosphate dehydrogenase
siRNASmall interfering RNA
SOX2Sex-determining region Y-box 2
MUTMutate
WTWild-type
WHOWorld Health Organization
GSCsGlioma stem-like cells
RT-qPCRReverse transcription-quantitative polymerase chain reaction
UBE2SUbiquitin conjugating enzyme E2 S
UBR5Ubiquitin protein ligase E3 component N-recognin 5
RNF125Ring finger protein 125
PROTACsProteolysis targeting chimeras

References

  1. Ostrom, Q.T.; Cioffi, G.; Gittleman, H.; Patil, N.; Waite, K.; Kruchko, C.; Barnholtz-Sloan, J.S. CBTRUS Statistical Report: Primary Brain and Other Central Nervous System Tumors Diagnosed in the United States in 2012–2016. Neuro Oncol. 2019, 21, v1–v100. [Google Scholar] [CrossRef]
  2. Hanif, F.; Muzaffar, K.; Perveen, K.; Malhi, S.M.; Simjee, S.H.U. Glioblastoma Multiforme: A Review of its Epidemiology and Pathogenesis Through Clinical Presentation and Treatment. Asian Pac. J. Cancer Prev. 2017, 18, 3–9. [Google Scholar]
  3. Louis, D.N.; Perry, A.; Reifenberger, G.; von Deimling, A.; Figarella-Branger, D.; Cavenee, W.K.; Ohgaki, H.; Wiestler, O.D.; Kleihues, P.; Ellison, D.W. The 2016 World Health Organization Classification of Tumors of the Central Nervous System: A summary. Acta Neuropathol. 2016, 131, 803–820. [Google Scholar] [CrossRef] [PubMed]
  4. Patterson, J.D.; Wongsurawat, T.; Rodriguez, A. A Glioblastoma Genomics Primer for Clinicians. Med. Res. Arch. 2020, 8, 1–17. [Google Scholar] [CrossRef] [PubMed]
  5. Brat, D.J.; Aldape, K.; Colman, H.; Figrarella-Branger, D.; Fuller, G.N.; Giannini, C.; Holland, E.C.; Jenkins, R.B.; Kleinschmidt-DeMasters, B.; Komori, T.; et al. cIMPACT-NOW update 5: Recommended grading criteria and terminologies for IDH-mutant astrocytomas. Acta Neuropathol. 2020, 139, 603–608. [Google Scholar] [CrossRef] [PubMed]
  6. Rajakaruna, P.; Rios, S.; Elnahas, H.; Villanueva, A.; Uribe, D.; Leslie, S.; Abbas, W.A.; Barroso, L.; Oyervides, S.; Persans, M.; et al. Molecular Biomarkers of Glioma. Biomedicines 2025, 13, 1298. [Google Scholar] [CrossRef]
  7. Eckel-Passow, J.E.; Lachance, D.H.; Molinaro, A.M.; Walsh, K.M.; Decker, P.A.; Sicotte, H.; Pekmezci, M.; Rice, T.; Kosel, M.L.; Smirnov, I.V.; et al. Glioma Groups Based on 1p/19q, IDH, and TERT Promoter Mutations in Tumors. N. Engl. J. Med. 2015, 372, 2499–2508. [Google Scholar] [CrossRef]
  8. Park, S.S.; Roh, T.H.; Tanaka, Y.; Kim, Y.H.; Park, S.H.; Kim, T.G.; Eom, S.Y.; Park, T.J.; Park, I.H.; Kim, S.H.; et al. High p16INK4A expression in glioblastoma is associated with senescence phenotype and better prognosis. Neoplasia 2025, 60, 101116. [Google Scholar] [CrossRef]
  9. Appay, R.; Dehais, C.; Maurage, C.A.; Alentorn, A.; Carpentier, C.; Colin, C.; Ducray, F.; Escande, F.; Idbaih, A.; Kamoun, A.; et al. CDKN2A homozygous deletion is a strong adverse prognosis factor in diffuse malignant IDH-mutant gliomas. Neuro Oncol. 2019, 21, 1519–1528. [Google Scholar] [CrossRef]
  10. Steponaitis, G.; Tamasauskas, A. Mesenchymal and Proneural Subtypes of Glioblastoma Disclose Branching Based on GSC Associated Signature. Int. J. Mol. Sci. 2021, 22, 4964. [Google Scholar] [CrossRef]
  11. Torp, S.H.; Solheim, O.; Skjulsvik, A.J. The WHO 2021 Classification of Central Nervous System tumours: A practical update on what neurosurgeons need to know—A minireview. Acta Neurochir. 2022, 164, 2453–2464. [Google Scholar] [CrossRef]
  12. Mohammed, S.; Dinesan, M.; Ajayakumar, T. Survival and quality of life analysis in glioblastoma multiforme with adjuvant chemoradiotherapy: A retrospective study. Rep. Pract. Oncol. Radiother. 2022, 27, 1026–1036. [Google Scholar] [CrossRef]
  13. Stupp, R.; Weber, D.C. The role of radio- and chemotherapy in glioblastoma. Onkologie 2005, 28, 315–317. [Google Scholar] [CrossRef]
  14. Silber, J.R.; Bobola, M.S.; Blank, A.; Chamberlain, M.C. O(6)-methylguanine-DNA methyltransferase in glioma therapy: Promise and problems. Biochim. Biophys. Acta 2012, 1826, 71–82. [Google Scholar] [CrossRef] [PubMed]
  15. Aparicio-Blanco, J.; Sanz-Arriazu, L.; Lorenzoni, R.; Blanco-Prieto, M.J. Glioblastoma chemotherapeutic agents used in the clinical setting and in clinical trials: Nanomedicine approaches to improve their efficacy. Int. J. Pharm. 2020, 581, 119283. [Google Scholar] [CrossRef] [PubMed]
  16. Wu, W.; Klockow, J.L.; Zhang, M.; Lafortune, F.; Chang, E.; Jin, L.; Wu, Y.; Daldrup-Link, H.E. Glioblastoma multiforme (GBM): An overview of current therapies and mechanisms of resistance. Pharmacol. Res. 2021, 171, 105780. [Google Scholar] [CrossRef] [PubMed]
  17. Pouyan, A.; Ghorbanlo, M.; Eslami, M.; Jahanshahi, M.; Ziaei, E.; Salami, A.; Mokhtari, K.; Shahpasand, K.; Farahani, N.; Meybodi, T.E.; et al. Glioblastoma multiforme: Insights into pathogenesis, key signaling pathways, and therapeutic strategies. Mol. Cancer 2025, 24, 58. [Google Scholar] [CrossRef]
  18. Omar, A.I.; Mason, W.P. Temozolomide: The evidence for its therapeutic efficacy in malignant astrocytomas. Core Evid. 2010, 4, 93–111. [Google Scholar]
  19. Tang, J.; Karbhari, N.; Campian, J.L. Therapeutic Targets in Glioblastoma: Molecular Pathways, Emerging Strategies, and Future Directions. Cells 2025, 14, 494. [Google Scholar] [CrossRef]
  20. Taylor, O.G.; Brzozowski, J.S.; Skelding, K.A. Glioblastoma Multiforme: An Overview of Emerging Therapeutic Targets. Front. Oncol. 2019, 9, 963. [Google Scholar] [CrossRef]
  21. Singh, S.; Dey, D.; Barik, D.; Mohapatra, I.; Kim, S.; Sharma, M.; Prasad, S.; Wang, P.; Singh, A.; Singh, G. Glioblastoma at the crossroads: Current understanding and future therapeutic horizons. Signal Transduct. Target. Ther. 2025, 10, 213. [Google Scholar] [CrossRef]
  22. Aliabadi, F.; Sohrabi, B.; Mostafavi, E.; Pazoki-Toroudi, H.; Webster, T.J. Ubiquitin-proteasome system and the role of its inhibitors in cancer therapy. Open Biol. 2021, 11, 200390. [Google Scholar] [CrossRef] [PubMed]
  23. Delle Donne, R.; Iannucci, R.; Rinaldi, L.; Roberto, L.; Oliva, M.A.; Senatore, E.; Borzacchiello, D.; Lignitto, L.; Giurato, G.; Rizzo, F.; et al. Targeted inhibition of ubiquitin signaling reverses metabolic reprogramming and suppresses glioblastoma growth. Commun. Biol. 2022, 5, 780. [Google Scholar] [CrossRef] [PubMed]
  24. Liu, Q.Y.; Lei, J.X.; Sikorska, M.; Liu, R. A novel brain-enriched E3 ubiquitin ligase RNF182 is up regulated in the brains of Alzheimer’s patients and targets ATP6V0C for degradation. Mol. Neurodegener. 2008, 3, 4. [Google Scholar] [CrossRef] [PubMed]
  25. Cao, Y.; Sun, Y.; Chang, H.; Sun, X.; Yang, S. The E3 ubiquitin ligase RNF182 inhibits TLR-triggered cytokine production through promoting p65 ubiquitination and degradation. FEBS Lett. 2019, 593, 3210–3219. [Google Scholar] [CrossRef]
  26. Dewangan, S.P.; Narayanan, G.S.; Br, K.K. Analysis of Overall Survival in High-Grade Glioma Patients Treated with Surgery and Adjuvant Therapy. Cureus 2025, 17, e88792. [Google Scholar] [CrossRef]
  27. Gimple, R.C.; Bhargava, S.; Dixit, D.; Rich, J.N. Glioblastoma stem cells: Lessons from the tumor hierarchy in a lethal cancer. Genes Dev. 2019, 33, 591–609. [Google Scholar] [CrossRef]
  28. Brennan, C.W.; Verhaak, R.G.; McKenna, A.; Campos, B.; Noushmehr, H.; Salama, S.R.; Zheng, S.; Chakravarty, D.; Sanborn, J.Z.; Berman, S.H.; et al. TCGA Research Network. The somatic genomic landscape of glioblastoma. Cell 2013, 155, 462–477. [Google Scholar] [CrossRef]
  29. Yalamarty, S.S.K.; Filipczak, N.; Li, X.; Subhan, M.A.; Parveen, F.; Ataide, J.A.; Rajmalani, B.A.; Torchilin, V.P. Mechanisms of Resistance and Current Treatment Options for Glioblastoma Multiforme (GBM). Cancers 2023, 15, 2116. [Google Scholar] [CrossRef]
  30. Van Meir, E.G.; Hadjipanayis, C.G.; Norden, A.D.; Shu, H.K.; Wen, P.Y.; Olson, J.J. Exciting new advances in neuro-oncology: The avenue to a cure for malignant glioma. CA Cancer J. Clin. 2010, 60, 166–193. [Google Scholar] [CrossRef]
  31. Obrador, E.; Moreno-Murciano, P.; Oriol-Caballo, M.; López-Blanch, R.; Pineda, B.; Gutiérrez-Arroyo, J.L.; Loras, A.; Gonzalez-Bonet, L.G.; Martinez-Cadenas, C.; Estrela, J.M.; et al. Glioblastoma Therapy: Past, Present and Future. Int. J. Mol. Sci. 2024, 25, 2529. [Google Scholar] [CrossRef]
  32. Kane, J.R.; Miska, J.; Young, J.S.; Kanojia, D.; Kim, J.W.; Lesniak, M.S. Sui generis: Gene therapy and delivery systems for the treatment of glioblastoma. Neuro Oncol. 2015, 17, ii24–ii36. [Google Scholar] [CrossRef] [PubMed]
  33. Wong, M.L.; Kaye, A.H.; Hovens, C.M. Targeting malignant glioma survival signalling to improve clinical outcomes. J. Clin. Neurosci. 2007, 14, 301–308. [Google Scholar] [CrossRef] [PubMed]
  34. Śledzińska, P.; Bebyn, M.G.; Furtak, J.; Kowalewski, J.; Lewandowska, M.A. Prognostic and Predictive Biomarkers in Gliomas. Int. J. Mol. Sci. 2021, 22, 10373. [Google Scholar] [CrossRef] [PubMed]
  35. Zhang, X.; Linder, S.; Bazzaro, M. Drug Development Targeting the Ubiquitin–Proteasome System (UPS) for the Treatment of Human Cancers. Cancers 2020, 12, 902. [Google Scholar] [CrossRef]
  36. Wang, H.; Tan, Y.; Liu, Q.; Yang, S.; Cui, L. Ubiquitin-proteasome system: A potential participant and therapeutic target in antiphospholipid syndrome. Front. Immunol. 2025, 16, 1523799. [Google Scholar] [CrossRef]
  37. Fhu, C.W.; Ali, A. Dysregulation of the Ubiquitin Proteasome System in Human Malignancies: A Window for Therapeutic Intervention. Cancers 2021, 13, 1513. [Google Scholar] [CrossRef]
  38. Michaelides, I.N.; Collie, G.W. E3 Ligases Meet Their Match: Fragment-Based Approaches to Discover New E3 Ligands and to Unravel E3 Biology. J. Med. Chem. 2023, 66, 3173–3194. [Google Scholar] [CrossRef]
  39. Rodríguez-Gimeno, A.; Galdeano, C. Drug Discovery Approaches to Target E3 Ligases. ChemBioChem 2025, 26, e202400656. [Google Scholar] [CrossRef]
  40. Qi, J.; Ronai, Z.A. Dysregulation of ubiquitin ligases in cancer. Drug Resist. Updates 2015, 23, 1–11. [Google Scholar] [CrossRef]
  41. Koo, S.Y.; Park, E.J.; Noh, H.J.; Jo, S.M.; Ko, B.K.; Shin, H.J.; Lee, C.W. Ubiquitination Links DNA Damage and Repair Signaling to Cancer Metabolism. Int. J. Mol. Sci. 2023, 24, 8441. [Google Scholar] [CrossRef]
  42. Presta, I.; Novellino, F.; Donato, A.; La Torre, D.; Palleria, C.; Russo, E.; Malara, N.; Donato, G. UbcH10 a Major Actor in Cancerogenesis and a Potential Tool for Diagnosis and Therapy. Int. J. Mol. Sci. 2020, 21, 2041. [Google Scholar] [CrossRef]
  43. Li, J.; Feng, H.; Liu, K.; Huang, H.; Ji, X.; Zhang, T.; Cheng, X.; Zhao, R. UBE2S inhibits colorectal cancer proliferation by regulating the PI3K/AKT and MAPK/ERK pathways via TRAF6. Sci. Rep. 2025, 15, 35610. [Google Scholar] [CrossRef]
  44. Zhang, M.; Wang, J.; Zhang, Z.; Guo, Y.; Lou, X.; Zhang, L. Diverse roles of UBE2S in cancer and therapy resistance: Biological functions and mechanisms. Heliyon 2024, 10, e24465. [Google Scholar] [CrossRef]
  45. Scholz, N.; Kurian, K.M.; Siebzehnrubl, F.A.; Licchesi, J.D.F. Targeting the Ubiquitin System in Glioblastoma. Front. Oncol. 2020, 10, 574011. [Google Scholar] [CrossRef]
  46. Kim, H.; Frederick, D.T.; Levesque, M.P.; Cooper, Z.A.; Feng, Y.; Krepler, C.; Brill, L.; Samuels, Y.; Hayward, N.K.; Perlina, A.; et al. Downregulation of the Ubiquitin Ligase RNF125 Underlies Resistance of Melanoma Cells to BRAF Inhibitors via JAK1 Deregulation. Cell Rep. 2015, 11, 1458–1473. [Google Scholar] [CrossRef]
  47. Garg, P.; Malhotra, J.; Kulkarni, P.; Horne, D.; Salgia, R.; Singhal, S.S. Emerging Therapeutic Strategies to Overcome Drug Resistance in Cancer Cells. Cancers 2024, 16, 2478. [Google Scholar] [CrossRef]
  48. Zeng, X.; Tang, X.; Chen, X.; Wen, H. RNF182 induces p65 ubiquitination to affect PDL1 transcription and suppress immune evasion in lung adenocarcinoma. Immun. Inflamm. Dis. 2023, 11, e864. [Google Scholar] [CrossRef] [PubMed]
Figure 1. Location of RNF183 family members on chromosomes. RNF182 is represented on chromosome 6, RNF152 on chromosome 18, RNF183 on chromosome 9, and RNF186 on chromosome 1.
Cancers 18 01217 g001
Figure 2. The graph displays a density curve representing the distribution of log2-transformed expression values of RNF182 and ACTB (housekeeping gene). The x-axis represents expression values, while the y-axis indicates the frequency of these values.
Cancers 18 01217 g002
Figure 3. The image contains boxplots illustrating RNF182 expression under different conditions. The x-axis represents clinical variables, while the y-axis represents RNF182 expression levels. (A) The boxplot displays RNF182 expression across various clinical subtypes, showing that the Proneural subtype exhibits a statistically significant increase in RNF182 expression compared to other subtypes. (B) The IDH1 status boxplot indicates that samples with mutated IDH1 exhibit significantly higher RNF182 expression than those with wild-type IDH1. (C) The CIMP status boxplot shows that the G-CIMP phenotype is associated with a statistically significant increase in RNF182 expression compared to non-G-CIMP samples. (D) The MGMT promoter methylation status boxplot reveals that RNF182 expression is not significantly affected by MGMT promoter methylation status.
Cancers 18 01217 g003
Figure 4. (A) Representative images of tissue sections biopsies from human grade II glioma and grade IV GBM immunostained with anti-RNF182 antibody (brown) and then analyzed by optical microscope. Images are acquired at 100× magnification; scale bar = 50 μm. (B) Graph represents the density (%) of RNF182-positive cells for 10 fields in low-grade (n = 18 samples) and high-grade gliomas (n = 18 samples) as described above; statistical significance considering p value: **** < 0.0001; Unpaired t-test.
Cancers 18 01217 g004
Figure 5. (A) Representative Western blot of RNF182 antibody on human glioma grade II and grade IV GBM. (B) Densitometric analysis (fold change) of RNF182 protein in human glioma grade II and grade IV GBM samples. GAPDH is used as loading control. Data are presented as fold chance of four independent experiments. Statistical significance: p value: * < 0.05. Unpaired t-test. (C) RT-qPCR of rnf182 gene in low- and high-grade glioma samples. β-actin is used as control gene. The experiments are performed in triplicate for two individual experiments. The original Western blot figures can be found in File S1.
Cancers 18 01217 g005
Figure 6. (A) Western blot analysis of RNF182 protein in U87MG transfected cells with 100 nM RNF182 siRNA. Densitometric analysis (fold change) of RNF182 protein in U87MG cells transfected with 100 nM RNF182 siRNA. GAPDH is used as loading control; statistical significance ** p value < 0.005. Unpaired t test. (B) Representative images and plotted growth curves of U87MG transfected cells with 100 nM of RNF182 siRNA or scrambled siRNA (CT). All experiments are conducted in triplicate (n = 3 biological replicates). The images are acquired by EVOS FL Microscope at 10× magnification: scale bar 400 μm. Statistical analysis of plotted curve is performed using 2-way ANOVA, multiple comparison **** p value < 0.0001. The original Western blot figures can be found in File S2.
Cancers 18 01217 g006
Table 1. Characteristics of grade II gliomas and grade IV GBM samples derived from Neuromed patients, according to the 2016 WHO classification.
CASEGENDERAGEDIAGNOSISIDH1LOHMGMT
1M47GLIOMA II° WHO (Diffuse astrocytoma II)MUT19qMET
2M20GLIOMA II° WHO (Diffuse astrocytoma II)MUTNormalMET
3F47GLIOMA II° WHO (Anaplastic Oligodendroglioma III)MUT1p-19qMET
4F63GLIOMA II° WHO (Astrocytoma II)MUT1p-19qMET
5M35GLIOMA II° WHO (Diffuse astrocytoma II)MUTNormalMET
6F49GLIOMA II° WHO (Astrocytoma II)MUTNormalMET
7M67GLIOMA II° WHO (Diffuse astrocytoma II)MUTNormalMET
8M69GLIOMA II° WHO (Oligodendroglioma II)MUT1p-19qMET
9F43GLIOMA II° WHO (Diffuse astrocytoma II)MUTNormalMET
10F31GLIOMA II° WHO (Oligoastrocytoma II)MUT1p-19qMET
11M29GLIOMA II° WHO (Oligoastrocytoma II)WT10qUNMET
12M19GLIOMA II° WHO (Diffuse astrocytoma II)MUTNormalMET
13M67GLIOMA II° WHO (Oligodendroglioma II)MUT1p-19qMET
14F57GLIOMA II° WHO (Oligodendroglioma II)MUT1p-19qMET
15M30GLIOMA II° WHO (Diffuse astrocytoma II)MUT10qMET
16F41GLIOMA II° WHO (Oligodendroglioma II)MUT1p-19qMET
17M44GLIOMA II° WHO (Diffuse glial tumor II)MUT1p-19qMET
18M43GLIOMA II° WHO (Oligoastrocytoma II)MUT1p-19qMET
19F54GBMWT-UNMET
20M56GBMWT-MET
21M62GBMWT-UNMET
22M67GBMMUT-MET
23F35GBMWT-MET
24M73GBMMUT-UNMET
25M46GBMMUT-MET
26F51GBMWT-UNMET
27F67GBMMUT-UNMET
28M47GBMWT-MET
29M81GBMWT-UNMET
30F80GBMWT-MET
31M52GBMWT-UNMET
32F77GBMWT-UNMET
33F55GBMWT-UNMET
34M70GBMWT-UNMET
35M66GBMWT-UNMET
36M70GBMWT-UNMET
Disclaimer/Publisher’s Note: The statements, opinions and data contained in all publications are solely those of the individual author(s) and contributor(s) and not of MDPI and/or the editor(s). MDPI and/or the editor(s) disclaim responsibility for any injury to people or property resulting from any ideas, methods, instructions or products referred to in the content.