Article

DNA Methylation of Pharmacologic and Leukemia-Related Genes Predicts Clinical Outcomes in Pediatric Acute Myeloid Leukemia


1
Department of Pharmacotherapy and Translational Research, College of Pharmacy, University of Florida, Gainesville, FL 32610, USA
2
University of Hail, Hail 81451, Saudi Arabia
3
Department of Health Promotion/Disease Prevention, University of Tennessee Health Science Center, Memphis, TN 38163, USA
4
Ascentage Pharma Group, Rockville, MD 20850, USA
5
Department of Oncology, St. Jude Children’s Research Hospital, Memphis, TN 38105, USA
6
Division of Hematology/Oncology, Fred Hutchinson Cancer Research Center, Seattle, WA 98109, USA
7
Department of Biostatistics, St. Jude Children’s Research Hospital, Memphis, TN 38105, USA
8
UF Health Cancer Center, University of Florida, Gainesville, FL 32610, USA
*
Author to whom correspondence should be addressed.
Cancers 2026, 18(15), 2467; https://doi.org/10.3390/cancers18152467
Submission received: 23 June 2026 / Revised: 19 July 2026 / Accepted: 27 July 2026 / Published: 31 July 2026
(This article belongs to the Section Cancer Biomarkers)

Simple Summary

Acute myeloid leukemia is an aggressive hematological cancer with highly uncontrolled blast cell clonal expansion and proliferation. The poor prognosis of AML is an major ongoing concern; thus, studying the possible mechanisms that lead to AML progression or chemotherapy resistance may define new biomarkers and therapeutic targets that will improve diagnosis and predictions. The primary objective of this study was to evaluate the impact of the methylation levels of specific genes and their association with treatment outcomes among pediatric AML patients. Here, we demonstrated that interpatient differences in DNA methylation levels of key genes related to AML drugs or disease pathogenesis affect clinical outcomes. This creates opportunities for outcome prediction and the strategic use of hypomethylating agents to enhance patient clinical outcomes.

Abstract

Background: Aberrant DNA methylation is a hallmark of acute myeloid leukemia (AML) and contributes to leukemogenesis, treatment response, and clinical heterogeneity. While genome-wide methylation studies have identified prognostic methylation signatures, the impact of DNA methylation within pharmacologic pathways and AML-relevant disease genes remains incompletely understood. We investigated the association of DNA methylation in genes of pharmacokinetic/pharmacodynamic (PK/PD) pathways of drugs used to treat AML and in myeloid leukemia-related genes with treatment outcomes in pediatric AML. Methods: DNA methylation profiles from 924 pediatric AML patients treated on Children’s Oncology Group trials (AAML1031, AAML0531, and AAML03P1—available publicly) were analyzed as a discovery cohort. A validation cohort included 159 patients treated on the AML02 trial. A total of 2296 variable CpG sites mapping to 65 PK/PD genes and 107 AML biology/leukemia stemness genes were evaluated. Associations between CpG methylation, gene expression, event-free survival (EFS), overall survival (OS), and measurable residual disease after induction I (MRD1) were assessed using Cox proportional hazards, logistic regression, and correlation analyses. Results: Twenty-three CpG sites in PK/PD genes and forty-two CpG sites in AML-related genes were significantly associated with at least one clinical endpoint after Bonferroni correction (p < 2.17 × 10⁻⁵). Hypermethylation of drug transporters ABCA3, ABCC1, and SLC22A1, as well as pharmacologically relevant genes MPO, NOS3, and CTPS1, was associated with inferior survival and/or increased MRD1 positivity. Among AML biology genes, methylation of ETV6, NOTCH1, RUNX1, KIT, MPL, DNMT3A, and DNMT3B demonstrated consistent associations with outcomes across discovery and validation cohorts. Several genes exhibited significant inverse correlations between DNA methylation and gene expression, including MPO, KIT, MPL, SPINK2, and DNMT3B, supporting functional epigenetic regulation. Notably, hypermethylation of ABCA3, MPO, and MPL was reproducibly associated with poor OS and EFS in both cohorts. Conclusions: DNA methylation of key pharmacologic and leukemia-related genes is associated with clinical outcomes in pediatric AML. These findings identify biologically and clinically relevant epigenetic biomarkers that may improve risk stratification and support the development of precision medicine approaches incorporating DNA methylation profiling and epigenetic therapies in pediatric AML.

1. Introduction

Acute myeloid leukemia (AML) is characterized by highly proliferative nonfunctional cells. AML represents 15–20% of leukemia cases in the US and is the primary cause of leukemia-related deaths in children [1,2]. The five-year overall survival (OS) rate is around 70%, and the 5-year event-free survival (EFS) rate is around 65% for pediatric AML. Despite an initial response, a significant proportion of patients experience relapse or resistant disease [3,4,5]. Since the 1970s, the “7 + 3 chemotherapy regimen” (7 days of cytarabine and 3 days of daunorubicin) has been used for treating AML patients, with cytarabine, daunorubicin and etoposide being the commonly used induction regimen in children [6]. However, 20% of pediatric AML patients experience relapse after standard induction chemotherapy [7]. Treatment failure, because of refractory or relapsed disease, remains the major cause of death in AML patients. In-depth understanding of the molecular mechanism underlying disease pathology and drug resistance is thus needed. Multiple studies have shown the importance of aberrant DNA methylation in the onset of leukemia [8,9,10]. Previous reports have shown that 29.7% of adult patients with AML have DNA methylation-regulated gene mutations, which are further associated with inferior clinical outcomes. Our previous work in pediatric AML showed that distinctive DNA methylation signatures are associated with specific cytogenetic features. An integrated analysis of DNA methylation and gene expression revealed DNMT3B methylation and expression as well as global DNA methylation burden to be of clinical and prognostic relevance in pediatric AML [11].
Despite the fact that multiple studies have investigated DNA methylation profiles in AML, a systematic investigation of how methylation patterns of genes involved in pharmacokinetic and pharmacodynamic pathways of standard chemotherapeutic agents such as cytarabine, daunorubicin, and etoposide contribute to clinical outcome and drug resistance is lacking. Furthermore, in-depth investigation of methylation patterns of genes of pathological relevance in myeloid leukemia and their impact on clinical outcome is needed. Thus, this study evaluated associations between methylation of PK/PD genes and a panel of genes relevant to AML pathology with clinical outcomes in pediatric AML patients.

2. Methods

Patient Samples: The discovery cohort included 924 pediatric AML patients treated on Children’s Oncology Group clinical trials AAML1031, AML0531 and AML03P1 where the DNA methylation and clinical outcome data are available in a public database (see below). The median age at diagnosis for the patients was 9.7 years (interquartile range (IQR) 3.1–14.8 years). The studies were approved by the National Cancer Institute’s central institutional review board (IRB) and the IRB at each participating centre. Written informed consent was obtained from participants or their caregivers. The validation cohort consisted of 159 patients treated on the AML02 trial (NCT00136084) with DNA methylation and clinical outcome data available as per previous reports [11,12,13]. Median age at diagnosis was 9.3 years (IQR: 2.2, 14.0). Details of the clinical trials are described elsewhere [7,14,15,16].
The clinical outcomes endpoints were EFS, defined from the period from study entry until the first occurrence of death, refractory disease, or any type of relapse with event-free patients censored on the date of last follow-up; OS, defined as the period from study entry to the time of death with living patients censored on the date of last follow-up; and minimal residual disease after induction 1 (MRD1), with positivity defined as 1 or more leukemic cells per 1000 mononuclear bone marrow cells (≥0.1%) determined using flow cytometry.
Target Gene List: Geneset-1 (PK/PD Pathway Genes): We selected 65 genes based on their relevance to the pharmacological pathways of cytarabine, daunorubicin, and etoposide. The PharmGKB database and literature reports were used to extract the genes of relevance [17,18].
Geneset-2 (Myeloid and Leukemia Stemness Genes): We selected 107 genes that are implicated in AML pathogenesis and genes associated with leukemia stem cells (LSCs) from a previously reported study [19,20]. Details are provided in the Supplementary Methods and the gene list is provided in Supplementary Table S1.
DNA Methylation Data: The DNA methylation raw data were obtained from publicly available datasets from Gene Expression Omnibus (GEO) (AAML1031-GSE190931, AAML0531-GSE124413) processed by Illumina Human Methylation EPIC array, and Genomic Data Commons (AAML03P1-GDC-TARGET AML) processed by Illumina Human Methylation 450K array. The EPIC and 450K arrays share 452,453 probes with the same chemistry and design. Details regarding DNA isolation, bisulfite conversion, and hybridization of bisulfite-converted DNA have been reported in GEO and GDC for the discovery cohort [21,22,23], and the validation cohort AML02 has been previously published [12]. The methylation array 450k/EPIC array data were pre-processed using the R package SeSAMe as described in the Supplementary Methods. Methylation levels of CpGs mapping to both gene sets represented on both arrays were extracted. CpG sites were filtered for variability across the cohort. Only those with a standard deviation greater than 0.01 were included in the analysis, resulting in a total of 2296 CpGs.
Gene Expression Data: For the discovery cohort COGs, the expression levels of the pre-selected genes were extracted from RNA-seq data, performed on bone marrow samples obtained at diagnosis, using the Illumina HiSeq2000 platform from the Therapeutically Applicable Research to Generate Effective Treatments (TARGET) database. To integrate the RNA-seq data from three datasets and adjust for related batch effects, we used ComBat in R software. All RNA-seq values were log2-normalized (log2(RPKM +1)) for all subsequent analyses. Of the 924 patients from the discovery cohort, 745 samples had available clinical data and gene expression data. For the validation cohort AML02, the mRNA expression levels in diagnostic leukemic blasts from patient samples were obtained using Affymetrix U133A microarray data as previously described [24]. Gene expression values were transformed using the natural logarithm before data analysis. One hundred and thirty-six patients in the validation cohort had DNA methylation and gene expression data available for further downstream analysis.
Statistical Analysis: R software version 4.2.3 was used to conduct the statistical analysis. Pearson’s Chi-squared test and Welch’s two-sample t-test were utilized to summarize baseline patient characteristics for both discovery and validation cohorts. The Kruskal–Wallis test was performed to test the difference in DNA methylation level of CpGs among risk groups and race groups. For DNA methylation analysis, M values were evaluated for association with OS and EFS using the Survival package [25]. Cox regression models were used to calculate hazard ratios (HRs) and 95% confidence intervals (CIs) for the association of DNA methylation levels (M-values) with OS and EFS. The risk-adjusted Cox model is as follows:
h i t = h 0 t × exp   { β 1 M i + β 2 R i , Standard + β 3 R i , High }
where h i t   represents the hazard for patient i at time t and h 0 t represents the baseline hazard. M i   denotes the methylation level. R i , Standard   and R i , High   are indicator variables for the standard- and high-risk groups, with the low-risk group as a reference category. exp β 1 represents the ratio associated with the methylation level after adjustment for clinical risk group. Bonferroni correction was applied to adjust for multiple testing with the alpha level set to α = 2.17 × 10⁻⁵. Survival curves were plotted using the Kaplan–Meier method and compared using the log-rank test, stratified by the median of M values. Logistic regression was applied to assess the association between CpG methylation M value and MRD1 status (positive or negative). The ggplot2 package was used to create MRD1 bar plots for the significant CpG sites based on the median of M values [26]. The CpGs associated with clinical outcomes were further evaluated for association with respective gene expression. Spearman correlation analysis was used to evaluate the relationship between gene expression and DNA methylation (5mC).

3. Results

The baseline characteristics of the patients in the study cohort are summarized in Table 1.
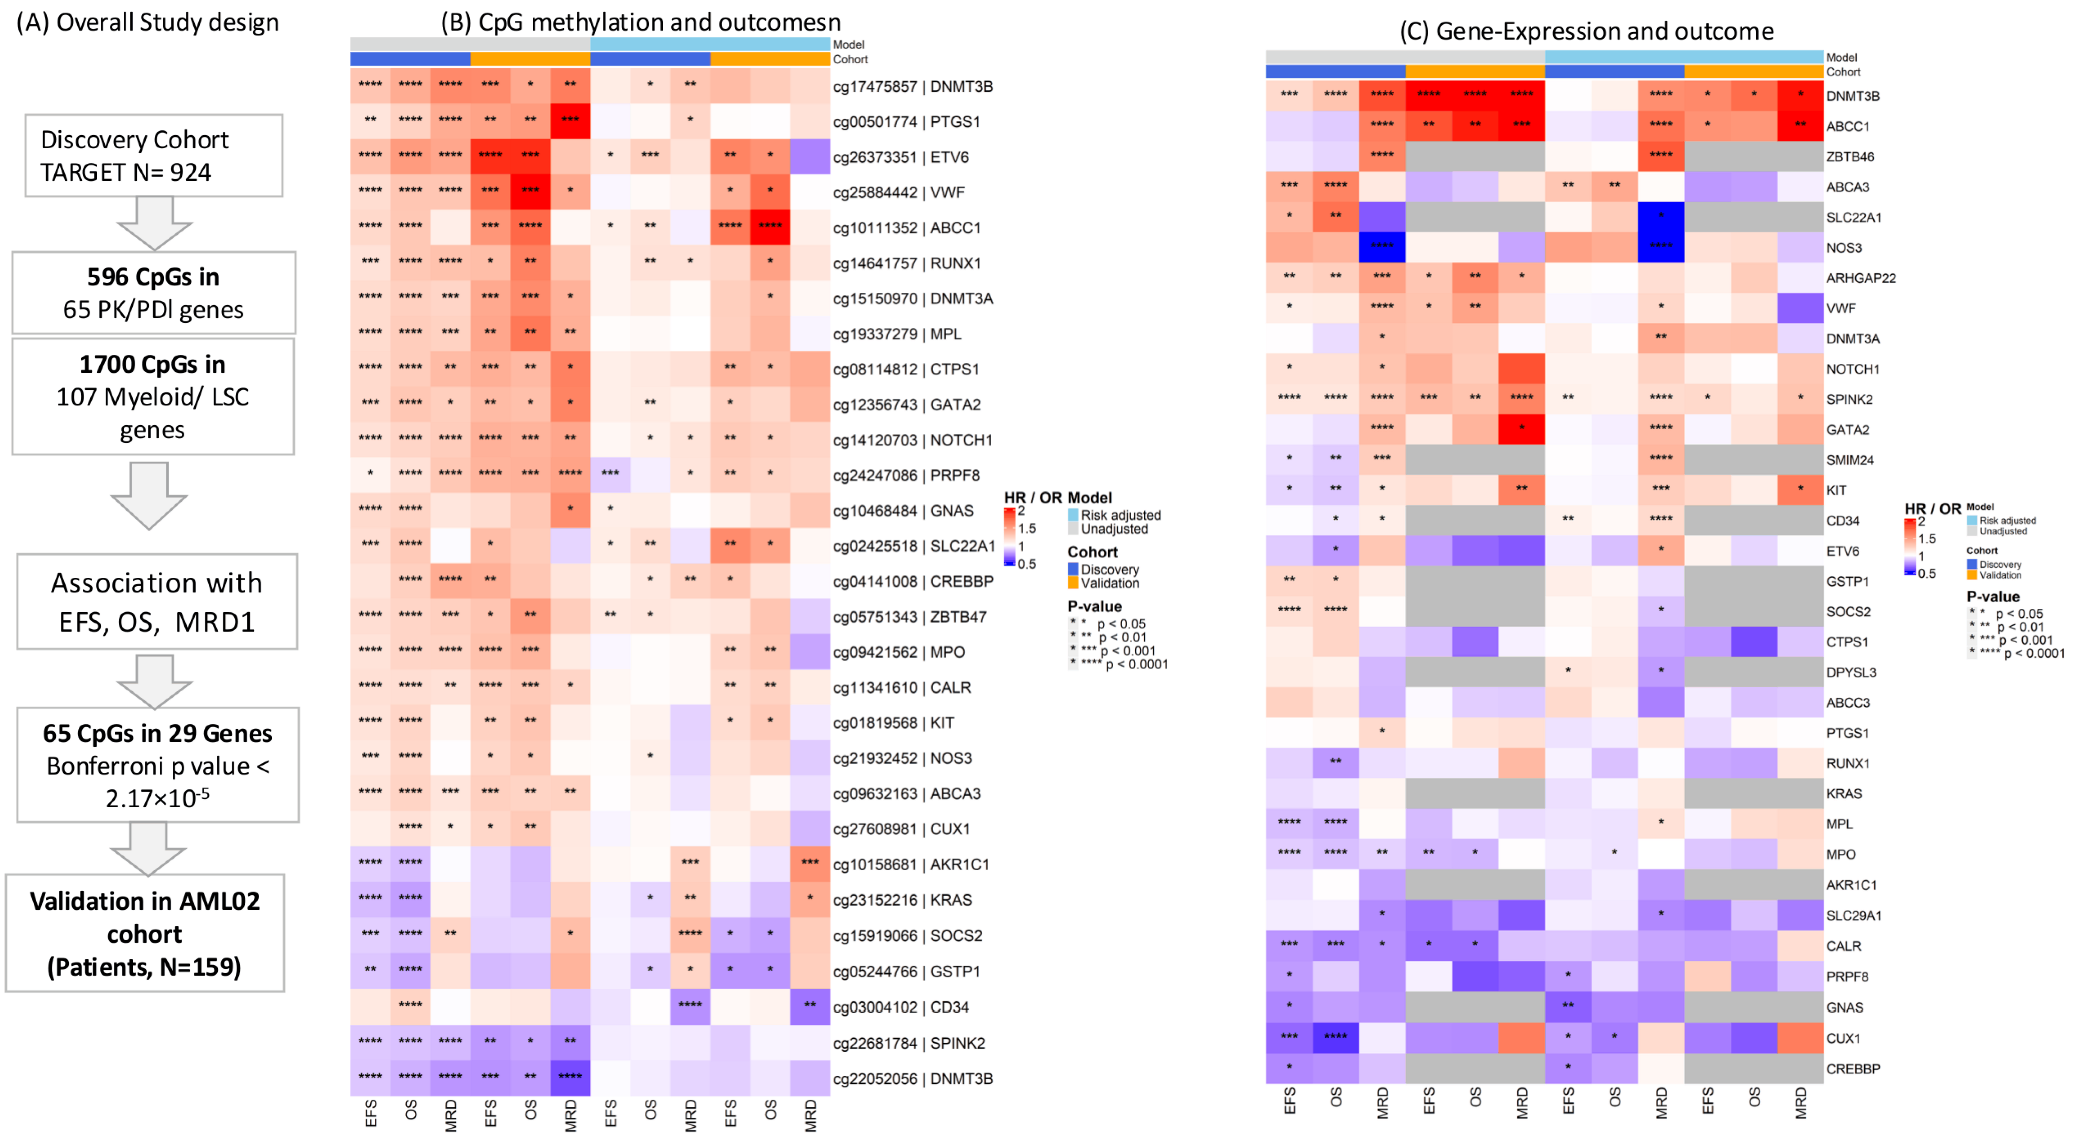
Association of DNA Methylation of PK/PD with Clinical Outcome: Twenty three of the 596 CpGs tested in drug pathway genes and 42 of the 1700 CpGs mapping to genes associated with AML disease biology showed significant association with at least one clinical endpoint at the Bonferroni-corrected p-value threshold of <2.17 × 10⁻⁵ (summarized in Supplementary Table S2). Figure 1 shows a heatmap of the most significant CpG selected for each of these genes for association with clinical outcome in the discovery and validation cohorts (both unadjusted and risk-adjusted; detailed results are provided in Table 2). Additionally, association of respective mRNA expression levels of genes with available data with outcomes is also shown in Figure 1C.
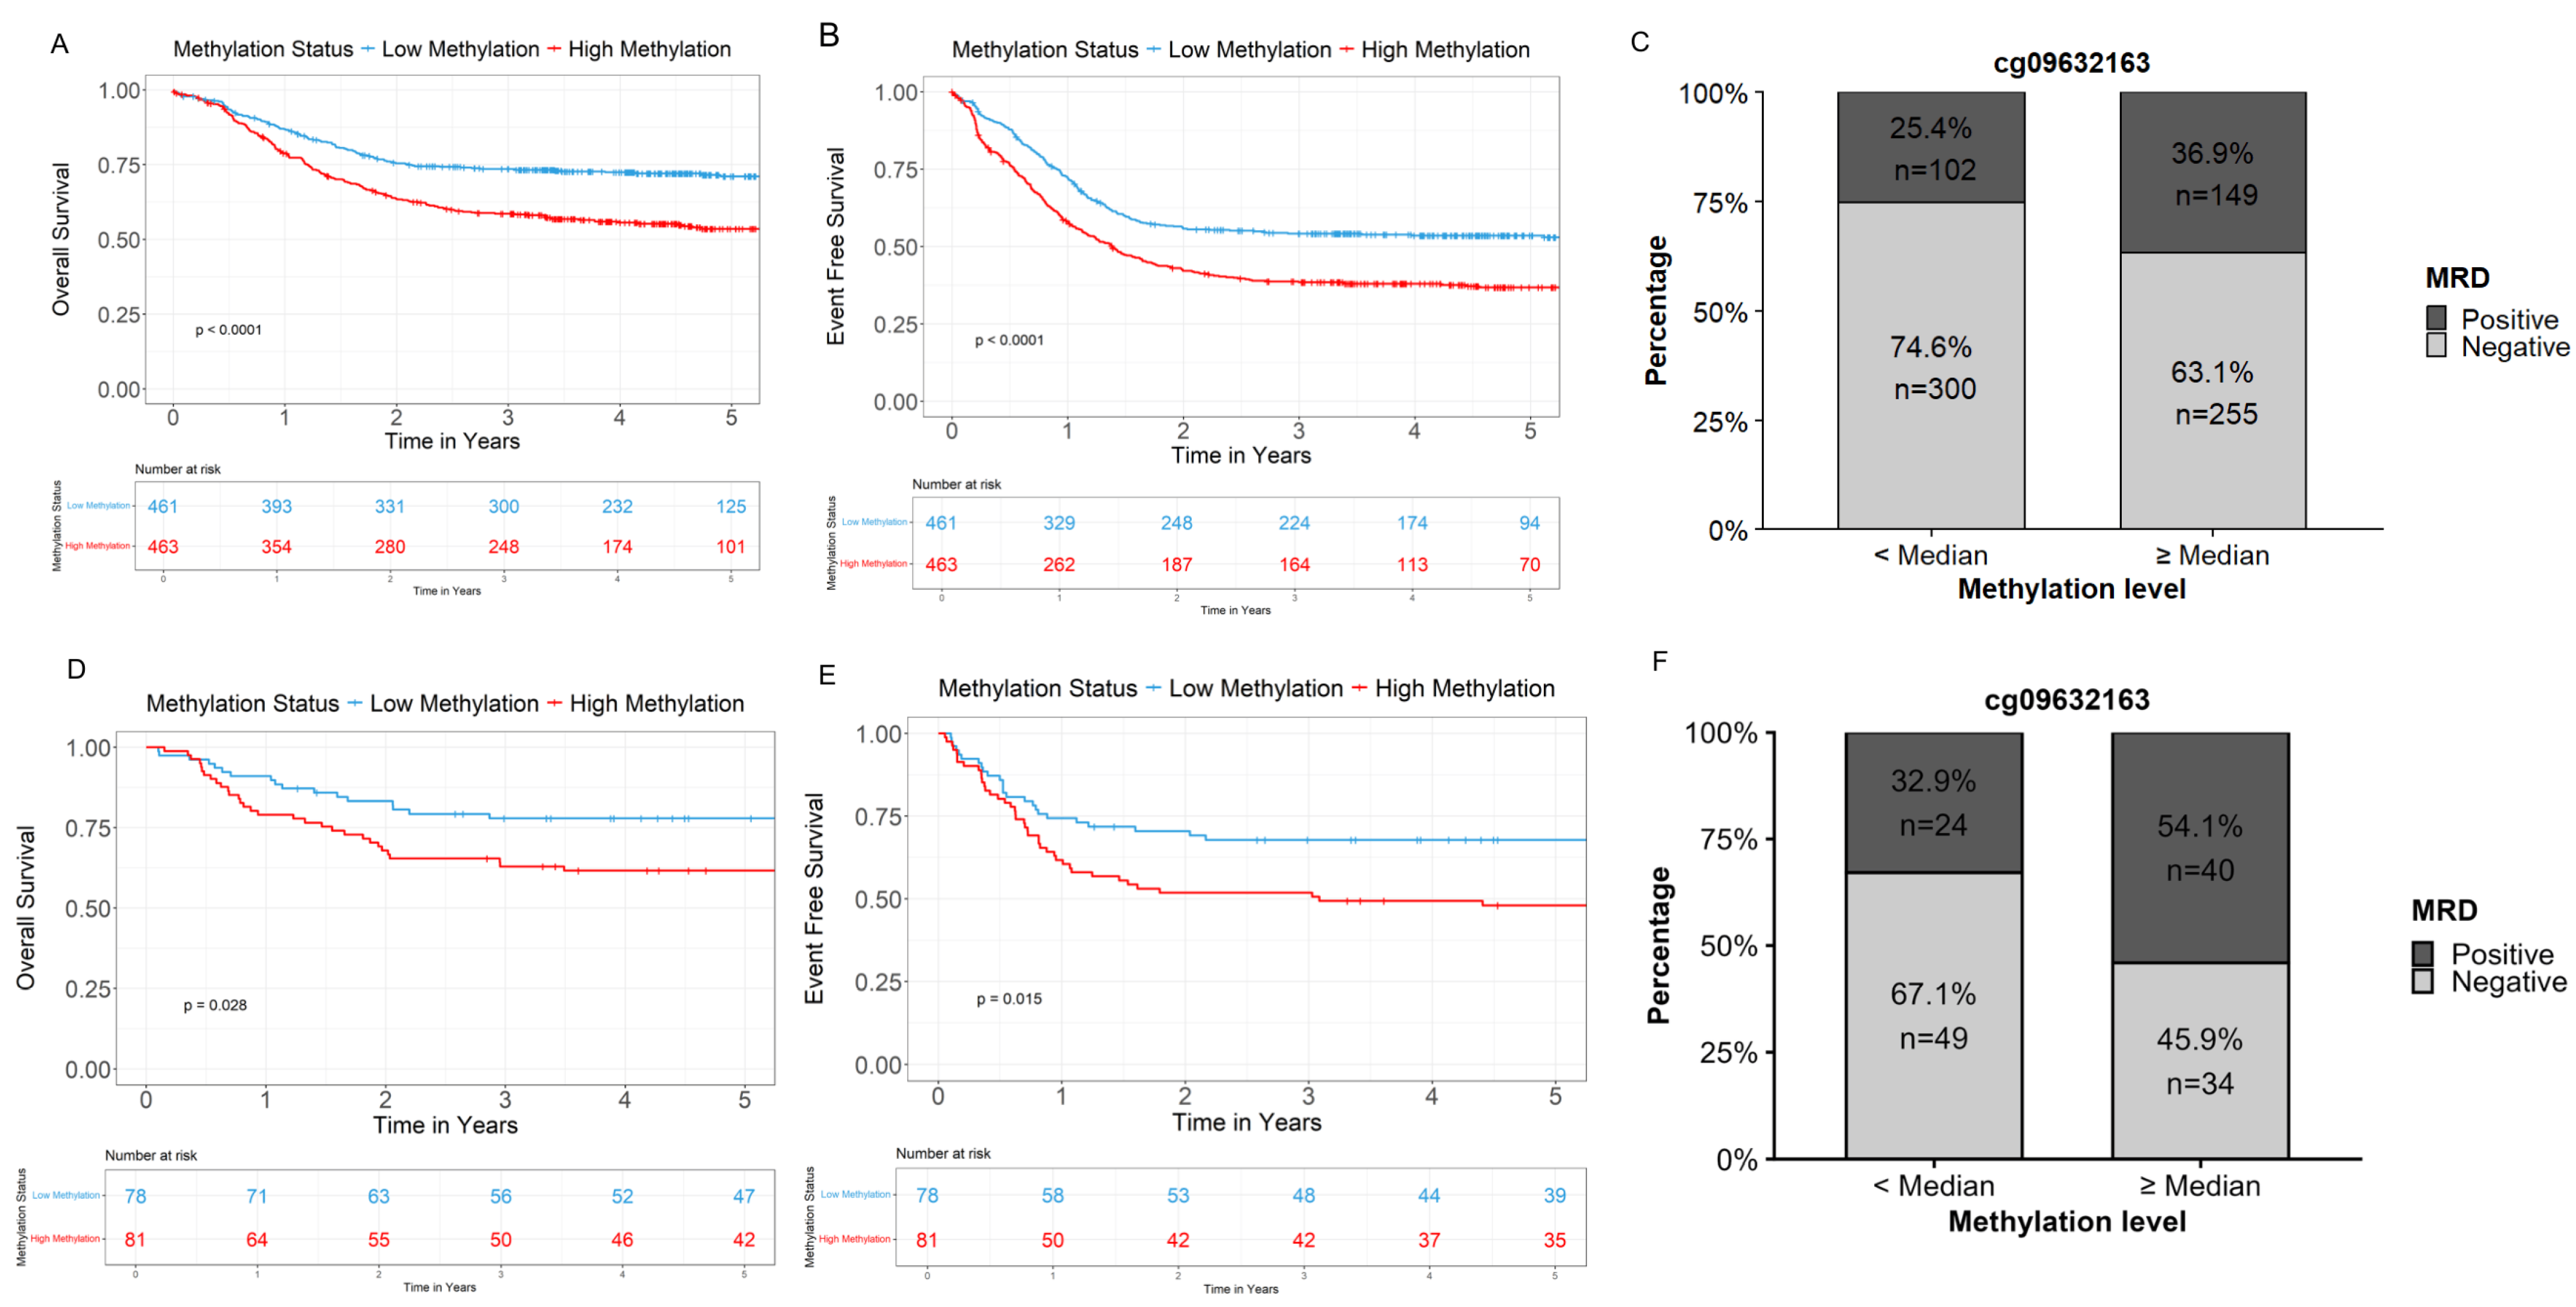
Among drug transporters, ABCA3, ABCC1 and SLC22A1 showed significant associations with clinical outcome endpoints. Methylation levels of seven intronic CpGs in efflux transporter ABCA3 were associated with clinical outcome endpoints in both discovery and validation cohorts. The methylation levels of all seven CPGs were correlated with each other (Supplementary Figure S1). Of these, for the most significant CpG (cg09632163), greater methylation was associated with poor OS (HR = 1.23, 95% CI 1.16–1.30, p < 10−12), poor EFS (HR = 1.14, 95% CI 1.10–1.19, p < 10−10), and higher MRD1 positivity (OR = 1.29, p < 0.0031, T) in the discovery cohort. In the validation cohort, consistent results were observed with cg09632163 associated with inferior OS (HR = 1.22, 95% CI 1.05–1.42, p = 0.0089) and EFS (HR = 1.25, 95% CI 1.099–1.415, p = 0.0006), and higher MRD1 positivity (OR = 1.23, 95% CI 1.066–1.438, p = 0.006) (Figure 2). In the risk-adjusted analysis, ABCA3 was not associated with any of the outcomes, which was in part due to a significant association of ABCA3 methylation with cytogenetic risk groups with the highest methylation in high-risk-group patients (p = 4.61 × 10⁻³², Figure S2). Further, the higher ABCA3 expression was associated with worse OS (HR = 1.62, 95% CI 1.31–2.02, p < 10−5) and EFS (HR = 1.42, 95% CI 1.18–1.72, p = 0.0002) in the discovery cohort (Table 3 and Supplementary Figures S3 and S4). No significant association with ABCA3 expression was observed in the validation cohort.
Hypermethylation of cg10111352 in the intronic region of another efflux transporter, ABCC1, was associated with poor OS (HR = 1.29, 95% CI 1.18–1.40, p < 2.42 × 10⁻⁹) and EFS (HR = 1.2, 95% CI 1.12–1.29, p < 1.7 × 10⁻⁷); consistent results were seen in the AML02 validation cohort with worse OS (HR = 1.74, 95% CI 1.34–2.27, p = 4.22 × 10⁻⁵) and EFS (HR = 1.54, 95% CI 1.24–1.92, p = 0.0001). In risk-adjusted analysis, ABCC1 methylation was significantly associated with EFS and OS in both discovery and validation cohorts (heatmap, Figure 1). For organic anion uptake transporter SLC22A1, higher methylation was associated with poor EFS and OS in discovery and validation cohorts (Figure 1 and Supplementary Table S2).
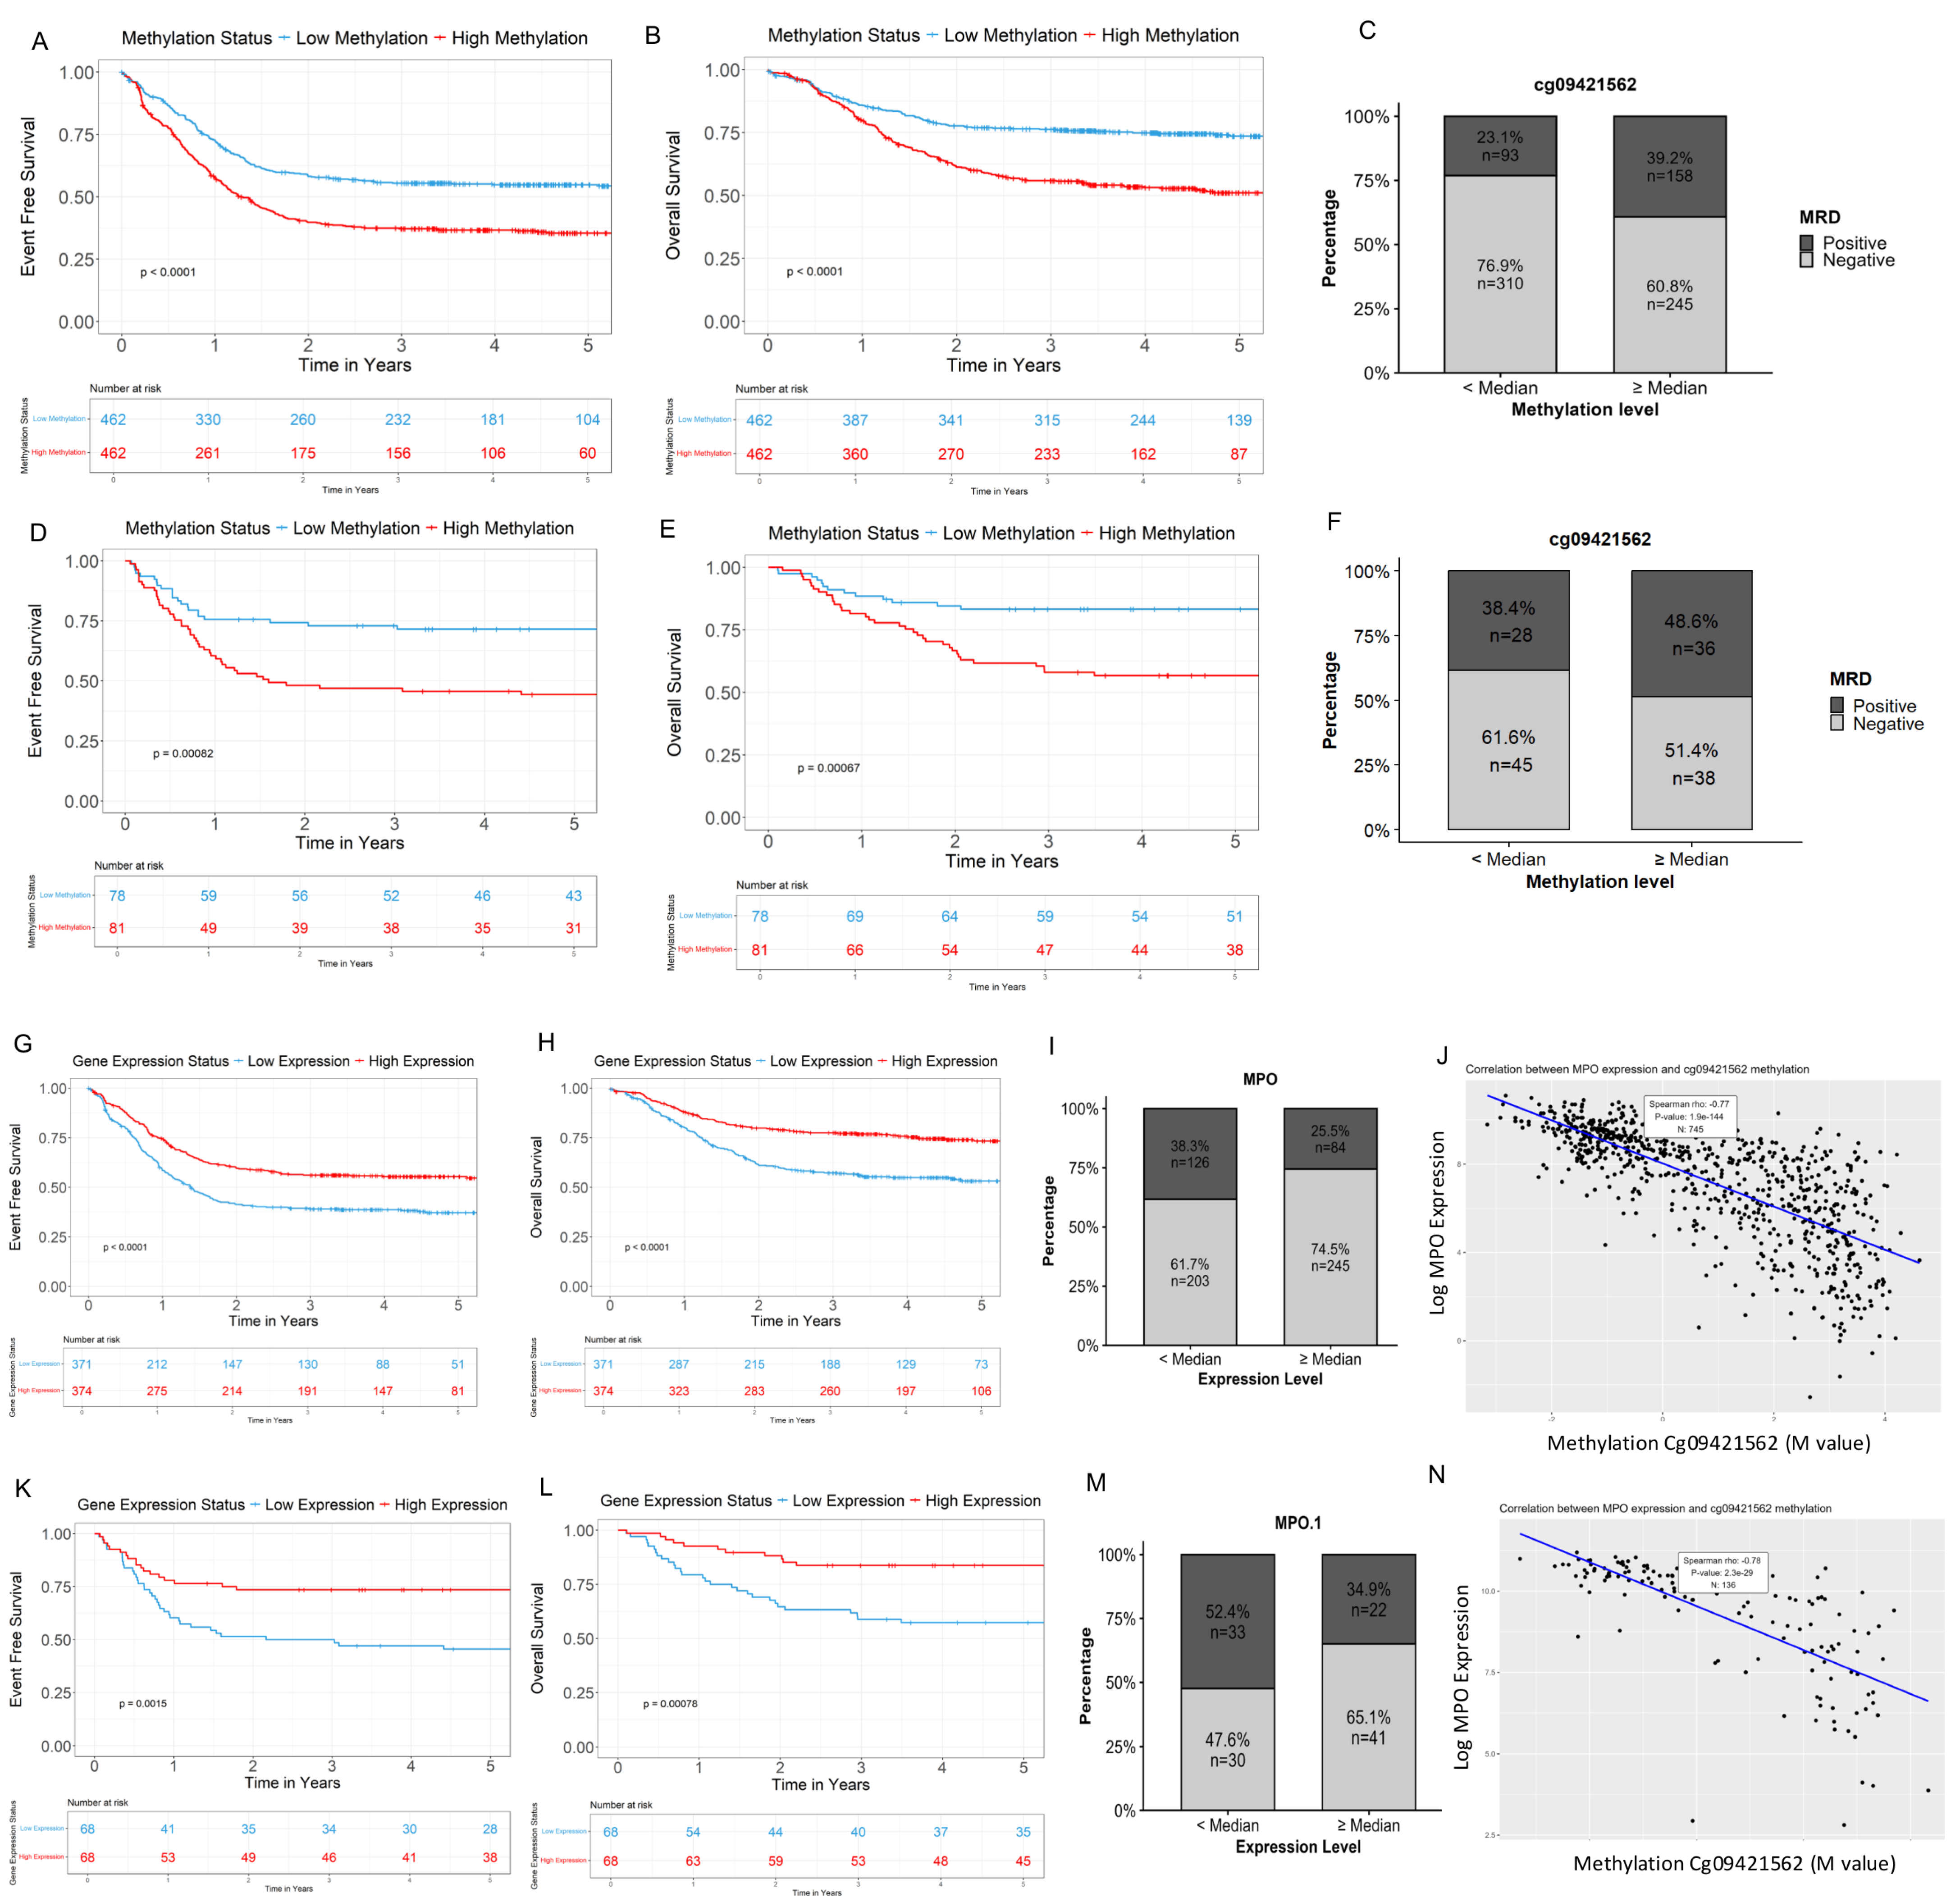
Myeloperoxidase (MPO) is a myeloid marker gene which also plays a role in etoposide pharmacology. Hypermethylation at eight CpGs on the MPO locus was significantly associated with adverse clinical outcome. The methylation levels of all eight CPGs were significantly correlated with each other (Supplementary Figure S1). Among them, cg09421562 was the most significant CpG with hypermethylation associated with poor OS in discovery (HR = 1.22, 95% CI 1.15–1.29, p < 7.63 × 10⁻¹¹), EFS (HR = 1.15, 95% CI 1.10–1.20, p < 8.37 × 10⁻⁹) and MRD1 (OR = 1.23, p < 9.5 × 10⁻⁷, Table 2) and validation cohorts (OS: HR = 1.38, 95% CI 1.173–1.636, p < 0.0001; EFS: HR = 1.32, 95% CI 1.155–1.51, p < 4.55 × 10⁻⁵) (Figure 3). Hypermethylation of all CpGs in the MPO gene including cg09421562 was significantly associated with lower MPO gene expression ( ρ = −0.77, p < 10−10, Figure 3J,N). Consistent with this, increased MPO expression was related to better clinical outcomes in discovery (OS: HR = 0.87, 95% CI 0.83–0.90, p < 10−11; EFS: HR = 0.89, 95% CI 0.86–0.93, p < 10−9) and validation cohorts (OS: HR = 0.84, 95% CI 0.73–0.97, p = 0.014; EFS: HR = 0.85, 95% CI 0.75–0.96, p = 0.007) (Figure 3G–M). Hypermethylation of CpG (cg21932452) located in the intron of nitric oxide synthase 3 (NOS3) was significantly associated with inferior outcome in both discovery and validation cohorts (discovery cohort: OS: HR = 1.21, 95% CI 1.13–1.30, p < 10−8; EFS: HR = 1.12, 95% CI 1.06–1.19, p < 0.0001; validation cohort: OS: p = 0.02 and EFS: p = 0.03). For CTPS1, a CTP synthase involved in Ara-C activation, higher methylation was associated poor OS (HR: 1.25, 95% CI 1.13–1.4, p = 1.75 × 10⁻⁵), EFS (HR: 1.19, 95% CI 1.09–1.34, p = 9.25 × 10⁻⁵) and MRD1 (OR 1.355, 95% CI 1.14–1.618, p = 0.001) in the discovery cohort and with poor OS (p = 0.004), EFS (p = 0.0004) and MRD1 (p = 0.034) in the validation cohort (Table 2 and Figure 1).
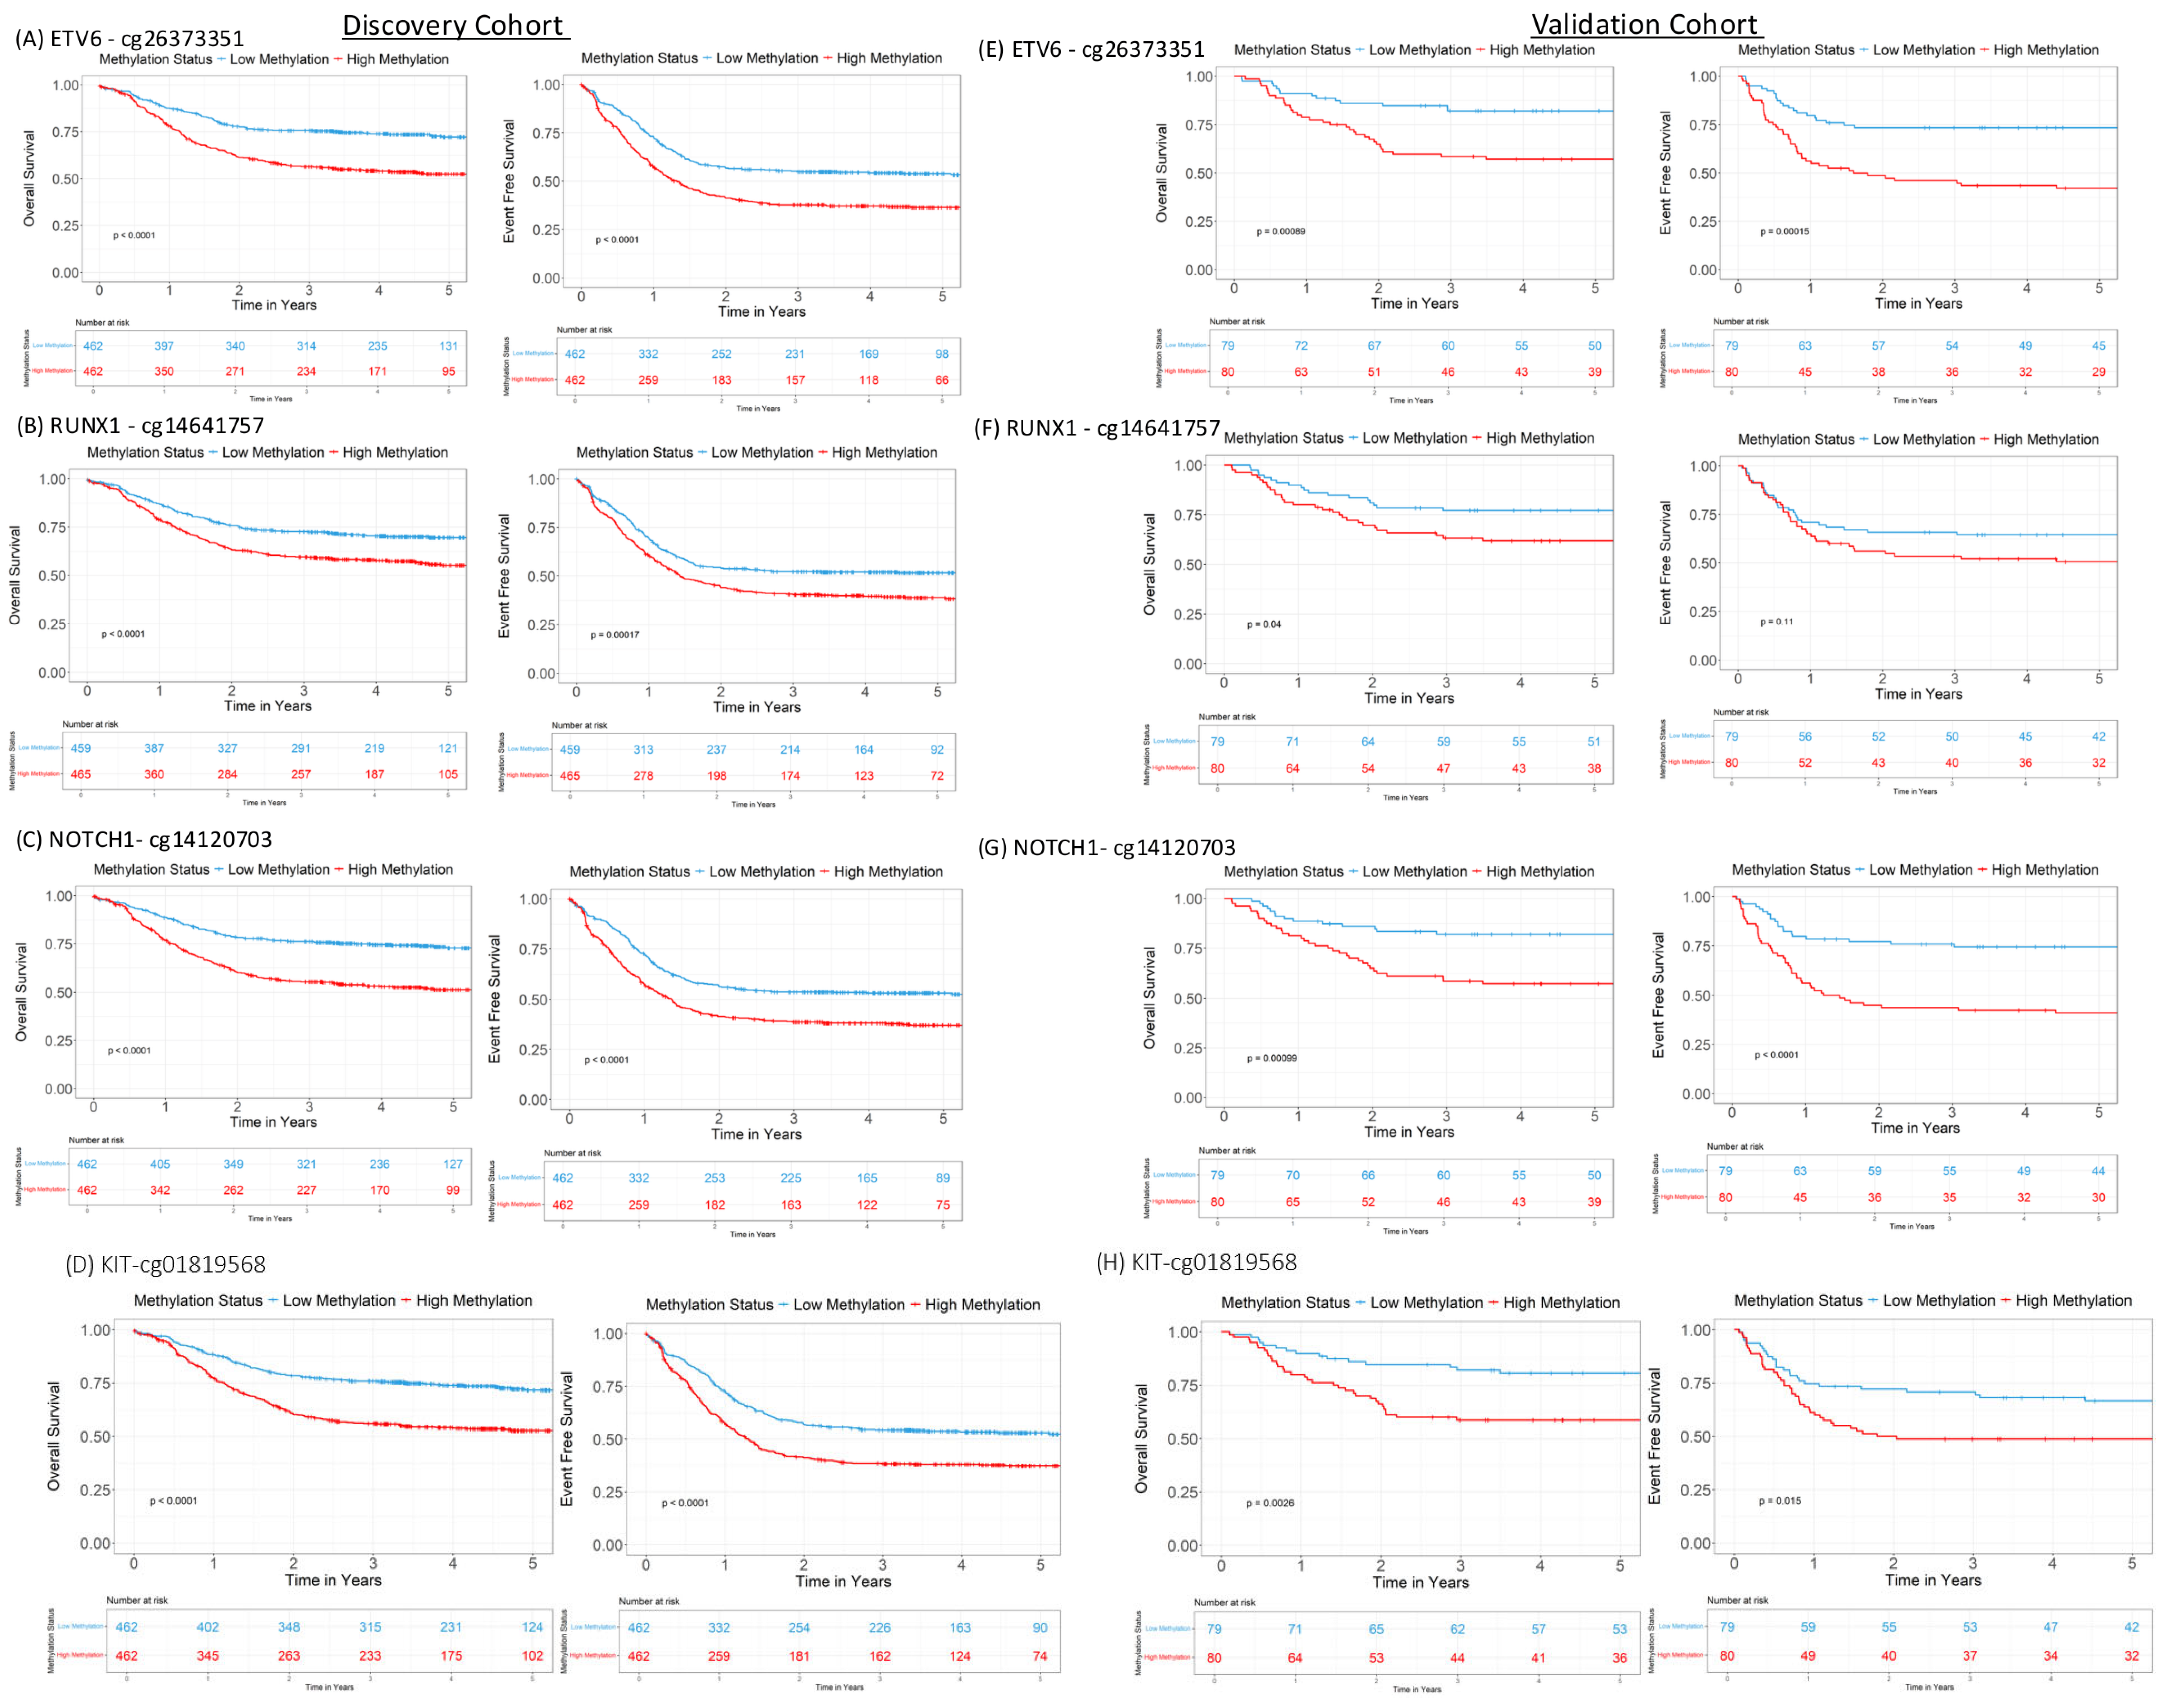
Association of DNA Methylation of AML Genes with Clinical Outcome: Among genes of relevance to myeloid malignancies, ETV6 (two CpGs), NOTCH1 (three CpGs), RUNX1 (one CpG) and KIT (five CpGs), significant association between higher methylation and poor OS, EFS and MRD1 was observed in discovery and validation cohorts (Figure 1 and Figure 4). Additionally favourable OS and EFS outcomes were observed among patients with high KIT expression (OS: HR = 0.88, 95% CI 0.81–0.96, p = 0.003; EFS: HR = 0.91, 95% CI 0.85–0.98, p = 0.009) in the discovery cohort; such an association was not observed in the validation cohort (Figure S5). A significant inverse correlation was observed between the methylation and expression levels of KIT ( ρ   = −0.45, p < 10−7; Figures S3 and S5). For SPINK2, a gene previously reported to be part of a leukemic stemness signature, higher methylation was associated with better OS, EFS and MRD1 in both discovery (OS: HR = 0.87, p = 3.05 × 10⁻⁶; EFS: HR = 0.88, p = 1.19 × 10⁻⁷; MRD1: OR = 0.85, p = 7.34 × 10⁻⁵) and validation cohorts (OS: HR = 0.81, p = 0.015; EFS: HR = 0.78, p = 0.001; MRD1: OR = 0.74, p = 0.001; Table 2 and Figure S6) and its higher expression was associated with poor outcome in both discovery (OS: HR = 1.13, p = 7.08 × 10⁻⁶; EFS: HR = 1.13, p = 5.55 × 10⁻⁸; MRD1: OR, 1.27, p = 2 × 10⁻¹⁰) and validation cohorts (OS: HR = 1.31, p = 0.004; EFS: HR = 1.35, p = 0.002; MRD1: OR = 1.63, p = 2 × 10⁻⁵) (Table 3). Methylation levels of cg22681784 and SPINK2 expression were significantly negatively correlated in both discovery and validation cohorts (p < 10 × 10−6).
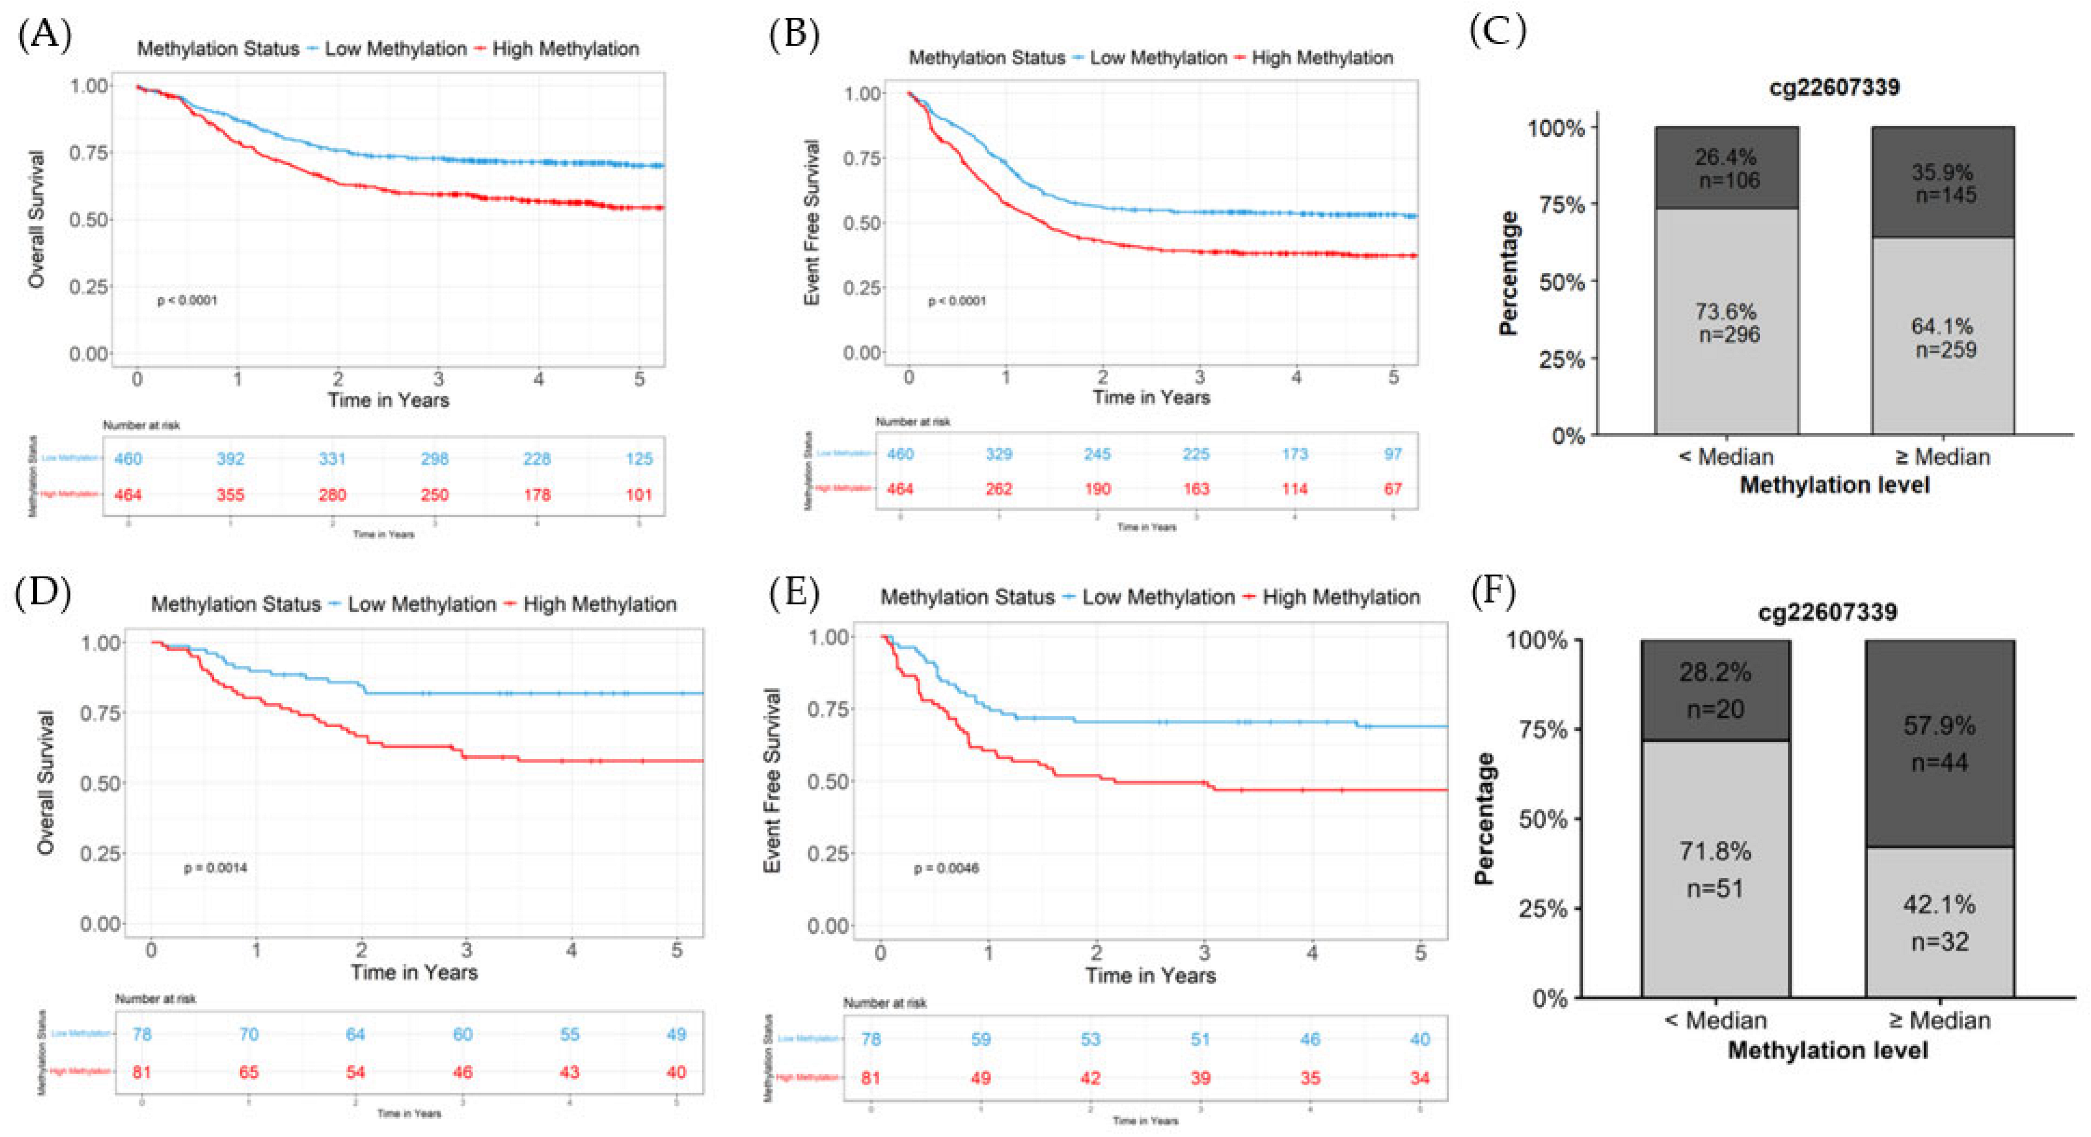
We observed that an increase in DNA methylation level of cg22607339 in Myeloproliferative Leukemia Virus Oncogene (MPL) was significantly associated with poor outcome in discovery (OS: HR = 1.18, 95% CI 1.10–1.27, p < 10−6; EFS: HR = 1.14, 95% CI 1.07–1.21, p < 10−5; MRD1: OR = 1.19, p = 0.001) and validation cohorts (Figure 5). Further expression and methylation of MPL showed negative correlation ( ρ   = −0.51, p < 10−10; Supplementary Figure S7) and as expected, higher MPL expression was significantly associated with better survival outcome (OS: HR = 0.83, 95% CI 0.76–0.91, p < 10−5; EFS: HR = 0.86, 95% CI 0.80–0.93, p < 10−5) in the discovery cohort.
Six CpGs in DNMT3A and three intronic CpGs in DNMT3B showed hypermethylation to be significantly associated with poor EFS, OS and MRD1 in both discovery and validation cohorts (Table 2 and Table S2; Figure S8 shows one of the DNMT3B CpGs). For the promoter CpG in DNMT3B, cg22052056, higher expression was associated with better EFS, OS and MRD1. Methylation of DNMT3B was significantly associated with its expression and in risk-adjusted analysis, DNMT3B intronic CpGs stayed significant in their association with the clinical endpoints. Among other genes, AKR1C1, KRAS, SOCS2, GSTP1 and CD34, we observed significant association only in the discovery cohort, and risk-adjusted analysis showed inconsistent association with outcome endpoints.
In a multivariable analysis adjusting for risk group, age and race (Supplementary Table S3), methylation levels of CpGs in ABCC1, ETV6, KIT, NOS3, NOTCH1, and RUNX1 were associated with OS in PRPF8, and stayed independent predictors of OS and/or EFS. Some of the associations were lost in the multivariable analysis, as those with ABCC1 and CpGs in MPO, DNMT3B, VWF and CALR stayed significant predictors of OS and EFS only in the validation cohort.

4. Discussion

AML is an aggressive and biologically heterogeneous malignancy associated with poor clinical outcomes. Aberrant epigenetic regulation, particularly altered DNA methylation, has been implicated in AML pathogenesis, and increased DNA methylation has been associated with inferior survival in both adult and pediatric AML [27]. Despite numerous studies investigating genome-wide methylation patterns in AML, no previous study has evaluated the prognostic significance of DNA methylation in genes involved in the pharmacology of AML therapeutics alongside key genes implicated in AML biology. In this study we report results from systematic investigation of DNA methylation of both drug-pharmacology and AML disease-pathway genes with treatment outcomes in pediatric AML.
Notably, the findings involving drug transporters (ABCA3, ABCC1 and SLC22A1) provide novel insight into mechanisms of treatment resistance in AML [28]. ABC transporters have long been implicated in multidrug resistance through altered intracellular drug accumulation. Our observations suggest that epigenetic dysregulation of transporter genes may represent an additional mechanism contributing to variability in chemotherapy response. ABCA3 has been previously associated with failure to achieve remission in patients and, in in vitro studies, with resistance to multiple drugs including doxorubicin [29,30]. In particular, the consistent association of ABCA3 methylation with adverse outcomes across independent cohorts highlights its potential clinical relevance. Interestingly, although higher ABCA3 methylation and higher ABCA3 expression were both associated with inferior outcomes, the significant association between ABCA3 methylation and adverse-risk cytogenetics suggests that these CpG markers may reflect broader epigenetic programmes associated with aggressive disease biology rather than direct transcriptional repression alone. ABCC1 has been shown to limit the efficacy of venetoclax in AML [31,32]. Additional functional studies are warranted to clarify these relationships.
Among other pharmacologically relevant genes, DNA methylation levels of CTPS1, NOS3 and MPO were associated with outcomes. CTPS1 is involved in cytarabine metabolism and nucleotide biosynthesis, while NOS3 has been implicated in anthracycline response and toxicity. MPO plays an important role in the oxidative activation of etoposide and has long been recognized as a diagnostic marker of AML due to its selective expression in myeloid cells. Previous studies have demonstrated an inverse relationship between MPO methylation and expression in newly diagnosed AML patients, and treatment with hypomethylating agents has been shown to restore MPO expression [33]. Furthermore, MPO-mediated generation of reactive oxygen species and nitrated tyrosine residues has been linked to chemotherapy-induced apoptosis, suggesting a potential mechanistic connection between MPO methylation, reduced expression, and treatment resistance [34].
Among genes involved in AML biology, in addition to previously reported DNMT3A, DNMT3B, significant methylation–outcome associations were observed for ETV6, KIT, NOTCH1, RUNX1 and MPL; for all these genes, DNA methylation was also associated with corresponding gene expression. These genes play critical roles in hematopoietic development, stem cell maintenance, and leukemic transformation. For example, KIT, a receptor tyrosine kinase mutated in 4–6% of newly diagnosed AML cases, has established roles in leukemic cell proliferation and survival, while RUNX1 and ETV6 are essential regulators of hematopoietic stem and progenitor cell function.
MPL (thrombopoietin receptor) is of particular interest as it is critical for hematopoietic stem cell maintenance and self-renewal and has been implicated in hematologic disorders characterized by cytopenias and progression to AML [35]. We observed that increased MPL methylation was associated with inferior clinical outcomes and reduced gene expression, suggesting that epigenetic silencing of MPL may contribute to impaired hematopoietic regulation and adverse prognosis. Similarly, methylation-associated suppression of genes involved in stem cell regulation and hematopoietic differentiation may contribute to persistence of treatment-resistant leukemic populations.
One of the important clinical implications of these findings is their potential utility for improving risk stratification. Current AML risk classification is driven primarily by cytogenetic and molecular abnormalities along with MRD1 assessment. Despite these advances, substantial heterogeneity in treatment response and survival remains within established risk groups. The methylation markers identified in this study may provide complementary prognostic information beyond conventional risk factors and warrant future evaluation as components of integrated risk prediction models. Such approaches could help identify patients at elevated risk of treatment failure who may benefit from alternative therapeutic strategies or intensified monitoring.
Because DNA methylation is a key epigenetic regulator of gene expression, we examined the relationship between CpG methylation and transcript abundance. We identified significant correlations between DNA methylation at specific CpG sites and the expression of their corresponding genes. Although promoter methylation-mediated gene silencing is well established, Yang et al. demonstrated that gene body hypomethylation can also reduce gene expression, highlighting the complex regulatory role of DNA methylation and its potential as a therapeutic target in cancer [36].
Consistent with these observations, we found positive correlations between methylation of CpG sites within the ABCA3 gene body and ABCA3 expression. In contrast, higher methylation levels within the gene bodies of MPO and KIT were associated with lower gene expression. The functional role of gene body methylation remains incompletely understood. Proposed mechanisms include transcriptional repression through chromatin condensation and interactions with regulatory elements such as enhancers, transcription factor binding sites, and repetitive elements. Conversely, accumulating evidence suggests that gene body methylation can promote gene expression by regulating alternative splicing and maintaining transcriptional fidelity [37]. Our findings further indicate that the relationship between DNA methylation and gene expression is highly context-dependent. Specifically, increased methylation within the DNMT3B promoter was associated with reduced DNMT3B expression, whereas methylation within the gene body showed the opposite association (Figure S8). Together, these findings underscore the complexity of DNA methylation-mediated gene regulation and highlight the importance of CpG genomic context in determining transcriptional outcomes, warranting further mechanistic investigation.
The therapeutic implications of these findings are particularly relevant given the increasing incorporation of hypomethylating agents, including azacitidine and decitabine, into AML treatment regimens. Initially approved for myelodysplastic syndromes, these agents have become integral components of AML therapy, particularly for older or medically unfit patients. In 2018, the FDA approved venetoclax in combination with azacitidine or decitabine for adults with newly diagnosed AML who are ineligible for intensive chemotherapy, and in 2020, oral azacitidine was approved as maintenance therapy for patients who achieved remission but were unable to complete intensive curative treatment [38,39,40]. The rationale underlying these agents is reversal of aberrant DNA methylation and restoration of transcriptional activity. Consequently, the pharmacologic and leukemia-associated genes identified in our analysis represent biologically plausible and potentially actionable epigenetic targets. The inverse relationship observed between DNA methylation and gene expression for several genes, including MPO, KIT, MPL, SPINK2, and DNMT3B, further supports the functional relevance of these epigenetic alterations. Future studies should evaluate whether specific methylation signatures can identify patients most likely to benefit from epigenetic therapies or rational combination approaches incorporating hypomethylating agents.
This study has several limitations. First, its retrospective design limits causal inference. Second, gene expression was measured using different platforms in the discovery and validation cohorts, which may have contributed to the differences observed in multivariable analyses. Finally, DNA methylation was assessed in bulk leukemic samples and therefore may not fully capture the cellular heterogeneity of AML or the epigenetic landscape of rare subpopulations, such as leukemia stem cells.
In summary, we identified DNA methylation markers within both pharmacologic and AML disease-related genes that are associated with treatment response and survival in pediatric AML. These findings provide new insight into the epigenetic mechanisms underlying chemotherapy resistance and leukemia biology while highlighting the potential clinical utility of DNA methylation biomarkers for risk stratification and therapeutic decision-making. Prospective validation and mechanistic studies are warranted to establish the predictive value of these methylation markers and to determine their potential as therapeutic targets, particularly in the context of emerging epigenetic treatment strategies.

Supplementary Materials

The following supporting information can be downloaded at: https://www.mdpi.com/article/10.3390/cancers18152467/s1, Figure S1. Correlation Heatmap showing association of CpG methylation for the genes with multiple CpGs associated with outcome in discovery cohort. Figure S2. Box plots showing association of DNA methylation levels of individual genes by risk groups. Figure S3. Heatmap showing association gene expression with CpG methylation (discovery- RNAseq and validation cohort-U133A array) of selected CpGs that were associated with clinical outcome in Figure 1. Top bar shows the cohort (blue- discovery and orange validation cohort). p values are shown by * and direction of correlation blue negative and red positive. Grey indicates data not available in validation cohort. Figure S4. Association of expression levels of ABCA3 with outcome in pediatric AML. Kaplan-Meier survival curves for by median expression values for OS and EFS in discovery cohort (A and B) and validation cohort (D and E). Correlation between ABCA3 Cg09632163 methylation levels and gene expression is shown in scatter plots for discovery (C) and validation cohorts (F). Figure S5. Association of methylation levels of a KIT expression with outcome in pediatric AML. Kaplan-Meier survival curves for by median methylation values for OS and EFS in discovery cohort (A and B) and validation cohort (D and E). Correlation between MPO Cg09421562 methylation levels and gene expression is shown in scatter plots for discovery (C) and validation cohorts (F). Figure S6. Association of methylation levels (cg22681784) and Gene Expression SPINK2 with outcome in pediatric AML. Kaplan-Meier survival curves for by median methylation values (A–C) and SPINK2 Expression (D–F) for OS and EFS and MRD1 in discovery cohort and validation cohort (G–L). Stacked bar plot showing the proportion of who were MRD negative (light grey), or MRD positive (dark grey) by MPO methylation (by median) in discovery and validation cohorts (C and F in discovery and I and L in validation cohort). Figure S7. Association of MPL expression with low expression with OS (A) and EFS (B) in discovery cohort. (C) Scatterplot showing correlation of MPL methylation with expression in discovery cohort. Figure S8. Association of methylation levels of an intronic Cg17475857 and Cg22052056 in DNMT3B with outcome in pediatric AML. Kaplan-Meier survival curves for by median methylation values for OS and EFS in discovery cohort (A and B) for Cg17475857 and (E and F) for Cg22052056. Stacked bar plot showing the proportion of who were MRD negative (light grey), or MRD positive (dark grey) and Correlation between DNMT3B Cg17475857 and Cg22052056 methylation levels with gene expression is shown in scatter plots (D and H). Table S1: List of CpGs and genes investigated in this study. Table S2. Association of Methylation of CpGs in candidate genes with clinical outcome (Unadjusted and Risk Adjusted Analysis) in discovery and validation cohorts.

Author Contributions

J.K.L., F.M., S.B.P. and N.A. conceptualized the study. F.M. and N.A. performed the analysis and wrote the manuscript. S.M., J.E.R. and R.C.R. contributed data and specimens. S.B.P. and X.C. overlooked statistical analysis. All authors have read and agreed to the published version of the manuscript.

Funding

The research reported in this publication was supported in part by the NIH/NCI (R01CA132946), American Cancer Society/St Baldrick’s Foundation (SAP 21-061-01), and UF Health Cancer Center, and supported in part by state appropriations provided in Fla. Stat. § 381.915 and the NIH/NCI P30CA247796.

Institutional Review Board Statement

The study was conducted in accordance with the Declaration of Helsinki, and approved by the Institutional Review Board of the University of Florida.

Informed Consent Statement

Informed consent was obtained from subjects involved in the validation cohort of the study.

Data Availability Statement

The data used in this study is publicly available through the TARGET database.

Acknowledgments

We thank the patients and families who participated in the studies. The content is solely the responsibility of the authors and does not necessarily represent the official views of the National Institutes of Health or the State of Florida.

Conflicts of Interest

The authors declare no conflicts of interest.

References

  1. Siegel, R.L.; Miller, K.D.; Jemal, A. Cancer statistics, 2019. CA Cancer J. Clin. 2019, 69, 7–34. [Google Scholar] [CrossRef] [PubMed]
  2. Bethesda. Seer Cancer Stat Facts: Acute Myeloid Leukemia; National Cancer Institute. Available online: https://seer.cancer.gov/statfacts/html/amyl.html (accessed on 20 July 2026).
  3. Chaudhury, S.; O’Connor, C.; Cañete, A.; Bittencourt-Silvestre, J.; Sarrou, E.; Prendergast, Á.; Choi, J.; Johnston, P.; Wells, C.A.; Gibson, B.; et al. Age-specific biological and molecular profiling distinguishes paediatric from adult acute myeloid leukaemias. Nat. Commun. 2018, 9, 5280. [Google Scholar] [CrossRef] [PubMed]
  4. Rowe, J.M. Will new agents impact survival in AML? Best Pract. Res. Clin. Haematol. 2019, 32, 101094. [Google Scholar] [CrossRef] [PubMed]
  5. Cuglievan, B.; McCall, D.; Robusto, L.; Mireles, M.E.; Gettys, S.C. Current and emerging pharmacotherapy for the treatment of childhood acute myeloid leukemia. Expert. Opin. Pharmacother. 2022, 23, 1915–1925. [Google Scholar] [CrossRef] [PubMed]
  6. Tosic, N.; Marjanovic, I.; Lazic, J. Pediatric acute myeloid leukemia: Insight into genetic landscape and novel targeted approaches. Biochem. Pharmacol. 2023, 215, 115705. [Google Scholar] [CrossRef] [PubMed]
  7. Rubnitz, J.E.; Inaba, H.; Dahl, G.; Ribeiro, R.C.; Bowman, W.P.; Taub, J.; Pounds, S.; Razzouk, B.I.; Lacayo, N.J.; Cao, X.; et al. Minimal residual disease-directed therapy for childhood acute myeloid leukaemia: Results of the AML02 multicentre trial. Lancet Oncol. 2010, 11, 543–552. [Google Scholar] [CrossRef] [PubMed]
  8. Issa, J.P.; Baylin, S.B.; Herman, J.G. DNA methylation changes in hematologic malignancies: Biologic and clinical implications. Leukemia 1997, 11, S7–S11. [Google Scholar] [CrossRef] [PubMed]
  9. Kanno, S.; Maeda, N.; Tomizawa, A.; Yomogida, S.; Katoh, T.; Ishikawa, M. Characterization of cells resistant to the potent histone deacetylase inhibitor spiruchostatin B (SP-B) and effect of overexpressed p21waf1/cip1 on the sp-b resistance or susceptibility of human leukemia cells. Int. J. Oncol. 2012, 41, 862–868. [Google Scholar] [CrossRef] [PubMed]
  10. Chen, C.; Liu, Y.; Lu, C.; Cross, J.R.; Morris, J.P.; Shroff, A.S.; Ward, P.S.; Bradner, J.E.; Thompson, C.; Lowe, S.W. Cancer-associated idh2 mutants drive an acute myeloid leukemia that is susceptible to brd4 inhibition. Genes Dev. 2013, 27, 1974–1985. [Google Scholar] [CrossRef] [PubMed]
  11. Lamba, J.K.; Cao, X.; Raimondi, S.; Downing, J.; Ribeiro, R.; Gruber, T.A.; Rubnitz, J.; Pounds, S. DNA methylation clusters and their relation to cytogenetic features in pediatric AML. Cancers 2020, 12, 3024. [Google Scholar] [CrossRef] [PubMed]
  12. Lamba, J.K.; Cao, X.; Raimondi, S.C.; Rafiee, R.; Downing, J.R.; Lei, S.; Gruber, T.; Ribeiro, R.C.; Rubnitz, J.E.; Pounds, S.B. Integrated epigenetic and genetic analysis identifies markers of prognostic significance in pediatric acute myeloid leukemia. Oncotarget 2018, 9, 26711–26723. [Google Scholar] [CrossRef] [PubMed]
  13. Marchi, F.; Shastri, V.M.; Marrero, R.J.; Nguyen, N.H.K.; Öttl, A.; Schade, A.K.; Landwehr, M.; Krali, O.; Nordlund, J.; Ghavami, M.; et al. Epigenomic diagnosis and prognosis of Acute Myeloid Leukemia. Nat. Commun. 2025, 16, 6961. [Google Scholar] [CrossRef] [PubMed]
  14. Aplenc, R.; Meshinchi, S.; Sung, L.; Alonzo, T.; Choi, J.; Fisher, B.; Gerbing, R.; Hirsch, B.; Horton, T.; Kahwash, S.; et al. Bortezomib with standard chemotherapy for children with acute myeloid leukemia does not improve treatment outcomes: A report from the children’s oncology group. Haematologica 2020, 105, 1879–1886. [Google Scholar] [CrossRef] [PubMed]
  15. Gamis, A.S.; Alonzo, T.A.; Meshinchi, S.; Sung, L.; Gerbing, R.B.; Raimondi, S.C.; Hirsch, B.A.; Kahwash, S.B.; Heerema-McKenney, A.; Winter, L.; et al. Gemtuzumab ozogamicin in children and adolescents with de novo acute myeloid leukemia improves event-free survival by reducing relapse risk: Results from the randomized phase III children’s oncology group trial AAML0531. J. Clin. Oncol. 2014, 32, 3021–3032. [Google Scholar] [CrossRef] [PubMed]
  16. Cooper, T.M.; Franklin, J.; Gerbing, R.B.; Alonzo, T.A.; Hurwitz, C.; Raimondi, S.C.; Hirsch, B.; Smith, F.O.; Mathew, P.; Arceci, R.J.; et al. AAML03P1, a pilot study of the safety of gemtuzumab ozogamicin in combination with chemotherapy for newly diagnosed childhood acute myeloid leukemia: A report from the children’s oncology group. Cancer 2012, 118, 761–769. [Google Scholar] [PubMed]
  17. Whirl-Carrillo, M.; Huddart, R.; Gong, L.; Sangkuhl, K.; Thorn, C.F.; Whaley, R.; Klein, T.E. An evidence-based framework for evaluating pharmacogenomics knowledge for personalized medicine. Clin. Pharmacol. Ther. 2021, 110, 563–572. [Google Scholar] [CrossRef] [PubMed]
  18. Marrero, R.J.; Cao, X.; Wu, H.; Elsayed, A.H.; Klco, J.M.; Ribeiro, R.C.; Rubnitz, J.E.; Ma, X.; Meshinchi, S.; Aplenc, R.; et al. SAMHD1 single nucleotide polymorphisms impact outcome in children with newly diagnosed acute myeloid leukemia. Blood Adv. 2023, 7, 2538–2550. [Google Scholar] [CrossRef] [PubMed]
  19. Illumina, Trusight Myeloid Panel. Targets Hematological Variants. Available online: https://www.illumina.com/products/by-type/clinical-research-products/trusight-myeloid.html (accessed on 26 July 2026).
  20. Ng, S.W.; Mitchell, A.; Kennedy, J.A.; Chen, W.C.; McLeod, J.; Ibrahimova, N.; Arruda, A.; Popescu, A.; Gupta, V.; Schimmer, A.D.; et al. A 17-gene stemness score for rapid determination of risk in acute leukaemia. Nature 2016, 540, 433–437. [Google Scholar] [CrossRef] [PubMed]
  21. Bolouri, H.; Farrar, J.E.; Triche, T.; Ries, R.E.; Lim, E.L.; Alonzo, T.A.; Ma, Y.; Moore, R.; Mungall, A.J.; Marra, M.A.; et al. The molecular landscape of pediatric acute myeloid leukemia reveals recurrent structural alterations and age-specific mutational interactions. Nat. Med. 2018, 24, 103–112. [Google Scholar] [CrossRef] [PubMed]
  22. Bertrums, E.J.M.; Smith, J.L.; Harmon, L.; Ries, R.E.; Wang, Y.J.; Alonzo, T.A.; Menssen, A.J.; Chisholm, K.M.; Leonti, A.R.; Tarlock, K.; et al. Comprehensive molecular and clinical characterization of. Haematologica 2023, 108, 2044–2058. [Google Scholar] [CrossRef] [PubMed]
  23. Bolouri, H.; Ries, R.; Pardo, L.; Hylkema, T.; Zhou, W.; Smith, J.L.; Leonti, A.; Loken, M.; Farrar, J.E.; Triche, T.J.; et al. A B-cell developmental gene regulatory network is activated in infant AML. PLoS ONE 2021, 16, e0259197. [Google Scholar] [CrossRef] [PubMed]
  24. Ross, M.E.; Mahfouz, R.; Onciu, M.; Liu, H.C.; Zhou, X.; Song, G.; Shurtleff, S.A.; Pounds, S.; Cheng, C.; Ma, J.; et al. Gene expression profiling of pediatric acute myelogenous leukemia. Blood 2004, 104, 3679–3687. [Google Scholar] [CrossRef] [PubMed]
  25. Grambsch, P.; Therneau, T.M. Modeling Survival Data: Extending the Cox Model; Springer: New York, NY, USA, 2000; ISBN 0-387-98784-3. [Google Scholar]
  26. Wickham, H. ggplot2: Elegant Graphics for Data Analysis; Springer: New York, NY, USA, 2016; ISBN 978-3-319-24277-4. Available online: https://ggplot2.Tidyverse.Org (accessed on 20 July 2026).
  27. Bullinger, L.; Ehrich, M.; Döhner, K.; Schlenk, R.F.; Döhner, H.; Nelson, M.R.; van den Boom, D. Quantitative DNA methylation predicts survival in adult acute myeloid leukemia. Blood 2010, 115, 636–642. [Google Scholar] [CrossRef] [PubMed]
  28. Megías-Vericat, J.E.; Martínez-Cuadrón, D.; Solana-Altabella, A.; Poveda, J.L.; Montesinos, P. Systematic review of pharmacogenetics of ABC and SLC transporter genes in acute myeloid leukemia. Pharmaceutics 2022, 14, 878. [Google Scholar] [CrossRef] [PubMed]
  29. Steinbach, D.; Gillet, J.P.; Sauerbrey, A.; Gruhn, B.; Dawczynski, K.; Bertholet, V.; de Longueville, F.; Zintl, F.; Remacle, J.; Efferth, T. ABCA3 as a possible cause of drug resistance in childhood acute myeloid leukemia. Clin. Cancer Res. 2006, 12, 4357–4363. [Google Scholar] [CrossRef] [PubMed]
  30. Chapuy, B.; Koch, R.; Radunski, U.; Corsham, S.; Cheong, N.; Inagaki, N.; Ban, N.; Wenzel, D.; Reinhardt, D.; Zapf, A.; et al. Intracellular ABC transporter A3 confers multidrug resistance in leukemia cells by lysosomal drug sequestration. Leukemia 2008, 22, 1576–1586. [Google Scholar] [CrossRef] [PubMed]
  31. Ebner, J.; Schmoellerl, J.; Piontek, M.; Manhart, G.; Troester, S.; Carter, B.Z.; Neubauer, H.; Moriggl, R.; Szakács, G.; Zuber, J.; et al. ABCC1 and glutathione metabolism limit the efficacy of BCL-2 inhibitors in acute myeloid leukemia. Nat. Commun. 2023, 14, 5709. [Google Scholar] [CrossRef] [PubMed]
  32. Cerovska, E.; Salek, C.; Kundrat, D.; Sestakova, S.; Pesek, A.; Brozinova, I.; Belickova, M.; Remesova, H. ABC transporters are predictors of treatment failure in acute myeloid leukaemia. Biomed. Pharmacother. 2024, 170, 115930. [Google Scholar] [CrossRef] [PubMed]
  33. Schmelz, K.; Sattler, N.; Wagner, M.; Lübbert, M.; Dörken, B.; Tamm, I. Induction of gene expression by 5-Aza-2′-deoxycytidine in acute myeloid leukemia (AML) and myelodysplastic syndrome (MDS) but not epithelial cells by DNA-methylation-dependent and -independent mechanisms. Leukemia 2005, 19, 103–111. [Google Scholar] [CrossRef] [PubMed]
  34. Sawayama, Y.; Miyazaki, Y.; Ando, K.; Horio, K.; Tsutsumi, C.; Imanishi, D.; Tsushima, H.; Imaizumi, Y.; Hata, T.; Fukushima, T.; et al. Expression of myeloperoxidase enhances the chemosensitivity of leukemia cells through the generation of reactive oxygen species and the nitration of protein. Leukemia 2008, 22, 956–964. [Google Scholar] [CrossRef] [PubMed]
  35. Rauch, P.J.; Ellegast, J.M.; Widmer, C.C.; Fritsch, K.; Goede, J.S.; Valk, P.J.; Löwenberg, B.; Takizawa, H.; Manz, M.G. MPL expression on AML blasts predicts peripheral blood neutropenia and thrombocytopenia. Blood 2016, 128, 2253–2257. [Google Scholar] [CrossRef] [PubMed]
  36. Yang, X.; Han, H.; De Carvalho, D.D.; Lay, F.D.; Jones, P.A.; Liang, G. Gene body methylation can alter gene expression and is a therapeutic target in cancer. Cancer Cell 2014, 26, 577–590. [Google Scholar] [CrossRef] [PubMed]
  37. Wang, Q.; Xiong, F.; Wu, G.; Liu, W.; Chen, J.; Wang, B.; Chen, Y. Gene body methylation in cancer: Molecular mechanisms and clinical applications. Clin. Epigenet. 2022, 14, 154. [Google Scholar] [CrossRef] [PubMed]
  38. DiNardo, C.D.; Pratz, K.W.; Letai, A.; Jonas, B.A.; Wei, A.H.; Thirman, M.; Arellano, M.; Frattini, M.G.; Kantarjian, H.; Popovic, R.; et al. Safety and preliminary efficacy of venetoclax with decitabine or azacitidine in elderly patients with previously untreated acute myeloid leukaemia: A non-randomised, open-label, phase 1b study. Lancet Oncol. 2018, 19, 216–228. [Google Scholar] [CrossRef] [PubMed]
  39. Jen, E.Y.; Wang, X.; Li, M.; Li, H.; Lee, S.L.; Ni, N.; Przepiorka, D.; Vallejo, J.; Leong, R.; Ma, L.; et al. FDA Approval Summary: Oral Azacitidine for Continued Treatment of Adults with Acute Myeloid Leukemia Unable to Complete Intensive Curative Therapy. Clin. Cancer Res. 2022, 28, 2989–2993. [Google Scholar] [CrossRef] [PubMed]
  40. Venditti, A.; Hou, J.Z.; Fenaux, P.; Jonas, B.A.; Vrhovac, R.; Montesinos, P.; Garcia, J.S.; Rizzieri, D.; Thirman, M.J.; Zhang, M.; et al. Outcomes of patients treated with venetoclax plus azacitidine versus azacitidine alone stratified by advanced age and acute myeloid leukemia composite model. Leukemia 2025, 39, 2697–2707. [Google Scholar] [CrossRef] [PubMed]
Figure 1. (A) Overall strategy of the work. (B) Heatmap showing association (unadjusted and risk-adjusted analysis) of top selected CpGs with EFS, OS and MRD1 in discovery and validation cohorts. (C) Heatmap showing association (unadjusted and risk-adjusted analysis) of gene expression of candidate genes with EFS, OS and MRD1 in discovery and validation cohorts. The density of the heatmap reflects the hazard ratio for EFS and OS and odds ratio for MRD1. A significant p-value is reflected by an asterisk, and grey boxes in the gene expression heatmap reflect missing data in the validation cohort.
Cancers 18 02467 g001
Figure 2. Association of methylation levels of an intronic Cg09632163 in ABCA3 with outcome in pediatric AML. Kaplan–Meier survival curves of median methylation values for OS and EFS in the discovery cohort (A,B) and validation cohort (D,E). Stacked bar plot showing the proportion of those who were MRD-negative (light grey) or MRD-positive (dark grey) by ABCA3 methylation (by median) in discovery and validation cohorts (C,F).
Cancers 18 02467 g002
Figure 3. Association of methylation levels of an intronic Cg09421562 in MPO with outcome in pediatric AML. Kaplan–Meier survival curves of median methylation values for OS and EFS in the discovery cohort (A,B) and validation cohort (D,E). Stacked bar plot showing the proportion of those who were MRD-negative (light grey) or MRD-positive (dark grey) by MPO methylation (by median) in discovery and validation cohorts (C,F). Association of expression levels of MPO with outcome in pediatric AML. Kaplan–Meier survival curves of median expression values for OS and EFS in the discovery cohort (G,H) and validation cohort (K,L). Stacked bar plot showing the proportion of those who were MRD-negative (light grey) or MRD-positive (dark grey) by MPO expression (by median) in discovery and validation cohorts (I,J). The correlation between MPO Cg09421562 methylation levels and gene expression is shown in scatter plots for discovery (M) and validation cohorts (N).
Cancers 18 02467 g003
Figure 4. Association of methylation levels of ETV6—cg26373351, RUNX1—cg14641757, NOTCH1- cg14120703 and KIT-cgg01819568 with OS and EFS in discovery and validation cohorts. Kaplan–Meier survival curves of median methylation values for OS and EFS in the discovery cohort (AD) and validation cohort (EH).
Cancers 18 02467 g004
Figure 5. Association of methylation levels of an intronic Cg22607339 in MPL with outcome in pediatric AML. Kaplan–Meier survival curves of median methylation values for OS and EFS in the discovery cohort (A,B) and validation cohort (D,E). Stacked bar plot showing the proportion of those who were MRD-negative (light grey) or MRD-positive (dark grey) by MPL methylation (by median) in discovery and validation cohorts (C,F). Association of expression levels of MPL with outcome in pediatric AML.
Cancers 18 02467 g005
Table 1. Baseline demographics and characteristics of patients included in this study.
CharacteristicDiscovery, n = 924Validation, n = 159
Age in Years, Median (IQR)9.7 (3.1, 14.8)9.3 (2.2, 14.0)
Female Sex457 (49%)74 (47%)
Primary Cytogenetics
Inv (16)111 (12%)19 (12%)
11q23 Rearrangements188 (21%)35 (22%)
Normal Karyotype217 (24%)40 (25%)
t(8;21)129 (14%)19 (12%)
Other259 (29%)46 (29%)
Race
White680 (79%)114 (72%)
Black or African American100 (12%)26 (16%)
Other81 (9.4%)18 (11%)
Risk Group
High Risk126 (14%)46 (29%)
Low Risk341 (37%)49 (31%)
Standard Risk443 (49%)64 (40%)
IQR, interquartile range; Inv (16), inversion in chromosome 16; t(8;21), translocation between chromosomes 8 and 21. Values are presented as numbers (percentages) unless otherwise noted.
Table 2. Association of DNA methylation of selected genes with OS and EFS in the discovery cohort and validation cohort.
OS Discovery (n = 924)EFS Discovery (n = 924)MRD Discovery (n = 924)
Probe IDCpG_RegionGeneHRLower 95% CIUpper 95% CIp-Value 1HRLower 95% CIUpper 95% CIp-Value 1ORLower 95% CIUpper 95% CIp-Value 1
cg09632163IntronABCA31.231.1621.3031.30 × 10−121.1431.0961.1913.63 × 10−101.2471.0991.4150.001
cg10111352IntronABCC11.2861.1841.3972.42 × 10−91.21.1211.2851.70 × 10−71.5411.2361.921.2 × 10−4
cg09421562IntronMPO1.2181.1481.2927.68 × 10−111.1481.0961.2048.37 × 10−91.321.1551.5094.6 × 10−5
cg21932452IntronNOS31.2091.1281.2956.33 × 10−81.121.0561.1861.00 × 10−41.211.0171.440.032
cg00501774PromoterPTGS11.2371.1231.3631.69 × 10−51.1381.0521.2311.30 × 10−31.4691.1361.9010.003
cg11341610PromoterCALR1.1721.1051.2441.61 × 10−71.1651.1081.2242.24 × 10−91.2481.121.3910.000
cg15150970PromoterDNMT3A1.2481.151.3551.18 × 10−71.1811.1061.2626.84 × 10−71.4461.1641.7950.001
cg26373351IntronETV61.5231.3441.7264.32 × 10−111.331.2051.4691.60 × 10−81.941.3952.6970.000
cg01819568IntronKIT1.2181.1411.32.92 × 10−91.1471.0891.213.14 × 10−71.2331.0681.4230.004
cg19337279ExonMPL1.2591.1521.3763.85 × 10−71.1861.111.2674.43 × 10−71.4561.1421.8550.002
cg14120703IntronNOTCH11.2181.151.2912.17 × 10−111.1591.1041.2162.41 × 10−91.4031.2171.6180.000
cg24247086PromoterPRPF81.1561.0851.2317.59 × 10−61.0571.0081.1082.20 × 10−21.3871.1981.6050.000
cg14641757IntronRUNX11.2881.1681.4213.79 × 10−71.1541.0711.2442.00 × 10−41.3391.0621.6880.013
cg17475857IntronDNMT3B1.4341.2831.6032.19 × 10−101.3011.1871.4261.84 × 10−81.5911.212.0920.001
cg22052056PromoterDNMT3B0.8310.7750.8912.04 × 10−70.8760.8260.9287.16 × 10−60.7650.6630.8840.000
cg12356743PromoterGATA21.2941.1651.4371.51 × 10−61.1951.0831.324.00 × 10−41.3551.121.640.002
cg25884442IntronVWF1.2961.1791.4257.84 × 10−81.1781.0941.2671.22 × 10−51.6991.2512.3080.001
cg08114812ExonCTPS11.2551.1321.3931.75 × 10−51.1931.09181.3049.52 × 10−51.4161.1681.7180.0004
cg22681784IntronSPINK20.8690.820.9223.05 × 10−60.880.83980.9231.19 × 10−70.7780.670.9030.001
cg05751343IntronZBTB471.2151.1171.3220.00000571.1741.0991.2541.94 × 10−61.3011.061.5980.012
cg04141008PromoterCREBBP1.2411.1271.3670.0000121.1341.04941.2261.2261.421.1331.780.002
cg08114812ExonCTPS11.2551.1321.3931.75 × 10−51.1931.09181.3049.52 × 10−51.4161.1681.7180.0004
cg27608981IntronCUX11.1561.0871.233.80 × 10−61.0791.0281.1331.1331.2041.0461.3860.01
OS Validation (n = 159)EFS Validation (n = 159)MRD Validation (n = 159)
Probe IDCpG_RegionGeneHRLower 95% CIUpper 95% CIp-ValueHRLower 95% CIUpper 95% CIp-ValueORLower 95% CIUpper 95% CIp-Value
cg09632163IntronABCA31.1341.0611.2170.00031.2231.0521.4230.00891.2321.0661.4380.0060
cg10111352IntronABCC11.0910.9661.2320.16001.7431.3362.2744.22 × 10−51.0430.7671.4180.7860
cg09421562IntronMPO1.231.1331.3379.53 × 10−71.3861.1731.6360.00011.1030.9291.3120.2650
cg21932452IntronNOS31.0090.9111.1160.86201.2791.0381.5760.02081.0190.81.2980.8800
cg00501774PromoterPTGS11.4331.2441.6550.00001.5111.1222.0350.00662.1661.4793.290.0001
cg11341610PromoterCALR1.1551.0581.2620.00131.2771.1271.4470.00011.2131.021.4540.0320
cg15150970PromoterDNMT3A1.2211.0861.3750.00091.5891.2212.0670.00061.4031.0521.8990.0240
cg26373351IntronETV61.4641.2391.7391.05 × 10−51.9421.3182.8620.00081.30.8661.9780.2110
cg01819568IntronKIT1.050.9621.1470.27401.3051.0941.5580.00311.090.9061.3150.3620
cg19337279ExonMPL1.2351.1071.3860.00021.6791.1962.3570.00281.4151.1111.8760.0090
cg14120703IntronNOTCH11.2571.1511.3743.69 × 10−71.3891.1741.6440.00011.4541.1551.8610.0020
cg24247086PromoterPRPF81.2871.1761.4137.13 × 10−81.4041.1731.6810.00021.4741.231.7950.0001
cg14641757IntronRUNX11.321.161.5093.36 × 10−51.6411.1842.2740.00291.3111.0041.760.0570
cg17475857IntronDNMT3B1.5951.3581.8811.91 × 10−81.451.0691.9690.01711.6481.1482.4270.0090
cg22052056PromoterDNMT3B0.7710.6960.8534.78 × 10−70.7820.6630.9230.00370.6140.4790.7740.0001
cg12356743PromoterGATA21.2521.0421.5050.02001.3341.0631.6730.01281.6221.12.6140.0250
cg25884442IntronVWF1.31.1461.4790.00012.131.4023.2370.00041.4451.0432.0530.0320
cg08114812ExonCTPS11.3551.1421.6180.0011.3621.1021.1020.00431.6371.0872.7740.035
cg22681784IntronSPINK20.850.7830.927.3376 × 10−50.8070.6790.9590.0150.7360.6050.8840.001
cg05751343IntronZBTB471.2431.1111.3960.00021.5211.1581.9990.00261.2590.981.6460.079
cg04141008PromoterCREBBP1.4231.2431.6364.4499 × 10−71.2940.9981.6780.05151.1340.8731.4880.352
cg08114812ExonCTPS11.3551.1421.6180.0011.3621.1021.1020.00431.6371.0872.7740.035
cg27608981IntronCUX11.0941.0051.190.0381.2731.0721.5110.00581.1240.9411.3490.199
OS, Overall Survival; EFS, Event-Free Survival; HR, Hazard Ratio; CI, Confidence Interval. 1 Bonferroni-corrected alpha level α = 2.1777 × 10⁻⁵ for discovery.
Table 3. Association of gene expression of candidate genes with OS, EFS and MRD in discovery and validation cohorts in pediatric AML patients.
OS Discovery (n = 745)EFS Discovery (n = 745)MRD1 Discovery (n = 658)
GeneHRLower 95% CIUpper 95% CIp-ValueHRLower 95% CIUpper 95% CIp-ValueORLower 95% CIUpper 95% CIp-Value
ABCA31.6251.3062.0221.32 × 10−51.4221.1781.7160.00021.1161.1161.5480.515
ABCC10.8890.7611.0380.1350.9170.8091.040.1781.6641.6642.0877.3 × 10−6
MPO0.8660.830.9044.61 × 10−110.8960.8640.9292.41 × 10−90.9050.9050.9660.003
CALR0.7380.6190.8790.00070.7730.6710.890.00040.7570.7570.960.022
ETV60.7790.6390.9490.0130.8860.7531.0430.1471.2941.2941.7040.063
KIT0.8790.8070.9580.0030.9110.8490.9780.0091.1351.1351.280.038
MPL0.8290.7550.918.76 × 10−50.860.7980.9267.23 × 10−51.0241.0241.1510.692
NOTCH11.1540.9831.3540.081.1521.0111.3140.0341.3051.3051.6170.014
PRPF80.8950.6941.1530.390.7820.6370.960.0190.7630.7631.0530.01
RUNX10.7790.6630.9150.0020.9030.791.0310.1320.930.931.1540.509
DNMT3B1.3111.1681.4724.19 × 10−61.1931.0851.310.00021.8431.8432.191.6 × 10−12
CUX10.5640.4320.7362.44 × 10−50.6730.5390.8390.00040.960.961.3890.826
VWF1.0990.9961.2140.0611.0871.0031.1780.0421.3551.3551.5581.8 × 10−5
SPINK21.1291.0711.197.08 × 10−61.1271.081.1775.55 × 10−81.2731.2731.3731.6 × 10−10
OS Validation (n = 132)EFS Validation (n = 132)MRD Validation (n = 126)
GeneHRLower 95% CIUpper 95% CIp-ValueHRLower 95% CIUpper 95% CIp-ValueORLower 95% CIUpper 95% CIp-Value
ABCA30.880.5751.340.5460.8270.5781.1820.2981.1190.7011.7950.638
ABCC11.971.1873.2830.0091.8381.2042.8080.0053.6741.9477.4960.0001
MPO0.840.7320.9660.0140.8460.7490.9550.0071.0150.8131.2710.898
CALR0.690.4810.9850.0410.6910.5130.930.0150.870.5521.3590.54
ETV60.670.3811.1810.1660.7930.4971.2650.330.6450.3331.2150.18
KIT1.110.8441.4650.4491.1890.9371.5090.1551.6341.1462.430.01
MPL0.970.611.5520.9090.8550.5631.2990.4640.7790.5341.120.183
NOTCH11.270.6832.3470.4541.4120.82.4920.2341.8320.9243.8030.091
PRPF80.620.2851.3580.2330.970.4552.0690.9380.6560.2061.9410.449
RUNX10.960.7051.3140.8080.9630.7391.2540.7770.8210.5981.1170.212
DNMT3B2.281.5693.3051.51 × 10−52.0431.492.8019.13 × 10−63.3772.0615.8925 × 10−6
CUX10.750.3481.6010.4530.7550.3981.4310.3893.2921.12710.440.035
VWF1.481.1511.8920.0021.3121.0551.6310.0141.2620.8991.790.182
SPINK21.311.0911.570.0041.3521.1521.5870.00021.6311.3152.0682 × 10−5
Disclaimer/Publisher’s Note: The statements, opinions and data contained in all publications are solely those of the individual author(s) and contributor(s) and not of MDPI and/or the editor(s). MDPI and/or the editor(s) disclaim responsibility for any injury to people or property resulting from any ideas, methods, instructions or products referred to in the content.