


Population-Level Resources and Costs Associated with Low-Risk Prostate Cancer Patients on Active Surveillance
 , ,
, ,
Simple Summary
Abstract
1. Introduction
2. Materials and Methods
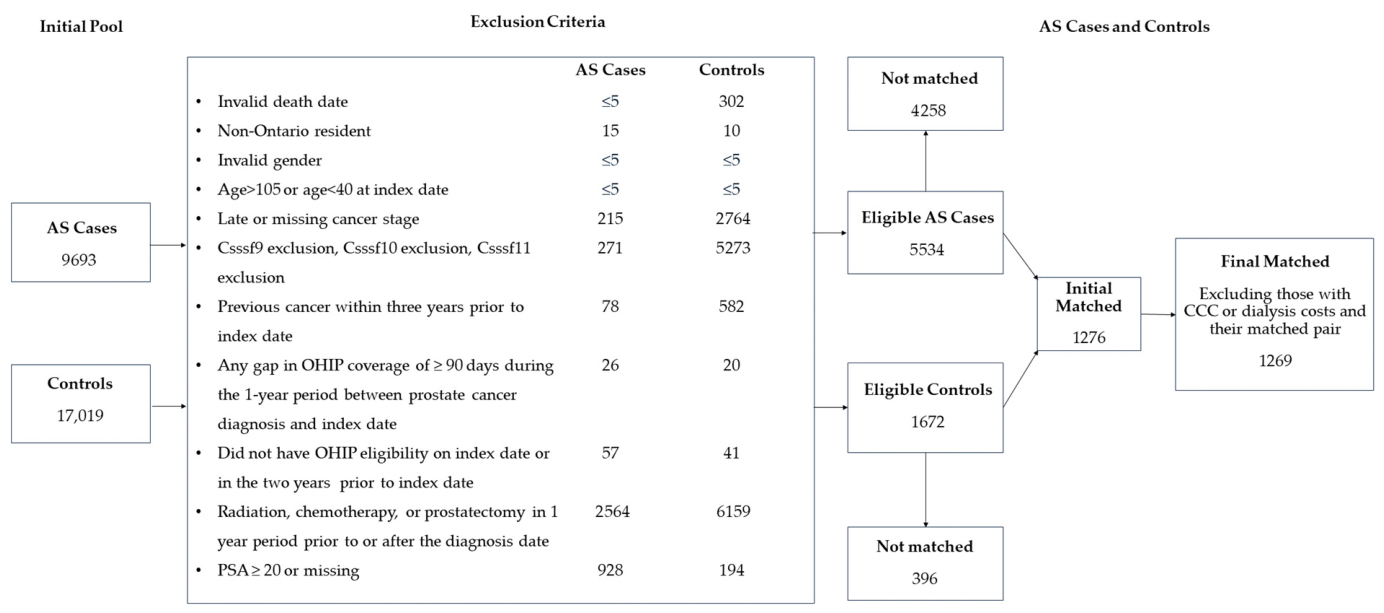
2.1. Study Design
2.2. Data Sources
2.3. Costing and Statistical Analyses
3. Results
3.1. Baseline Characteristics
3.2. Healthcare Resource Utilization and Costs
4. Discussion
5. Conclusions
Author Contributions
Funding
Institutional Review Board Statement
Informed Consent Statement
Data Availability Statement
Acknowledgments
Conflicts of Interest
Abbreviations
| HCRU | Healthcare Resource Utilization |
| PCa | Prostate Cancer |
| AS | Active Surveillance |
| PSA | Prostate-Specific Antigen |
| DRE | Digital Rectal Exam |
| GG | Grade Group |
| GS | Gleason Score |
| TRUS | Transrectal Ultrasound |
| CCO | Cancer Care Ontario |
| CAD | Canadian Dollars |
| PPY | Per Patient-Year |
| OHIP | Ontario Health Insurance Plan |
| OCR | Ontario Cancer Registry |
| CCI | Charlson Comorbidity Index |
| LHIN | Local Health Integration Network |
| CIHI | Canadian Institute for Health Information |
| ICES | Institute for Clinical Evaluative Sciences |
| SD | Standard Deviation |
| IQR | Interquartile Range |
| GP | General Practitioner |
| HRQOL | Health-Related Quality of Life |
| MRI | Magnetic Resonance Imaging |
| CTC | Circulating Tumour Cell |
| RP | Radical Prostatectomy |
| EBRT | External Beam Radiotherapy |
| WW | Watchful Waiting |
Appendix A

| Discharge Abstract Database (DAD) |
| The DAD is compiled by the Canadian Institute for Health Information and contains administrative, clinical (diagnoses and procedures/interventions), demographic, and administrative information for all admissions to acute care hospitals, rehab, chronic, and day surgery institutions in Ontario. At ICES, consecutive DAD records are linked together to form ‘episodes of care’ among the hospitals to which patients have been transferred after their initial admission. |
| National Ambulatory Care Reporting System (NACRS) |
| The NACRS is compiled by the Canadian Institute for Health Information and contains administrative, clinical (diagnoses and procedures), demographic, and administrative information for all patient visits made to hospital- and community-based ambulatory care centres (emergency departments, day surgery units, haemodialysis units, and cancer care clinics). At ICES, NACRS records are linked with other data sources (DAD, OMHRS) to identify transitions to other care settings, such as inpatient acute care or psychiatric care. |
| Ontario Health Insurance Plan Claims Database (OHIP) |
| The OHIP claims database contains information on inpatient and outpatient services provided to Ontario residents eligible for the province’s publicly funded health insurance system by fee-for-service healthcare practitioners (primarily physicians) and “shadow billings” for those paid through non-fee-for-service payment plans. The main data elements include patient and physician identifiers (encrypted), code for service provided, date of service, associated diagnosis, and fee paid. |
| Registered Persons Database (RPDB) files |
| The RPDB provides basic demographic information (age, sex, location of residence, date of birth, and date of death for deceased individuals) for those issued an Ontario health insurance number. The RPDB also indicates the time periods for which an individual was eligible to receive publicly funded health insurance benefits and the best-known postal code for each registrant on July 1st of each year. |
| Same Day Surgery Database (SDS) |
| The SDS is compiled by the Canadian Institute for Health Information and contains administrative, clinical (diagnoses and procedures), demographic, and administrative information for all patient visits made to day surgery institutions in Ontario. The main data elements include patient demographics, clinical data (diagnoses, procedures, physician), administrative data (institution/hospital number, etc.), financial data, service-specific data elements for day surgery and emergency departments. |
| Ontario Cancer Registry (OCR) |
| The OCR is collected by Cancer Care Ontario and contains information on all Ontario residents who have been newly diagnosed with cancer (“incidence”) or who have died of cancer (“mortality”). All new cases of cancer are registered, except non-melanoma skin cancer. |
| Ontario Drug Benefit Claims (ODB) |
| The ODB database contains prescription medication claims for those covered under the provincial drug program, mainly: those aged 65 years and older, nursing home residents, patients receiving services under the Ontario Home Care program, those receiving social assistance, and residents eligible for specialized drug programs. Main data elements include drug identifier, quantity, number of days supplied, date dispensed, cost, and patient, pharmacy, and physician identifiers. |
| National Rehabilitation Reporting System (NRS) |
| The NRS is compiled by the Canadian Institute for Health Information and contains client data collected from participating adult inpatient rehabilitation facilities and programs across Canada. Main data elements contain socio-demographic information, administrative data (e.g., referral, admission, and discharge), health characteristics, activities, and participation (e.g., ADL, communication, social interaction), and interventions. (Note—only available up to MAR 2022) |
| Postal Code Conversion File (PCCF) |
| The PCCF database will link to postal codes within a given cohort and determine other census geographic identifiers, such as dissemination/enumeration area, census division, longitude/latitude, urban/rural flag, and neighbourhood income quintile. |
| Home Care Database (HCD) |
| The Home Care Database is maintained by Health Shared Services Ontario and is a clinical, client-centred database that captures all home care services provided or coordinated by Local Health Integration Networks. This dataset contains information on client, intake, assessment, admission, diagnostic and surgical procedures, and service delivery. |
| New Drug Funding Program (NDFP) |
| The NDFP database is collected by Cancer Care Ontario and captures the use of new, often expensive, cancer drugs. The program was created in 1995 to ensure that Ontario patients have equal access to high-quality intravenous (IV) cancer drugs. The data includes a list of drugs, frequency by drug name, patient, and treatment data, including size (height, weight) and dosage. |
| Activity Level Reporting (ALR) |
| The ALR database is collected by Cancer Care Ontario and represents the basic set of data elements required to produce the quality, cost, and performance indicators for the cancer system. The data elements constitute patient-level activity within the cancer system focused on radiation and systemic therapy services and outpatient oncology clinic visits. This data is also a key component of the Ontario Cancer Registry (OCR), which registers every malignant neoplasm diagnosed in Ontario. |
| Healthcare Resource Utilization | AS Cases Who Used Resource | Non-AS Cases Who Used Resource | Mean HCRU Use (SD) | Median HCRU Use (IQR) | ||||
|---|---|---|---|---|---|---|---|---|
| AS Cases | Non-AS Cases | p-Value | AS Cases | Non-AS Cases | p-Value | |||
| Inpatient hospitalizations | 540 (42.6%) | 537 (42.3%) | 0.3 (0.3) | 0.4 (0.5) | 0.01 * | 0.2 (0.2–0.3) | 0.2 (0.2–0.5) | 0.08 |
| Cancer clinic visits | 286 (22.5%) | 313 (24.7%) | 4.6 (5.4) | 4.2 (4.3) | 0.25 | 3.9 (1.0–6.5) | 3.5 (1.2–6.0) | 0.15 |
| Outpatient clinic visits | 1146 (90.3%) | 1167 (92.0%) | 2.3 (2.1) | 2.7 (2.8) | 0.0005 * | 2.0 (0.8–3.0) | 2.0 (1.0–3.3) | 0.02 * |
| Homecare visits | 316 (24.9%) | 323 (25.5%) | 15.4 (113.0) | 16.0 (58.0) | 0.92 | 1.2 (0.5–3.2) | 1.5 (0.7–5.7) | 0.04 * |
| All physician visits | 1260 (99.3%) | 1265 (99.7%) | 15.0 (11.9) | 16.7 (14.0) | 0.0009 * | 11.8 (8.0–18.1) | 13.2 (9.0–19.8) | <0.0001 * |
| GP visits | 1210 (95.4%) | 1233 (97.2%) | 4.0 (5.7) | 4.3 (5.3) | 0.19 | 2.4 (1.2–4.8) | 2.7 (1.3–5.5) | 0.008 * |
| All specialist visits | 1253 (98.7%) | 1262 (99.5%) | 9.4 (8.3) | 10.4 (9.0) | 0.008 * | 7.3 (4.8–11.0) | 7.9 (5.2–12.7) | 0.0009 * |
| Healthcare Resource Utilization | AS Cases Who Used Resource | Non-AS Cases Who Used Resource | Mean HCRU Use (SD) | Median HCRU Use (IQR) | ||||
|---|---|---|---|---|---|---|---|---|
| AS Cases | Non-AS Cases | p-Value | AS Cases | Non-AS Cases | p-Value | |||
| Inpatient hospitalizations | 190 (15.0%) | 169 (13.3%) | 1.2 (0.5) | 1.3 (0.7) | 0.19 | 1.0 (1.0–1.0) | 1.0 (1.0–1.0) | 0.64 |
| Cancer clinic visits | 119 (9.4%) | 129 (10.2%) | 18.1 (17.4) | 16.3 (14.3) | 0.38 | 11.0 (2.0–39.0) | 16.0 (2.0–23.0) | 0.90 |
| Outpatient clinic visits | 879 (69.3%) | 934 (73.6%) | 3.7 (3.1) | 4.1 (3.4) | 0.01 * | 3.0 (2.0–5.0) | 3.0 (2.0–5.0) | 0.01 * |
| Homecare visits | 94 (7.4%) | 105 (8.3%) | 37.8 (199.3) | 28.1 (85.2) | 0.65 | 5.0 (3.0–11.0) | 6.0 (3.0–15.0) | 0.11 |
| All physician visits | 1250 (98.5%) | 1258 (99.1%) | 15.8 (14.2) | 17.3 (14.9) | 0.01 * | 12.0 (7.0–20.0) | 13.3 (8.0–21.0) | 0.0007 * |
| GP visits | 960 (75.7%) | 1022 (80.5%) | 5.1 (6.6) | 5.0 (5.8) | 0.79 | 3.0 (2.0–6.0) | 3.0 (2.0–6.0) | 0.84 |
| All specialist visits | 1218 (96.0%) | 1246 (98.2%) | 10.6 (10.6) | 11.3 (10.7) | 0.10 | 7.0 (4.0–14.0) | 8.0 (4.0–15.0) | 0.03 * |
| Resource | Mean Cost per Person-Year (SD) | Median Cost per Person-Year (IQR) | ||||
|---|---|---|---|---|---|---|
| AS Cases | Non-AS Cases | p-Value | AS Cases | Non-AS Cases | p-Value | |
| Overall costs | $7400 ($14,000) | $8500 ($14,700) | 0.06 | $4400 ($2300–$8300) | $4800 ($2500–$9500) | 0.008 * |
| Inpatient hospitalizations | $3600 ($8500) | $4200 ($12,700) | 0.31 | $1600 ($1400–$3300) | $1800 ($1400–$3700) | 0.18 |
| Cancer clinic visits | $2800 ($3700) | $3000 ($5800) | 0.62 | $2200 ($5700–$3800) | $1700 ($600–$3200) | 0.20 |
| Outpatient clinic visits | $1000 ($900) | $1100 ($1200) | 0.0003 * | $800 ($400–$1200) | $800 ($400–$1400) | 0.008 * |
| Homecare visits | $1900 ($17,800) | $1300 ($3100) | 0.57 | $300 ($200–$600) | $300 ($200–$900) | 0.02 * |
| All physician visits | $1700 ($1800) | $1900 ($1900) | 0.02 * | $1200 ($800–$2100) | $1400 ($800–$2300) | 0.003 * |
| GP visits | $200 ($500) | $200 ($400) | 0.87 | $100 ($0–$300) | $100 ($0–$300) | 0.03 * |
| All specialist visits | $1400 ($1500) | $1600 ($1600) | 0.07 | $1000 ($600–$1800) | $1200 ($600–$1900) | 0.01 * |
| Resource | Mean Cost per Person-Year (SD) | Median Cost per Person-Year (IQR) | ||||
|---|---|---|---|---|---|---|
| AS Cases | Non-AS Cases | p-Value | AS Cases | Non-AS Cases | p-Value | |
| Overall costs | $8100 ($16,300) | $8500 ($15,100) | 0.51 | $3100 ($1700–$8400) | $3700 ($1800–$9400) | 0.008 * |
| Inpatient hospitalizations | $11,100 ($18,000) | $12,800 ($21,100) | 0.41 | $8700 ($8300–$9900) | $8500 ($8100–$11,900) | 0.98 |
| Cancer clinic visits | $12,900 ($14,200) | $10,600 ($12,400) | 0.18 | $5800 ($1300–$23,500) | $7500 ($1600–$11,700) | 0.61 |
| Outpatient clinic visits | $1500 ($1300) | $1700 ($1400) | 0.04 * | $1200 ($800–$2000) | $1200 ($800–$2200) | 0.62 |
| Homecare visits | $5600 ($32,300) | $2600 ($3800) | 0.35 | $1300 ($1100–$2200) | $1400 ($1100–$2300) | 0.70 |
| All physician visits | $2000 ($2500) | $2100 ($2400) | 0.54 | $1100 ($500–$2500) | $1300 ($600–$2700) | 0.04 * |
| GP visits | $300 ($600) | $300 ($400) | 0.19 | $200 ($100–$400) | $200 ($100–$400) | 0.90 |
| All specialist visits | $1800 ($2300) | $1800 ($2200) | 0.91 | $900 ($400–$2100) | $1000 ($400–$2400) | 0.25 |
References
- Canadian Cancer Society/Société Canadienne du Cancer. PCa Statistics. Available online: https://cancer.ca/en/cancer-information/cancer-types/prostate/statistics (accessed on 8 July 2024).
- Mohler, J.; Bahnson, R.R.; Boston, B.; Busby, J.E.; D’Amico, A.; Eastham, J.A.; Enke, C.A.; George, D.; Horwitz, E.M.; Huben, R.P.; et al. NCCN Clinical Practice Guidelines in Oncology: Prostate Cancer, Version 2.2023. J. Natl. Compr. Canc. Netw. 2023, 21, 457–469. [Google Scholar] [CrossRef]
- Eastham, J.A.; Auffenberg, G.B.; Barocas, D.A.; Chou, R.; Crispino, T.; Davis, J.W.; Eggener, S.; Horwitz, E.M.; Kane, C.J.; Kirkby, E.; et al. Clinically localized prostate cancer: AUA/ASTRO guideline. J. Urol. 2022, 208, 10–18. [Google Scholar] [CrossRef]
- Han, C.S.; Parihar, J.S.; Kim, I.Y. Active surveillance in men with low-risk prostate cancer: Current and future challenges. Am. J. Clin. Exp. Urol. 2013, 1, 72–82. [Google Scholar]
- Cancer Care Ontario. Prostate Cancer Surveillance: A Guide for Primary Care Providers. Available online: https://www.cancercareontario.ca/sites/ccocancercare/files/assets/CCOProstateSurveillanceGuide.PDF (accessed on 9 July 2024).
- Lange, J.M.; Laviana, A.A.; Penson, D.F.; Lin, D.W.; Bill-Axelson, A.; Carlsson, S.V.; Newcomb, L.F.; Trock, B.J.; Carter, H.B.; Carroll, P.R.; et al. Prostate cancer mortality and metastasis under different biopsy frequencies in North American active surveillance cohorts. Cancer 2019, 126, 583–592. [Google Scholar] [CrossRef]
- Timilshina, N.; Alibhai, S.M.; Tomlinson, G.; Sander, B.; Cheung, D.C.; Finelli, A. Long-term outcomes following active surveillance of low-grade PCa: A population-based study using a landmark approach. J. Urol. 2023, 209, 540–548. [Google Scholar] [CrossRef]
- Klotz, L.; Vesprini, D.; Sethukavalan, P.; Jethava, V.; Zhang, L.; Jain, S.; Yamamoto, T.; Mamedov, A.; Loblaw, A. Long-term follow-up of a large active surveillance cohort of patients with PCa. J. Clin. Oncol. 2015, 33, 272–277. [Google Scholar] [CrossRef] [PubMed]
- Dragomir, A.; Cury, F.L.; Aprikian, A.G. Active surveillance for low-risk prostate cancer compared with immediate treatment: A Canadian cost comparison. CMAJ Open 2014, 2, E60–E68. [Google Scholar] [CrossRef] [PubMed]
- Kuwornu, P.; Wodchis, W.; Calzavara, A. A Methodological Guide on Using the GETCOST Macro for Costing Studies; ICES Central: Toronto, ON, Canada, 2017. [Google Scholar]
- Seung, S.J.; Saherawala, H.; Syed, I.; Shephard, C.; Clouthier, D.L.; Chen, E. Real-world treatment patterns and survival outcomes for treated biliary tract cancer patients using administrative databases in Ontario. J. Gastrointest. Oncol. 2023, 14, 1806–1816. [Google Scholar] [CrossRef]
- Wodchis, W.; Bushmeneva, K.; Nikitovic, M.; McKillop, I. Guidelines on Person-Level Costing Using Administrative Databases in Ontario; Health System Performance Research Network: Toronto, ON, Canada, 2013; Available online: https://hspn.ca/wp-content/uploads/2025/01/Report-Guidelines-on-Personal-Level-Costing-One-Page-Brief-1.pdf (accessed on 10 June 2024).
- Hurry, M.; Hassan, S.; Seung, S.J.; Walton, R.; Elnoursi, A.; McGee, J. Real-world treatment patterns, survival, and costs for ovarian cancer in Canada: A retrospective cohort study using provincial administrative data. J. Health Econ. Outcomes Res. 2021, 8, 114–121. [Google Scholar] [CrossRef]
- Magnani, C.J.; Bievre, N.; Baker, L.C.; Brooks, J.D.; Blayney, D.W.; Hernandez-Boussard, T. Real-world evidence to estimate prostate cancer costs for first-line treatment or active surveillance. Eur. Urol. Open Sci. 2021, 23, 20–29. [Google Scholar] [CrossRef]
- Sharma, V.; Wymer, K.M.; Borah, B.J.; Barocas, D.A.; Thompson, R.H.; Karnes, R.J.; Boorjian, S.A. Cost-effectiveness of active surveillance, radical prostatectomy and external beam radiotherapy for localized PCa: An analysis of the PROTECT trial. J. Urol. 2019, 202, 964–972. [Google Scholar] [CrossRef]
- Choosing Wisely Canada. Low-Risk PCa. Available online: https://choosingwiselycanada.org/pamphlet/low-risk-prostate-cancer/ (accessed on 9 July 2024).
- Cancer Care Ontario. Active Surveillance for the Management of Localized PCa. Available online: https://www.cancercareontario.ca/en/guidelines-advice/types-of-cancer/2286 (accessed on 5 July 2024).
- Canadian Cancer Society. Active Surveillance for PCa. Available online: https://cancer.ca/en/cancer-information/cancer-types/prostate/treatment/active-surveillance (accessed on 10 July 2024).
- Nguyen, T.; Lightfoot, C.; May, D.; Greenberg, J.; Krane, L. Patient reported outcomes and treatment-associated complications as a consideration in selecting localized prostate cancer management. Res. Rep. Urol. 2025, 17, 195–210. [Google Scholar] [CrossRef]
- McIntosh, M.; Opozda, M.J.; O’Callaghan, M.; Vincent, A.D.; Galvão, D.A.; Short, C.E. Why do men with PCa discontinue active surveillance for definitive treatment? A mixed methods investigation. Psychooncology 2022, 31, 1420–1430. [Google Scholar] [CrossRef]
- Thompson, D.; Bensley, J.G.; Tempo, J.; Ehdaie, B.; Carlsson, S.; Eastham, J.; Bolton, D.; Perera, M.; Papa, N. Long-term health-related quality of life in patients on active surveillance for prostate cancer: A systematic review. Eur. Urol. Oncol. 2023, 6, 4–15. [Google Scholar] [CrossRef]
- Kato, T.; Sugimoto, M. Quality of life in active surveillance for early prostate cancer. Int. J. Urol. 2020, 27, 296–306. [Google Scholar] [CrossRef]
- MyHealth Alberta. Active Surveillance for Prostate Cancer. Available online: https://myhealth.alberta.ca/Health/pages/conditions.aspx?hwid=abo8743 (accessed on 18 March 2024).
- Loeb, S.; Zhou, Q.; Siebert, U.; Rochau, U.; Jahn, B.; Mühlberger, N.; Carter, H.B.; Lepor, H.; Braithwaite, R.S. Active surveillance versus watchful waiting for localized prostate cancer: A model to inform decisions. Eur. Urol. 2017, 72, 899–907. [Google Scholar] [CrossRef] [PubMed]
- Bill-Axelson, A.; Holmberg, L.; Garmo, H.; Rider, J.R.; Taari, K.; Busch, C.; Nordling, S.; Häggman, M.; Andersson, S.O.; Spångberg, A.; et al. Radical Prostatectomy or Watchful Waiting in Early Prostate Cancer. N. Engl. J. Med. 2014, 370, 932–942. [Google Scholar] [CrossRef] [PubMed]
- Moore, C.M.; King, L.E.; Withington, J.; Amin, M.B.; Andrews, M.; Briers, E.; Chen, R.C.; Chinegwundoh, F.I.; Cooperberg, M.R.; Crowe, J.; et al. Best current practice and research priorities in active surveillance for prostate cancer—A report of a Movember international consensus meeting. Eur. Urol. Oncol. 2023, 6, 160–182. [Google Scholar] [CrossRef]
- Homewood, D.; Lucas, H.; Kennedy, C.; Majer, J.; Sathianathen, N.; Corcoran, N.M. When less is more: Updates in active surveillance and watchful waiting in the management of prostate cancer. Aust. J. Gen. Pract. 2024, 53, 253–257. [Google Scholar] [CrossRef] [PubMed]
- Collette, L.; Burzykowski, T.; Schröder, F.H. Prostate-specific antigen (PSA) alone is not an appropriate surrogate marker of long-term therapeutic benefit in prostate cancer trials. Eur. J. Cancer 2006, 42, 1344–1350. [Google Scholar] [CrossRef]
- Gaudreau, P.-O.; Stagg, J.; Soulières, D.; Saad, F. The present and future of biomarkers in prostate cancer: Proteomics, genomics, and immunology advancements. Biomark. Cancer 2016, 8, 15–25. [Google Scholar] [CrossRef] [PubMed]
- Mittmann, N.; Earle, C.C.; Cheng, S.Y.; Julian, J.A.; Rahman, F.; Seung, S.J.; Levine, M.N. Population-based study to determine the health system costs of using the 21-gene assay. J. Natl. Cancer Inst. 2015, 107, djv224. [Google Scholar] [CrossRef]
| Characteristic | AS Cases N = 1269 | Non-AS Cases N = 1269 | Standard Deviation | p-Value |
|---|---|---|---|---|
| Age at Index Date | ||||
| Mean ± SD | 65.58 ± 8.09 | 66.32 (7.81) | 0.09 | 0.02 |
| Median (IQR) | 66 (60–71) | 67 (61–71) | 0.10 | 0.01 |
| Rurality | ||||
| No (Urban) | 1119 (88.2%) | 1120 (88.3%) | 0.00 | 0.95 |
| Yes | 150 (11.8%) | 149 (11.7%) | 0.00 | |
| Income Quintile (N (%)) | ||||
| 1 (lowest) | 195 (15.4%) | 189 (14.9%) | 0.01 | 0.94 |
| 2 | 220 (17.3%) | 229 (18.0%) | 0.02 | |
| 3 | 243 (19.1%) | 237 (18.7%) | 0.01 | |
| 4 | 254 (20.0%) | 267 (21.0%) | 0.03 | |
| 5 (highest) | 357 (28.1%) | 347 (27.3%) | 0.02 | |
| Charlson Index | ||||
| Mean ± SD | 0.96 ± 1.20 | 0.96 ± 1.20 | 0.03 | 0.66 |
| Median (IQR) | 0 (0–2) | 0 (0–2) | 0.01 | 0.85 |
| Charlson Index (Categorical) (N (%)) | ||||
| 0 | 334 (26.3%) | 338 (26.6%) | 0.01 | 0.75 |
| 1 | 51 (4.0%) | 39 (3.1%) | 0.05 | |
| 2 | 184 (14.5%) | 189 (14.9%) | 0.01 | |
| 3+ | 47 (3.7%) | 52 (4.1%) | 0.02 | |
| No prior hospitalization—n (%) | 653 (51.5%) | 651 (51.3%) | 0.00 | |
| Collaborative Staging (N (%)) | ||||
| Stage I | 894 (70.4%) | 846 (66.7%) | 0.08 | 0.04 |
| Stage II | 375 (29.6%) | 423 (33.3%) | 0.08 | |
| PSA | ||||
| Mean ± SD | 6.78 ± 3.08 | 7.08 ± 3.13 | 0.10 | 0.02 |
| Median (IQR) | 6 (5–8) | 7 (5–9) | 0.12 | 0.00 |
| PSA (categorical) (N (%)) | ||||
| <10 | 1093 (86.1%) | 1079 (85.0%) | 0.03 | 0.43 |
| 10–20 | 176 (13.9%) | 190 (15.0%) | 0.03 | |
| Healthcare Resource | AS Cases Who Used Resource | Non-AS Cases Who Used Resource | Mean HCRU Use (SD) | Median HCRU Use (IQR) | ||||
|---|---|---|---|---|---|---|---|---|
| AS Cases | Non-AS Cases | p-Value | AS Cases | Non-AS Cases | p-Value | |||
| Inpatient hospitalizations | 100 (7.8%) | 70 (5.5%) | 1.3 (0.6) | 1.2 (0.5) | 0.71 | 1.0 (1.0–1.0) | 1.0 (1.0–1.0) | 0.78 |
| Cancer clinic visits | 95 (7.5%) | 188 (14.8%) | 1.7 (3.7) | 26.7 (16.6) | <0.0001 * | 1.0 (1.0–1.0) | 39.0 (4.0–39.0) | <0.0001 * |
| Outpatient clinic visits | 947 (74.6%) | 1032 (81.3%) | 3.6 (2.7) | 4.9 (4.1) | <0.0001 * | 3.0 (2.0–5.0) | 3.0 (2.0–6.0) | <0.0001 * |
| Homecare visits | 57 (4.5%) | 62 (4.9%) | 23.6 (42.9) | 17.7 (40.9) | 0.44 | 9.0 (3.0–25.0) | 5.0 (2.0–10.0) | 0.03 * |
| All physician visits | 1267 (99.8%) | 1268 (99.9%) | 16.3 (13.2) | 17.5 (13.0) | 0.02 * | 13.0 (8.0–20.0) | 14.0 (9.0–22.0) | 0.001 * |
| General Practitioner visits | 1020 (80.4%) | 1025 (80.8%) | 5.0 (5.4) | 5.0 (5.4) | 0.91 | 3.0 (2.0–6.0) | 3.0 (2.0–6.0) | 0.65 |
| All specialist visits | 1264 (99.6%) | 1267 (99.8%) | 10.7 (10.2) | 11.6 (9.5) | 0.02 | 8.0 (5.0–13.0) | 9.0 (6.0–15.0) | 0.0005 * |
| Resource | Mean Cost per Person-Year (SD) | Median Cost per Person-Year (IQR) | ||||
|---|---|---|---|---|---|---|
| AS Cases | Non-AS Cases | p-Value | AS Cases | Non-AS Cases | p-Value | |
| Overall costs | $6100 ($12,400) | $10,400 ($17,800) | <0.0001 * | $3500 ($2100–$5700) | $3700 ($2100–$7200) | 0.0001 * |
| Inpatient hospitalizations | $13,900 ($20,300 | $16,100 ($28,900) | 0.56 | $7600 ($4600–$16,500) | $9900 ($5800–$15,700) | 0.16 |
| Cancer clinic visits | $500 ($600) | $26,300 ($18,100) | <0.0001 * | $400 ($300–$500) | $30,600 ($2100–$45,100) | <0.0001 * |
| Outpatient clinic visits | $1600 ($1200) | $2100 ($1900) | <0.0001 * | $1300 ($900–$2100) | $1400 ($800–$2500) | 0.03 * |
| Homecare visits | $2900 ($3200) | $2100 ($2400) | 0.14 | $1600 ($1100–$3200) | $1300 ($900–$2000) | 0.03 * |
| All physician visits | $1900 ($2400) | $2000 ($2200) | 0.14 | $1200 ($700–$2200) | $1300 ($700–$2600) | 0.01 * |
| GP visits | $300 ($500) | $300 ($900) | 0.89 | $200 ($0–$400) | $200 ($100–$400) | 0.54 |
| All specialist visits | $1500 ($2100) | $1700 ($1800) | 0.15 | $1000 ($500–$1900) | $1100 ($500–$2300) | 0.01 * |
Disclaimer/Publisher’s Note: The statements, opinions and data contained in all publications are solely those of the individual author(s) and contributor(s) and not of MDPI and/or the editor(s). MDPI and/or the editor(s) disclaim responsibility for any injury to people or property resulting from any ideas, methods, instructions or products referred to in the content. |
© 2026 by the authors. Licensee MDPI, Basel, Switzerland. This article is an open access article distributed under the terms and conditions of the Creative Commons Attribution (CC BY) license.
Share and Cite
Seung, S.J.; Bayani, J.; Nguyen, L.; Liu, N.; Gatley, J.; Wong, A.; Richard, E.; Barker, S.L.; Lee, A.Y.-W.; Bartlett, J.M.S.; et al. Population-Level Resources and Costs Associated with Low-Risk Prostate Cancer Patients on Active Surveillance. Cancers 2026, 18, 1580. https://doi.org/10.3390/cancers18101580
Seung SJ, Bayani J, Nguyen L, Liu N, Gatley J, Wong A, Richard E, Barker SL, Lee AY-W, Bartlett JMS, et al. Population-Level Resources and Costs Associated with Low-Risk Prostate Cancer Patients on Active Surveillance. Cancers. 2026; 18(10):1580. https://doi.org/10.3390/cancers18101580
Chicago/Turabian StyleSeung, Soo Jin, Jane Bayani, Lena Nguyen, Ning Liu, Jodi Gatley, Anisia Wong, Emilie Richard, Sarah L. Barker, Anna Ying-Wah Lee, John M. S. Bartlett, and et al. 2026. "Population-Level Resources and Costs Associated with Low-Risk Prostate Cancer Patients on Active Surveillance" Cancers 18, no. 10: 1580. https://doi.org/10.3390/cancers18101580
APA StyleSeung, S. J., Bayani, J., Nguyen, L., Liu, N., Gatley, J., Wong, A., Richard, E., Barker, S. L., Lee, A. Y.-W., Bartlett, J. M. S., Berman, D., Loblaw, A., Earle, C. C., & Mittmann, N. (2026). Population-Level Resources and Costs Associated with Low-Risk Prostate Cancer Patients on Active Surveillance. Cancers, 18(10), 1580. https://doi.org/10.3390/cancers18101580

