
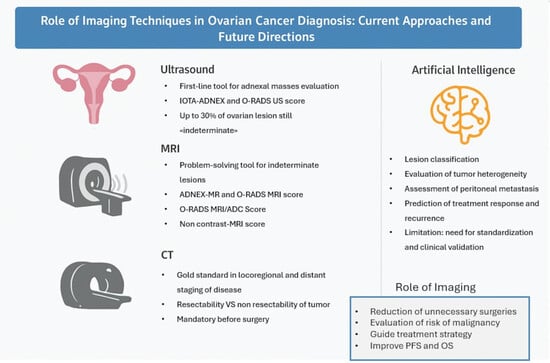
Role of Imaging Techniques in Ovarian Cancer Diagnosis: Current Approaches and Future Directions


Simple Summary
Abstract
1. Introduction
2. Imaging in Ovarian Carcinoma
2.1. Ultrasonographic Imaging
2.1.1. IOTA ADNEX Model
2.1.2. O-RADS US
- O-RADS 0: technically inadequate/not applicable
- O-RADS 1: physiological findings; no ovarian lesions
- O-RADS 2: lesions almost certainly benign (<1% risk of malignancy)
- O-RADS 3: lesions with low risk of malignancy (1–10%)
- O-RADS 4: lesions with intermediate risk of malignancy (10–50%)
- O-RADS 5: lesions with high risk of malignancy (>50%)
2.2. CT Imaging
2.3. MRI
2.3.1. ADNEX-MR Scoring System
- Absence of ovarian lesions
- Benign lesions: lesions with homogeneous content (serous, blood, fat) and the absence of wall enhancement and/or with hypointense solid tissue signal in T2 sequences and at high b values
- Probably benign lesions: absence of solid tissue or solid tissue with type 1 enhancement curve
- Indeterminate lesions: presence of solid tissue with type 2 curve
- Likely malignant lesions: type 3 enhancement curve and presence of peritoneal implants
2.3.2. O-RADS MRI Score
- Type 1 (low risk): slower increase in signal intensity (enhancement) of solid tissue than that of the myometrium, without a peak or plateau
- Type 2 (intermediate risk): moderate initial increase in solid tissue signal with a slower or equal slope to that of the myometrial, followed by a plateau
- Type 3 (high risk): pronounced signal increase with an early peak compared with that of myometrium
- Unilocular cystic lesions with homogeneous fluid content, without wall enhancement and without solid tissue
- Unilocular cysts with uncomplicated fluid or endometrioid content, with mild wall enhancement but without intracystic solid portions (e.g., endometrioma)
- Adipose-content lesions without intralesional solid tissue; in this case, the adipose tissue shows hyperintense signal in T2- and T1-weighted sequences, with signal drop in fat-sat sequences. It is necessary to distinguish Rokitansky nodule, which may show enhancement, from solid tissue (e.g., mature teratoma).
- Solid lesions with homogeneously hypointense signal both in T2w and DWI sequences at high b-values, regardless of the type of enhancement after mdc (e.g., ovarian fibroma)
- Fallopian tubes dilated by simple fluid, with mild and subtle wall enhancement in the absence of solid tissue
- Para-ovarian cysts at any type of fluid content, which may or may not show wall enhancement, without intralesional solid tissue.
- Unilocular cysts (proteinaceous/hemorrhagic/mucinous fluid content) with wall enhancement but without solid tissue
- Multilocular cysts at any type of fluid content, with thin septa that may show enhancement and absence of solid tissue
- Lesions with solid tissue (excluding solid lesions described in score 2) that show low-risk enhancement curve (type1).
- Fallopian tubes with non-simple fluid content, thickened walls, no solid tissue.
- Lesions with solid tissue (excluding solid lesions described in score 2) showing type 2 enhancement curve (intermediate risk; Figure 5)
- Solid lesions showing enhancement < myometrial at 30–40 s, if perfusion study is not available
- Lesions with lipid components and solid tissue with enhancement
- Lesions showing a type 3 enhancement curve (high risk)
- Solid lesions showing enhancement > myometrium at 30–40 s, if perfusion study is not available
- Lesions associated with the presence of peritoneal implants and/or secondary disease localization (Figure 6)
- Type 1 (low risk): delayed and slower enhancement of the solid component relative to the myometrium, without a peak or plateau
- Type 2 (intermediate risk): moderate early enhancement of solid tissue with a slower or equal slope to that of the myometrial, followed by a plateau
- Type 3 (high risk): pronounced signal increase with an early peak occurring before the myometrial peak
2.4. 18F-FDG PET/CT
3. New Perspectives and AI in Ovarian Cancer
3.1. O-RADS MRI/ADC Score
3.2. NON- CONTRAST- MRI Score
3.3. PET-MRI
3.4. Artificial Intelligence (AI)
- Classification of lesions: although histopathological examination after biopsy remains the gold standard for distinguishing benign from malignant lesions, several studies suggest that deep learning (DL) algorithms—a subcategory of machine learning (ML)—have the potential to classify ovarian lesions with accuracy levels comparable to those achieved by radiologists. However, many of these reports provide limited methodological detail, often omitting the specific DL or ML architectures employed and lacking systematic comparisons between different models. These limitations impede the identification of the most effective techniques and reduce the generalizability of the available evidence, thereby limiting both scientific rigor and clinical applicability. Li et al. [59] reported a radiomics model capable of differentiating malignant and benign ovarian lesions in CT images of approximately 143 patients. Good diagnostic accuracy has also been found in radiomics applied to MRI, as described by Saida et al. [60] and Wang et al. [56]. A recent multicenter study assessed Meta’s Segment Anything Model (SAM) and a DenseNet-121 deep learning (DL) model for the classification of 621 ovarian lesions in 532 MRI-examined patients. The study assessed the accuracy of automatic SAM segmentation compared with manual segmentation and the diagnostic performance of the DL model and radiologists (using O-RADS MRI and histopathology as reference). No significant differences emerged between manual and SAM-based segmentation (AUC 0.83 vs. 0.79), nor between DL and radiologists’ classifications (AUC 0.79 vs. 0.84–0.86, p > 0.05). SAM segmentation reduced processing time by approximately 4 min per case without compromising diagnostic accuracy [61]. Although a direct comparison between machine learning (ML) and deep learning (DL) models would be highly desirable, the current literature is characterized by heterogeneous datasets, non-uniform outcome measures, and variable validation strategies, which preclude meaningful head-to-head comparisons. Addressing this limitation should be a priority for future multicenter and benchmarking studies.In the field of ultrasonography recent studies have demonstrated levels of diagnostic accuracy by DL algorithms comparable to O-RADS-US and experienced sonographers [62,63]. However, a recent meta-analysis on performance of radiomics in ultrasound describes how the comparison with the reference IOTA-ADNEX model has not been sufficiently investigated. Moreover, the number of studies present in the literature is few, lacks external validation, and includes small sample sizes [64].
- 2.
- Prediction of genetic alterations: as already well known, in patients diagnosed with ovarian cancer it is critical to establish whether the BRCA-1 and BRCA-2 genes are mutated, since BRCA-mutated tumors are associated with increased chemosensitivity to platinum-based drugs resulting in increased PFS. [65] Despite Meier et al. found no significant correlation between radiomic features and BRCA mutational status [66], other authors were able to predict Ki-67 status by analyzing radiomic features derived from PET-CT images [67].
- 3.
- Prediction of disease spread at diagnosis: AI can automate the process of image segmentation, i.e., the isolation and analysis of suspicious areas in medical images. This segmentation allows radiologists to focus more accurately and quickly on potentially pathological areas. Indeed, although CE-CT is the gold standard for staging ovarian cancer, it has accuracy limitations in identifying small peritoneal implants (<1 cm) and localizations in specific areas such as the small bowel and mesentery. In addition, lesions are often “unmeasurable” according to RECIST 1.1 criteria [68]. Several studies describe how AI can predict the presence of peritoneal carcinosis and lymph node metastasis in HGSOCs on both CT and MR imaging by integrating radiomics with both clinical and laboratory factors such as age and CA-125 blood-levels [69,70,71].
- 4.
- Prediction of treatment response: the prediction of treatment response according to radiomics models deeply traces the analysis of the previously described intrinsic heterogeneity of the tumor and various microenvironments. It is evident that different “subclones” of tumor tissue exhibit varied responses to different drugs in relation to their histological and molecular features. Indeed, it has been shown that while the number of disease localizations at diagnosis correlates significantly with treatment response, there is no correlation between disease volume and therapy response [72]. Conversely, when combined with clinical and laboratory data, radiomic biomarkers have been found to accurately predict response to neoadjuvant chemotherapy (NACT) [72,73]. Similarly, some studies based on ML and DL algorithms seem to be able to predict the probability of platinum-resistance of high-grade serous carcinoma [54,74]. Consequently, even in post-NACT imaging re-evaluations, any residual tumor and/or new disease localization can be accurately characterized by describing the microarchitecture and estimating the “subclone” of origin. The same applies to patients who are candidates for immunotherapy, in whom reduced intratumoral heterogeneity seems to be associated with better response [75].
- 5.
- Prediction of Risk of Recurrence: Several studies have focused on estimating progression-free survival (PFS) and overall survival (OS) in order to identify patients at higher risk of recurrence [76]. Some investigations have demonstrated a significant relationship between radiomic features in CT imaging and OS, specifically showing that lower tumor heterogeneity is associated with improved OS [66,77]. Similarly, other studies have examined the relationship between CT radiomic features of ovarian masses [78,79] and peritoneal implants [77] with PFS, which has also been found to correlate with tissue heterogeneity. Rizzo et al. [78] demonstrated that three radiomic variables—specifically, the gray level run length matrix (GLRLM), 3D morphological features, and the gray level co-occurrence matrix (GLCM)—are significantly associated with disease progression at 12 months. According to Zagari et al., among the variables considered in their study that significantly correlated with PFS, shape and density appeared to have the strongest correlation [80]. Furthermore, high tumor tissue heterogeneity has been associated with an increased risk of incomplete surgical resection (R≠0) in non-BRCA-mutated patients [66]. Conversely, Vargas et al. reported that lower heterogeneity values were associated with greater surgical resectability [77] and, consequently, with higher OS and PFS values [5]. The integration of PET radiomic features with CT features, together with clinical variables, have been shown to further improve prognostic accuracy compared to models based solely on CT imaging [81].Even in the context of MRI, a nomogram based on radiomic features derived from MRI images, combined with clinical variables, has shown a good ability to identify patients at risk of disease recurrence [82].
- 6.
- Integration with Other Data Sources: AI can combine information from different diagnostic modalities (e.g., imaging, clinical history and laboratory results) to provide a more comprehensive and precise overview of the patient’s condition. As previously mentioned, most of the studies cited have incorporated alongside imaging features clinical variables such as age, FIGO stage, serum CA-125 levels, and the presence of residual tumor. The integration of such data into ML and DL algorithms is essential for obtaining more accurate information and achieving higher levels of diagnostic precision (Figure 8).
4. Conclusions
Author Contributions
Funding
Data Availability Statement
Conflicts of Interest
Abbreviations
| OC | Ovarian cancer |
| US | Ultrasound |
| CT | Computed Tomography |
| CE-CT | Contrast-enhanced CT |
| MRI | Magnetic Resonance Imaging |
| ROI | Region of Interest |
| PPV | Positive Predictive Value |
| NPV | Negative Predictive Value |
| PET | Positron Emission Tomography |
| AI | Artificial Intelligence |
| ML | Machine Learning |
| DL | Deep Learning |
| PFS | Progression-Free Survival |
| OS | Overall Survival |
References
- Tavares, V.; Marques, I.S.; Melo, I.G.D.; Assis, J.; Pereira, D.; Medeiros, R. Paradigm Shift: A Comprehensive Review of Ovarian Cancer Management in an Era of Advancements. Int. J. Mol. Sci. 2024, 25, 1845. [Google Scholar] [CrossRef] [PubMed]
- Zhu, B.; Gu, H.; Mao, Z.; Beeraka, N.M.; Zhao, X.; Anand, M.P.; Zheng, Y.; Zhao, R.; Li, S.; Manogaran, P.; et al. Global burden of gynaecological cancers in 2022 and projections to 2050. J. Glob. Health 2024, 14, 04155. [Google Scholar] [CrossRef]
- Armstrong, D.K.; Alvarez, R.D.; Bakkum-Gamez, J.N.; Barroilhet, L.; Behbakht, K.; Berchuck, A.; Berek, J.S.; Chen, L.; Cristea, M.; DeRosa, M.; et al. NCCN Guidelines Insights: Ovarian Cancer, Version 1.2019. J. Natl. Compr. Canc. Netw. 2019, 17, 896–909. [Google Scholar] [CrossRef]
- González-Martín, A.; Harter, P.; Leary, A.; Lorusso, D.; Miller, R.E.; Pothuri, B.; Ray-Coquard, I.; Tan, D.S.P.; Bellet, E.; Oaknin, A.; et al. Newly diagnosed and relapsed epithelial ovarian cancer: ESMO Clinical Practice Guideline for diagnosis, treatment and follow-up. Ann. Oncol. 2023, 34, 833–848. [Google Scholar] [CrossRef] [PubMed]
- Fagotti, A.; Ferrandina, M.G.; Vizzielli, G.; Pasciuto, T.; Fanfani, F.; Gallotta, V.; Margariti, P.A.; Chiantera, V.; Costantini, B.; Gueli Alletti, S.; et al. Randomized trial of primary debulking surgery versus neoadjuvant chemotherapy for advanced epithelial ovarian cancer (SCORPION-NCT01461850). Int. J. Gynecol. Cancer 2020, 30, 1657–1664. [Google Scholar] [CrossRef]
- Burton, E.; Chase, D.; Yamamoto, M.; De Guzman, J.; Imagawa, D.; Berman, M.L. Surgical management of recurrent ovarian cancer: The advantage of collaborative surgical management and a multidisciplinary approach. Gynecol. Oncol. 2011, 120, 29–32. [Google Scholar] [CrossRef] [PubMed]
- Andreotti, R.F.; Timmerman, D.; Strachowski, L.M.; Froyman, W.; Benacerraf, B.R.; Bennett, G.L.; Bourne, T.; Brown, D.L.; Coleman, B.G.; Frates, M.C.; et al. O-RADS US Risk Stratification and Management System: A Consensus Guideline from the ACR Ovarian-Adnexal Reporting and Data System Committee. Radiology 2020, 294, 168–185. [Google Scholar] [CrossRef]
- Timmerman, D.; Van Calster, B.; Testa, A.; Savelli, L.; Fischerova, D.; Froyman, W.; Wynants, L.; Van Holsbeke, C.; Epstein, E.; Franchi, D.; et al. Predicting the risk of malignancy in adnexal masses based on the Simple Rules from the International Ovarian Tumor Analysis group. Am. J. Obstet. Gynecol. 2016, 214, 424–437. [Google Scholar] [CrossRef]
- Cherukuri, S.; Jajoo, S.; Dewani, D. The International Ovarian Tumor Analysis-Assessment of Different Neoplasias in the Adnexa (IOTA-ADNEX) Model Assessment for Risk of Ovarian Malignancy in Adnexal Masses. Cureus 2022, 14, e31194. [Google Scholar] [CrossRef]
- Hiett, A.K.; Sonek, J.D.; Guy, M.; Reid, T.J. Performance of IOTA Simple Rules, Simple Rules risk assessment, ADNEX model and O-RADS in differentiating between benign and malignant adnexal lesions in North American women. Ultrasound Obstet. Gynecol. 2022, 59, 668–676. [Google Scholar] [CrossRef]
- Andreotti, R.F.; Timmerman, D.; Benacerraf, B.R.; Bennett, G.L.; Bourne, T.; Brown, D.L.; Coleman, B.G.; Frates, M.C.; Froyman, W.; Goldstein, S.R.; et al. Ovarian-Adnexal Reporting Lexicon for Ultrasound: A White Paper of the ACR Ovarian-Adnexal Reporting and Data System Committee. J. Am. Coll. Radiol. 2018, 15, 1415–1429. [Google Scholar] [CrossRef]
- Roseland, M.E.; Maturen, K.E.; Shampain, K.L.; Wasnik, A.P.; Stein, E.B. Adnexal Mass Imaging: Contemporary Guidelines for Clinical Practice. Radiol. Clin. N. Am. 2023, 61, 671–685. [Google Scholar] [CrossRef]
- Zhang, Q.; Dai, X.; Li, W. Systematic Review and Meta-Analysis of O-RADS Ultrasound and O-RADS MRI for Risk Assessment of Ovarian and Adnexal Lesions. Am. J. Roentgenol. 2023, 221, 21–33. [Google Scholar] [CrossRef]
- Cao, L.; Wei, M.; Liu, Y.; Fu, J.; Zhang, H.; Huang, J.; Pei, X.; Zhou, J. Validation of American College of Radiology Ovarian-Adnexal Reporting and Data System Ultrasound (O-RADS US): Analysis on 1054 adnexal masses. Gynecol. Oncol. 2021, 162, 107–112. [Google Scholar] [CrossRef] [PubMed]
- Guo, Y.; Phillips, C.H.; Suarez-Weiss, K.; Roller, L.A.; Frates, M.C.; Benson, C.B.; Shinagare, A.B. Interreader Agreement and Intermodality Concordance of O-RADS US and MRI for Assessing Large, Complex Ovarian-Adnexal Cysts. Radiol. Imaging Cancer 2022, 4, e220064. [Google Scholar] [CrossRef]
- Hack, K.; Gandhi, N.; Bouchard-Fortier, G.; Chawla, T.P.; Ferguson, S.E.; Li, S.; Kahn, D.; Tyrrell, P.N.; Glanc, P. External Validation of O-RADS US Risk Stratification and Management System. Radiology 2022, 304, 114–120. [Google Scholar] [CrossRef] [PubMed]
- Strachowski, L.M.; Jha, P.; Phillips, C.H.; Blanchette Porter, M.M.; Froyman, W.; Glanc, P.; Guo, Y.; Patel, M.D.; Reinhold, C.; Suh-Burgmann, E.J.; et al. O-RADS US v2022: An Update from the American College of Radiology’s Ovarian-Adnexal Reporting and Data System US Committee. Radiology 2023, 308, e230685. [Google Scholar] [CrossRef]
- Chiu, S.; Tsitsiou, Y.; Da Silva, A.; Qin, C.; Fotopoulou, C.; Rockall, A. CT and MRI in Advanced Ovarian Cancer: Advances in Imaging Techniques. Korean J. Radiol. 2025, 26, 841. [Google Scholar] [CrossRef] [PubMed]
- Rizzo, S.; Avesani, G.; Panico, C.; Manganaro, L.; Gui, B.; Lakhman, Y.; Andrieu, P.C.; Bharwani, N.; Rockall, A.; Thomassin-Naggara, I.; et al. Ovarian cancer staging and follow-up: Updated guidelines from the European Society of Urogenital Radiology female pelvic imaging working group. Eur. Radiol. 2025, 35, 4029–4039. [Google Scholar] [CrossRef]
- Jónsdóttir, B.; Lomnytska, M.; Poromaa, I.S.; Silins, I.; Stålberg, K. The Peritoneal Cancer Index is a Strong Predictor of Incomplete Cytoreductive Surgery in Ovarian Cancer. Ann. Surg. Oncol. 2021, 28, 244–251. [Google Scholar] [CrossRef]
- Avesani, G.; Arshad, M.; Lu, H.; Fotopoulou, C.; Cannone, F.; Melotti, R.; Aboagye, E.; Rockall, A. Radiological assessment of Peritoneal Cancer Index on preoperative CT in ovarian cancer is related to surgical outcome and survival. Radiol. Med. 2020, 125, 770–776. [Google Scholar] [CrossRef] [PubMed]
- Shinagare, A.B.; Sadowski, E.A.; Park, H.; Brook, O.R.; Forstner, R.; Wallace, S.K.; Horowitz, J.M.; Horowitz, N.; Javitt, M.; Jha, P.; et al. Ovarian cancer reporting lexicon for computed tomography (CT) and magnetic resonance (MR) imaging developed by the SAR Uterine and Ovarian Cancer Disease-Focused Panel and the ESUR Female Pelvic Imaging Working Group. Eur. Radiol. 2022, 32, 3220–3235. [Google Scholar] [CrossRef] [PubMed]
- Avesani, G.; Panico, C.; Nougaret, S.; Woitek, R.; Gui, B.; Sala, E. ESR Essentials: Characterisation and staging of adnexal masses with MRI and CT—Practice recommendations by ESUR. Eur. Radiol. 2024, 34, 7673–7689. [Google Scholar] [CrossRef] [PubMed]
- Fischerova, D.; Pinto, P.; Burgetova, A.; Masek, M.; Slama, J.; Kocian, R.; Frühauf, F.; Zikan, M.; Dusek, L.; Dundr, P.; et al. Preoperative staging of ovarian cancer: Comparison between ultrasound, CT and whole-body diffusion-weighted MRI (ISAAC study). Ultrasound Obstet. Gynecol. 2022, 59, 248–262. [Google Scholar] [CrossRef]
- Thomassin-Naggara, I.; Poncelet, E.; Jalaguier-Coudray, A.; Guerra, A.; Fournier, L.S.; Stojanovic, S.; Millet, I.; Bharwani, N.; Juhan, V.; Cunha, T.M.; et al. Ovarian-Adnexal Reporting Data System Magnetic Resonance Imaging (O-RADS MRI) Score for Risk Stratification of Sonographically Indeterminate Adnexal Masses. JAMA Netw. Open 2020, 3, e1919896. [Google Scholar] [CrossRef]
- Rizzo, S.; Cozzi, A.; Dolciami, M.; Del Grande, F.; Scarano, A.L.; Papadia, A.; Gui, B.; Gandolfo, N.; Catalano, C.; Manganaro, L. O-RADS MRI: A Systematic Review and Meta-Analysis of Diagnostic Performance and Category-wise Malignancy Rates. Radiology 2023, 307, e220795. [Google Scholar] [CrossRef]
- Sadowski, E.A.; Thomassin-Naggara, I.; Rockall, A.; Maturen, K.E.; Forstner, R.; Jha, P.; Nougaret, S.; Siegelman, E.S.; Reinhold, C. O-RADS MRI Risk Stratification System: Guide for Assessing Adnexal Lesions from the ACR O-RADS Committee. Radiology 2022, 303, 35–47. [Google Scholar] [CrossRef]
- Allen, B.C.; Hosseinzadeh, K.; Qasem, S.A.; Varner, A.; Leyendecker, J.R. Practical Approach to MRI of Female Pelvic Masses. Am. J. Roentgenol. 2014, 202, 1366–1375. [Google Scholar] [CrossRef]
- Medeiros, L.R.; Freitas, L.B.; Rosa, D.D.; Silva, F.R.; Silva, L.S.; Birtencourt, L.T.; Edelweiss, M.I.; Rosa, M.I. Accuracy of magnetic resonance imaging in ovarian tumor: A systematic quantitative review. Am. J. Obstet. Gynecol. 2011, 204, 67.e1–67.e10. [Google Scholar] [CrossRef]
- Bazot, M.; Daraï, E.; Nassar-Slaba, J.; Lafont, C.; Thomassin-Naggara, I. Value of Magnetic Resonance Imaging for the Diagnosis of Ovarian Tumors: A Review. J. Comput. Assist. Tomogr. 2008, 32, 712–723. [Google Scholar] [CrossRef]
- Forstner, R.; Thomassin-Naggara, I.; Cunha, T.M.; Kinkel, K.; Masselli, G.; Kubik-Huch, R.; Spencer, J.A.; Rockall, A. ESUR recommendations for MR imaging of the sonographically indeterminate adnexal mass: An update. Eur. Radiol. 2017, 27, 2248–2257. [Google Scholar] [CrossRef] [PubMed]
- Garcia Prado, J.; González Hernando, C.; Varillas Delgado, D.; Saiz Martínez, R.; Bhosale, P.; Blazquez Sanchez, J.; Chiva, L. Diffusion-weighted magnetic resonance imaging in peritoneal carcinomatosis from suspected ovarian cancer: Diagnostic performance in correlation with surgical findings. Eur. J. Radiol. 2019, 121, 108696. [Google Scholar] [CrossRef]
- Engbersen, M.P.; Van’T Sant, I.; Lok, C.; Lambregts, D.M.J.; Sonke, G.S.; Beets-Tan, R.G.H.; Van Driel, W.J.; Lahaye, M.J. MRI with diffusion-weighted imaging to predict feasibility of complete cytoreduction with the peritoneal cancer index (PCI) in advanced stage ovarian cancer patients. Eur. J. Radiol. 2019, 114, 146–151. [Google Scholar] [CrossRef]
- Thomassin-Naggara, I.; Aubert, E.; Rockall, A.; Jalaguier-Coudray, A.; Rouzier, R.; Daraï, E.; Bazot, M. Adnexal Masses: Development and Preliminary Validation of an MR Imaging Scoring System. Radiology 2013, 267, 432–443. [Google Scholar] [CrossRef]
- Timmerman, D.; Valentin, L.; Bourne, T.H.; Collins, W.P.; Verrelst, H.; Vergote, I. Terms, definitions and measurements to describe the sonographic features of adnexal tumors: A consensus opinion from the International Ovarian Tumor Analysis (IOTA) group. Ultrasound Obstet. Gynecol. 2000, 16, 500–505. [Google Scholar] [CrossRef]
- Thomassin-Naggara, I.; Belghitti, M.; Milon, A.; Abdel Wahab, C.; Sadowski, E.; Rockall, A.G.; on behalf of EURAD study group; Thomassin-Naggara, I.; Poncelet, E.; Jalaguier-Coudray, A.; et al. O-RADS MRI score: Analysis of misclassified cases in a prospective multicentric European cohort. Eur. Radiol. 2021, 31, 9588–9599. [Google Scholar] [CrossRef]
- Reinhold, C.; Rockall, A.; Sadowski, E.A.; Siegelman, E.S.; Maturen, K.E.; Vargas, H.A.; Forstner, R.; Glanc, P.; Andreotti, R.F.; Thomassin-Naggara, I. Ovarian-Adnexal Reporting Lexicon for MRI: A White Paper of the ACR Ovarian-Adnexal Reporting and Data Systems MRI Committee. J. Am. Coll. Radiol. 2021, 18, 713–729. [Google Scholar] [CrossRef] [PubMed]
- Thomassin-Naggara, I.; Dabi, Y.; Florin, M.; Saltel-Fulero, A.; Manganaro, L.; Bazot, M.; Razakamanantsoa, L. O-RADS MRI SCORE: An Essential First-Step Tool for the Characterization of Adnexal Masses. J. Magn. Reson. Imaging 2024, 59, 720–736. [Google Scholar] [CrossRef] [PubMed]
- Rieber, A.; Nüssle, K.; Stöhr, I.; Grab, D.; Fenchel, S.; Kreienberg, R.; Reske, S.N.; Brambs, H.-J. Preoperative Diagnosis of Ovarian Tumors with MR Imaging: Comparison with Transvaginal Sonography, Positron Emission Tomography, and Histologic Findings. Am. J. Roentgenol. 2001, 177, 123–129. [Google Scholar] [CrossRef]
- Kosinska, M.; Misiewicz, P.; Kalita, K.; Fijuth, J.; Foks, M.; Kuncman, L.; Gottwald, L. The value of [18F]FDG PET/CT examination in the detection and differentiation of recurrent ovarian cancer. Nucl. Med. Rev. 2023, 26, 98–105. [Google Scholar] [CrossRef]
- Engbersen, M.P.; Van Driel, W.; Lambregts, D.; Lahaye, M. The role of CT, PET-CT, and MRI in ovarian cancer. Br. J. Radiol. 2021, 94, 20210117. [Google Scholar] [CrossRef]
- Khiewvan, B.; Torigian, D.A.; Emamzadehfard, S.; Paydary, K.; Salavati, A.; Houshmand, S.; Werner, T.J.; Alavi, A. An update on the role of PET/CT and PET/MRI in ovarian cancer. Eur. J. Nucl. Med. Mol. Imaging 2017, 44, 1079–1091. [Google Scholar] [CrossRef]
- Ye, S.; Liu, S.; Xiang, L.; Wu, X.; Yang, H. 18F-FDG PET/CT-based metabolic metrics in recurrent tumors of ovarian clear cell carcinoma and their prognostic implications. BMC Cancer 2019, 19, 226. [Google Scholar] [CrossRef] [PubMed]
- Assouline, V.; Dabi, Y.; Jalaguier-Coudray, A.; Stojanovic, S.; Millet, I.; Reinhold, C.; Bazot, M.; Thomassin-Naggara, I.; EURAD study group. How to improve O-RADS MRI score for rating adnexal masses with cystic component? Eur. Radiol. 2022, 32, 5943–5953. [Google Scholar] [CrossRef]
- Hottat, N.A.; Van Pachterbeke, C.; Vanden Houte, K.; Denolin, V.; Jani, J.C.; Cannie, M.M. Magnetic resonance scoring system for assessment of adnexal masses: Added value of diffusion-weighted imaging including apparent diffusion coefficient map. Ultrasound Obstet. Gynecol. 2021, 57, 478–487. [Google Scholar] [CrossRef] [PubMed]
- Manganaro, L.; Ciulla, S.; Celli, V.; Ercolani, G.; Ninkova, R.; Miceli, V.; Cozzi, A.; Rizzo, S.M.; Thomassin-Naggara, I.; Catalano, C. Impact of DWI and ADC values in Ovarian-Adnexal Reporting and Data System (O-RADS) MRI score. Radiol. Med. 2023, 128, 565–577. [Google Scholar] [CrossRef]
- Sahin, H.; Panico, C.; Ursprung, S.; Simeon, V.; Chiodini, P.; Frary, A.; Carmo, B.; Smith, J.; Freeman, S.; Jimenez-Linan, M.; et al. Non-contrast MRI can accurately characterize adnexal masses: A retrospective study. Eur. Radiol. 2021, 31, 6962–6973. [Google Scholar] [CrossRef]
- Tsuyoshi, H.; Tsujikawa, T.; Yamada, S.; Okazawa, H.; Yoshida, Y. Diagnostic value of [18F]FDG PET/MRI for staging in patients with ovarian cancer. EJNMMI Res. 2020, 10, 117. [Google Scholar] [CrossRef] [PubMed]
- Schwenzer, N.F.; Schmidt, H.; Gatidis, S.; Brendle, C.; Müller, M.; Königsrainer, I.; Claussen, C.D.; Pfannenberg, A.C.; Schraml, C. Measurement of apparent diffusion coefficient with simultaneous MR/positron emission tomography in patients with peritoneal carcinomatosis: Comparison with 18F-FDG-PET. J. Magn. Reson. Imaging 2014, 40, 1121–1128. [Google Scholar] [CrossRef]
- Larson, M.; Lovrec, P.; Sadowski, E.A.; Pirasteh, A. PET/MRI in Gynecologic Malignancy. Radiol. Clin. N. Am. 2023, 61, 713–723. [Google Scholar] [CrossRef] [PubMed]
- Panico, C.; Avesani, G.; Zormpas-Petridis, K.; Rundo, L.; Nero, C.; Sala, E. Radiomics and Radiogenomics of Ovarian Cancer. Radiol. Clin. N. Am. 2023, 61, 749–760. [Google Scholar] [CrossRef]
- Wang, Y.; Xie, H.; Chang, X.; Hu, W.; Li, M.; Li, Y.; Liu, H.; Cheng, H.; Wang, S.; Zhou, L.; et al. Single-Cell Dissection of the Multiomic Landscape of High-Grade Serous Ovarian Cancer. Cancer Res. 2022, 82, 3903–3916. [Google Scholar] [CrossRef]
- Nath, A.; Cosgrove, P.A.; Mirsafian, H.; Christie, E.L.; Pflieger, L.; Copeland, B.; Majumdar, S.; Cristea, M.C.; Han, E.S.; Lee, S.J.; et al. Evolution of core archetypal phenotypes in progressive high grade serous ovarian cancer. Nat. Commun. 2021, 12, 3039. [Google Scholar] [CrossRef]
- Veeraraghavan, H.; Vargas, H.; Jimenez-Sanchez, A.; Micco, M.; Mema, E.; Lakhman, Y.; Crispin-Ortuzar, M.; Huang, E.; Levine, D.; Grisham, R.; et al. Integrated Multi-Tumor Radio-Genomic Marker of Outcomes in Patients with High Serous Ovarian Carcinoma. Cancers 2020, 12, 3403. [Google Scholar] [CrossRef]
- Weigelt, B.; Vargas, H.A.; Selenica, P.; Geyer, F.C.; Mazaheri, Y.; Blecua, P.; Conlon, N.; Hoang, L.N.; Jungbluth, A.A.; Snyder, A.; et al. Radiogenomics Analysis of Intratumor Heterogeneity in a Patient With High-Grade Serous Ovarian Cancer. JCO Precis. Oncol. 2019, 3, 1–9. [Google Scholar] [CrossRef] [PubMed]
- Wang, Y.; Lin, W.; Zhuang, X.; Wang, X.; He, Y.; Li, L.; Lyu, G. Advances in artificial intelligence for the diagnosis and treatment of ovarian cancer (Review). Oncol. Rep. 2024, 51, 46. [Google Scholar] [CrossRef] [PubMed]
- Hatamikia, S.; Nougaret, S.; Panico, C.; Avesani, G.; Nero, C.; Boldrini, L.; Sala, E.; Woitek, R. Ovarian cancer beyond imaging: Integration of AI and multiomics biomarkers. Eur. Radiol. Exp. 2023, 7, 50. [Google Scholar] [CrossRef] [PubMed]
- Sala, E.; Mema, E.; Himoto, Y.; Veeraraghavan, H.; Brenton, J.D.; Snyder, A.; Weigelt, B.; Vargas, H.A. Unravelling tumour heterogeneity using next-generation imaging: Radiomics, radiogenomics, and habitat imaging. Clin. Radiol. 2017, 72, 3–10. [Google Scholar] [CrossRef]
- Li, S.; Liu, J.; Xiong, Y.; Pang, P.; Lei, P.; Zou, H.; Zhang, M.; Fan, B.; Luo, P. A radiomics approach for automated diagnosis of ovarian neoplasm malignancy in computed tomography. Sci. Rep. 2021, 11, 8730. [Google Scholar] [CrossRef]
- Saida, T.; Mori, K.; Hoshiai, S.; Sakai, M.; Urushibara, A.; Ishiguro, T.; Minami, M.; Satoh, T.; Nakajima, T. Diagnosing Ovarian Cancer on MRI: A Preliminary Study Comparing Deep Learning and Radiologist Assessments. Cancers 2022, 14, 987. [Google Scholar] [CrossRef]
- Hsu, W.-C.; Wang, Y.; Wu, Y.-F.; Chen, R.; Afyouni, S.; Liu, J.; Vin, S.; Shi, V.; Imami, M.; Chotiyanonta, J.S.; et al. MRI-based Ovarian Lesion Classification via a Foundation Segmentation Model and Multimodal Analysis: A Multicenter Study. Radiology 2025, 316, e243412. [Google Scholar] [CrossRef] [PubMed]
- Gao, Y.; Zeng, S.; Xu, X.; Li, H.; Yao, S.; Song, K.; Li, X.; Chen, L.; Tang, J.; Xing, H.; et al. Deep learning-enabled pelvic ultrasound images for accurate diagnosis of ovarian cancer in China: A retrospective, multicentre, diagnostic study. Lancet Digit. Health 2022, 4, e179–e187. [Google Scholar] [CrossRef]
- Chen, H.; Yang, B.-W.; Qian, L.; Meng, Y.-S.; Bai, X.-H.; Hong, X.-W.; He, X.; Jiang, M.-J.; Yuan, F.; Du, Q.-W.; et al. Deep Learning Prediction of Ovarian Malignancy at US Compared with O-RADS and Expert Assessment. Radiology 2022, 304, 106–113. [Google Scholar] [CrossRef]
- Moro, F.; Ciancia, M.; Sciuto, M.; Baldassari, G.; Tran, H.E.; Carcagnì, A.; Fagotti, A.; Testa, A.C. Performance of radiomics analysis in ultrasound imaging for differentiating benign from malignant adnexal masses: A systematic review and meta-analysis. Acta Obstet. Gynecol. Scand. 2025, 104, 1433–1442. [Google Scholar] [CrossRef]
- Buys, S.S. Effect of Screening on Ovarian Cancer Mortality: The Prostate, Lung, Colorectal and Ovarian (PLCO) Cancer Screening Randomized Controlled Trial. JAMA 2011, 305, 2295. [Google Scholar] [CrossRef]
- Meier, A.; Veeraraghavan, H.; Nougaret, S.; Lakhman, Y.; Sosa, R.; Soslow, R.A.; Sutton, E.J.; Hricak, H.; Sala, E.; Vargas, H.A. Association between CT-texture-derived tumor heterogeneity, outcomes, and BRCA mutation status in patients with high-grade serous ovarian cancer. Abdom. Radiol. 2019, 44, 2040–2047. [Google Scholar] [CrossRef]
- Wang, X.; Xu, C.; Grzegorzek, M.; Sun, H. Habitat radiomics analysis of pet/ct imaging in high-grade serous ovarian cancer: Application to Ki-67 status and progression-free survival. Front. Physiol. 2022, 13, 948767. [Google Scholar] [CrossRef]
- Coakley, F.V.; Choi, P.H.; Gougoutas, C.A.; Pothuri, B.; Venkatraman, E.; Chi, D.; Bergman, A.; Hricak, H. Peritoneal Metastases: Detection with Spiral CT in Patients with Ovarian Cancer. Radiology 2002, 223, 495–499. [Google Scholar] [CrossRef] [PubMed]
- Song, X.-L.; Ren, J.-L.; Yao, T.-Y.; Zhao, D.; Niu, J. Radiomics based on multisequence magnetic resonance imaging for the preoperative prediction of peritoneal metastasis in ovarian cancer. Eur. Radiol. 2021, 31, 8438–8446. [Google Scholar] [CrossRef] [PubMed]
- Yu, X.Y.; Ren, J.; Jia, Y.; Wu, H.; Niu, G.; Liu, A.; Gao, Y.; Hao, F.; Xie, L. Multiparameter MRI Radiomics Model Predicts Preoperative Peritoneal Carcinomatosis in Ovarian Cancer. Front. Oncol. 2021, 11, 765652. [Google Scholar] [CrossRef]
- Ai, Y.; Zhang, J.; Jin, J.; Zhang, J.; Zhu, H.; Jin, X. Preoperative Prediction of Metastasis for Ovarian Cancer Based on Computed Tomography Radiomics Features and Clinical Factors. Front. Oncol. 2021, 11, 610742. [Google Scholar] [CrossRef]
- Crispin-Ortuzar, M.; Woitek, R.; Reinius, M.A.V.; Moore, E.; Beer, L.; Bura, V.; Rundo, L.; McCague, C.; Ursprung, S.; Escudero Sanchez, L.; et al. Integrated radiogenomics models predict response to neoadjuvant chemotherapy in high grade serous ovarian cancer. Nat. Commun. 2023, 14, 6756. [Google Scholar] [CrossRef]
- Rundo, L.; Beer, L.; Escudero Sanchez, L.; Crispin-Ortuzar, M.; Reinius, M.; McCague, C.; Sahin, H.; Bura, V.; Pintican, R.; Zerunian, M.; et al. Clinically Interpretable Radiomics-Based Prediction of Histopathologic Response to Neoadjuvant Chemotherapy in High-Grade Serous Ovarian Carcinoma. Front. Oncol. 2022, 12, 868265. [Google Scholar] [CrossRef]
- Yi, X.; Liu, Y.; Zhou, B.; Xiang, W.; Deng, A.; Fu, Y.; Zhao, Y.; Ouyang, Q.; Liu, Y.; Sun, Z.; et al. Incorporating SULF1 polymorphisms in a pretreatment CT-based radiomic model for predicting platinum resistance in ovarian cancer treatment. Biomed. Pharmacother. 2021, 133, 111013. [Google Scholar] [CrossRef] [PubMed]
- Himoto, Y.; Veeraraghavan, H.; Zheng, J.; Zamarin, D.; Snyder, A.; Capanu, M.; Nougaret, S.; Vargas, H.A.; Shitano, F.; Callahan, M.; et al. Computed Tomography–Derived Radiomic Metrics Can Identify Responders to Immunotherapy in Ovarian Cancer. JCO Precis. Oncol. 2019, 3, 1–13. [Google Scholar] [CrossRef]
- Rizzo, S.; Manganaro, L.; Dolciami, M.; Gasparri, M.L.; Papadia, A.; Del Grande, F. Computed Tomography Based Radiomics as a Predictor of Survival in Ovarian Cancer Patients: A Systematic Review. Cancers 2021, 13, 573. [Google Scholar] [CrossRef]
- Vargas, H.A.; Veeraraghavan, H.; Micco, M.; Nougaret, S.; Lakhman, Y.; Meier, A.A.; Sosa, R.; Soslow, R.A.; Levine, D.A.; Weigelt, B.; et al. A novel representation of inter-site tumour heterogeneity from pre-treatment computed tomography textures classifies ovarian cancers by clinical outcome. Eur. Radiol. 2017, 27, 3991–4001. [Google Scholar] [CrossRef] [PubMed]
- Rizzo, S.; Botta, F.; Raimondi, S.; Origgi, D.; Buscarino, V.; Colarieti, A.; Tomao, F.; Aletti, G.; Zanagnolo, V.; Del Grande, M.; et al. Radiomics of high-grade serous ovarian cancer: Association between quantitative CT features, residual tumour and disease progression within 12 months. Eur. Radiol. 2018, 28, 4849–4859. [Google Scholar] [CrossRef]
- Wei, W.; Liu, Z.; Rong, Y.; Zhou, B.; Bai, Y.; Wei, W.; Wang, S.; Wang, M.; Guo, Y.; Tian, J. A Computed Tomography-Based Radiomic Prognostic Marker of Advanced High-Grade Serous Ovarian Cancer Recurrence: A Multicenter Study. Front. Oncol. 2019, 9, 255. [Google Scholar] [CrossRef] [PubMed]
- Zargari, A.; Du, Y.; Heidari, M.; Thai, T.C.; Gunderson, C.C.; Moore, K.; Mannel, R.S.; Liu, H.; Zheng, B.; Qiu, Y. Prediction of chemotherapy response in ovarian cancer patients using a new clustered quantitative image marker. Phys. Med. Biol. 2018, 63, 155020. [Google Scholar] [CrossRef]
- Wang, X.; Lu, Z. Radiomics Analysis of PET and CT Components of 18F-FDG PET/CT Imaging for Prediction of Progression-Free Survival in Advanced High-Grade Serous Ovarian Cancer. Front. Oncol. 2021, 11, 638124. [Google Scholar] [CrossRef] [PubMed]
- Li, C.; Wang, H.; Chen, Y.; Fang, M.; Zhu, C.; Gao, Y.; Li, J.; Dong, J.; Wu, X. A Nomogram Combining MRI Multisequence Radiomics and Clinical Factors for Predicting Recurrence of High-Grade Serous Ovarian Carcinoma. J. Oncol. 2022, 2022, 1–13. [Google Scholar] [CrossRef] [PubMed]
- Chiu, S.; Mascarenhas, S.; Bharwani, N.; Qin, C.; Fotopoulou, C.; Rockall, A. Advancing personalised care in ovarian cancer using CT and MRI radiomics. Clin. Radiol. 2025, 84, 106833. [Google Scholar] [CrossRef]
- Huang, M.-L.; Ren, J.; Jin, Z.-Y.; Liu, X.-Y.; He, Y.-L.; Li, Y.; Xue, H.-D. A systematic review and meta-analysis of CT and MRI radiomics in ovarian cancer: Methodological issues and clinical utility. Insights Imaging 2023, 14, 117. [Google Scholar] [CrossRef] [PubMed]


| 0 | Incomplete Evaluation [N/A] | N/A |
| 1 | Normal Ovary [N/A] | Follicle defined as a simple cyst ≤ 3 cm; Corpus Luteum ≤ 3 cm |
| 2 | Almost Certainly Benign [<1%] | Simple cyst ≤ 3 cm |
| Simple cyst > 3 cm to 5 cm | ||
| Simple cyst > 5 cm but <10 cm | ||
| Classic Benign Lesions (dermoid, endometrioma, etc…) | ||
| Non-simple unilocular cyst, smooth inner margin ≤ 3 cm | ||
| Non-simple unilocular cyst, smooth inner margin > 3 cm but <10 cm | ||
| 3 | Low Risk Malignancy [1–<10%] | Unilocular cyst ≥ 10 cm (simple or non-simple) |
| Typical dermoid cysts, endometriomas, hemorrhagic cysts ≥ 10 cm | ||
| Unilocular cyst (any size) with irregular inner wall < 3 mm height | ||
| Multilocular cyst < 10 cm, smooth inner wall, CS = 1–3 | ||
| Solid smooth, any size, CS = 1 | ||
| 4 | Intermediate Risk [10–<50%] | Multilocular cyst, no solid component, ≥ 10 cm, smooth inner wall, CS = 1–3 |
| Multilocular cyst, no solid component, any size, smooth inner wall, CS = 4 | ||
| Multilocular cyst, no solid component, any size, irregular inner wall and/or irregular septation, any color score | ||
| Unilocular cyst with solid component, any size, 0–3 papillary projections, CS = any | ||
| Multilocular cyst with solid component, any size, CS = 1–2 | ||
| Solid smooth non- shadowing, any size, CS = 2–3 | ||
| 5 | High Risk [≥50%] | Unilocular cyst, any size, ≥ 4 papillary projections, CS = any |
| Multilocular cyst with solid component, any size, CS = 3–4 | ||
| Solid smooth, any size, CS = 4 | ||
| Solid irregular, any size, CS = any | ||
| Ascites and/or peritoneal nodules |
| ADNEX MR SCORE | Criteria |
|---|---|
| No mass |
| Purely cystic mass Purely endometriotic mass Purely fatty mass Absence of wall enhancement Low b = 1000 s/mm2–weighted and low T2-weighted signal intensity within solid tissue |
| Absence of solid tissue Curve type 1 within solid tissue |
| Curve type 2 within solid tissue |
| Curve type 3 within solid tissue Peritoneal implants |
| Non-Contrast MRI Score | Definition | MRI Features |
|---|---|---|
| Score 1 | No mass | No adnexal mass is demonstrated in pelvic MRI study |
| Score 2 | Benign/likely benign | Radiologically characterized with radiological diagnosis (e.g., endometrioma, dermoid, fibroma) |
| Score 3 | Indeterminate | Not classified in other scores; it may have a solid appearing component without reaching criteria for solid tissue |
| Score 4 | Suspicious for malignancy | Solid tissue criteria reached |
| Score 5 | Highly suspicious for malignancy | Solid tissue criteria reached and presence of
|
| Modality | Main Uses | Strengths | Limitations |
|---|---|---|---|
| Transvaginal Ultrasound (TVUS) | First-line evaluation of adnexal masses. Assessment of morphology and vascularization. | Widely available, non-invasive, no radiation. High-resolution for pelvic organs. | Operator-dependent. Limited for staging and evaluation of peritoneal spread. |
| Computed Tomography (CT) | Staging (especially peritoneal, nodal, and distant metastases). Preoperative planning. | Good overview of abdomen and pelvis. Useful for surgical planning and monitoring recurrence. | Limited soft tissue contrast. Poor detection of small peritoneal implants (<1 cm). |
| Magnetic Resonance Imaging (MRI) | Characterization of indeterminate masses. Local staging. Evaluation of complex cystic lesions. | Excellent soft tissue contrast. No radiation. Functional imaging (DWI) adds value in lesion analysis. | More expensive, time-consuming. Contraindicated in patients with certain implants. |
| FDG-PET/CT | Detection of recurrence, metastases. Useful in equivocal cases. | Functional and anatomical data. High sensitivity in detecting active disease and distant spread. | Limited role in primary diagnosis. False positives in inflammation/endometriosis. Costly. |
| PET/MRI (emerging) | Research setting. Combines metabolic and high-resolution anatomic data. | Potentially best of both PET and MRI. Promising for advanced imaging and radiomic studies. | Limited availability. High cost. Not yet widely implemented in clinical practice. |
Disclaimer/Publisher’s Note: The statements, opinions and data contained in all publications are solely those of the individual author(s) and contributor(s) and not of MDPI and/or the editor(s). MDPI and/or the editor(s) disclaim responsibility for any injury to people or property resulting from any ideas, methods, instructions or products referred to in the content. |
© 2026 by the authors. Licensee MDPI, Basel, Switzerland. This article is an open access article distributed under the terms and conditions of the Creative Commons Attribution (CC BY) license.
Share and Cite
D’Amario, A.; Ambrosini, R.; Gullino, A.; Grazioli, L. Role of Imaging Techniques in Ovarian Cancer Diagnosis: Current Approaches and Future Directions. Cancers 2026, 18, 173. https://doi.org/10.3390/cancers18010173
D’Amario A, Ambrosini R, Gullino A, Grazioli L. Role of Imaging Techniques in Ovarian Cancer Diagnosis: Current Approaches and Future Directions. Cancers. 2026; 18(1):173. https://doi.org/10.3390/cancers18010173
Chicago/Turabian StyleD’Amario, Alessandro, Roberta Ambrosini, Alessandro Gullino, and Luigi Grazioli. 2026. "Role of Imaging Techniques in Ovarian Cancer Diagnosis: Current Approaches and Future Directions" Cancers 18, no. 1: 173. https://doi.org/10.3390/cancers18010173
APA StyleD’Amario, A., Ambrosini, R., Gullino, A., & Grazioli, L. (2026). Role of Imaging Techniques in Ovarian Cancer Diagnosis: Current Approaches and Future Directions. Cancers, 18(1), 173. https://doi.org/10.3390/cancers18010173