Preoperative Computed Tomography-Based Prediction and Patterns of Lymph Node Metastasis in Renal Pelvis and Ureteral Urothelial Carcinomas

 , , , , ,
Simple Summary
Abstract
1. Introduction
2. Materials and Methods
2.1. Patient Selection
2.2. Imaging Acquisition
2.3. Imaging Analysis
2.4. Statistical Analysis
3. Results
3.1. Comparison of Clinical and Imaging Features
3.2. Logistic Regression Analyses
3.3. Model Evaluation Using ROC Curve Analysis for LN Metastasis
3.4. Interobserver Agreement Assessment
3.5. Post Hoc Statistical Power Analysis
3.6. Location of LN Metastasis
3.7. CT Accuracy in LN Metastasis Detection and Local Staging
4. Discussion
5. Conclusions
Author Contributions
Funding
Institutional Review Board Statement
Informed Consent Statement
Data Availability Statement
Conflicts of Interest
References
- Siegel, R.L.; Miller, K.D.; Jemal, A. Cancer statistics, 2019. CA Cancer J. Clin. 2019, 69, 7–34. [Google Scholar] [CrossRef] [PubMed]
- Seisen, T.; Krasnow, R.E.; Bellmunt, J.; Rouprêt, M.; Leow, J.J.; Lipsitz, S.R.; Vetterlein, M.W.; Preston, M.A.; Hanna, N.; Kibel, A.S.; et al. Effectiveness of Adjuvant Chemotherapy After Radical Nephroureterectomy for Locally Advanced and/or Positive Regional Lymph Node Upper Tract Urothelial Carcinoma. J. Clin. Oncol. 2017, 35, 852–860. [Google Scholar] [PubMed]
- Dominguez-Escrig, J.L.; Peyronnet, B.; Seisen, T.; Bruins, H.M.; Yuan, C.Y.; Babjuk, M.; Böhle, A.; Burger, M.; Compérat, E.M.; Gontero, P.; et al. Potential Benefit of Lymph Node Dissection During Radical Nephroureterectomy for Upper Tract Urothelial Carcinoma: A Systematic Review by the European Association of Urology Guidelines Panel on Non-Muscle-Invasive Bladder Cancer. Eur. Urol. Focus 2019, 5, 224–241. [Google Scholar] [PubMed]
- Kondo, T.; Hashimoto, Y.; Kobayashi, H.; Iizuka, J.; Nakazawa, H.; Ito, F.; Tanabe, K. Template-based lymphadenectomy in urothelial carcinoma of the upper urinary tract: Impact on patient survival. Int. J. Urol. 2010, 17, 848–854. [Google Scholar]
- Dłubak, A.; Karwacki, J.; Logoń, K.; Tomecka, P.; Brawańska, K.; Krajewski, W.; Szydełko, T.; Małkiewicz, B. Lymph Node Dissection in Upper Tract Urothelial Carcinoma: Current Status and Future Perspectives. Curr. Oncol. Rep. 2023, 25, 1327–1344. [Google Scholar]
- Lughezzani, G.; Jeldres, C.; Isbarn, H.; Shariat, S.F.; Sun, M.; Pharand, D.; Widmer, H.; Arjane, P.; Graefen, M.; Montorsi, F.; et al. A critical appraisal of the value of lymph node dissection at nephroureterectomy for upper tract urothelial carcinoma. Urology 2010, 75, 118–124. [Google Scholar]
- Peyrottes, A.; Califano, G.; Ouzaïd, I.; Lainé-Caroff, P.; Long Depaquit, T.; Hermieu, J.F.; Xylinas, E. Lymph Node Dissection During Radical Nephro-Ureterectomy for Upper Tract Urothelial Carcinoma: A Review. Front. Surg. 2022, 9, 852969. [Google Scholar]
- Inokuchi, J.; Kuroiwa, K.; Kakehi, Y.; Sugimoto, M.; Tanigawa, T.; Fujimoto, H.; Gotoh, M.; Masumori, N.; Ogawa, O.; Eto, M.; et al. Role of lymph node dissection during radical nephroureterectomy for upper urinary tract urothelial cancer: Multi-institutional large retrospective study JCOG1110A. World J. Urol. 2017, 35, 1737–1744. [Google Scholar]
- Rouprêt, M.; Seisen, T.; Birtle, A.J.; Capoun, O.; Compérat, E.M.; Dominguez-Escrig, J.L.; Gürses Andersson, I.; Liedberg, F.; Mariappan, P.; Hugh Mostafid, A.; et al. European Association of Urology Guidelines on Upper Urinary Tract Urothelial Carcinoma: 2023 Update. Eur. Urol. 2023, 84, 49–64. [Google Scholar]
- Margulis, V.; Youssef, R.F.; Karakiewicz, P.I.; Lotan, Y.; Wood, C.G.; Zigeuner, R.; Kikuchi, E.; Weizer, A.; Raman, J.D.; Remzi, M.; et al. Preoperative multivariable prognostic model for prediction of nonorgan confined urothelial carcinoma of the upper urinary tract. J. Urol. 2010, 184, 453–458. [Google Scholar]
- Favaretto, R.L.; Shariat, S.F.; Chade, D.C.; Godoy, G.; Adamy, A.; Kaag, M.; Bochner, B.H.; Coleman, J.; Dalbagni, G. The effect of tumor location on prognosis in patients treated with radical nephroureterectomy at Memorial Sloan-Kettering Cancer Center. Eur. Urol. 2010, 58, 574–580. [Google Scholar]
- McDonald, S.; Keane, K.G.; Gauci, R.; Hayne, D. Nuclear Medicine and Molecular Imaging in Urothelial Cancer: Current Status and Future Directions. Cancers 2025, 17, 232. [Google Scholar] [CrossRef] [PubMed]
- Chung, P.H.; Krabbe, L.M.; Darwish, O.M.; Westerman, M.E.; Bagrodia, A.; Gayed, B.A.; Haddad, A.Q.; Kapur, P.; Sagalowsky, A.I.; Lotan, Y.; et al. Degree of hydronephrosis predicts adverse pathological features and worse oncologic outcomes in patients with high-grade urothelial carcinoma of the upper urinary tract. Urol. Oncol. 2014, 32, 981–988. [Google Scholar] [PubMed]
- Ye, T.; Yang, X.; Lv, P.; Liu, H.; Ye, Z. Prognostic Value of Preoperative Hydronephrosis in Patients Undergoing Radical Nephroureterectomy for Upper Tract Urinary Carcinoma: A Systematic Review and Meta-Analysis. Front. Oncol. 2020, 10, 600511. [Google Scholar]
- McIntosh, A.G.; Umbreit, E.C.; Wood, C.G.; Matin, S.F.; Karam, J.A. Role of lymph node dissection at the time of open or minimally invasive nephroureterectomy. Transl. Androl. Urol. 2021, 10, 2233–2245. [Google Scholar] [PubMed]
- Kondo, T.; Tanabe, K. The role of lymph node dissection in the management of urothelial carcinoma of the upper urinary tract. Int. J. Clin. Oncol. 2011, 16, 170–178. [Google Scholar]
- Abe, T.; Shinohara, N.; Muranaka, M.; Sazawa, A.; Maruyama, S.; Osawa, T.; Harabayashi, T.; Kubota, K.; Matsuno, Y.; Shibata, T.; et al. Role of lymph node dissection in the treatment of urothelial carcinoma of the upper urinary tract: Multi-institutional relapse analysis and immunohistochemical re-evaluation of negative lymph nodes. Eur. J. Surg. Oncol. 2010, 36, 1085–1091. [Google Scholar]
- Xylinas, E.; Rink, M.; Margulis, V.; Faison, T.; Comploj, E.; Novara, G.; Raman, J.D.; Lotan, Y.; Guillonneau, B.; Weizer, A.; et al. Prediction of true nodal status in patients with pathological lymph node negative upper tract urothelial carcinoma at radical nephroureterectomy. J. Urol. 2013, 189, 468–473. [Google Scholar]
- Cui, Y.; Lu, Y.; Wu, J.; Quan, C. Benefits of lymphadenectomy for upper tract urothelial carcinoma only located in the lower ureter: A bicentre retrospective cohort study. Front. Oncol. 2023, 13, 1115830. [Google Scholar]
- Yanagisawa, T.; Kawada, T.; von Deimling, M.; Laukhtina, E.; Kimura, T.; Shariat, S.F. Need for and extent of lymph node dissection for upper tract urothelial carcinoma: An updated review in 2023. Curr. Opin. Urol. 2023, 33, 258–268. [Google Scholar]
- Djaladat, H. AUA 2024: Lymph Node Dissection for Upper Tract Disease. In AUA 2024 Upper Tract Urothelial Carcinoma, Proceedings of the American Urological Association 2024 Annual Meeting, San Antonio, TX, USA, 3–6 May 2024; American Urological Association: Linthicum, MD, USA, 2024. [Google Scholar]
- Bitaraf, M.; Ghafoori Yazdi, M.; Amini, E. Upper Tract Urothelial Carcinoma (UTUC) Diagnosis and Risk Stratification: A Comprehensive Review. Cancers 2023, 15, 4987. [Google Scholar] [CrossRef]
- Wu, Y.; Dong, Q.; Liu, L.; Han, P.; Wei, Q. The impact of tumor location and multifocality on prognosis for patients with upper tract urothelial carcinoma: A meta-analysis. Sci. Rep. 2014, 4, 6361. [Google Scholar] [CrossRef] [PubMed]
- Su, X.; Tang, Q.; Fang, D.; Xiong, G.; Singla, N.; He, Q.; Zhang, L.; Liu, P.; Fan, Y.; Hao, H.; et al. Comparisons of prognosis between urothelial carcinoma of the upper urinary tract and bladder with pT3-4 cancer. Int. J. Clin. Exp. Med. 2016, 9, 18308–18315. [Google Scholar] [PubMed]
- Lwin, A.A.; Hsu, C.H.; Chipollini, J. Urothelial Carcinoma of the Renal Pelvis and Ureter: Does Location Make a Difference? Clin. Genitourin. Cancer 2020, 18, 45–49.e1. [Google Scholar] [CrossRef]
- Mori, K.; Katayama, S.; Laukhtina, E.; Schuettfort, V.M.; Pradere, B.; Quhal, F.; Sari Motlagh, R.; Mostafaei, H.; Grossmann, N.C.; Rajwa, P.; et al. Discordance Between Clinical and Pathological Staging and Grading in Upper Tract Urothelial Carcinoma. Clin. Genitourin. Cancer 2022, 20, 95.e1–95.e6. [Google Scholar] [CrossRef]
- Ma, R.; Liu, Z.; Cheng, Y.; Zhou, P.; Pan, Y.; Bi, H.; Tao, L.; Yang, B.; Xia, H.; Zhu, X.; et al. Prognostic Value of Tumor Size in Patients with Upper Tract Urothelial Carcinoma: A Systematic Review and Meta-Analysis. Eur. Urol. Open Sci. 2022, 42, 19–29. [Google Scholar]
- Ito, K.; Kuroda, K.; Asakuma, J.; Hamada, S.; Tachi, K.; Tasaki, S.; Sato, A.; Horiguchi, A.; Seguchi, K.; Asano, T. Preoperative risk factors for extraurothelial recurrence in patients with ureteral cancer treated with radical nephroureterectomy. J. Urol. 2014, 191, 1685–1692. [Google Scholar] [CrossRef] [PubMed]
- Joshi, S.S.; Quast, L.L.; Chang, S.S.; Patel, S.G. Effects of tumor size and location on survival in upper tract urothelial carcinoma after nephroureterectomy. Indian J. Urol. 2018, 34, 68–73. [Google Scholar] [CrossRef]
- Venkat, S.; Khan, A.I.; Lewicki, P.J.; Borregales, L.; Scherr, D.S. Novel nomograms to predict muscle invasion and lymph node metastasis in upper tract urothelial carcinoma. Urol. Oncol. 2022, 40, 108.e11–108.e17. [Google Scholar] [CrossRef]
- Witjes, J.A.; Lebret, T.; Compérat, E.M.; Cowan, N.C.; De Santis, M.; Bruins, H.M.; Hernández, V.; Espinós, E.L.; Dunn, J.; Rouanne, M.; et al. Updated 2016 EAU Guidelines on Muscle-Invasive and Metastatic Bladder Cancer. Eur. Urol. 2017, 71, 462–475. [Google Scholar]
- Pallauf, M.; D’Andrea, D.; König, F.; Laukhtina, E.; Yanagisawa, T.; Rouprêt, M.; Daneshmand, S.; Djaladat, H.; Ghoreifi, A.; Soria, F.; et al. Diagnostic Accuracy of Clinical Lymph Node Staging for Upper Tract Urothelial Cancer Patients: A Multicenter, Retrospective, Observational Study. J. Urol. 2023, 209, 515–524. [Google Scholar]
- Matin, S.F.; Sfakianos, J.P.; Espiritu, P.N.; Coleman, J.A.; Spiess, P.E. Patterns of Lymphatic Metastases in Upper Tract Urothelial Carcinoma and Proposed Dissection Templates. J. Urol. 2015, 194, 1567–1574. [Google Scholar] [PubMed]
- Frączek, M.; Kamecki, H.; Kamecka, A.; Sosnowski, R.; Sklinda, K.; Czarniecki, M.; Królicki, L.; Walecki, J. Evaluation of lymph node status in patients with urothelial carcinoma-still in search of the perfect imaging modality: A systematic review. Transl. Androl. Urol. 2018, 7, 783–803. [Google Scholar]
- Zhou, X.; Lu, Z.; Zhang, R.; Zhang, R.; Huang, G.; Shi, K.; Chen, H.; Liu, J. The Value of Dual Time Point 18F-FDG PET/CT Imaging in Differentiating Lymph Node Metastasis From Reactive Hyperplasia in Bladder Urothelial Carcinoma. Acad. Radiol. 2024, 31, 3272–3281. [Google Scholar] [PubMed]
- Honda, Y.; Goto, K.; Sentani, K.; Yasui, W.; Ikeda, K.; Matsubara, A.; Awai, K. T categorization of urothelial carcinomas of the ureter with CT: Preliminary study of new diagnostic criteria proposed for differentiating T2 or lower from T3 or higher. Am. J. Roentgenol. 2015, 204, 792–797. [Google Scholar]
- Park, J.; Park, S.; Song, C.; Hong, J.H.; Kim, C.S.; Ahn, H. Peripelvic/periureteral fat invasion is independently associated with worse prognosis in pT3 upper tract urothelial carcinoma. World J. Urol. 2014, 32, 157–163. [Google Scholar]
- Suhara, Y.; Urabe, F.; Yoshihara, K.; Kurawaki, S.; Fukuokaya, W.; Iwatani, K.; Imai, Y.; Sakanaka, K.; Hisakane, A.; Kurauchi, T.; et al. Prognostic significance of subclassifying pathological T3 upper tract urothelial carcinoma: Results from a multicenter cohort study. Int. J. Urol. 2024, 31, 125–132. [Google Scholar]
- Zareba, P.; Rosenzweig, B.; Winer, A.G.; Coleman, J.A. Association between lymph node yield and survival among patients undergoing radical nephroureterectomy for urothelial carcinoma of the upper tract. Cancer 2017, 123, 1741–1750. [Google Scholar]
- Coleman, J.A.; Clark, P.E.; Bixler, B.R.; Buckley, D.I.; Chang, S.S.; Chou, R.; Hoffman-Censits, J.; Kulkarni, G.S.; Matin, S.F.; Pierorazio, P.M.; et al. Diagnosis and Management of Non-Metastatic Upper Tract Urothelial Carcinoma: AUA/SUO Guideline. J. Urol. 2023, 209, 1071–1081. [Google Scholar]
- European Association of Urology. EAU Guidelines 2025: Upper Urinary Tract Urothelial Cell Carcinoma. Available online: https://uroweb.org/guidelines/upper-urinary-tract-urothelial-cell-carcinoma (accessed on 17 March 2025).
- Campi, R.; Minervini, A.; Mari, A.; Hatzichristodoulou, G.; Sessa, F.; Lapini, A.; Sessa, M.; Gschwend, J.E.; Serni, S.; Roscigno, M.; et al. Anatomical templates of lymph node dissection for upper tract urothelial carcinoma: A systematic review of the literature. Expert. Rev. Anticancer. Ther. 2017, 17, 235–246. [Google Scholar]
- Kondo, T.; Takagi, T.; Tanabe, K. Therapeutic role of template-based lymphadenectomy in urothelial carcinoma of the upper urinary tract. World J. Clin. Oncol. 2015, 6, 237–251. [Google Scholar] [PubMed]


| LN Metastasis (−) (N = 35) | LN Metastasis (+) (N = 13) | Total (N = 48) | p-Value | |
|---|---|---|---|---|
| Sex | 0.739 1 | |||
| Male | 29 (72.5%) | 11 (78.6%) | 40 (74.1%) | |
| Female | 11 (27.5%) | 3 (21.4%) | 14 (25.9%) | |
| Age (years) | 66.5 ± 11.07 | 64.4 ± 15.55 | 65.9 ± 12.27 | 0.579 4 |
| Tumor size (cm) | 3.2 (1.49) | 5.2 (1.93) | 3.7 (1.81) | <0.001 3 |
| LN size in short axis | <0.001 1 | |||
| <8 mm | 40 (100.0%) | 6 (42.9%) | 46 (85.2%) | |
| ≥8 mm | 0 (0.0%) | 8 (57.1%) | 8 (14.8%) | |
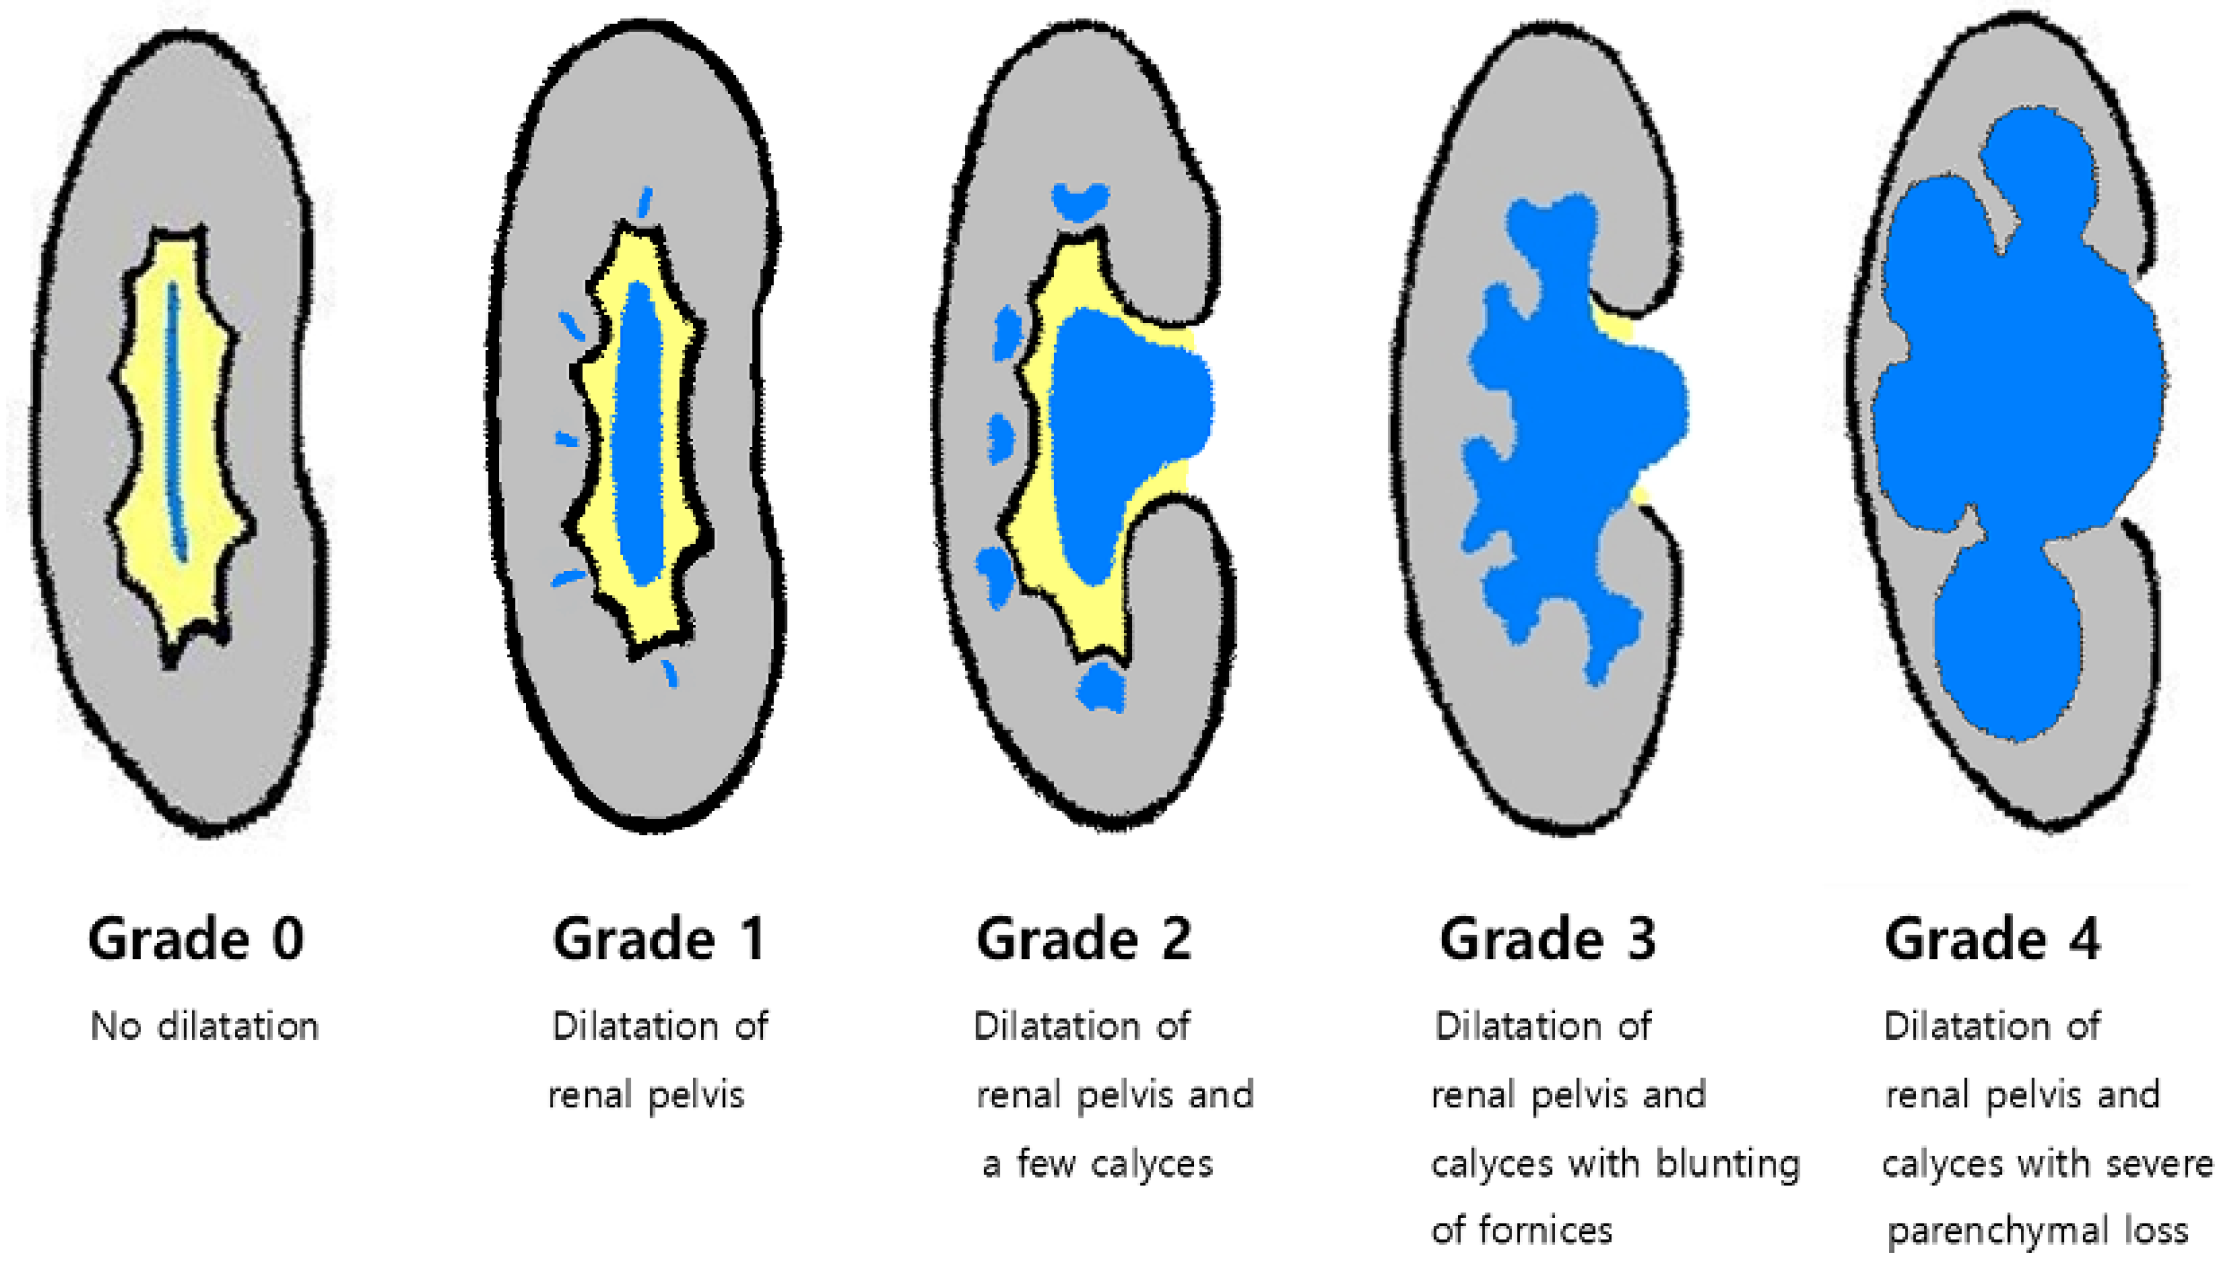
| Hydronephrosis grade (0~4) | 0.6 (1.28) | 1.0 (1.66) | 0.7 (1.38) | 0.439 3 |
| Hydronephrosis grade | 0.429 1 | |||
| 0 | 32 (80.0%) | 10 (71.4%) | 42 (77.8%) | |
| 1 | 0 (0%) | 0 (0%) | 0 (0%) | |
| 2 | 3 (7.5%) | 0 (0.0%) | 3 (5.6%) | |
| 3 | 2 (5.0%) | 2 (14.3%) | 4 (7.4%) | |
| 4 | 3 (7.5%) | 2 (14.3%) | 5 (9.3%) | |
| Peritumoral fat infiltration | 0.002 2 | |||
| (−) | 25 (62.5%) | 2 (14.3%) | 27 (50.0%) | |
| (+) | 15 (37.5%) | 12 (85.7%) | 27 (50.0%) | |
| Tumor multiplicity | 0.173 1 | |||
| 1 | 37 (92.5%) | 11 (78.6%) | 48 (88.9%) | |
| ≥2 | 3 (7.5%) | 3 (21.4%) | 6 (11.1%) |
| LN Metastasis (−) (N = 58) | LN Metastasis (+) (N = 39) | Total (N = 97) | p-Value | |
|---|---|---|---|---|
| Sex | 0.161 1 | |||
| Male | 38 (65.5%) | 20 (51.3%) | 58 (59.8%) | |
| Female | 20 (34.5%) | 19 (48.7%) | 39 (40.2%) | |
| Age (years) | 70.0 ± 10.28 | 68.8 ± 10.11 | 69.5 ± 10.17 | 0.559 4 |
| Tumor size (cm) | 1.9 (1.3, 2.4) | 5.4 (3.3, 7.0) | 2.4 (1.7, 4.8) | <0.001 3 |
| LN size in short axis | <0.001 1 | |||
| <8 mm | 58 (100.0%) | 13 (33.3%) | 71 (73.2%) | |
| ≥8 mm | 0 (0.0%) | 26 (66.7%) | 26 (26.8%) | |
| Hydronephrosis grade (0~4) | 2.0 (1.0, 3.0) | 4.0 (3.0, 4.0) | 3.0 (2.0, 4.0) | <0.001 3 |
| Hydronephrosis grade | <0.001 1 | |||
| 0 | 8 (13.8%) | 1 (2.6%) | 9 (9.3%) | |
| 1 | 10 (17.2%) | 0 (0.0%) | 10 (10.3%) | |
| 2 | 22 (38.0%) | 3 (7.7%) | 25 (25.8%) | |
| 3 | 10 (17.2%) | 11 (28.2%) | 21 (21.6%) | |
| 4 | 8 (13.8%) | 24 (61.5%) | 32 (33.0%) | |
| Peritumoral fat infiltration | <0.001 2 | |||
| (−) | 35 (60.3%) | 8 (20.5%) | 43 (44.3%) | |
| (+) | 23 (39.7%) | 31 (79.5%) | 54 (55.7%) | |
| Tumor multiplicity | <0.001 1 | |||
| 1 | 53 (91.4%) | 25 (64.1%) | 78 (80.4%) | |
| ≥2 | 5 (8.6%) | 14 (35.9%) | 19 (19.6%) |
| Univariate Analysis | Multivariable Analysis | |||
|---|---|---|---|---|
| Variable | OR (95% CI) | p-Value | OR (95% CI) | p-Value |
| In RPUC | ||||
| Tumor multifocality | 4.95 (0.72, 33.90) | 0.103 | ||
| Tumor size (>4.4 cm) | 25.83 (4.92, 135.59) | <0.001 | 14.42 (2.41, 86.10) | 0.003 |
| Peritumoral fat infiltration | 23.00 (2.66, 198.66) | 0.004 | 11.35 (1.10, 116.83) | 0.041 |
| Hydronephrosis grade (0~4) | 1.47 (0.92, 2.35) | 0.112 | ||
| Lymphadenopathy | 109.74 (4.66, >999.99) | 0.004 | ||
| In UUC | ||||
| Tumor multifocality | 5.93 (1.92, 18.3) | 0.002 | ||
| Tumor size (>4 cm) | 32.74 (8.63, 124.22) | <0.0001 | 19.93 (4.65, 85.55) | <0.001 |
| Peritumoral fat infiltration | 5.90 (2.31, 15.08) | <0.001 | ||
| Hydronephrosis grade (≥3) | 19.44 (6.01, 62.94) | <0.0001 | 11.69 (3.09, 44.15) | <0.001 |
| Lymphadenopathy | 229.8 (12.47, >999.99) | <0.001 | ||
| Variable | AUC (95% CI) | p-Value | Criterion | Sensitivity (95% CI) | Specificity (95% CI) | PPV (95% CI) | NPV (95% CI) |
|---|---|---|---|---|---|---|---|
| In RPUC | |||||||
| Tumor size | 0.858 | <0.0001 | >4.4 | 76.9 | 88.6 | 71.4 | 91.2 |
| (0.727, 0.942) | (46.2, 95.0) | (73.3, 96.8) | (48.7, 86.8) | (79.2, 96.6) | |||
| Hydronephrosis grade | 0.593 | 0.219 | ≥3 | 30.8 | 91.4 | 57.1 | 78.0 |
| (0.442, 0.733) | (9.1, 61.4) | (76.9, 98.2) | (25.6, 83.8) | (70.9, 83.8) | |||
| Tumor multifocality | 0.587 | 0.175 | ≥1 | 23.1 | 94.3 | 60.0 | 76.7 |
| (0.436, 0.727) | (5.0, 53.8) | (80.8, 99.3) | (22.0, 88.9) | (70.8, 81.8) | |||
| Lymphadenopathy | 0.808 | <0.001 | >0 | 61.5 | 100 | 100 | 87.5 |
| (0.668, 0.907) | (31.6, 86.1) | (90.0, 100) | (63.1, 100) | (77.9, 93.3) | |||
| In UUC | |||||||
| Tumor size | 0.904 | <0.0001 | >3 | 79.5 | 93.1 | 88.6 | 87.1 |
| (0.828, 0.955) | (63.5, 90.7) | (83.3, 98.1) | (74.8, 95.3) | (78.4, 92.6) | |||
| Hydronephrosis grade | 0.832 | <0.0001 | ≥3 | 89.7 | 69.0 | 66.0 | 90.9 |
| (0.743, 0.900) | (75.8, 97.1) | (55.5, 80.5) | (56.6, 74.3) | (79.5, 96.3) | |||
| Tumor multifocality | 0.636 | 0.0016 | ≥1 | 35.9 | 91.4 | 73.7 | 67.9 |
| (0.533, 0.732) | (21.2, 52.8) | (81.0, 97.1) | (52.3, 87.7) | (62.3, 73.1) | |||
| Lymphadenopathy | 0.833 | <0.0001 | >0 | 66.7 | 100 | 100 | 81.7 |
| (0.744, 0.901) | (49.8, 80.9) | (93.8, 100) | (86.8,100) | (74.1, 87.4) |
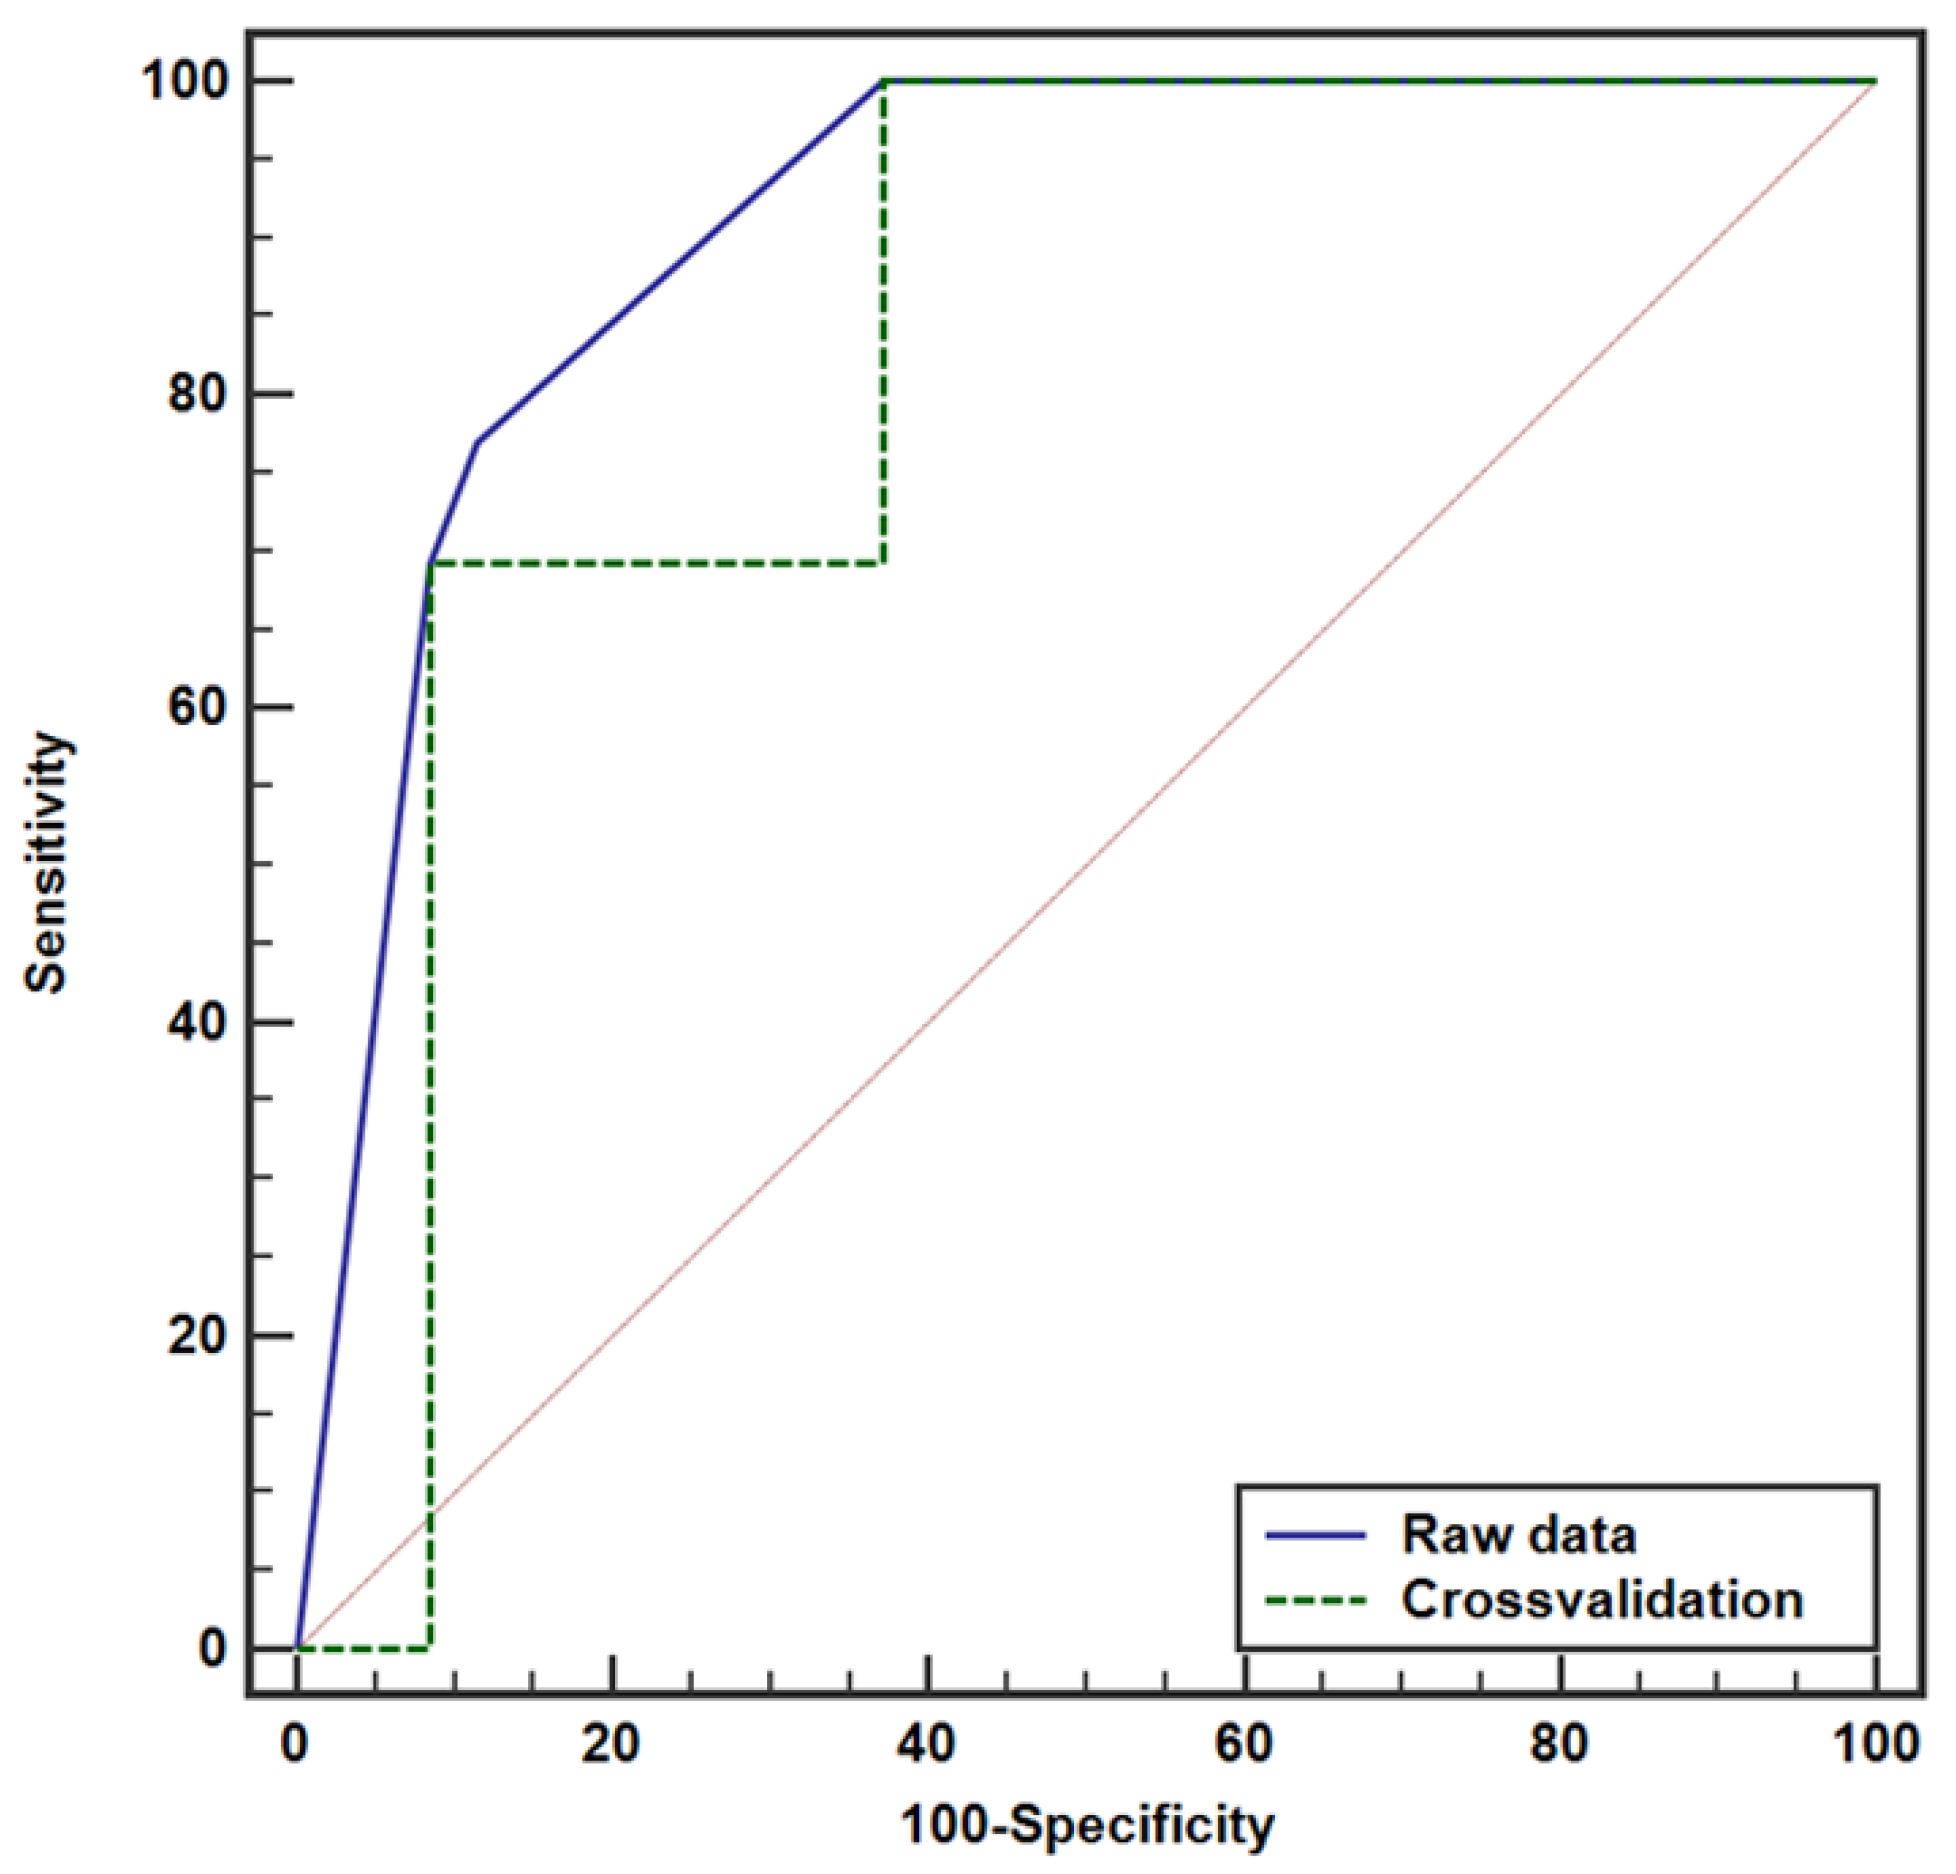
| Raw Data | Cross-Validation | |
|---|---|---|
| In RPUC (Tumor Size > 4.4 cm, Peritumoral Fat Infiltration) | ||
| AUC (95% CI) | 0.907 (0.787, 0.971) | 0.826 (0.690, 0.920) |
| p-value | <0.0001 | <0.0001 |
| Criterion | ≥0.2084 | ≥0.0233 |
| Sensitivity (95% CI) | 76.9 (46.2, 95.0) | 100 (75.3, 100.0) |
| Specificity (95% CI) | 88.6 (73.3, 96.8) | 62.9 (44.9, 78.5) |
| PPV (95% CI) | 71.4 (48.7, 86.8) | 50.0 (39.4, 60.6) |
| NPV (95% CI) | 91.2 (79.2, 96.6) | 100 (84.6, 100.0) |
| In UUC (Tumor Size > 4 cm, Hydronephrosis Grade ≥ 3) | ||
| AUC (95% CI) | 0.904 (0.828, 0.955) | 0.838 (0.749, 0.905) |
| p-value | <0.0001 | <0.0001 |
| Criterion | ≥0.058 | ≥0.059 |
| Sensitivity (95% CI) | 97.4 (86.5, 99.9) | 97.4 (86.5, 99.9) |
| Specificity (95% CI) | 69.0 (55.5, 80.5) | 69.0 (55.5, 80.5) |
| PPV (95% CI) | 67.9 (58.9, 75.7) | 67.9 (58.9, 75.7) |
| NPV (95% CI) | 97.6 (85.2, 99.6) | 97.6 (85.2, 99.6) |
| Data | Variable | Coefficient (95% CI) | p-Value |
|---|---|---|---|
| RPUC | Hydronephrosis grade | 0.940 (0.822, 1.000) a | <0.0001 |
| Peritumoral fat infiltration | 0.917 (0.804, 1.000) a | <0.0001 | |
| Multifocality | 0.813 (0.558, 1.000) a | <0.0001 | |
| Tumor size | 0.999 (0.9989, 0.9996) b | <0.0001 | |
| UUC | Hydronephrosis grade | 0.959 (0.914, 1.000) a | <0.0001 |
| Peritumoral fat infiltration | 0.938 (0.868, 1.000) a | <0.0001 | |
| Multifocality | 0.937 (0.851, 1.000) a | <0.0001 | |
| Tumor size | 0.999 (0.9987, 0.9996) b | <0.0001 |
| Primary Tumor | Ipsilateral Hilar LN | p-Value | Contralateral Hilar LN | p-Value | ||
|---|---|---|---|---|---|---|
| (−) | (+) | (−) | (+) | |||
| Lower UCC | 75 (57.7%) | 1 (6.7%) | <0.0001 | 75 (52.4%) | 1 (50.0%) | 1.000 |
| Upper UUC | 20 (15.4%) | 1 (6.7%) | 21 (14.7%) | 0 (0.0%) | ||
| RPUC | 35 (26.9%) | 13 (66.7%) | 47 (32.9%) | 1 (50.07%) | ||
| RPUC vs. Others | <0.0001 | 1.000 | ||||
| Upper UUC vs. Others | 0.697 | 1.000 | ||||
| Lower UUC vs. Others | <0.0001 | 1.000 | ||||
| Primary Tumor | Ipsilateral Upper-Retroperitoneal LN | p-Value | Contralateral Upper-Retroperitoneal LN | p-Value | ||
| (−) | (+) | (−) | (+) | |||
| Lower UCC | 66 (52.4%) | 10 (52.6%) | 0.215 | 74 (52.5%) | 2 (50.0%) | 0.627 |
| Upper UUC | 16 (12.7%) | 5 (26.3%) | 20 (14.2%) | 1 (25.0%) | ||
| RPUC | 44 (34.9%) | 4 (21.1%) | 47 (33.3%) | 1 (25.0%) | ||
| RPUC vs. Others | 0.231 | 1.000 | ||||
| Upper UUC vs. Others | 0.155 | 0.469 | ||||
| Lower UUC vs. Others | 1.000 | 1.000 | ||||
| Primary Tumor | Ipsilateral Pelvic LN | p-Value | Contralateral Pelvic LN | p-Value | ||
| (−) | (+) | (−) | (+) | |||
| Lower UCC | 46 (40.4%) | 30 (96.8%) | <0.0001 | 76 (52.4%) | 0 (0.0%) | N/A |
| Upper UUC | 20 (17.5%) | 1 (3.2%) | 21 (14.5%) | 0 (0.0%) | ||
| RPUC | 48 (42.1%) | 0 (0.0%) | 48 (33.1%) | 0 (0.0%) | ||
| RPUC vs. Others | <0.0001 | N/A | ||||
| Upper UUC vs. Others | 0.047 | N/A | ||||
| Lower UUC vs. Others | <0.0001 | N/A | ||||
Disclaimer/Publisher’s Note: The statements, opinions and data contained in all publications are solely those of the individual author(s) and contributor(s) and not of MDPI and/or the editor(s). MDPI and/or the editor(s) disclaim responsibility for any injury to people or property resulting from any ideas, methods, instructions or products referred to in the content. |
© 2025 by the authors. Licensee MDPI, Basel, Switzerland. This article is an open access article distributed under the terms and conditions of the Creative Commons Attribution (CC BY) license (https://creativecommons.org/licenses/by/4.0/).
Share and Cite
Park, S.; Sung, D.J.; Yang, K.S.; Han, Y.E.; Sim, K.C.; Han, N.Y.; Park, B.J.; Kim, M.J. Preoperative Computed Tomography-Based Prediction and Patterns of Lymph Node Metastasis in Renal Pelvis and Ureteral Urothelial Carcinomas. Cancers 2025, 17, 1180. https://doi.org/10.3390/cancers17071180
Park S, Sung DJ, Yang KS, Han YE, Sim KC, Han NY, Park BJ, Kim MJ. Preoperative Computed Tomography-Based Prediction and Patterns of Lymph Node Metastasis in Renal Pelvis and Ureteral Urothelial Carcinomas. Cancers. 2025; 17(7):1180. https://doi.org/10.3390/cancers17071180
Chicago/Turabian StylePark, Soojung, Deuk Jae Sung, Kyung Sook Yang, Yeo Eun Han, Ki Choon Sim, Na Yeon Han, Beom Jin Park, and Min Ju Kim. 2025. "Preoperative Computed Tomography-Based Prediction and Patterns of Lymph Node Metastasis in Renal Pelvis and Ureteral Urothelial Carcinomas" Cancers 17, no. 7: 1180. https://doi.org/10.3390/cancers17071180
APA StylePark, S., Sung, D. J., Yang, K. S., Han, Y. E., Sim, K. C., Han, N. Y., Park, B. J., & Kim, M. J. (2025). Preoperative Computed Tomography-Based Prediction and Patterns of Lymph Node Metastasis in Renal Pelvis and Ureteral Urothelial Carcinomas. Cancers, 17(7), 1180. https://doi.org/10.3390/cancers17071180