

Ethnic and Socio-Economic Variations in Comorbidity and Mortality in Cancer Survivors: A UK Population-Based Observational Study


Simple Summary
Abstract
1. Introduction
2. Materials and Methods
2.1. Study Design and Data Sources
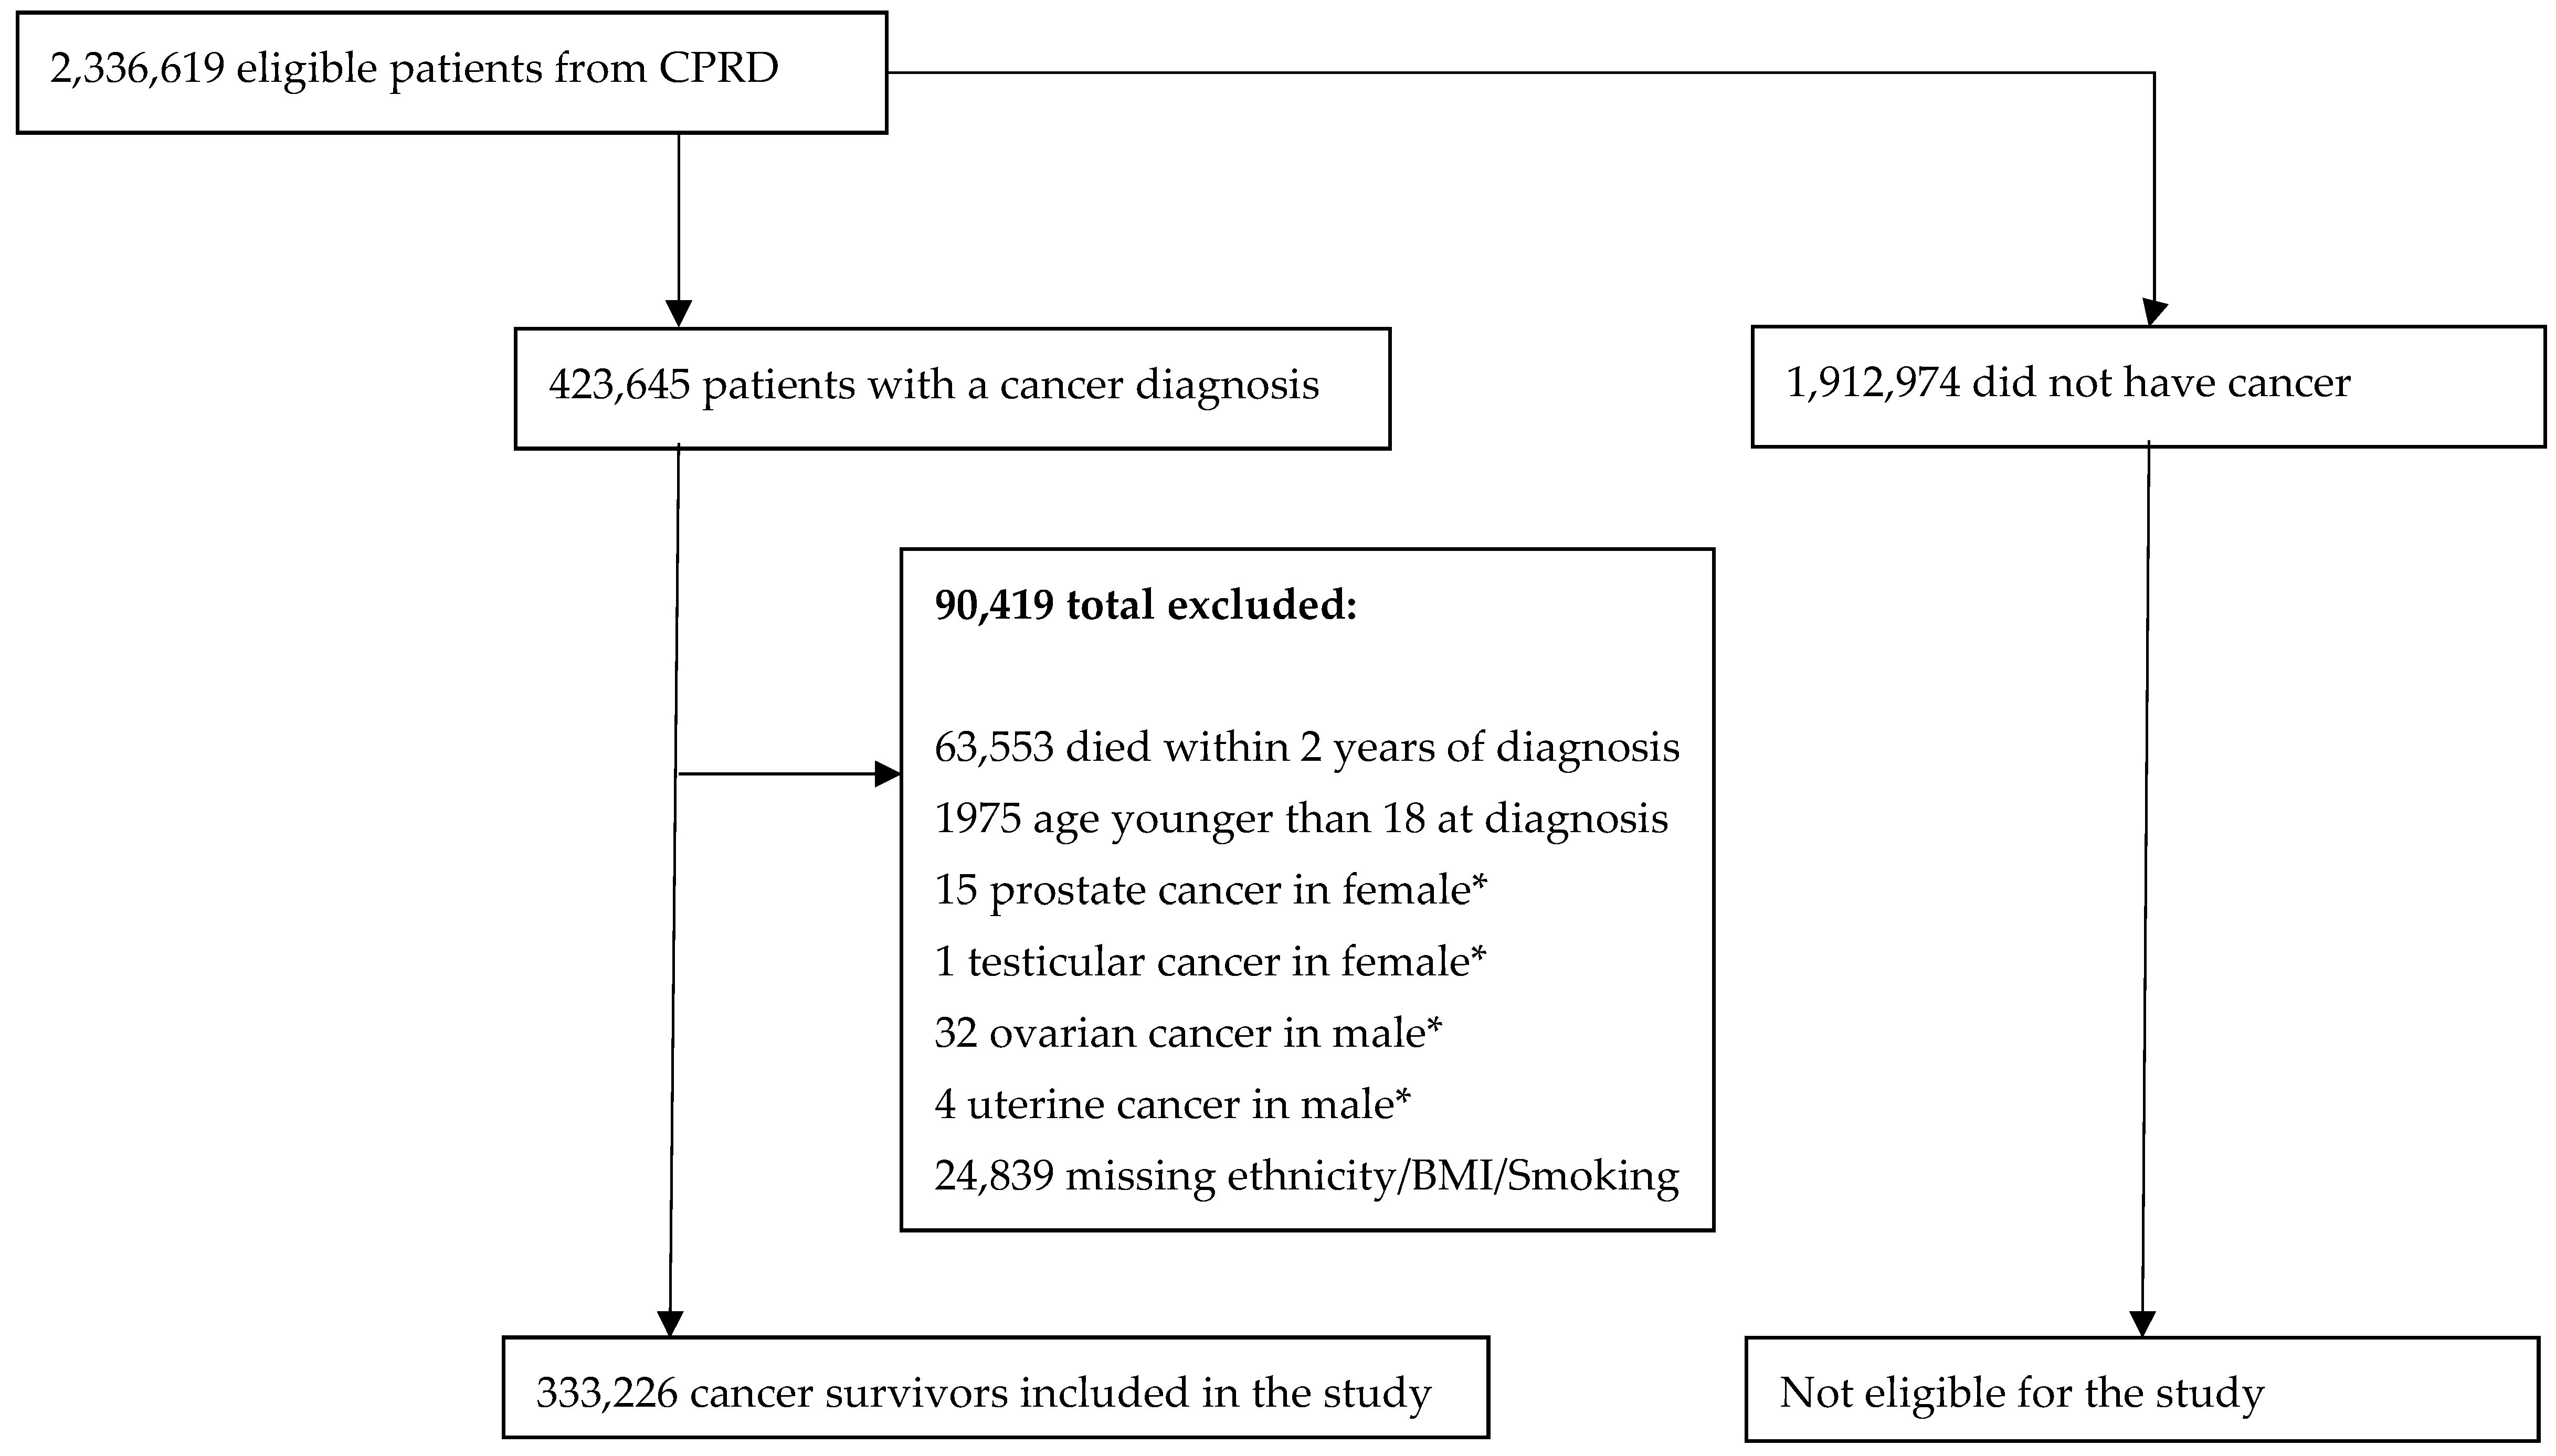
2.2. Participants
2.3. Study Variables
2.4. Statistical Analysis
3. Results
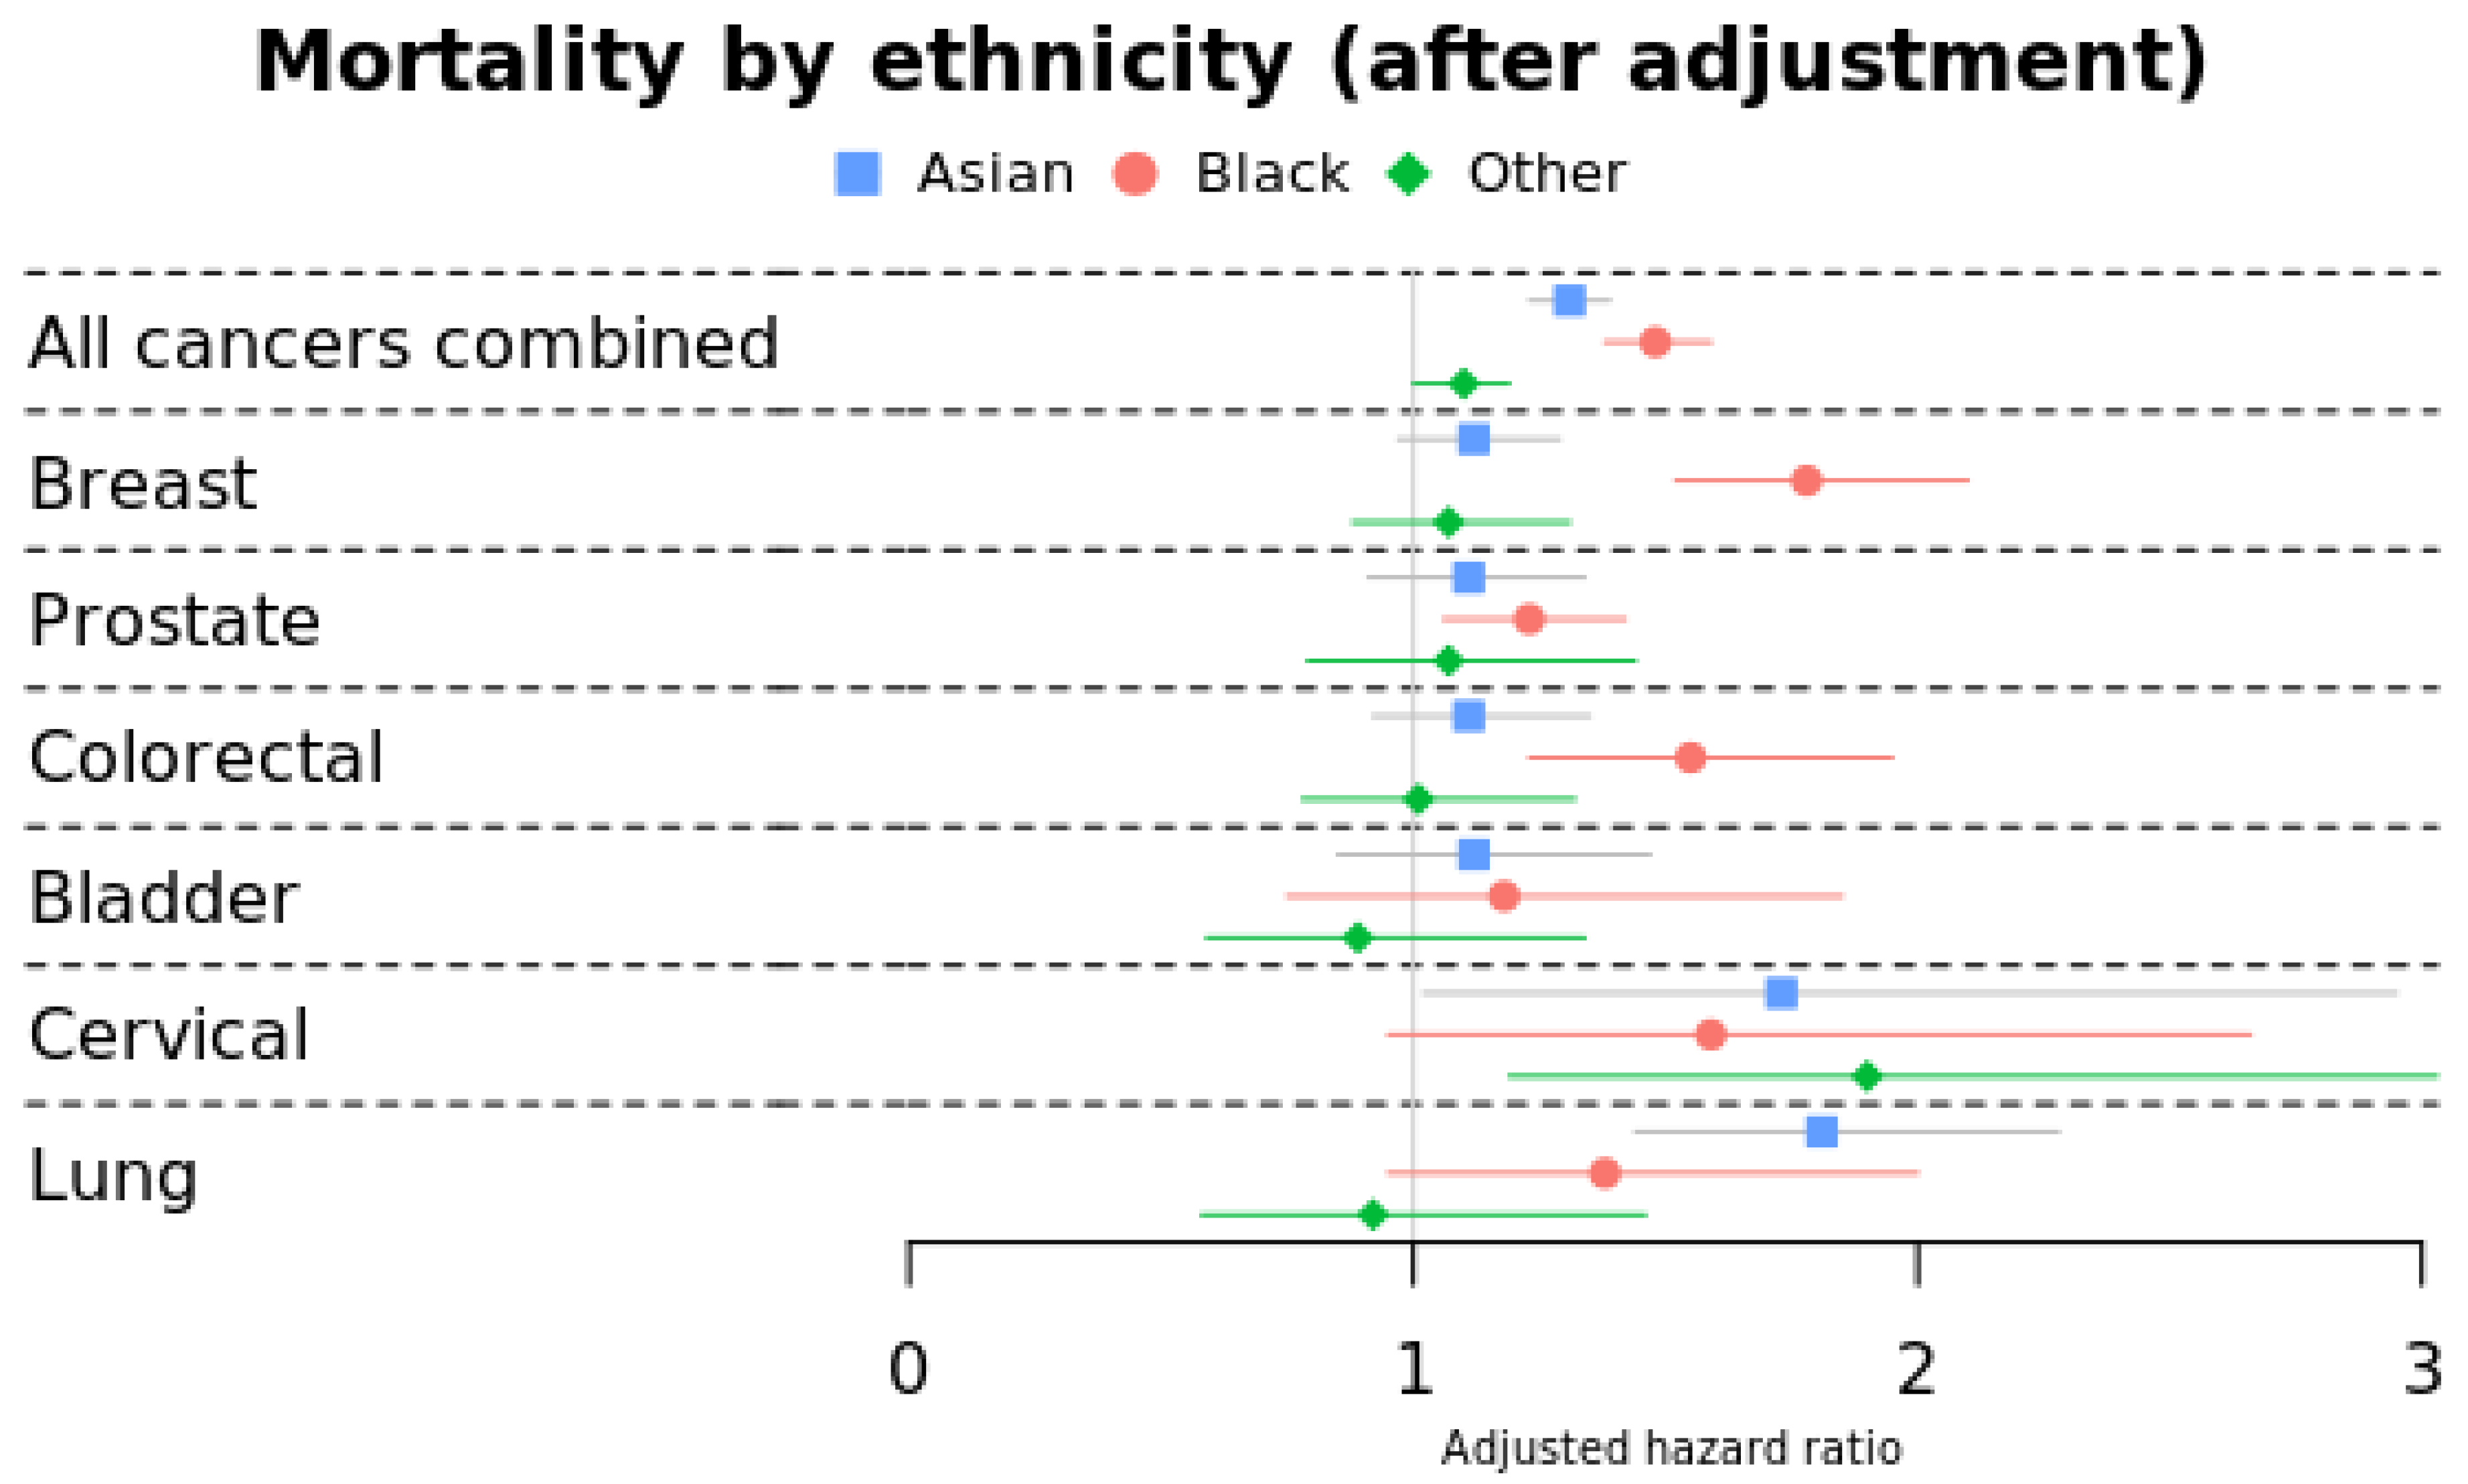
3.1. Morality by Ethnicity
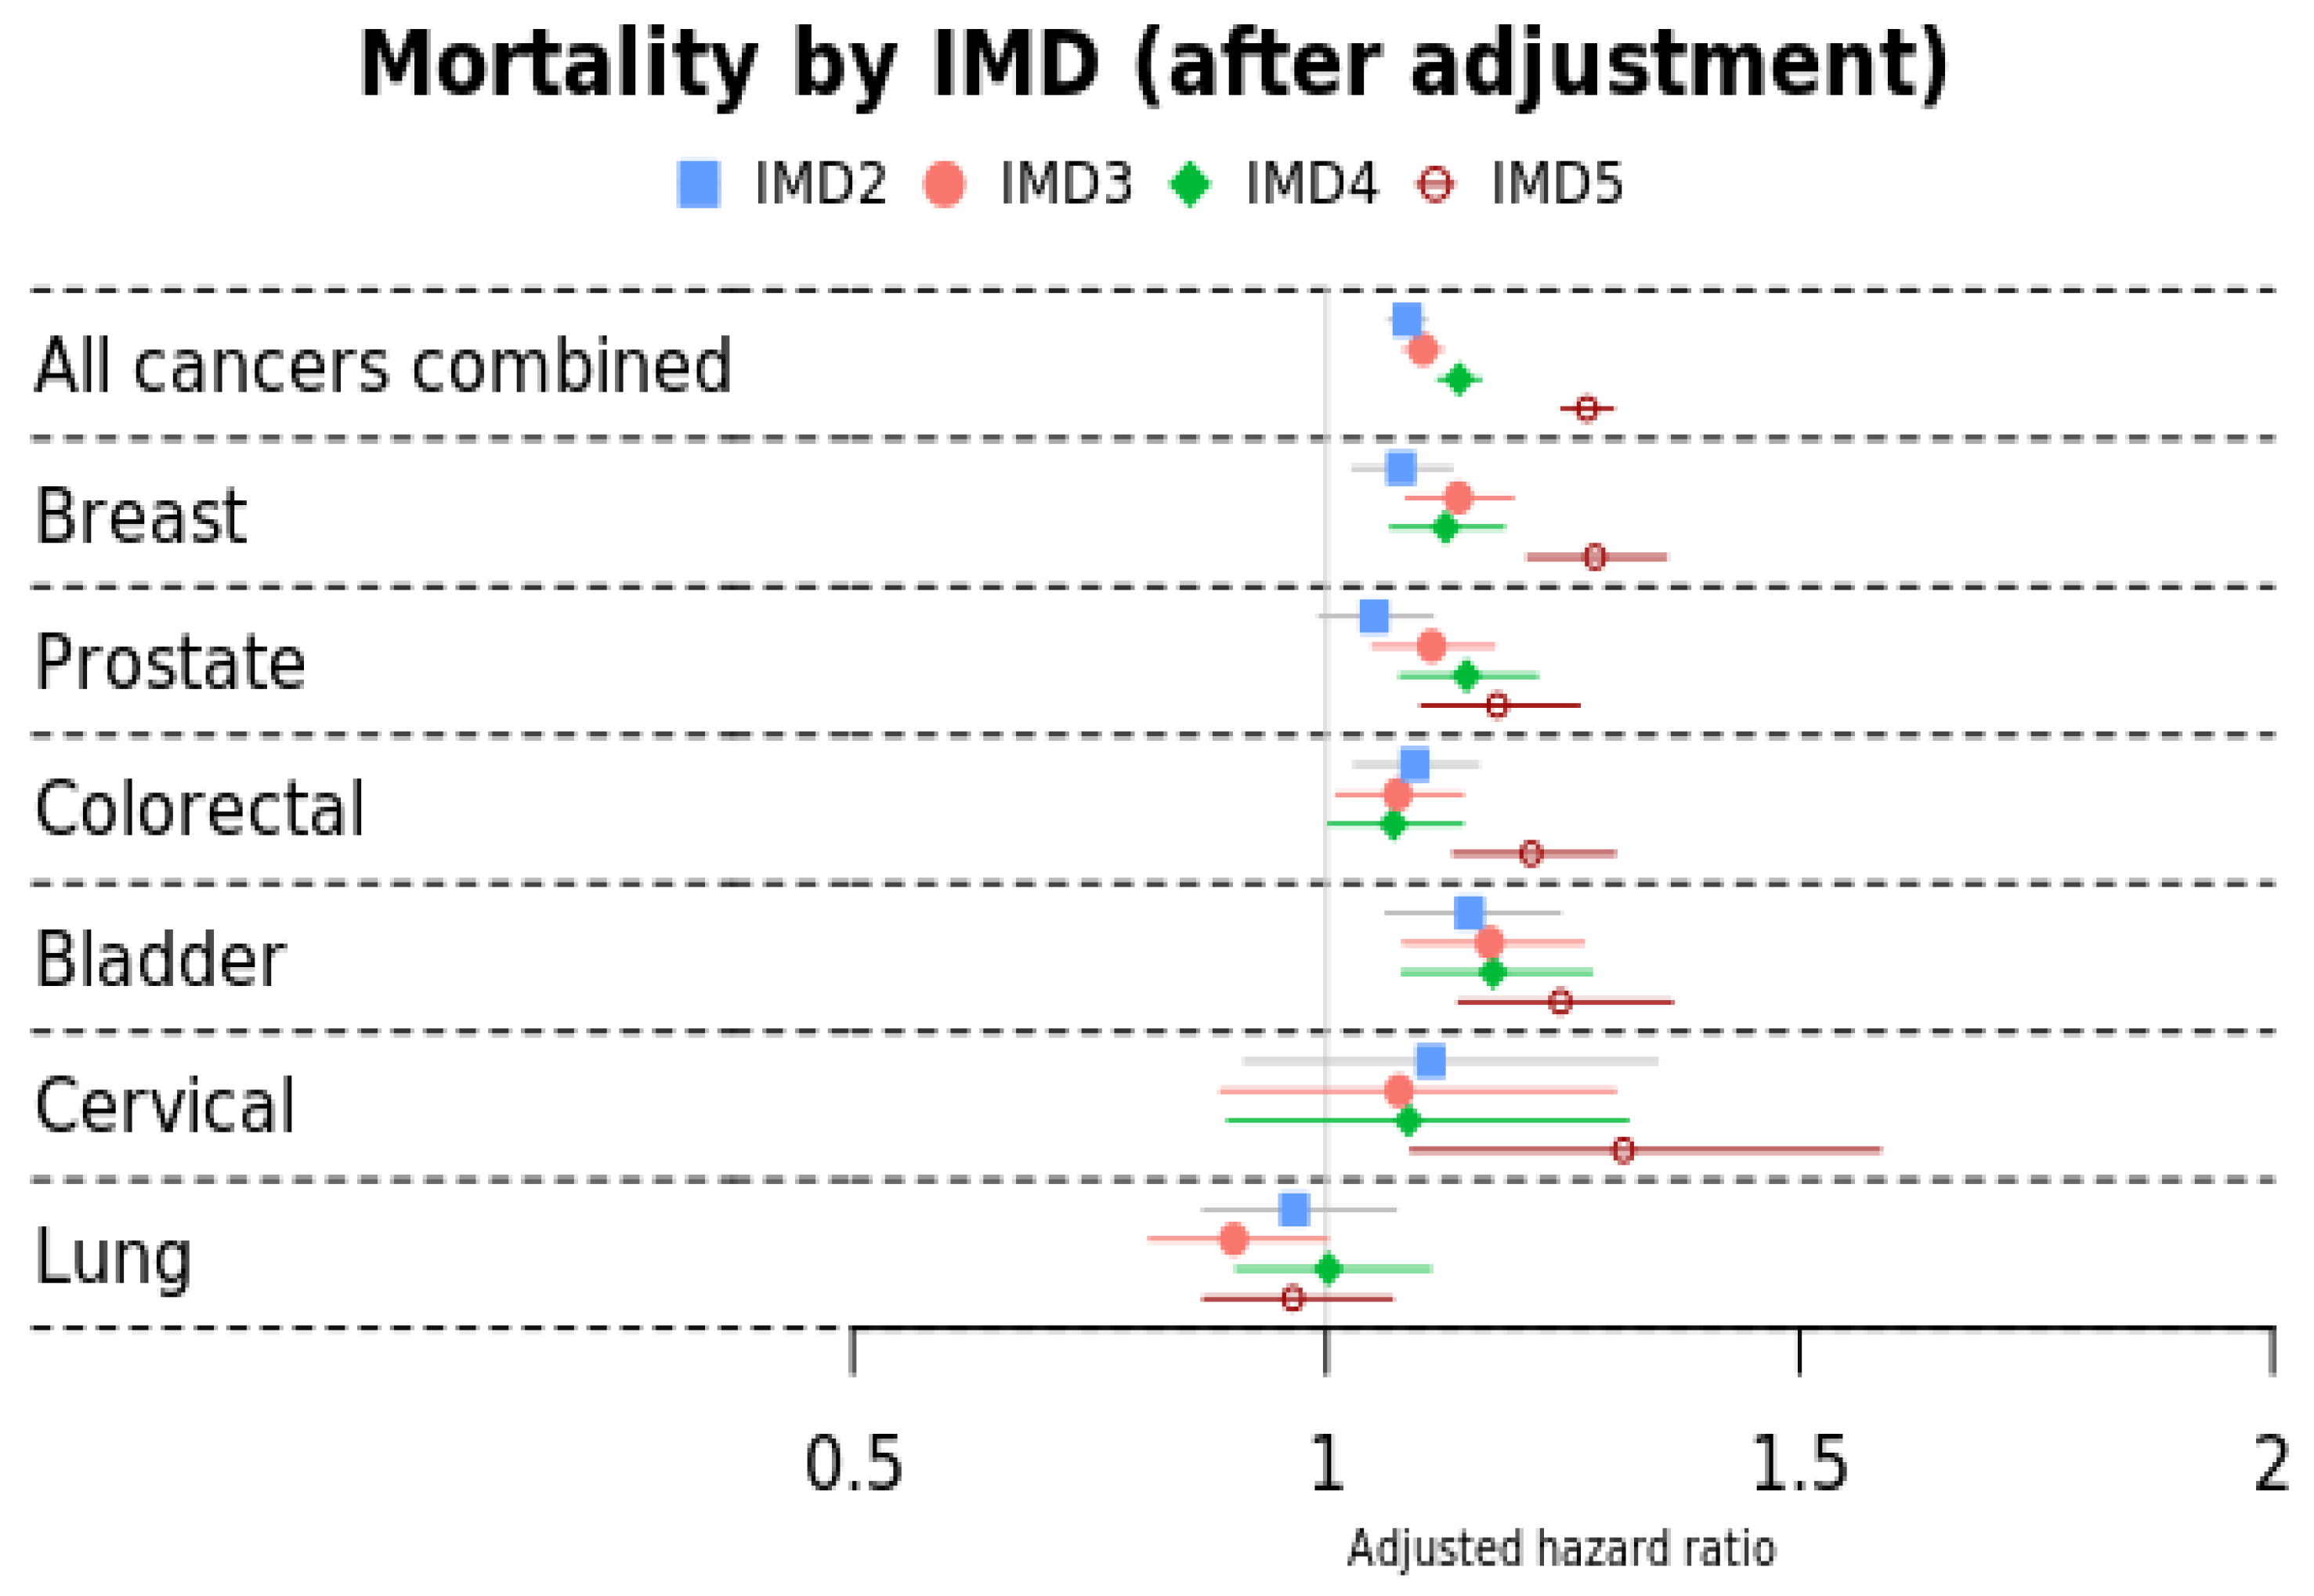
3.2. Mortality by IMD
4. Discussion
5. Conclusions
Author Contributions
Funding
Institutional Review Board Statement
Informed Consent Statement
Data Availability Statement
Acknowledgments
Conflicts of Interest
Appendix A

| Cancer Sites |
|---|
|
|
|
|
|
|
|
|
|
|
|
|
|
|
|
|
|
|
|
|
|
|
|
|
|
|
|
|
| White | Asian | Black | Other | |
|---|---|---|---|---|
| Comorbidity | Adjusted Odds Ratio (95% CI) | Adjusted Odds Ratio (95% CI) | Adjusted Odds Ratio (95% CI) | |
| Anaemia | Ref | 2.33 (2.19–2.48) | 1.97 (1.83–2.13) | 1.12 (1.02–1.24) |
| Anxiety and phobia | Ref | 0.53 (0.49–0.57) | 0.45 (0.41–0.49) | 0.66 (0.60–0.72) |
| Asthma | Ref | 1.19 (1.11–1.27) | 0.83 (0.76–0.91) | 0.79 (0.71–0.87) |
| Atrial fibrillation | Ref | 0.68 (0.62–0.75) | 0.53 (0.47–0.61) | 0.81 (0.71–0.92) |
| Chronic kidney disease | Ref | 1.47 (1.36–1.59) | 1.55 (1.42–1.70) | 0.85 (0.76–0.96) |
| Constipation | Ref | 1.5 (1.41–1.59) | 1.33 (1.24–1.44) | 1.02 (0.94–1.11) |
| Coronary artery disease | Ref | 1.7 (1.59–1.83) | 0.77 (0.69–0.85) | 0.94 (0.84–1.05) |
| Depression | Ref | 0.62 (0.58–0.66) | 0.54 (0.50–0.59) | 0.71 (0.65–0.77) |
| Dermatitis | Ref | 1.31 (1.24–1.39) | 0.78 (0.72–0.84) | 0.88 (0.81–0.96) |
| Diabetes | Ref | 4.41 (4.13–4.70) | 2.13 (1.96–2.32) | 1.75 (1.58–1.94) |
| Hearing loss | Ref | 0.84 (0.78–0.91) | 0.54 (0.48–0.60) | 0.77 (0.70–0.86) |
| Hypertension | Ref | 1.76 (1.55–2.00) | 2.32 (1.95–2.76) | 1.12 (0.93–1.36) |
| Obesity | Ref | 1.29 (1.19–1.40) | 0.97 (0.88–1.07) | 0.94 (0.83–1.06) |
| Osteoarthritis | Ref | 1.04 (0.97–1.11) | 0.83 (0.77–0.90) | 0.71 (0.64–0.78) |
| Painful condition | Ref | 1.64 (1.46–1.85) | 1.08 (0.92–1.28) | 0.80 (0.67–0.97) |
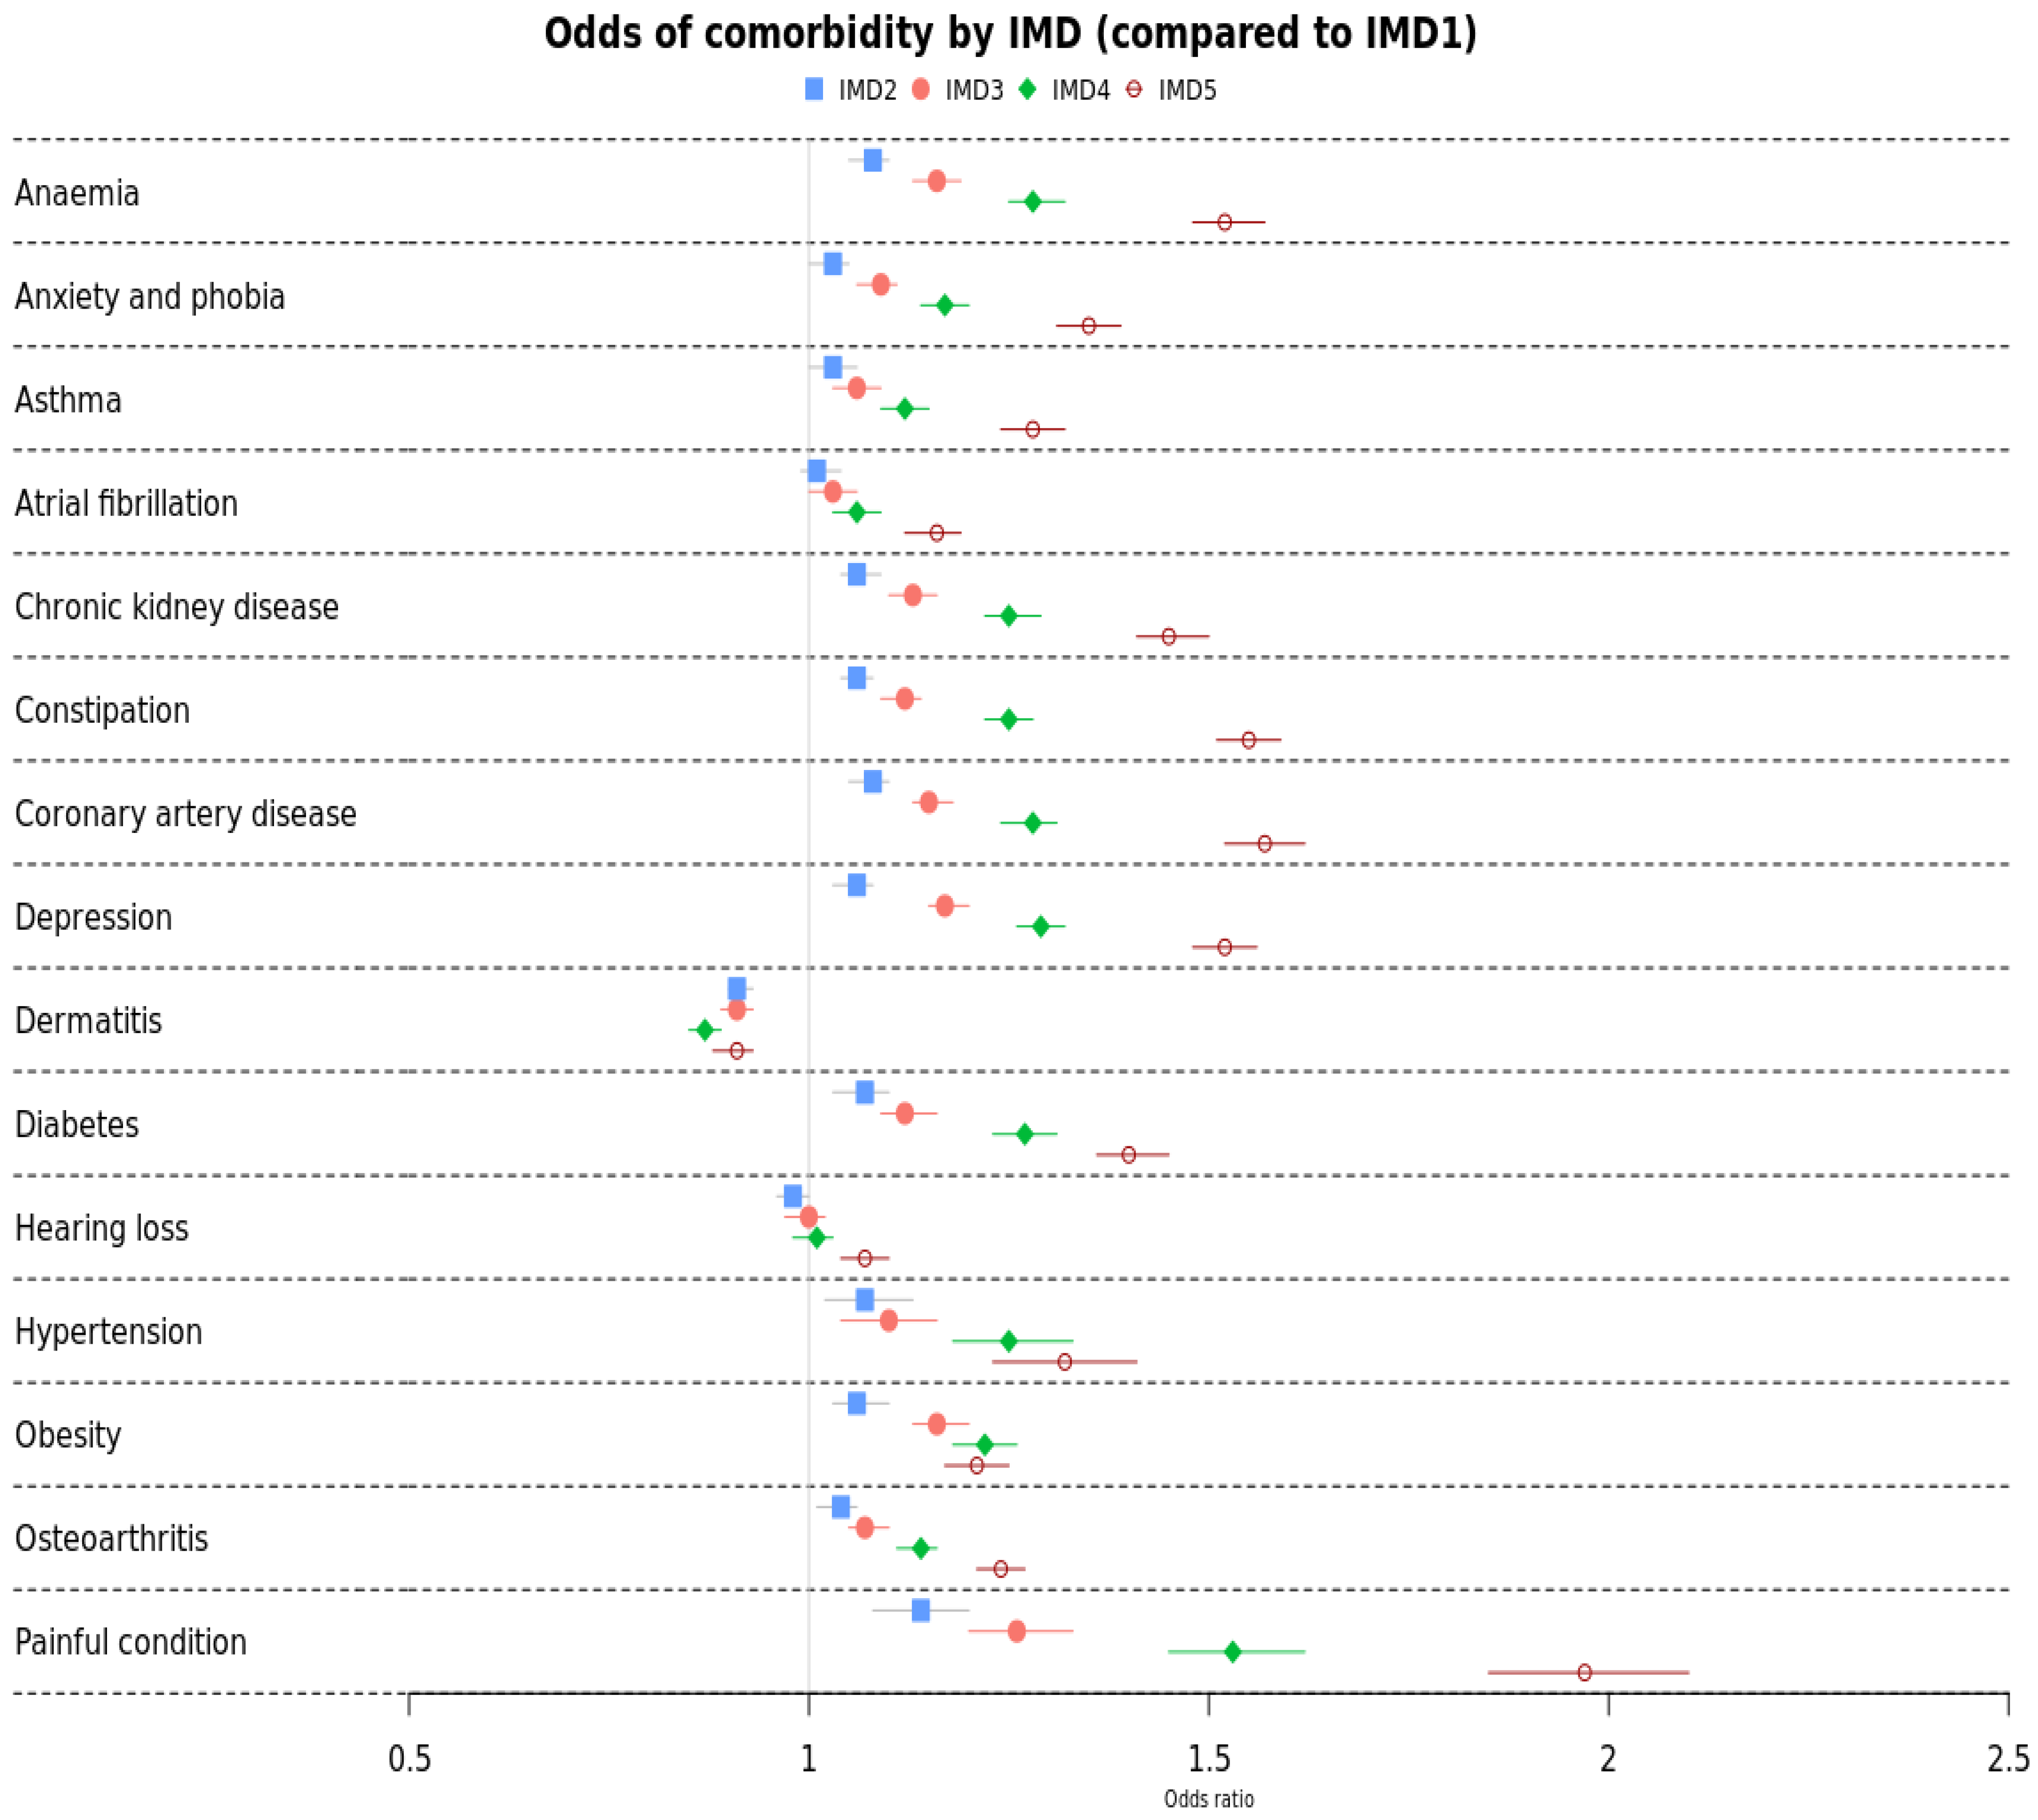
| Comorbidity | IMD 1 | IMD 2 | IMD 3 | IMD 4 | IMD 5 (Least Affluent) |
|---|---|---|---|---|---|
| Adjusted Odds Ratio (95% CI) | Adjusted Odds Ratio (95% CI) | Adjusted Odds Ratio (95% CI) | Adjusted Odds Ratio (% CI) | ||
| Anaemia | Ref | 1.03 (1.00–1.06) | 1.06 (1.03–1.09) | 1.12 (1.09–1.15) | 1.28 (1.24–1.32) |
| Anxiety and phobia | Ref | 1.07 (1.02–1.13) | 1.10 (1.04–1.16) | 1.25 (1.18–1.33) | 1.32 (1.23–1.41) |
| Asthma | Ref | 1.06 (1.04–1.08) | 1.12 (1.09–1.14) | 1.25 (1.22–1.28) | 1.55 (1.51–1.59) |
| Atrial fibrillation | Ref | 0.98 (0.96–1.00) | 1.00 (0.97–1.02) | 1.01 (0.98–1.03) | 1.07 (1.04–1.10) |
| Chronic kidney disease | Ref | 1.08 (1.05–1.10) | 1.15 (1.13–1.18) | 1.28 (1.24–1.31) | 1.57 (1.52–1.62) |
| Constipation | Ref | 1.01 (0.99–1.04) | 1.03 (1.00–1.06) | 1.06 (1.03–1.09) | 1.16 (1.12–1.19) |
| Coronary artery disease | Ref | 1.06 (1.04–1.09) | 1.13 (1.10–1.16) | 1.25 (1.22–1.29) | 1.45 (1.41–1.50) |
| Depression | Ref | 1.14 (1.08–1.20) | 1.26 (1.20–1.33) | 1.53 (1.45–1.62) | 1.97 (1.85–2.10) |
| Dermatitis | Ref | 1.03 (1.00–1.05) | 1.09 (1.06–1.11) | 1.17 (1.14–1.20) | 1.35 (1.31–1.39) |
| Diabetes | Ref | 1.07 (1.03–1.10) | 1.12 (1.09–1.16) | 1.27 (1.23–1.31) | 1.40 (1.36–1.45) |
| Hearing loss | Ref | 1.06 (1.03–1.08) | 1.17 (1.15–1.20) | 1.29 (1.26–1.32) | 1.52 (1.48–1.56) |
| Hypertension | Ref | 1.06 (1.03–1.10) | 1.16 (1.13–1.20) | 1.22 (1.18–1.26) | 1.21 (1.17–1.25) |
| Obesity | Ref | 1.08 (1.05–1.10) | 1.16 (1.13–1.19) | 1.28 (1.25–1.32) | 1.52 (1.48–1.57) |
| Osteoarthritis | Ref | 1.04 (1.01–1.06) | 1.07 (1.05–1.10) | 1.14 (1.11–1.16) | 1.24 (1.21–1.27) |
| Painful condition | Ref | 0.91 (0.90–0.93) | 0.91 (0.89–0.93) | 0.87 (0.85–0.89) | 0.91 (0.88–0.93) |
| White | Asian HR (95% CI) | Black HR (95% CI) | Other HR (95% CI) | |
|---|---|---|---|---|
| All cancers combined | Ref | 1.31 (1.23–1.39) | 1.48 (1.38–1.59) | 1.10 (1.00–1.19) |
| Breast | Ref | 1.12 (0.97–1.29) | 1.78 (1.52–2.10) | 1.07 (0.88–1.31) |
| Prostate | Ref | 1.11 (0.91–1.34) | 1.23 (1.06–1.42) | 1.07 (0.79–1.44) |
| Colorectal | Ref | 1.11 (0.92–1.35) | 1.55 (1.23–1.95) | 1.01 (0.78–1.32) |
| Bladder | Ref | 1.12 (0.85–1.47) | 1.18 (0.75–1.85) | 0.89 (0.59–1.34) |
| Cervical | Ref | 1.73 (1.02–2.95) | 1.59 (0.95–2.66) | 1.90 (1.19–3.03) |
| Lung | Ref | 1.81 (1.44–2.28) | 1.38 (0.95–2.00) | 0.92 (0.58–1.46) |
| IMD 1 (Most Affluent) | IMD 2 HR (95% CI) | IMD 3 HR (95% CI) | IMD 4 HR (95% CI) | IMD 5 HR (95% CI) | |
|---|---|---|---|---|---|
| All cancers combined | Ref | 1.09 (1.07–1.11) | 1.10 (1.08–1.12) | 1.14 (1.12–1.1) | 1.28 (1.25–1.30) |
| Breast | Ref | 1.08 (1.03–1.13) | 1.14 (1.08–1.20) | 1.13 (1.07–1.19) | 1.28 (1.21–1.36) |
| Prostate | Ref | 1.05 (0.99–1.11) | 1.11 (1.05–1.18) | 1.15 (1.08–1.22) | 1.18 (1.10–1.27) |
| Colorectal | Ref | 1.09 (1.03–1.16) | 1.08 (1.01–1.14) | 1.07 (1.00–1.14) | 1.22 (1.13–1.30) |
| Bladder | Ref | 1.15 (1.06–1.25) | 1.17 (1.08–1.27) | 1.18 (1.08–1.28) | 1.25 (1.14–1.37) |
| Cervical | Ref | 1.11 (0.91–1.35) | 1.08 (0.89–1.31) | 1.09 (0.90–1.32) | 1.31 (1.09–1.59) |
| Lung | Ref | 0.97 (0.87–1.07) | 0.90 (0.81–1.00) | 1.00 (0.91–1.11) | 0.96 (0.87–1.07) |
References
- Sung, H.; Ferlay, J.; Siegel, R.L.; Laversanne, M.; Soerjomataram, I.; Jemal, A.; Bray, F. Global Cancer Statistics 2020: GLOBOCAN Estimates of Incidence and Mortality Worldwide for 36 Cancers in 185 Countries. CA Cancer J. Clin. 2021, 71, 209–249. [Google Scholar] [CrossRef]
- Cancer Research UK. Cancer Statistics. Available online: https://www.cancerresearchuk.org/health-professional/cancer-statistics-for-the-uk#heading-Zero (accessed on 2 February 2024).
- Martins, T.; Hamilton, W.; Ukoumunne, O.C. Ethnic inequalities in time to diagnosis of cancer: A systematic review. BMC Fam. Pract. 2013, 14, 197. [Google Scholar] [CrossRef]
- Forman, D. Cancer Incidence and Survival by Major Ethnic Group, England, 2002–2006; National Cancer Intelligence Network: London, UK, 2009. [Google Scholar]
- Abraham, S.; Foreman, N.; Sidat, Z.; Sandhu, P.; Marrone, D.; Headley, C.; Akroyd, C.; Nicholson, S.; Brown, K.; Thomas, A.; et al. Inequalities in cancer screening, prevention and service engagement between UK ethnic minority groups. Br. J. Nurs. 2022, 31, S14–S24. [Google Scholar] [CrossRef] [PubMed]
- Cuthbertson, S.A.; Goyder, E.C.; Poole, J. Inequalities in breast cancer stage at diagnosis in the Trent region, and implications for the NHS Breast Screening Programme. J. Public Health 2009, 31, 398–405. [Google Scholar] [CrossRef] [PubMed]
- Jack, R.; Davies, E.; Møller, H. Breast cancer incidence, stage, treatment and survival in ethnic groups in South East England. Br. J. Cancer 2009, 100, 545–550. [Google Scholar] [CrossRef] [PubMed]
- Jack, R.H.; Davies, E.A.; Renshaw, C.; Tutt, A.; Grocock, M.J.; Coupland, V.H.; Møller, H. Differences in breast cancer hormone receptor status in ethnic groups: A London population. Eur. J. Cancer 2013, 49, 696–702. [Google Scholar] [CrossRef]
- Metcalfe, C.; Evans, S.; Ibrahim, F.; Patel, B.; Anson, K.; Chinegwundoh, F.; Corbishley, C.; Gillatt, D.; Kirby, R.; Muir, G. Pathways to diagnosis for Black men and White men found to have prostate cancer: The PROCESS cohort study. Br. J. Cancer 2008, 99, 1040–1045. [Google Scholar] [CrossRef]
- Marlow, L.; Robb, K.; Simon, A.; Waller, J.; Wardle, J. Awareness of cancer risk factors among ethnic minority groups in England. Public Health 2012, 126, 702–709. [Google Scholar] [CrossRef]
- Januszewski, A.; Tanna, N.; Stebbing, J. Ethnic variation in breast cancer incidence and outcomes—The debate continues. Br. J. Cancer 2014, 110, 4–6. [Google Scholar] [CrossRef]
- Coupland, V.; Lagergren, J.; Konfortion, J.; Allum, W.; Mendall, M.; Hardwick, R.; Linklater, K.; Møller, H.; Jack, R. Ethnicity in relation to incidence of oesophageal and gastric cancer in England. Br. J. Cancer 2012, 107, 1908–1914. [Google Scholar] [CrossRef]
- Merletti, F.; Galassi, C.; Spadea, T. The socioeconomic determinants of cancer. Environ. Health 2011, 10, S7. [Google Scholar] [CrossRef] [PubMed]
- Kogevinas, M.; Pearce, N.; Susser, M.; Boffetta, P. Social Inequalities and Cancer; IARC: Lyon, France, 1997; Volume 138. [Google Scholar]
- Lynge, E.; Thygesen, L. Occupational cancer in Denmark: Cancer incidence in the 1970 census population. Scand. J. Work. Environ. Health 1990, 16, 1–35. [Google Scholar]
- van Loon, A.J.M.; Burg, J.; Goldbohm, R.A.; van den Brandt, P.A. Differences in cancer incidence and mortality among socio-economic groups. Scand. J. Soc. Med. 1995, 23, 110–120. [Google Scholar] [CrossRef]
- Ward, E.; Jemal, A.; Cokkinides, V.; Singh, G.K.; Cardinez, C.; Ghafoor, A.; Thun, M. Cancer disparities by race/ethnicity and socioeconomic status. CA Cancer J. Clin. 2004, 54, 78–93. [Google Scholar] [CrossRef]
- Sarfati, D.; Koczwara, B.; Jackson, C. The impact of comorbidity on cancer and its treatment. CA Cancer J. Clin. 2016, 66, 337–350. [Google Scholar] [CrossRef] [PubMed]
- Thong, M.S.; Mols, F.; Lemmens, V.E.; Creemers, G.J.; Slooter, G.D.; van de Poll-Franse, L.V. Impact of chemotherapy on health status and symptom burden of colon cancer survivors: A population-based study. Eur. J. Cancer 2011, 47, 1798–1807. [Google Scholar] [CrossRef]
- Jacobs, L.A.; Shulman, L.N. Follow-up care of cancer survivors: Challenges and solutions. Lancet Oncol. 2017, 18, e19–e29. [Google Scholar] [CrossRef]
- Ahmad, T.A.; Gopal, D.P.; Chelala, C.; Ullah, A.Z.D.; Taylor, S.J. Multimorbidity in people living with and beyond cancer: A scoping review. Am. J. Cancer Res. 2023, 13, 4346. [Google Scholar]
- Strongman, H.; Gadd, S.; Matthews, A.; Mansfield, K.E.; Stanway, S.; Lyon, A.R.; Dos-Santos-Silva, I.; Smeeth, L.; Bhaskaran, K. Medium and long-term risks of specific cardiovascular diseases in survivors of 20 adult cancers: A population-based cohort study using multiple linked UK electronic health records databases. Lancet 2019, 394, 1041–1054. [Google Scholar] [CrossRef]
- Khan, N.F.; Mant, D.; Carpenter, L.; Forman, D.; Rose, P.W. Long-term health outcomes in a British cohort of breast, colorectal and prostate cancer survivors: A database study. Br. J. Cancer 2011, 105, S29–S37. [Google Scholar] [CrossRef]
- Eto, F.; Samuel, M.; Henkin, R.; Mahesh, M.; Ahmad, T.; Angdembe, A.; Hamish McAllister-Williams, R.; Missier, P.; Reynolds, N.J.; Barnes, M.R.; et al. Ethnic differences in early onset multimorbidity and associations with health service use, long-term prescribing, years of life lost, and mortality: A cross-sectional study using clustering in the UK Clinical Practice Research Datalink. PLoS Med. 2023, 20, e1004300. [Google Scholar] [CrossRef] [PubMed]
- Herrett, E.; Gallagher, A.M.; Bhaskaran, K.; Forbes, H.; Mathur, R.; van Staa, T.; Smeeth, L. Data Resource Profile: Clinical Practice Research Datalink (CPRD). Int. J. Epidemiol. 2015, 44, 827–836. [Google Scholar] [CrossRef]
- Multiply. Codelist for 204 Conditions. Available online: https://github.com/Fabiola-Eto/MULTIPLY-Initiative/tree/main/MULTIPLY_Readv2_medcode_CPRD_GOLD/long-term-conditions (accessed on 30 June 2022).
- Ahmad, T.A.; Dayem Ullah, A.Z.; Chelala, C.; Gopal, D.P.; Eto, F.; Henkin, R.; Samuel, M.; Finer, S.; Taylor, S.J. Prevalence of multimorbidity in survivors of 28 cancer sites: An English nationwide cross-sectional study. Am. J. Cancer Res. 2024, 14, 880–896. [Google Scholar] [CrossRef]
- ONS. Office for National Statistics. Available online: https://www.ons.gov.uk/peoplepopulationandcommunity/birthsdeathsandmarriages/deaths (accessed on 15 July 2024).
- Nicholson, B.D.; Hamilton, W.; Koshiaris, C.; Oke, J.L.; Hobbs, F.D.R.; Aveyard, P. The association between unexpected weight loss and cancer diagnosis in primary care: A matched cohort analysis of 65,000 presentations. Br. J. Cancer 2020, 122, 1848–1856. [Google Scholar] [CrossRef]
- Abadie, A.; Athey, S.; Imbens, G.W.; Wooldridge, J.M. When should you adjust standard errors for clustering? Q. J. Econ. 2023, 138, 1–35. [Google Scholar] [CrossRef]
- Fischbacher, C.; Bhopal, R.; Patel, S.; White, M.; Unwin, N.; Alberti, K. Anaemia in Chinese, South Asian, and European populations in Newcastle upon Tyne: Cross sectional study. BMJ 2001, 322, 958–959. [Google Scholar] [CrossRef] [PubMed]
- Gaspar, B.L.; Sharma, P.; Das, R. Anemia in malignancies: Pathogenetic and diagnostic considerations. Hematology 2015, 20, 18–25. [Google Scholar] [CrossRef] [PubMed]
- Lane, D.A.; Lip, G.Y.H. Ethnic differences in hypertension and blood pressure control in the UK. QJM Int. J. Med. 2001, 94, 391–396. [Google Scholar] [CrossRef]
- Vigneri, P.; Frasca, F.; Sciacca, L.; Pandini, G.; Vigneri, R. Diabetes and cancer. Endocr. Relat. Cancer 2009, 16, 1103–1123. [Google Scholar] [CrossRef]
- Chowdhury, T.A. Diabetes and Cancer. QJM Int. J. Med. 2010, 103, 905–915. [Google Scholar] [CrossRef]
- Giovannucci, E.; Harlan, D.M.; Archer, M.C.; Bergenstal, R.M.; Gapstur, S.M.; Habel, L.A.; Pollak, M.; Regensteiner, J.G.; Yee, D. Diabetes and cancer: A consensus report. CA Cancer J. Clin. 2010, 60, 207–221. [Google Scholar] [CrossRef] [PubMed]
- Wojciechowska, J.; Krajewski, W.; Bolanowski, M.; Kręcicki, T.; Zatoński, T. Diabetes and cancer: A review of current knowledge. Exp. Clin. Endocrinol. Diabetes 2016, 124, 263–275. [Google Scholar] [CrossRef]
- Wu, A.H.; Kurian, A.W.; Kwan, M.L.; John, E.M.; Lu, Y.; Keegan, T.H.; Gomez, S.L.; Cheng, I.; Shariff-Marco, S.; Caan, B.J. Diabetes and other comorbidities in breast cancer survival by race/ethnicity: The California Breast Cancer Survivorship Consortium (CBCSC). Cancer Epidemiol. Biomark. Prev. 2015, 24, 361–368. [Google Scholar] [CrossRef]
- Petrick, J.L.; Freedman, N.D.; Demuth, J.; Yang, B.; Van Den Eeden, S.K.; Engel, L.S.; McGlynn, K.A. Obesity, diabetes, serum glucose, and risk of primary liver cancer by birth cohort, race/ethnicity, and sex: Multiphasic health checkup study. Cancer Epidemiol. 2016, 42, 140–146. [Google Scholar] [CrossRef] [PubMed]
- Ashing, K.; Rosales, M.; Lai, L.; Hurria, A. Occurrence of comorbidities among African-American and Latina breast cancer survivors. J. Cancer Surviv. 2014, 8, 312–318. [Google Scholar] [CrossRef] [PubMed]
- Pinheiro, L.C.; Samuel, C.A.; Reeder-Hayes, K.E.; Wheeler, S.B.; Olshan, A.F.; Reeve, B.B. Understanding racial differences in health-related quality of life in a population-based cohort of breast cancer survivors. Breast Cancer Res. Treat. 2016, 159, 535–543. [Google Scholar] [CrossRef]
- Ashing, K.T.; Lai, L.; Meyers, E.; Serrano, M.; George, M. Exploring the association between diabetes and breast cancer morbidity: Considerations for quality care improvements among Latinas. Int. J. Qual. Health Care 2020, 32, 120–125. [Google Scholar] [CrossRef]
- Penedo, F.J.; Dahn, J.R.; Shen, B.J.; Schneiderman, N.; Antoni, M.H. Ethnicity and determinants of quality of life after prostate cancer treatment. Urology 2006, 67, 1022–1027. [Google Scholar] [CrossRef]
- Butow, P.N.; Aldridge, L.; Bell, M.L.; Sze, M.; Eisenbruch, M.; Jefford, M.; Schofield, P.; Girgis, A.; King, M.; Duggal-Beri, P.; et al. Inferior health-related quality of life and psychological well-being in immigrant cancer survivors: A population-based study. Eur. J. Cancer 2013, 49, 1948–1956. [Google Scholar] [CrossRef]
- Janz, N.K.; Mujahid, M.S.; Hawley, S.T.; Griggs, J.J.; Alderman, A.; Hamilton, A.S.; Graff, J.; Katz, S.J. Racial/ethnic differences in quality of life after diagnosis of breast cancer. J. Cancer Surviv. 2009, 3, 212–222. [Google Scholar] [CrossRef]
- Atere-Roberts, J. Racial and ethnic disparities in health status, chronic conditions, and behavioral risk factors among prostate cancer survivors, United States, 2015. Prev. Chronic Dis. 2021, 18, E39. [Google Scholar] [CrossRef] [PubMed]
- Teagle, W.L.; Norris, E.T.; Rishishwar, L.; Nagar, S.D.; Jordan, I.K.; Mariño-Ramírez, L. Comorbidities and ethnic health disparities in the UK biobank. JAMIA Open 2022, 5, ooac057. [Google Scholar] [CrossRef]
- Edwards, B.K.; Noone, A.-M.; Mariotto, A.B.; Simard, E.P.; Boscoe, F.P.; Henley, S.J.; Jemal, A.; Cho, H.; Anderson, R.N.; Kohler, B.A.; et al. Annual Report to the Nation on the status of cancer, 1975–2010, featuring prevalence of comorbidity and impact on survival among persons with lung, colorectal, breast, or prostate cancer. Cancer 2014, 120, 1290–1314. [Google Scholar] [CrossRef] [PubMed]
- Lei, F.; Zheng, Y.; Li, C.-C. Health Disparities Across Lung Cancer Continuum Among Asian Americans: A Systematic Review. J. Immigr. Minor. Health 2022, 24, 526–545. [Google Scholar] [CrossRef]
- MULTIPLY, S.t. Operationalisation of Multimorbidity. Available online: https://github.com/Fabiola-Eto/MULTIPLY-Initiative/blob/main/METHODS.md (accessed on 15 May 2022).
- Herrett, E.; Thomas, S.L.; Schoonen, W.M.; Smeeth, L.; Hall, A.J. Validation and validity of diagnoses in the General Practice Research Database: A systematic review. Br. J. Clin. Pharmacol. 2010, 69, 4–14. [Google Scholar] [CrossRef]
- Arhi, C.S.; Bottle, A.; Burns, E.M.; Clarke, J.M.; Aylin, P.; Ziprin, P.; Darzi, A. Comparison of cancer diagnosis recording between the Clinical Practice Research Datalink, Cancer Registry and Hospital Episodes Statistics. Cancer Epidemiol. 2018, 57, 148–157. [Google Scholar] [CrossRef] [PubMed]
- Zhu, Y.; Edwards, D.; Mant, J.; Payne, R.A.; Kiddle, S. Characteristics, service use and mortality of clusters of multimorbid patients in England: A population-based study. BMC Med. 2020, 18, 78. [Google Scholar] [CrossRef]
- Shiekh, S.I.; Harley, M.; Ghosh, R.E.; Ashworth, M.; Myles, P.; Booth, H.P.; Axson, E.L. Completeness, agreement, and representativeness of ethnicity recording in the United Kingdom’s Clinical Practice Research Datalink (CPRD) and linked Hospital Episode Statistics (HES). Popul. Health Metr. 2023, 21, 3. [Google Scholar] [CrossRef]
- James, D.; Bull, A. Information on death certificates: Cause for concern? J. Clin. Pathol. 1996, 49, 213–216. [Google Scholar] [CrossRef]
- Dickman, P.W.; Adami, H.O. Interpreting trends in cancer patient survival. J. Intern. Med. 2006, 260, 103–117. [Google Scholar] [CrossRef]
- Sarfati, D.; Blakely, T.; Pearce, N. Measuring cancer survival in populations: Relative survival vs cancer-specific survival. Int. J. Epidemiol. 2010, 39, 598–610. [Google Scholar] [CrossRef] [PubMed]
- Crooks, C.J.; West, J.; Card, T.R. A comparison of the recording of comorbidity in primary and secondary care by using the Charlson Index to predict short-term and long-term survival in a routine linked data cohort. BMJ Open 2015, 5, e007974. [Google Scholar] [CrossRef] [PubMed]
- Robbins, A.S.; Whittemore, A.S.; Thom, D.H. Differences in socioeconomic status and survival among white and black men with prostate cancer. Am. J. Epidemiol. 2000, 151, 409–416. [Google Scholar] [CrossRef]
- Evans, S.; Metcalfe, C.; Ibrahim, F.; Persad, R.; Ben-Shlomo, Y. Investigating black-white differences in prostate cancer prognosis: A systematic review and meta-analysis. Int. J. Cancer 2008, 123, 430–435. [Google Scholar] [CrossRef] [PubMed]
- Watkinson, R.E.; Sutton, M.; Turner, A.J. Ethnic inequalities in health-related quality of life among older adults in England: Secondary analysis of a national cross-sectional survey. Lancet Public Health 2021, 6, e145–e154. [Google Scholar] [CrossRef]
- Mercer, S.W.; Zhou, Y.; Humphris, G.M.; McConnachie, A.; Bakhshi, A.; Bikker, A.; Higgins, M.; Little, P.; Fitzpatrick, B.; Watt, G.C. Multimorbidity and socioeconomic deprivation in primary care consultations. Ann. Fam. Med. 2018, 16, 127–131. [Google Scholar] [CrossRef]
- Martins, T.; Abel, G.; Ukoumunne, O.C.; Mounce, L.T.A.; Price, S.; Lyratzopoulos, G.; Chinegwundoh, F.; Hamilton, W. Ethnic inequalities in routes to diagnosis of cancer: A population-based UK cohort study. Br. J. Cancer 2022, 127, 863–871. [Google Scholar] [CrossRef]
- Pollack, L.A.; Greer, G.E.; Rowland, J.H.; Miller, A.; Doneski, D.; Coughlin, S.S.; Stovall, E.; Ulman, D. Cancer survivorship: A new challenge in comprehensive cancer control. Cancer Causes Control. 2005, 16, 51–59. [Google Scholar] [CrossRef]
- Gathani, T.; Chaudhry, A.; Chagla, L.; Chopra, S.; Copson, E.; Purushotham, A.; Vidya, R.; Cutress, R. Ethnicity and breast cancer in the UK: Where are we now? Eur. J. Surg. Oncol. 2021, 47, 2978–2981. [Google Scholar] [CrossRef]
- Stirbu, I.; Kunst, A.; Mielck, A.; Mackenbach, J. Educational inequalities in utilization of preventive services among elderly in Europe. In Tackling Health Inequalities in Europe: An Integrated Approach EUROTHINE. Final Report; Department of Public Health, University Medical Center Rotterdam: Rotterdam, The Netherlands, 2007; pp. 483–499. [Google Scholar]
- Moser, K.; Patnick, J.; Beral, V. Inequalities in reported use of breast and cervical screening in Great Britain: Analysis of cross sectional survey data. BMJ 2009, 338, b2025. [Google Scholar] [CrossRef]
- Palència, L.; Espelt, A.; Rodríguez-Sanz, M.; Puigpinós, R.; Pons-Vigués, M.; Pasarín, M.I.; Spadea, T.; Kunst, A.E.; Borrell, C. Socio-economic inequalities in breast and cervical cancer screening practices in Europe: Influence of the type of screening program. Int. J. Epidemiol. 2010, 39, 757–765. [Google Scholar] [CrossRef] [PubMed]
- Spadea, T.; Bellini, S.; Kunst, A.; Stirbu, I.; Costa, G. The impact of interventions to improve attendance in female cancer screening among lower socioeconomic groups: A review. Prev. Med. 2010, 50, 159–164. [Google Scholar] [CrossRef] [PubMed]
- NHS England. Cancer Alliances—Improving Care Locally. Available online: https://www.england.nhs.uk/cancer/cancer-alliances-improving-care-locally/ (accessed on 20 December 2024).

| Characteristics (n, %) | White (n = 320,413; 96.2%) | Asian (n = 5379; 1.61%) | Black or Black British (n = 3539; 1.06%) | Other (n = 2840; 0.32%) | Mixed (n = 1055; 0.85%) |
|---|---|---|---|---|---|
| Sex | |||||
| Female | 180,832 (56.4%) | 3247 (60.4%) | 1940 (54.8%) | 1728 (60.8%) | 658 (62.4%) |
| Male | 139,581 (43.6%) | 2132 (39.6%) | 1599 (45.2%) | 1112 (39.2%) | 397 (37.6%) |
| Age groups, years | |||||
| (18,30] | 809 (0.3%) | 33 (0.6%) | 15 (0.4%) | 17 (0.6%) | 8 (0.8%) |
| (30,45] | 13,155 (4.1%) | 612 (11.4%) | 335 (9.5%) | 306 (10.8%) | 177 (16.8%) |
| (45,60] | 42,181 (13.2%) | 1240 (23.1%) | 1079 (30.5%) | 686 (24.2%) | 308 (29.2%) |
| (60,75] | 101,532 (31.7%) | 1947 (36.2%) | 1025 (29.0%) | 1019 (35.9%) | 307 (29.1%) |
| (75,90] | 131,497 (41.0%) | 1415 (26.3%) | 988 (27.9%) | 684 (24.1%) | 216 (20.5%) |
| 90+ | 31,239 (9.7%) | 132 (2.4%) | 97 (2.7%) | 128 (4.5%) | 39 (3.7%) |
| IMD (quintiles) | |||||
| Q1 (least deprived) | 84,291 (26.3%) | 1087 (20.2%) | 239 (6.8%) | 658 (23.2%) | 193 (18.3%) |
| Q2 | 76,334 (23.8%) | 1118 (20.8%) | 371 (10.5%) | 550 (19.4%) | 196 (18.6%) |
| Q3 | 67,834 (21.2%) | 1173 (21.8%) | 600 (17.0%) | 554 (19.5%) | 218 (20.7%) |
| Q4 | 52,990 (16.5%) | 1051 (19.5%) | 1043 (29.5%) | 574 (20.2%) | 238 (22.6%) |
| Q5 (most deprived) | 38,964 (12.2%) | 950 (17.7%) | 1286 (36.3%) | 504 (17.7%) | 210 (19.9%) |
| Smoking status | |||||
| Non-smoker | 162,934 (50.9%) | 4140 (77.0%) | 2443 (69.0%) | 1701 (59.9%) | 616 (58.4%) |
| Smoker | 48,797 (15.2%) | 552 (10.3%) | 475 (13.4%) | 492 (17.3%) | 200 (19.0%) |
| Former smoker | 108,682 (33.9%) | 687 (12.8%) | 621 (17.5%) | 647 (22.8%) | 239 (22.7%) |
| Death | |||||
| Age at death (mean, SD) | 80.7 (±11.6) | 72.1 (±13.6) | 71.8 (±14.8) | 74.2 (±15.2) | 70.8 (±15.5) |
| Premature death (Death before age 75) | 24,883 (7.8%) | 491 (9.1%) | 352 (9.9%) | 233 (8.2%) | 87 (8.2%) |
| Cancer site | |||||
| Breast | 52,133 (16.3%) | 1354 (25.2%) | 738 (20.9%) | 625 (22.0%) | 242 (22.9%) |
| Prostate | 28,157 (8.8%) | 480 (8.9%) | 812 (22.9%) | 185 (6.5%) | 109 (10.3%) |
| Colorectal | 23,049 (7.2%) | 430 (8.0%) | 250 (7.1%) | 206 (7.3%) | 73 (6.9%) |
| Bladder | 14,439 (4.5%) | 251 (4.7%) | 93 (2.6%) | 121 (4.3%) | 39 (3.7%) |
| Cervical | 13,916 (4.3%) | 204 (3.8%) | 219 (6.2%) | 190 (6.7%) | 105 (10.0%) |
| Lung | 6938 (2.2%) | 168 (3.1%) | 74 (2.1%) | 67 (2.4%) | 24 (2.3%) |
| All other cancers | 181,781 (56.7%) | 2922 (54.3%) | 1353 (38.2%) | 1445 (50.9%) | 463 (43.9%) |
| Number of comorbidities (n, %) | |||||
| 0–1 | 9841 (3.1%) | 230 (4.3%) | 160 (4.5%) | 194 (6.8%) | 61 (5.8%) |
| 2 | 24,034 (7.5%) | 558 (10.4%) | 375 (10.6%) | 384 (13.5%) | 136 (12.9%) |
| 3 | 32,535 (10.2%) | 651 (12.1%) | 451 (12.7%) | 415 (14.6%) | 170 (16.1%) |
| 4 | 36,156 (11.3%) | 637 (11.8%) | 461 (13.0%) | 366 (12.9%) | 136 (12.9%) |
| 5 or more | 36,040 (11.2%) | 609 (11.3%) | 425 (12.0%) | 344 (12.1%) | 125 (11.8%) |
Disclaimer/Publisher’s Note: The statements, opinions and data contained in all publications are solely those of the individual author(s) and contributor(s) and not of MDPI and/or the editor(s). MDPI and/or the editor(s) disclaim responsibility for any injury to people or property resulting from any ideas, methods, instructions or products referred to in the content. |
© 2025 by the authors. Licensee MDPI, Basel, Switzerland. This article is an open access article distributed under the terms and conditions of the Creative Commons Attribution (CC BY) license (https://creativecommons.org/licenses/by/4.0/).
Share and Cite
Ahmad, T.; Ullah, A.Z.M.D.; Chelala, C.; Taylor, S.J.C. Ethnic and Socio-Economic Variations in Comorbidity and Mortality in Cancer Survivors: A UK Population-Based Observational Study. Cancers 2025, 17, 983. https://doi.org/10.3390/cancers17060983
Ahmad T, Ullah AZMD, Chelala C, Taylor SJC. Ethnic and Socio-Economic Variations in Comorbidity and Mortality in Cancer Survivors: A UK Population-Based Observational Study. Cancers. 2025; 17(6):983. https://doi.org/10.3390/cancers17060983
Chicago/Turabian StyleAhmad, Tahania, Abu Z. M. Dayem Ullah, Claude Chelala, and Stephanie J. C. Taylor. 2025. "Ethnic and Socio-Economic Variations in Comorbidity and Mortality in Cancer Survivors: A UK Population-Based Observational Study" Cancers 17, no. 6: 983. https://doi.org/10.3390/cancers17060983
APA StyleAhmad, T., Ullah, A. Z. M. D., Chelala, C., & Taylor, S. J. C. (2025). Ethnic and Socio-Economic Variations in Comorbidity and Mortality in Cancer Survivors: A UK Population-Based Observational Study. Cancers, 17(6), 983. https://doi.org/10.3390/cancers17060983