
Investigating Intensity and Percentage of p53 Nuclear Expression in Prostate Cancer: Findings from a Cohort of U.S. Military Veterans

 , , , , and
Simple Summary
Abstract
1. Introduction
2. Methods and Materials
2.1. Patient Selection
2.2. Tumor Tissue Selection
2.3. Immunohistochemistry
2.4. Mutational Analysis
2.5. Statistical Analysis
3. Results
4. Discussion
5. Conclusions
Author Contributions
Funding
Institutional Review Board Statement
Informed Consent Statement
Data Availability Statement
Acknowledgments
Conflicts of Interest
References
- Siegel, R.L.; Miller, K.D.; Wagle, N.S.; Jemal, A. Cancer statistics, 2023. CA Cancer J. Clin. 2023, 73, 17–48. [Google Scholar] [CrossRef] [PubMed]
- Hamdy, F.C.; Donovan, J.L.; Lane, J.A.; Metcalfe, C.; Davis, M.; Turner, E.L.; Martin, R.M.; Young, G.J.; Walsh, E.I.; Bryant, R.J.; et al. Fifteen-Year Outcomes after Monitoring, Surgery, or Radiotherapy for Prostate Cancer. N. Engl. J. Med. 2023, 388, 1547–1558. [Google Scholar] [CrossRef] [PubMed]
- Litwin, M.S.; Tan, H.-J. The Diagnosis and Treatment of Prostate Cancer: A Review. JAMA 2017, 317, 2532–2542. [Google Scholar] [CrossRef]
- Nagata, M.; Tanimoto, T.; Kami, M. Quality-of-life effects of prostate-specific antigen screening. N. Engl. J. Med. 2012, 367, 1861–1862. [Google Scholar] [CrossRef]
- Farha, M.W.; Salami, S.S. Biomarkers for prostate cancer detection and risk stratification. Ther. Adv. Urol. 2022, 14, 17562872221103988. [Google Scholar] [CrossRef]
- Chen, J.-Y.; Wang, P.-Y.; Liu, M.-Z.; Lyu, F.; Ma, M.-W.; Ren, X.-Y.; Gao, X.-S. Biomarkers for Prostate Cancer: From Diagnosis to Treatment. Diagnostics 2023, 13, 3350. [Google Scholar] [CrossRef]
- Ozaki, T.; Nakagawara, A. Role of p53 in Cell Death and Human Cancers. Cancers 2011, 3, 994–1013. [Google Scholar] [CrossRef]
- Olivier, M.; Hollstein, M.; Hainaut, P. TP53 mutations in human cancers: Origins, consequences, and clinical use. Cold Spring Harb. Perspect. Biol. 2010, 2, a001008. [Google Scholar] [CrossRef]
- Quigley, D.A.; Dang, H.X.; Zhao, S.G.; Lloyd, P.; Aggarwal, R.; Alumkal, J.J.; Foye, A.; Kothari, V.; Perry, M.D.; Bailey, A.M.; et al. Genomic Hallmarks and Structural Variation in Metastatic Prostate Cancer. Cell 2018, 174, 758–769. [Google Scholar] [CrossRef]
- Robinson, D.; Van Allen, E.M.; Wu, Y.-M.; Schultz, N.; Lonigro, R.J.; Mosquera, J.-M.; Montgomery, B.; Taplin, M.-E.; Pritchard, C.C.; Attard, G.; et al. Integrative clinical genomics of advanced prostate cancer. Cell 2015, 161, 1215–1228. [Google Scholar] [CrossRef]
- Cancer Genome Atlas Research Network. The Molecular Taxonomy of Primary Prostate Cancer. Cell 2015, 163, 1011–1025. [Google Scholar] [CrossRef] [PubMed]
- Mahal, B.A.; Alshalalfa, M.; Kensler, K.H.; Chowdhury-Paulino, I.; Kantoff, P.; Mucci, L.A.; Schaeffer, E.M.; Spratt, D.; Yamoah, K.; Nguyen, P.L.; et al. Racial Differences in Genomic Profiling of Prostate Cancer. N. Engl. J. Med. 2020, 383, 1083–1085. [Google Scholar] [CrossRef] [PubMed]
- Navone, N.M.; Troncoso, P.; Pisters, L.L.; Goodrow, T.L.; Palmer, J.L.; Nichols, W.W.; Eschenbach, A.C.V.; Conti, C.J. p53 Protein Accumulation and Gene Mutation in the Progression of Human Prostate Carcinoma. JNCI 1993, 85, 1657–1669. [Google Scholar] [CrossRef]
- Alimirah, F.; Panchanathan, R.; Chen, J.; Zhang, X.; Ho, S.-M.; Choubey, D. Expression of Androgen Receptor Is Negatively Regulated By p53. Neoplasia 2007, 9, 1152–1159. [Google Scholar] [CrossRef]
- Heidenberg, H.B.; Sesterhenn, I.A.; Gaddipati, J.P.; Weghorst, C.M.; Buzard, G.S.; Moul, J.W.; Srivastava, S. Alteration of the tumor suppressor gene p53 in a high fraction of hormone refractory prostate cancer. J. Urol. 1995, 154, 414–421. [Google Scholar] [CrossRef]
- Bauer, J.J.; Sesterhenn, I.A.; Mostofi, K.F.; McLeod, D.G.; Srivastava, S.; Moul, J.W. p53 nuclear protein expression is an independent prognostic marker in clinically localized prostate cancer patients undergoing radical prostatectomy. Clin. Cancer Res. 1995, 1, 1295–1300. [Google Scholar]
- Moul, J.W.; Bettencourt, M.C.; Sesterhenn, I.A.; Mostofi, F.K.; McLeod, D.G.; Srivastava, S.; Bauer, J.J. Protein expression of p53, bcl-2, and KI-67 (MIB-1) as prognostic biomarkers in patients with surgically treated, clinically localized prostate cancer. Surgery 1996, 120, 159–166. [Google Scholar] [CrossRef]
- Bauer, J.J.; Sesterhenn, I.A.; Mostofi, F.K.; McLeod, D.G.; Srivastava, S.; Moul, J.W. Elevated levels of apoptosis regulator proteins p53 and bcl-2 are independent prognostic biomarkers in surgically treated clinically localized prostate cancer. J. Urol. 1996, 156, 1511–1516. [Google Scholar] [CrossRef]
- Nyquist, M.D.; Corella, A.; Coleman, I.; De Sarkar, N.; Kaipainen, A.; Ha, G.; Gulati, R.; Ang, L.; Chatterjee, P.; Lucas, J.; et al. Combined TP53 and RB1 Loss Promotes Prostate Cancer Resistance to a Spectrum of Therapeutics and Confers Vulnerability to Replication Stress. Cell Rep. 2020, 31, 107669. [Google Scholar] [CrossRef]
- Hamid, A.A.; Gray, K.P.; Shaw, G.; MacConaill, L.E.; Evan, C.; Bernard, B.; Loda, M.; Corcoran, N.M.; Van Allen, E.M.; Choudhury, A.D.; et al. Compound Genomic Alterations of TP53, PTEN, and RB1 Tumor Suppressors in Localized and Metastatic Prostate Cancer. Eur. Urol. 2019, 76, 89–97. [Google Scholar] [CrossRef]
- Maddah, M.M.; Hedayatizadeh-Omran, A.; Moosazadeh, M.; Alizadeh-Navaei, R. Evaluation of the Prognostic Role of TP53 Gene Mutations in Prostate Cancer Outcome: A Systematic Review and Meta-Analysis. Clin. Genitourin Cancer 2024, 22, 102226. [Google Scholar] [CrossRef] [PubMed]
- Guedes, L.B.; Almutairi, F.; Haffner, M.C.; Rajoria, G.; Liu, Z.; Klimek, S.; Zoino, R.; Yousefi, K.; Sharma, R.; De Marzo, A.M.; et al. Analytic, Preanalytic, and Clinical Validation of p53 IHC for Detection of TP53 Missense Mutation in Prostate Cancer. Clin. Cancer Res. 2017, 23, 4693–4703. [Google Scholar] [CrossRef] [PubMed]
- Kluth, M.; Harasimowicz, S.; Burkhardt, L.; Grupp, K.; Krohn, A.; Prien, K.; Gjoni, J.; Haß, T.; Galal, R.; Graefen, M.; et al. Clinical significance of different types of p53 gene alteration in surgically treated prostate cancer. Int. J. Cancer 2014, 135, 1369–1380. [Google Scholar] [CrossRef] [PubMed]
- Stopsack, K.H.; Salles, D.C.; Vaselkiv, J.B.; Grob, S.T.; Mucci, L.A.; Lotan, T.L. p53 Immunohistochemistry to Identify Very High-risk Primary Prostate Cancer: A Prospective Cohort Study with Three Decades of Follow-up. Eur. Urol. Oncol. 2023, 6, 110–112. [Google Scholar] [CrossRef]
- Hall, M.C.; Navone, N.M.; Troncoso, P.; Pollack, A.; Zagars, G.K.; von Eschenbach, A.C.; Conti, C.J.; Chung, L.W. Frequency and characterization of p53 mutations in clinically localized prostate cancer. Urology 1995, 45, 470–475. [Google Scholar] [CrossRef]
- Gesztes, W.; Schafer, C.; Young, D.; Fox, J.; Jiang, J.; Chen, Y.; Kuo, H.-C.; Mwamukonda, K.B.; Dobi, A.; Burke, A.P.; et al. Focal p53 protein expression and lymphovascular invasion in primary prostate tumors predict metastatic progression. Sci. Rep. 2022, 12, 5404. [Google Scholar] [CrossRef]
- Orellana, T.J.; Kim, H.; Beriwal, S.; Bhargava, R.; Berger, J.; Buckanovich, R.J.; Coffman, L.G.; Courtney-Brooks, M.; Mahdi, H.; Olawaiye, A.B.; et al. Cost-effectiveness analysis of tumor molecular classification in high-risk early-stage endometrial cancer. Gynecol Oncol. 2022, 164, 129–135. [Google Scholar] [CrossRef]
- Höhn, A.K.; Brambs, C.E.; Hiller, G.G.R.; May, D.; Schmoeckel, E.; Horn, L.-C. 2020 WHO Classification of Female Genital Tumors. Geburtshilfe Frauenheilkd. 2021, 81, 1145–1153. [Google Scholar] [CrossRef]
- Vermij, L.; Léon-Castillo, A.; Singh, N.; Powell, M.E.; Edmondson, R.J.; Genestie, C.; Khaw, P.; Pyman, J.; McLachlin, C.M.; Ghatage, P.; et al. p53 immunohistochemistry in endometrial cancer: Clinical and molecular correlates in the PORTEC-3 trial. Mod. Pathol. 2022, 35, 1475–1483. [Google Scholar] [CrossRef]
- Quinn, D.I.; Stricker, P.D.; Kench, J.G.; Grogan, J.; Haynes, A.-M.; Henshall, S.M.; Grygiel, J.J.; Delprado, W.; Turner, J.J.; Horvath, L.G.; et al. p53 nuclear accumulation as an early indicator of lethal prostate cancer. Br. J. Cancer 2019, 121, 578–583. [Google Scholar] [CrossRef]
- Schlomm, T.; Iwers, L.; Kirstein, P.; Jessen, B.; Köllermann, J.; Minner, S.; Passow-Drolet, A.; Mirlacher, M.; Milde-Langosch, K.; Graefen, M.; et al. Clinical significance of p53 alterations in surgically treated prostate cancers. Mod. Pathol. 2008, 21, 1371–1378. [Google Scholar] [CrossRef] [PubMed]
- Harmon, S.A.; Gesztes, W.; Young, D.; Mehralivand, S.; McKinney, Y.; Sanford, T.; Sackett, J.; Cullen, J.; Rosner, I.L.; Srivastava, S.; et al. Prognostic Features of Biochemical Recurrence of Prostate Cancer Following Radical Prostatectomy Based on Multiparametric MRI and Immunohistochemistry Analysis of MRI-guided Biopsy Specimens. Radiology 2021, 299, 613–623. [Google Scholar] [CrossRef] [PubMed]
- Cerami, E.; Gao, J.; Dogrusoz, U.; Gross, B.E.; Sumer, S.O.; Aksoy, B.A.; Jacobsen, A.; Byrne, C.J.; Heuer, M.L.; Larsson, E.; et al. The cBio cancer genomics portal: An open platform for exploring multidimensional cancer genomics data. Cancer Discov. 2012, 2, 401–404. [Google Scholar] [CrossRef] [PubMed]
- Kastenhuber, E.R.; Lowe, S.W. Putting p53 in Context. Cell 2017, 170, 1062–1078. [Google Scholar] [CrossRef]
- De Laere, B.; Oeyen, S.; Mayrhofer, M.; Whitington, T.; van Dam, P.-J.; Van Oyen, P.; Ghysel, C.; Ampe, J.; Ost, P.; Demey, W.; et al. TP53 Outperforms Other Androgen Receptor Biomarkers to Predict Abiraterone or Enzalutamide Outcome in Metastatic Castration-Resistant Prostate Cancer. Clin. Cancer Res. 2019, 25, 1766–1773. [Google Scholar] [CrossRef]
- Eastham, J.A.; Stapleton, A.M.; Gousse, A.E.; Timme, T.L.; Yang, G.; Slawin, K.M.; Wheeler, T.M.; Scardino, P.T.; Thompson, T.C. Association of p53 mutations with metastatic prostate cancer. Clin. Cancer Res. 1995, 1, 1111–1118. [Google Scholar]
- Griewe, G.L.; Dean, R.C.; Zhang, W.; Young, D.; Sesterhenn, I.A.; Shanmugam, N.; McLeod, D.G.; Moul, J.W.; Srivastava, S. p53 Immunostaining guided laser capture microdissection (p53-LCM) defines the presence of p53 gene mutations in focal regions of primary prostate cancer positive for p53 protein. Prostate Cancer Prostatic Dis. 2003, 6, 281–285. [Google Scholar] [CrossRef]
- Petrescu, A.; Mârzan, L.; Codreanu, O.; Niculescu, L. Immunohistochemical detection of p53 protein as a prognostic indicator in prostate carcinoma. Rom. J. Morphol. Embryol. 2006, 47, 143–146. [Google Scholar]
- Che, M.; DeSilvio, M.; Pollack, A.; Grignon, D.J.; Venkatesan, V.M.; Hanks, G.E.; Sandler, H.M. RTOG Prognostic value of abnormal p53 expression in locally advanced prostate cancer treated with androgen deprivation and radiotherapy: A study based on RTOG 9202. Int. J. Radiat. Oncol. Biol. Phys. 2007, 69, 1117–1123. [Google Scholar] [CrossRef]
- Stattin, P.; Damber, J.E.; Modig, H.; Bergh, A. Pretreatment p53 immunoreactivity does not infer radioresistance in prostate cancer patients. Int. J. Radiat. Oncol. Biol. Phys. 1996, 35, 885–889. [Google Scholar] [CrossRef]
- Verma, R.; Gupta, V.; Singh, J.; Verma, M.; Gupta, G.; Gupta, S.; Sen, R.; Ralli, M. Significance of p53 and ki-67 expression in prostate cancer. Urol. Ann. 2015, 7, 488–493. [Google Scholar] [CrossRef] [PubMed]
- Sasor, A.; Wagrowska-Danilewicz, M.; Danilewicz, M. Ki-67 antigen and P53 protein expression in benign and malignant prostatic lesions. Immunohistochemical quantitative study. Pol. J. Pathol. 2000, 51, 31–36. [Google Scholar] [PubMed]
- Stackhouse, G.B.; Sesterhenn, I.A.; Bauer, J.J.; Mostofi, F.K.; Connelly, R.R.; Srivastava, S.K.; Moul, J.W. p53 and bcl-2 immunohistochemistry in pretreatment prostate needle biopsies to predict recurrence of prostate cancer after radical prostatectomy. J. Urol. 1999, 162, 2040–2045. [Google Scholar] [CrossRef] [PubMed]
- Baptiste, N.; Prives, C. p53 in the cytoplasm: A question of overkill? Cell 2004, 116, 487–489. [Google Scholar] [CrossRef]
- Green, D.R.; Kroemer, G. Cytoplasmic functions of the tumour suppressor p53. Nature 2009, 458, 1127–1130. [Google Scholar] [CrossRef]
- Liu, W.; Zhang, Y.; Wei, S.; Bae, S.; Yang, W.-H.; Smith, G.J.; Mohler, J.L.; Fontham, E.T.H.; Bensen, J.T.; Sonpavde, G.P.; et al. A CD24-p53 axis contributes to African American prostate cancer disparities. Prostate 2020, 80, 609–618. [Google Scholar] [CrossRef]
- Powell, I.J.; Dyson, G.; Land, S.; Ruterbusch, J.; Bock, C.H.; Lenk, S.; Herawi, M.; Everson, R.; Giroux, C.N.; Schwartz, A.G.; et al. Genes associated with prostate cancer are differentially expressed in African American and European American men. Cancer Epidemiol Biomark. Prev. 2013, 22, 891–897. [Google Scholar] [CrossRef]
- Lindquist, K.J.; Paris, P.L.; Hoffmann, T.J.; Cardin, N.J.; Kazma, R.; Mefford, J.A.; Simko, J.P.; Ngo, V.; Chen, Y.; Levin, A.M.; et al. Mutational Landscape of Aggressive Prostate Tumors in African American Men. Cancer Res. 2016, 76, 1860–1868. [Google Scholar] [CrossRef]

| Overall n = 84 | p53 Absent (0), Light (1+) or Medium (2+) Intensity n = 66 | p53 Maximum Intensity (3+) n = 18 | p Value | |
|---|---|---|---|---|
| Mean age at diagnosis (STD) | 64.1 (7.48) | 63.3 (7.01) | 67.1 (8.59) | 0.0561 |
| Race/Ethnicity | 1.0000 | |||
| African American | 63 (75%) | 49 (74.2%) | 14 (77.8%) | |
| Caucasian | 20 (23.8%) | 16 (24.2%) | 4 (22.2%) | |
| Native Hawaiian | 1 (1.2%) | 1 (1.5%) | 0 (0%) | |
| D2-40 LVI (n = 42) | 0.0755 | |||
| Positive | 8 (19.1%) | 4 (12.5%) | 4 (40%) | |
| Negative | 34 (80.9%) | 28 (87.5%) | 6 (60%) | |
| Gleason Score | <0.001 | |||
| 3 + 3 (6) | 16 (19.1%) | 16 (24.2%) | 0 (0%) | |
| 3 + 4 (7) | 19 (22.6%) | 19 (28.8%) | 0 (0%) | |
| 4 + 3 (7) | 4 (4.8%) | 3 (4.6%) | 1 (5.6%) | |
| 3 + 5 (8) | 1 (1.2%) | 1 (1.5%) | 0 (0%) | |
| 4 + 4 (8) | 19 (22.6%) | 14 (21.2%) | 6 (27.8%) | |
| 4 + 5 (9) | 11 (13.1%) | 7 (10.6%) | 4 (22.2%) | |
| 5 + 4 (9) | 1 (1.2%) | 0 (0%) | 1 (5.6%) | |
| n/a (Metastatic deposits) | 13 (15.5%) | 6 (9.1%) | 7 (38.9%) | |
| Total Gleason Score | <0.001 | |||
| 6 | 16 (19.1%) | 16 (24.2%) | 0 (0%) | |
| 7 | 23 (27.4%) | 22 (33.3%) | 1 (5.6%) | |
| 8 | 20 (23.8%) | 15 (22.7%) | 5 (27.8%) | |
| 9 | 12 (14.3%) | 7 (10.6%) | 5 (27.8%) | |
| n/a (Metastatic deposits) | 13 (15.5%) | 6 (9.1%) | 7 (38.9%) | |
| Grade Group | <0.001 | |||
| Grade Group 1 | 16 (19.1%) | 16 (24.2%) | 0 (0%) | |
| Grade Group 2 | 19 (22.6%) | 19 (28.8%) | 0 (0%) | |
| Grade Group 3 | 4 (4.8%) | 3 (4.6%) | 1 (5.6%) | |
| Grade Group 4 | 20 (23.8%) | 15 (22.7%) | 5 (27.8%) | |
| Grade Group 5 | 12 (14.3%) | 7 (10.6%) | 5 (27.8%) | |
| n/a (Metastatic deposits) | 13 (15.5%) | 6 (9.1%) | 7 (38.9%) | |
| Median PSA at diagnosis (IQR) | 11.60 (6.35–73.60) | 8.30 (6.10–20.20) | 172 (26.19–700) | <0.001 |
| BCR | <0.001 | |||
| No | 34 (40.5%) | 33 (50%) | 1 (5.6%) | |
| Yes | 20 (23.8%) | 15 (22.7%) | 5 (27.8%) | |
| Unknown | 1 (1.2%) | 1 (1.5%) | 0 (0%) | |
| n/a | 29 (34.5%) | 17 (25.8%) | 12 (66.7%) | |
| Disease stage at time of diagnosis | <0.001 | |||
| Localized low risk (AJCC stage I) | 14 (16.7%) | 14 (21.2%) | 0 (0%) | |
| Locally advanced cohort (AJCC stage II and III) | 24 (28.6%) | 20 (30.3%) | 4 (22.2%) | |
| Metastatic cohort (AJCC stage IV) | 46 (54.8%) | 32 (48.5%) | 14 (77.8%) | |
| Type of specimen | ||||
| Core Biopsy | 50 (59.6%) | 45 (68.2%) | 5 (27.8%) | |
| Radical Prostatectomy | 14 (16.7%) | 11 (16.7%) | 3 (16.7%) | |
| TURP | 7 (8.3%) | 4 (6.1%) | 3 (16.7%) | |
| Distant Metastatic Deposits | 13 (15.5%) | 6 (9.1%) | 7 (38.9%) |
| Overall n = 84 | Non-Metastatic Disease n = 38 | Metastatic Disease n = 46 | p Value | |
|---|---|---|---|---|
| p53 nuclear intensity alone | <0.0001 | |||
| 3+ (maximum) intensity | 18 (21.4%) | 0 (0%) | 18 (39.1%) | |
| 0 (absent), 1+ (light) or 2+ (medium) intensity | 66 (78.6%) | 38 (100%) | 28 (60.9%) | |
| p53 nuclear combined score | 0.0146 | |||
| 3+ (maximum) intensity and >5% | 7 (8.3%) | 0 (0%) | 7 (15.2%) | |
| 0 (absent), 1+ (light) or 2+ (medium) intensity and ≤5% | 77 (91.7%) | 38 (100%) | 39 (84.8%) |
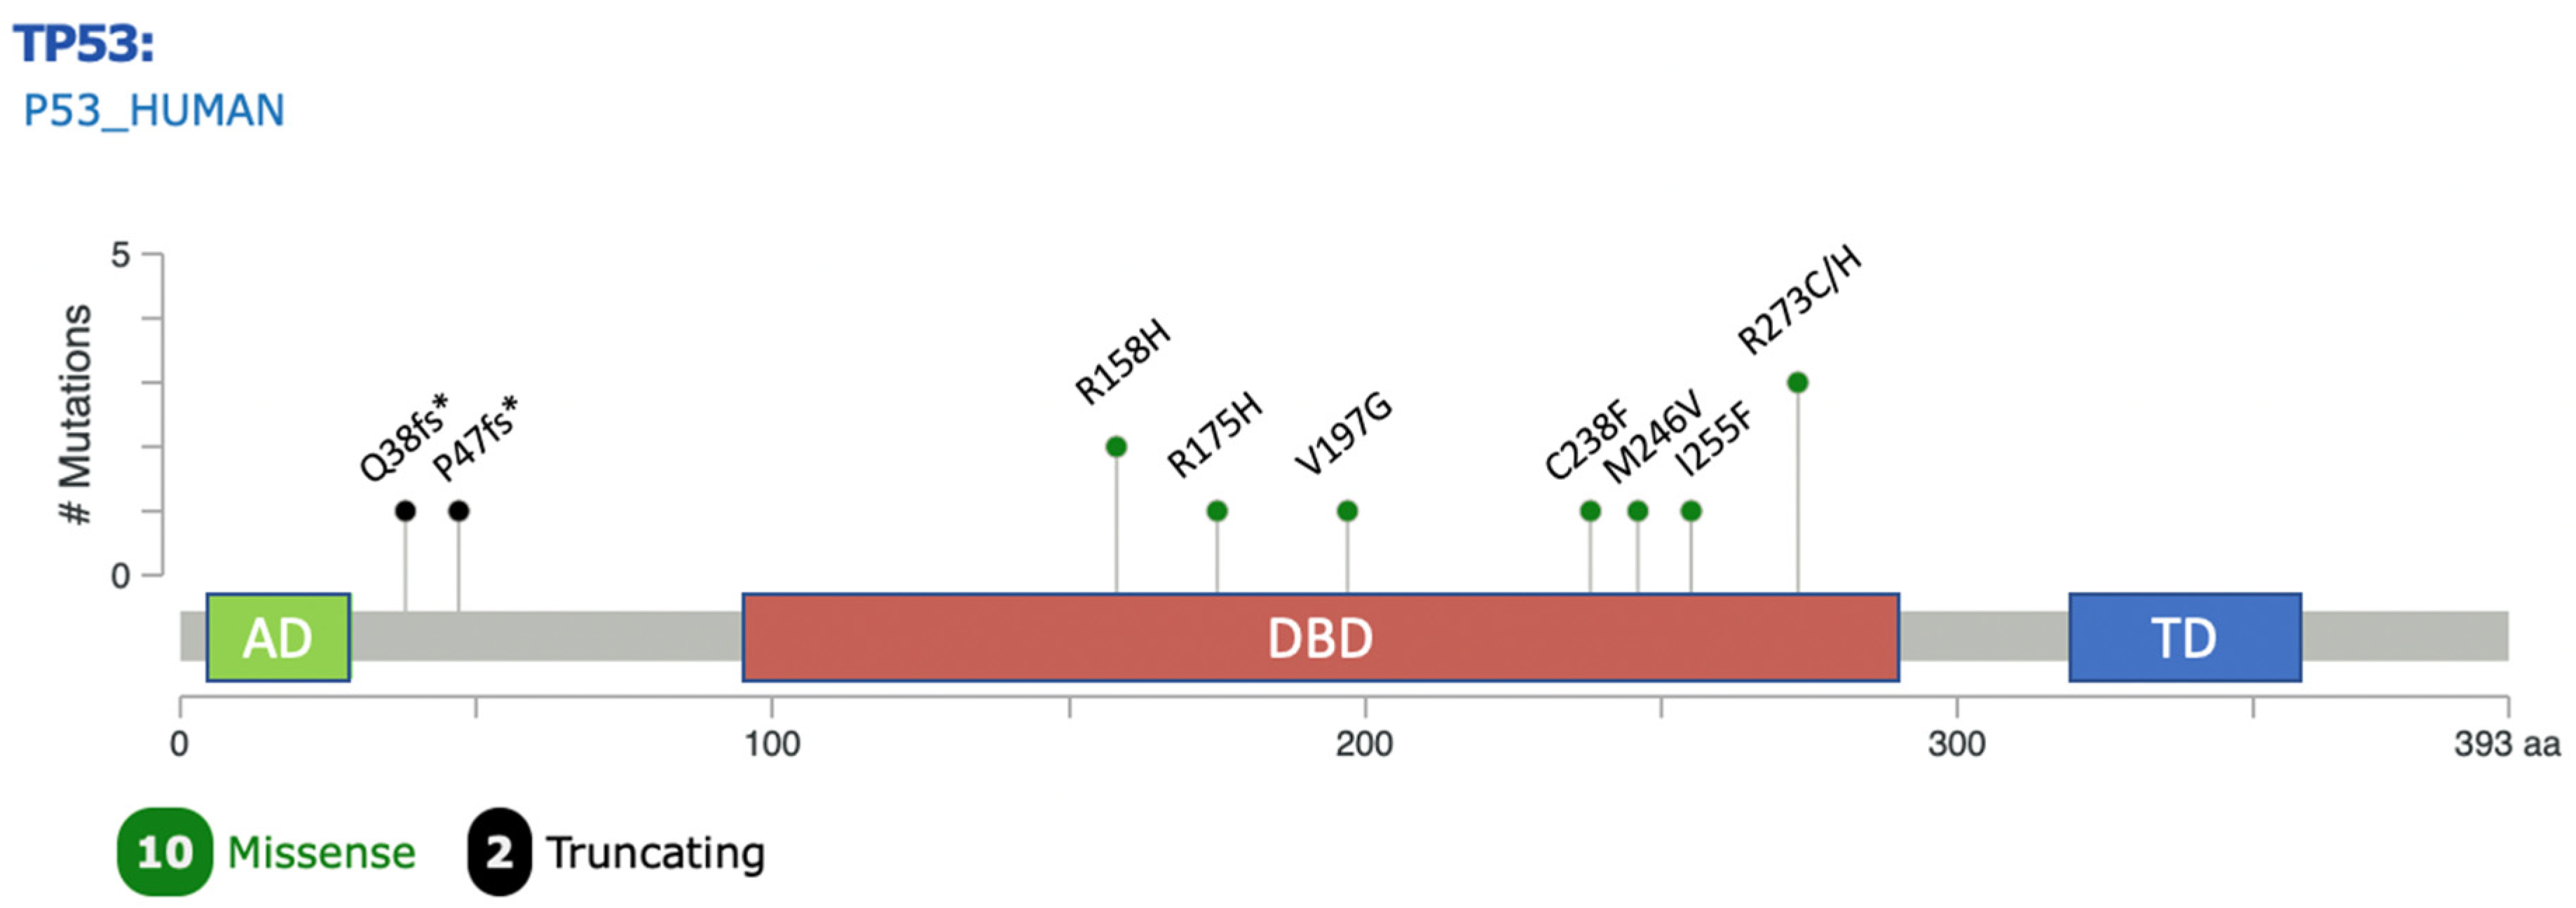
| No. | Disease Stage | Grade Group | Effect | Genomic Position | Nucleic Acid Alteration | Amino Acid Alteration | Location Within TP53 | Type | Clinical Significance (ClinVar) | VAF (%) | IHC |
|---|---|---|---|---|---|---|---|---|---|---|---|
| 1 | Metastatic | 4 | Missense variant | 17:7675088 | c.524G > A | p.R175H | DNA binding domain | SNV | Pathogenic or likely pathogenic | 13.2 | +3, <1% |
| 2 | Metastatic | 4 | Missense variant | 17:7674941 | c.590T > G | p.V197G | DNA binding domain | SNV | Uncertain significance | 83.7 | +3, >5% |
| 3 | Metastatic | 5 | Frameshift variant | 17:7676257 | c.112del | p.Q38fs * 6 | N-terminal domain (TAD) | Del | Pathogenic or likely pathogenic | 22.3 | 0 |
| 4 | Metastatic | 2 | Missense variant | 17:7673802 | c.818G > A | p.R273H | DNA binding domain | SNV | Pathogenic or likely pathogenic | 0.13 | 0 |
| 5 | Metastatic | n/a I | Frameshift variant | 17:7676229 | c.140del | p.P47fs * 76 | N-terminal domain(TAD) | Del | Pathogenic or likely pathogenic | 34.1 | 0 |
| 6 | Metastatic | n/a I | Missense variant | 17:7674250 | c.713G > T | p.C238F | DNA binding domain | SNV | Pathogenic or likely pathogenic | 64.7 | +3, >5% |
| 7 | Metastatic | 5 | Missense Variant Missense variant | 17:7673803 17:7675139 | c.817C > T c.473G > A | p.R273C p.R158H | DNA binding domain DNA binding domain | SNV SNV | Pathogenic or likely pathogenic (both) | 37 30 | +3, >5% |
| 8 | Metastatic | 4 | Missense variant | 17:7674200 | c.763A > T | p.I255F | DNA binding domain | SNV | Conflicting reports | 40.3 | +3, <1% |
| 9 | Metastatic | 4 | Missense Variant Missense variant | 17:7673803 17:7675139 | c.817C > T c.473G > A | p.R273C p.R158H | DNA binding domain DNA binding domain | SNV SNV | Pathogenic or likely pathogenic (both) | 32 28 | +3, >5% |
| 10 | Metastatic | n/a I | Missense variant | 17:7674227 | c.736A > G | p.M246V | DNA binding domain | SNV | Pathogenic or likely pathogenic | 44.8 | +3, >5% |
| Overall n = 29 | TP53 Mutation Detected | No TP53 Mutation Detected | p Value | |
|---|---|---|---|---|
| p53 nuclear intensity alone | <0.01 | |||
| 3+ (maximum) intensity | 13 (44.8%) | 7 | 6 | |
| (87.5%) | (28.6%) | |||
| 0 (absent), 1+ (light) or 2+ (medium) intensity | 16 (55.2%) | 1 | 15 | |
| (12.5%) | (71.4%) | |||
| p53 nuclear combined score | <0.01 | |||
| 3+ (maximum) intensity AND >5% | 6 | 5 | 1 | |
| (20.7%) | (62.5%) | (4.8%) | ||
| 0 (absent), 1+ (light) or 2+ (medium) intensity AND ≤5% | 23 | 3 | 20 | |
| (79.3%) | (37.5%) | (95.2%) |
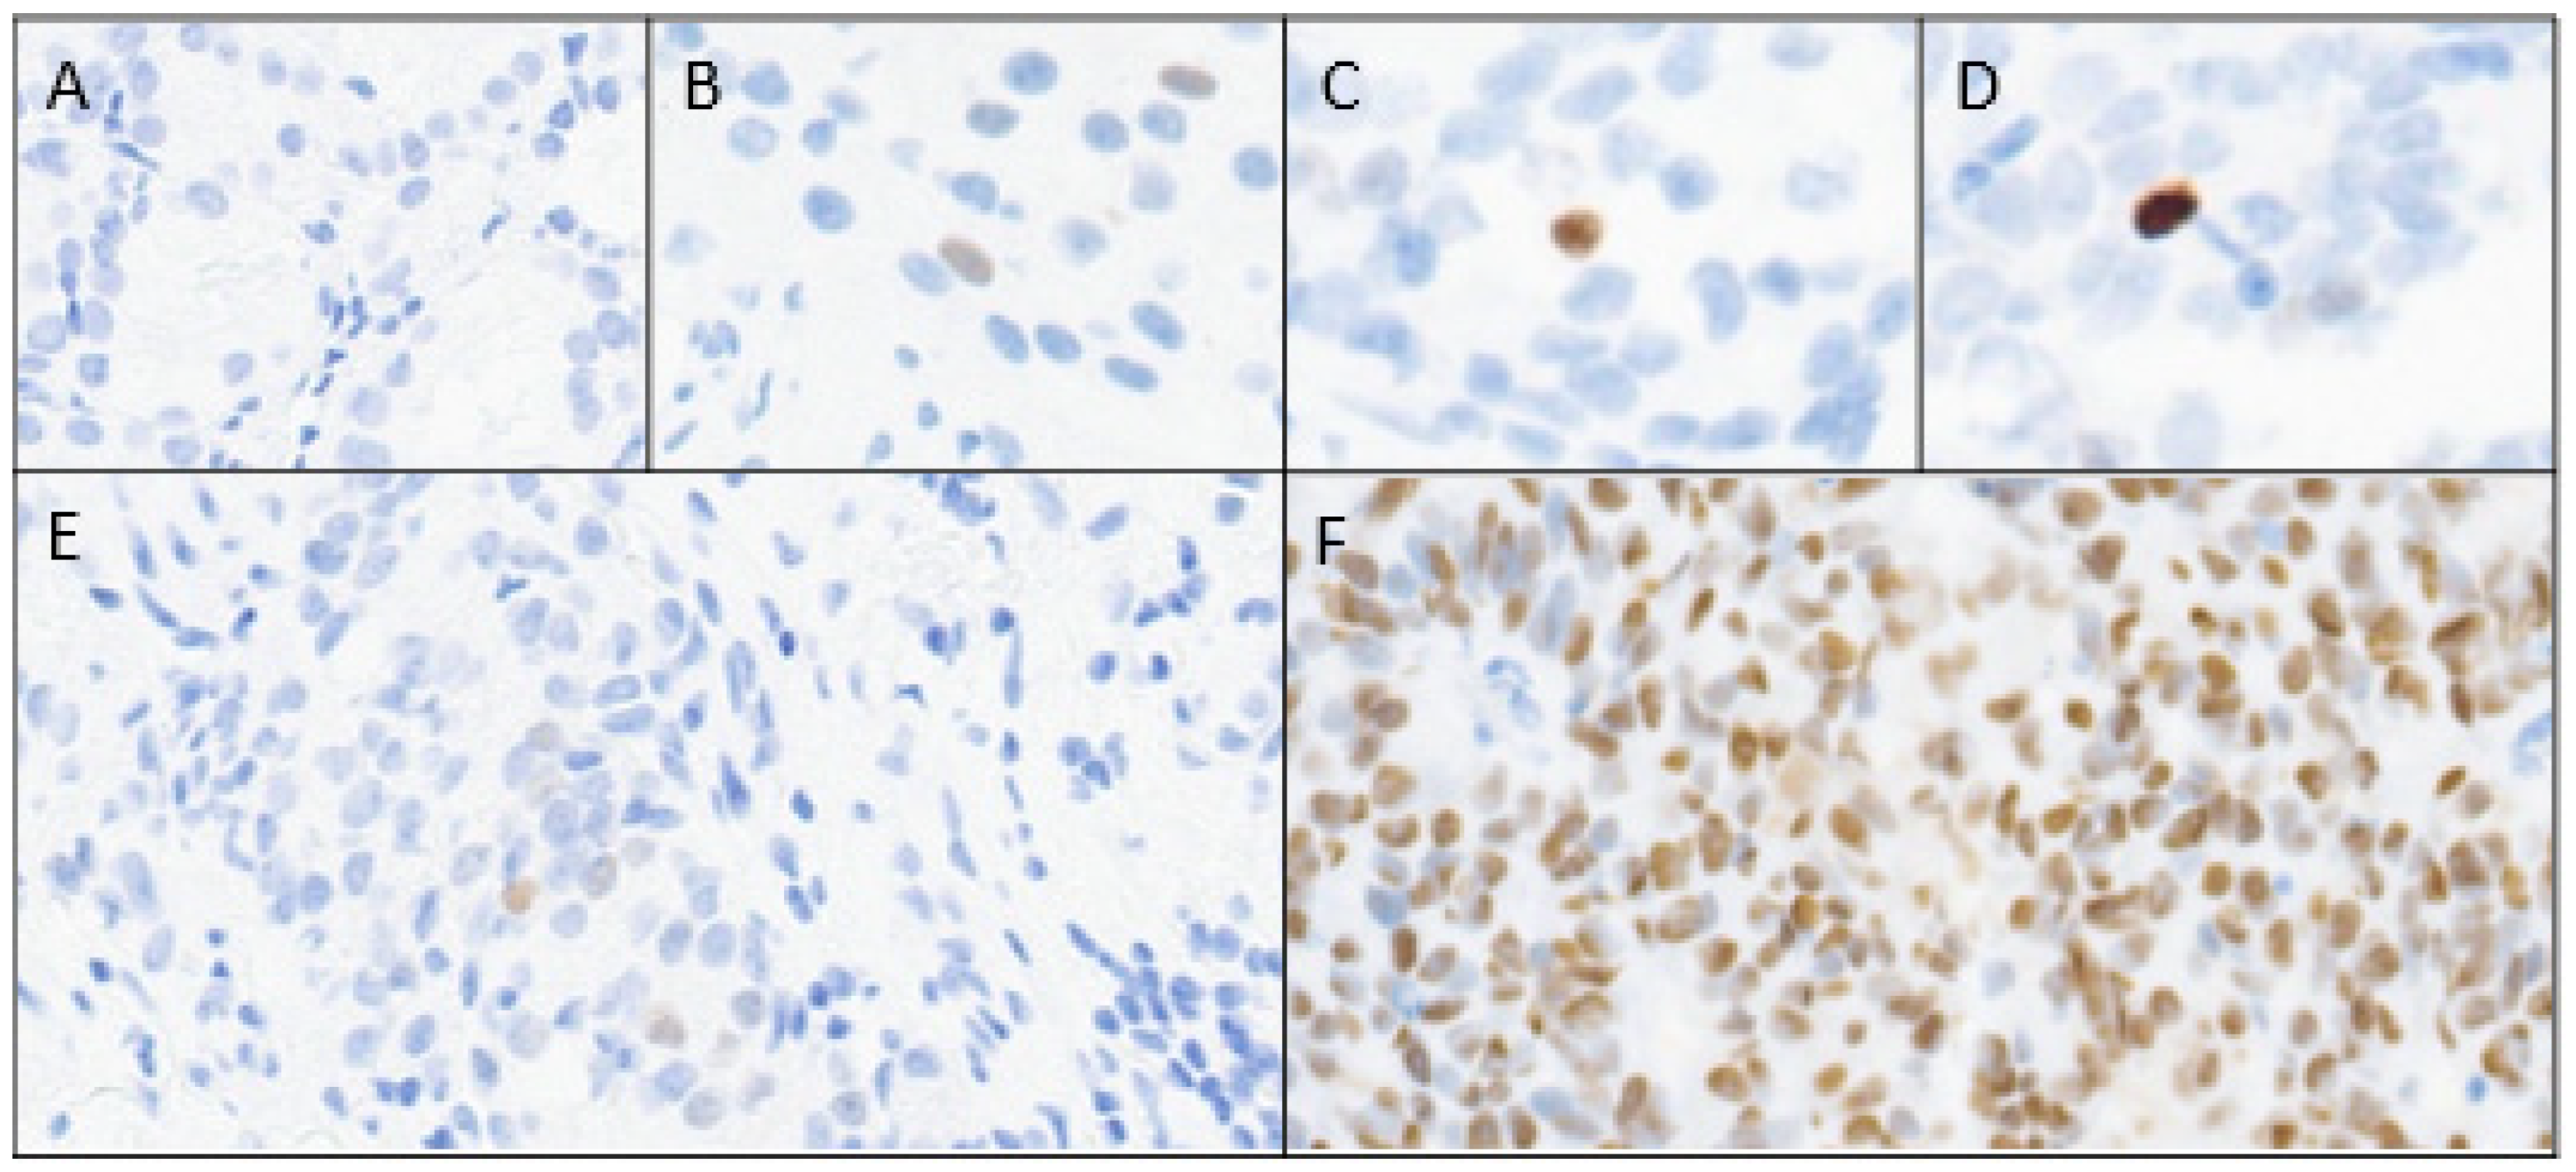
| (A) | |
| Characterizing p53 nuclear expression status in RP specimens | |
| Low expression | 1+ (light) or 2+ (medium) nuclear intensity AND ≤5% |
| Equivocal expression | 1+ (light) or 2+ (medium) nuclear intensity AND >5% |
| Overexpression | 3+ (maximum) nuclear intensity of any percent |
| (B) | |
| Characterizing p53 nuclear expression status in non-RP specimens * | |
| Low expression | 1+ (light) nuclear intensity |
| Equivocal expression | 2+ (medium) nuclear intensity |
| Overexpression | 3+ (maximum) nuclear intensity |
Disclaimer/Publisher’s Note: The statements, opinions and data contained in all publications are solely those of the individual author(s) and contributor(s) and not of MDPI and/or the editor(s). MDPI and/or the editor(s) disclaim responsibility for any injury to people or property resulting from any ideas, methods, instructions or products referred to in the content. |
© 2025 by the authors. Licensee MDPI, Basel, Switzerland. This article is an open access article distributed under the terms and conditions of the Creative Commons Attribution (CC BY) license (https://creativecommons.org/licenses/by/4.0/).
Share and Cite
Gesztes, W.R.; Lap, C.J.; Rajendran, R.; Dalivand, M.M.; Diao, G.; Liu, S.; Jain, M.; Nava, V.E. Investigating Intensity and Percentage of p53 Nuclear Expression in Prostate Cancer: Findings from a Cohort of U.S. Military Veterans. Cancers 2025, 17, 1004. https://doi.org/10.3390/cancers17061004
Gesztes WR, Lap CJ, Rajendran R, Dalivand MM, Diao G, Liu S, Jain M, Nava VE. Investigating Intensity and Percentage of p53 Nuclear Expression in Prostate Cancer: Findings from a Cohort of U.S. Military Veterans. Cancers. 2025; 17(6):1004. https://doi.org/10.3390/cancers17061004
Chicago/Turabian StyleGesztes, William R., Coen J. Lap, Rithika Rajendran, Maryam M. Dalivand, Guoqing Diao, Shanshan Liu, Maneesh Jain, and Victor E. Nava. 2025. "Investigating Intensity and Percentage of p53 Nuclear Expression in Prostate Cancer: Findings from a Cohort of U.S. Military Veterans" Cancers 17, no. 6: 1004. https://doi.org/10.3390/cancers17061004
APA StyleGesztes, W. R., Lap, C. J., Rajendran, R., Dalivand, M. M., Diao, G., Liu, S., Jain, M., & Nava, V. E. (2025). Investigating Intensity and Percentage of p53 Nuclear Expression in Prostate Cancer: Findings from a Cohort of U.S. Military Veterans. Cancers, 17(6), 1004. https://doi.org/10.3390/cancers17061004