

Residual Tumour at CT Scan Based on Radiologic Peritoneal Carcinomatosis Index After Optimal Cytoreduction in Advanced Ovarian Cancer: A True Prognostic Factor
 , , and
Simple Summary
Abstract
1. Introduction
2. Materials and Methods
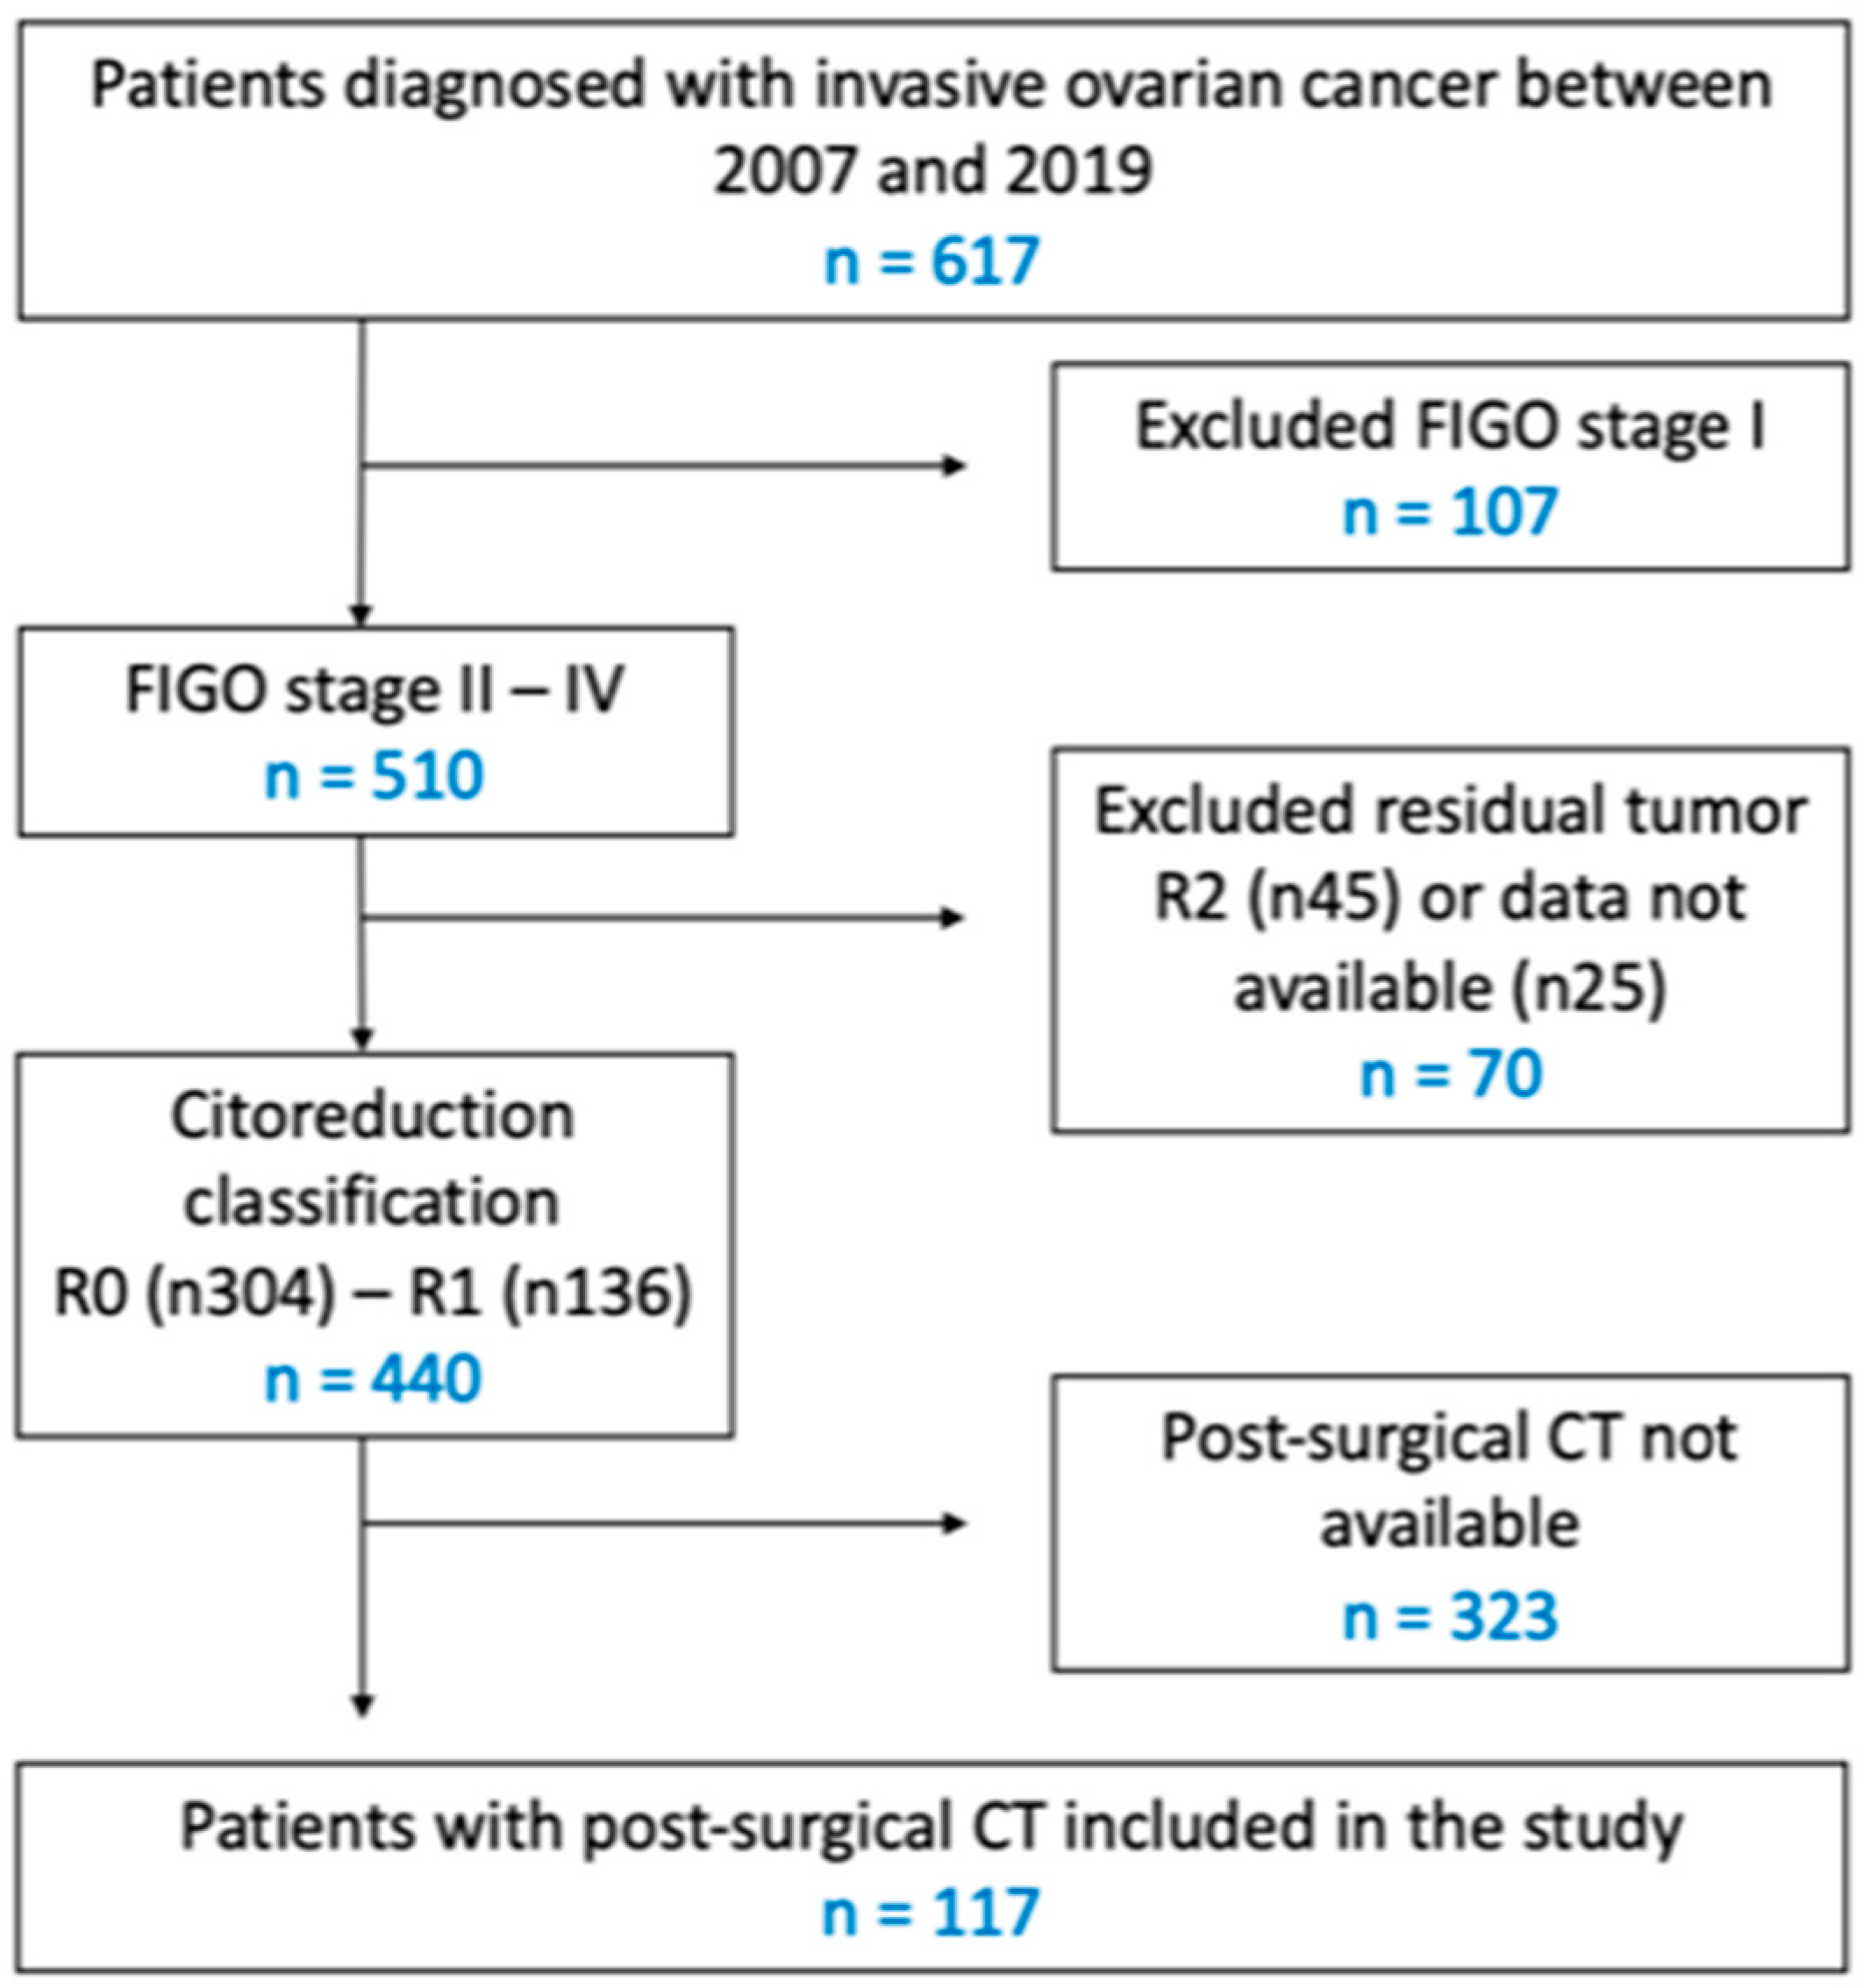
2.1. Eligibility
2.2. Data Collection
2.3. Image Analysis and Interpretation
2.4. Statistical Methods
3. Results
4. Discussion
4.1. Summary of Main Results
4.2. Results in the Context of the Published Literature
4.3. Strengths and Weaknesses
4.4. Implications for Practice and Future Research
5. Conclusions
Author Contributions
Funding
Institutional Review Board Statement
Informed Consent Statement
Data Availability Statement
Conflicts of Interest
Appendix A


| n (%)/Median (DS) | |
|---|---|
| Disease status | |
| Initial diagnosis | 105 (89.7) |
| Relapse | 12 (10.3) |
| Age | 55.4 (12.3) |
| BMI * | 25.5 (5.2) |
| Menopause | |
| Pre | 37 (31.6) |
| Post | 80 (68.4) |
| ECOG | |
| 0 | 89 (76.1) |
| 1 | 23 (19.7) |
| 2 | 5 (4.3) |
| CA 125 | 895.4 (1710.1) |
| Neoadjuvant chemotherapy | 29 (25.2) |
| n (%)/Median (DS) | |
|---|---|
| Ascites (mL) | 972.2 (2016.3) |
| Sugarbaker | 12.7 (7.9) |
| Bowel resection | 69 (59.5) |
| Lymphadenectomy | 65 (56.5) |
| Omentectomy | 106 (92.2) |
| Diaphragmatic stripping | 51 (44.4) |
| Splenectomy | 24 (20.9) |
| Liver resection | 5 (4.4) |
| Intraoperative transfusion | 67 (58.3) |
| Surgery result | |
| Complete (R0) | 79 (67.5) |
| Optimal (R1) | 38 (32.5) |
| Days of hospitalisation | 10.1 (8.5) |
| Clavien–Dindo complications | |
| I | 18 (15.5) |
| II | 51 (44) |
| III | 16 (13.8) |
| IV | 2 (1.7) |
| V | 1 (0.9) |
| Histotype | |
| Serous | 92 (79.3) |
| Endometrioid | 6 (5.2) |
| Mucinous | 2 (1.7) |
| Clear cell | 4 (3.5) |
| Other a | 12 (10.3) |
| Binary histology | |
| Not Available | 5 (4.3) |
| Low Grade | 9 (7.7) |
| High Grade | 103 (88) |
| FIGO stage | |
| II | 7 (6) |
| III | 87 (75) |
| IV | 22 (19) |
| BRCA status | |
| Negative | 51 (43.6) |
| BRCA 1/2 | 14 (12) |
| Not available | 52 (44.4) |
| Total number of chemotherapy cycles | |
| <6 | 6 (5.3) |
| ≥6 | 108 (94.7) |
| Postoperative CT: days after surgery | 40 (15) |
| Relapse | 81 (69.2) |
| Author (Year) | n | Discordance Between Surgeons—CT Scan | DFS Concordant vs. Discordant | OS Concordant vs. Discordant |
|---|---|---|---|---|
| Chi et al. (2007) [8] | 78 | 39 % | Not analysed | Not analysed |
| Chi et al. (2010) [10] | 67 | 43 % | 21 vs. 17 (p = 0.356) ^ | 60 vs. 43 (p = 0.146) ^ |
| Sala et al. (2010) [9] | 51 | 31 % | Not analysed | HR 3.40 (95% CI, 1.4–8.2) (p = 0.006) * |
| Lorusso et al. (2014) [11] | 64 | 20.3% | 28 vs. 5 (p = 0.001) ^ HR 8.87 (95% CI 3.2–24.3) (p < 0.0001) * | Not analysed |
| Eskander et al. (2018) [7] | 627 | 40 % | 18.3 vs. 12.8 (p = 0.0059) ^ | HR 0.99 (95% CI 0.8–1.2) * |
| Trelis et al. (2022) [12] | 117 | 29.9% | 39.8 vs. 32.8 (p = 0.158) ^ | 67.4 vs. 68.6 (p = 0.215) ^ |
| Present study PCI (2023) | 117 | RxA: 44.4% | 65.3 vs. 28.1 (p = 0.01) ^ | 112.9 vs. 61.6 (p = 0.004) ^ |
| RxB: 49.4% | 65.2 vs. 31.6 (p = 0.007) ^ | 105.9 vs. 66.9 (p = 0.042) ^ |
References
- Bookman, M.A. Trials with impact on clinical management: First line. Int. J. Gynecol. Cancer 2009, 19 (Suppl. S2), S55–S62. [Google Scholar] [CrossRef] [PubMed]
- Llueca, A.; Serra, A.; Climent, M.T.; Segarra, B.; Maazouzi, Y.; Soriano, M.; Escrig, J.; on behalf of the MUAPOS Working Group. Outcome quality standards in advanced ovarian cancer surgery. World J. Surg. Oncol. 2020, 18, 309. [Google Scholar] [CrossRef]
- Fotopoulou, C.; Planchamp, F.; Aytulu, T.; Chiva, L.; Cina, A.; Ergönül, Ö.; Fagotti, A.; Haidopoulos, D.; Hasenburg, A.; Hughes, C.; et al. European Society of Gynaecological Oncology guidelines for the peri-operative management of advanced ovarian cancer patients undergoing debulking surgery. Int. J. Gynecol. Cancer 2021, 31, 1199–1206. [Google Scholar] [CrossRef] [PubMed]
- Stuart, G.C.; Kitchener, H.; Bacon, M.; duBois, A.; Friedlander, M.; Ledermann, J.; Marth, C.; Thigpen, T.; Trimble, E. Gynecologic Cancer InterGroup (GCIG) consensus statement on clinical trials in ovarian cancer: Report from the Fourth Ovarian Cancer Consensus Conference. Int. J. Gynecol. Cancer 2011, 21, 750–755. [Google Scholar] [CrossRef] [PubMed]
- du Bois, A.; Reuss, A.; Pujade-Lauraine, E.; Harter, P.; Ray-Coquard, I.; Pfisterer, J. Role of surgical outcome as prognostic factor in advanced epithelial ovarian cancer: A combined analysis of 3 prospective randomized phase 3 multicenter trials (AGO-OVAR and GINECO). Cancer 2009, 115, 1234–1244. [Google Scholar] [CrossRef] [PubMed]
- Ozols, R.F.; Bundy, B.N.; Greer, B.E.; Fowler, J.M.; Clarke-Pearson, D.; Burger, R.A.; Mannel, R.S.; DeGeest, K.; Hartenbach, E.M.; Baergen, R.; et al. Phase III trial of carboplatin and paclitaxel compared with cisplatin and paclitaxel in patients with optimally resected stage III ovarian cancer: A gynecologic oncology group study. J. Clin. Oncol. 2003, 21, 3194–3200. [Google Scholar] [CrossRef]
- Eskander, R.N.; Kauderer, J.; Tewari, K.S.; Mannel, R.S.; Bristow, R.E.; O’Malley, D.M.; Rubin, S.C.; Glaser, G.E.; Hamilton, C.A.; Fujiwara, K.; et al. Correlation between surgeon’s assessment and radiographic evaluation of residual disease in women with advanced stage ovarian càncer reported to have undergone optimal surgical cytoreduction: An NRG Oncology/Gynecologic Oncology Group study. Gynecol. Oncol. 2018, 149, 525–530. [Google Scholar] [CrossRef] [PubMed]
- Chi, D.S.; Ramirez, P.T.; Teitcher, J.B.; Mironov, S.; Sarasohn, D.M.; Iyer, R.B.; Eisenhauer, E.L.; Abu-Rustum, N.R.; Sonoda, Y.; Levine, D.A.; et al. Prospective study of the correlation between postoperative computed tomography scan and primary surgeon assessment in patients with advanced ovarian, tubal, and peritoneal carcinoma reported to have undergone primary surgical cytoreduction to residual disease 1 cm or less. J. Clin. Oncol. 2007, 25, 4946–4951. [Google Scholar] [CrossRef] [PubMed]
- Sala, E.; Mannelli, L.; Yamamoto, K.; Griffin, M.; Griffin, N.; Grant, L.; Parker, R.; Crawford, R. The value of postoperative/preadjuvant chemotherapy computed tomography in the management of patients with ovarian cancer. Int. J. Gynecol. Cancer 2011, 21, 296–301. [Google Scholar] [CrossRef] [PubMed]
- Chi, D.S.; Barlin, J.N.; Ramirez, P.T.; Levenback, C.F.; Mironov, S.; Sarasohn, D.M.; Iyer, R.B.; Dao, F.; Hricak, H.; Barakat, R.R. Follow-up study of the correlation between postoperative computed tomographic scan and primary surgeon assessment in patients with advanced ovarian, tubal, or peritoneal carcinoma reported to have undergone primary surgical cytoreduction to residual disease of 1 cm or smaller. Int. J. Gynecol. Cancer 2010, 20, 353–357. [Google Scholar] [CrossRef] [PubMed]
- Lorusso, D.; Sarno, I.; Di Donato, V.; Palazzo, A.; Torrisi, E.; Pala, L.; Marchiano, A.; Raspagliesi, F. Is postoperative computed tomography evaluation a prognostic indicator in patients with optimally debulked advanced ovarian cancer? Oncology 2014, 87, 293–299. [Google Scholar] [CrossRef] [PubMed]
- Trelis-Blanes, A.; Lago-Leal, V.; Padilla-Iserte, P.; Pérez-Martínez, R.; Belloch-Ripollés, V.; Matute, L.; Gurrea, M.; Rebollo, J.M.C.; del Pozo, S.D. Optimal cytoreduction: Is a CT’s picture worth a surgeon’s word? Surg. Oncol. 2023, 49, 101948. [Google Scholar] [CrossRef] [PubMed]
- Burger, I.A.; Goldman, D.A.; Vargas, H.A.; Kattan, M.W.; Yu, C.; Kou, L.; Andikyan, V.; Chi, D.S.; Hricak, H.; Sala, E. Incorporation of postoperative CT data into clinical models to predict 5-year overall and recurrence free survival after primary cytoreductive surgery for advanced ovarian cancer. Gynecol. Oncol. 2015, 138, 554–559. [Google Scholar] [CrossRef] [PubMed]
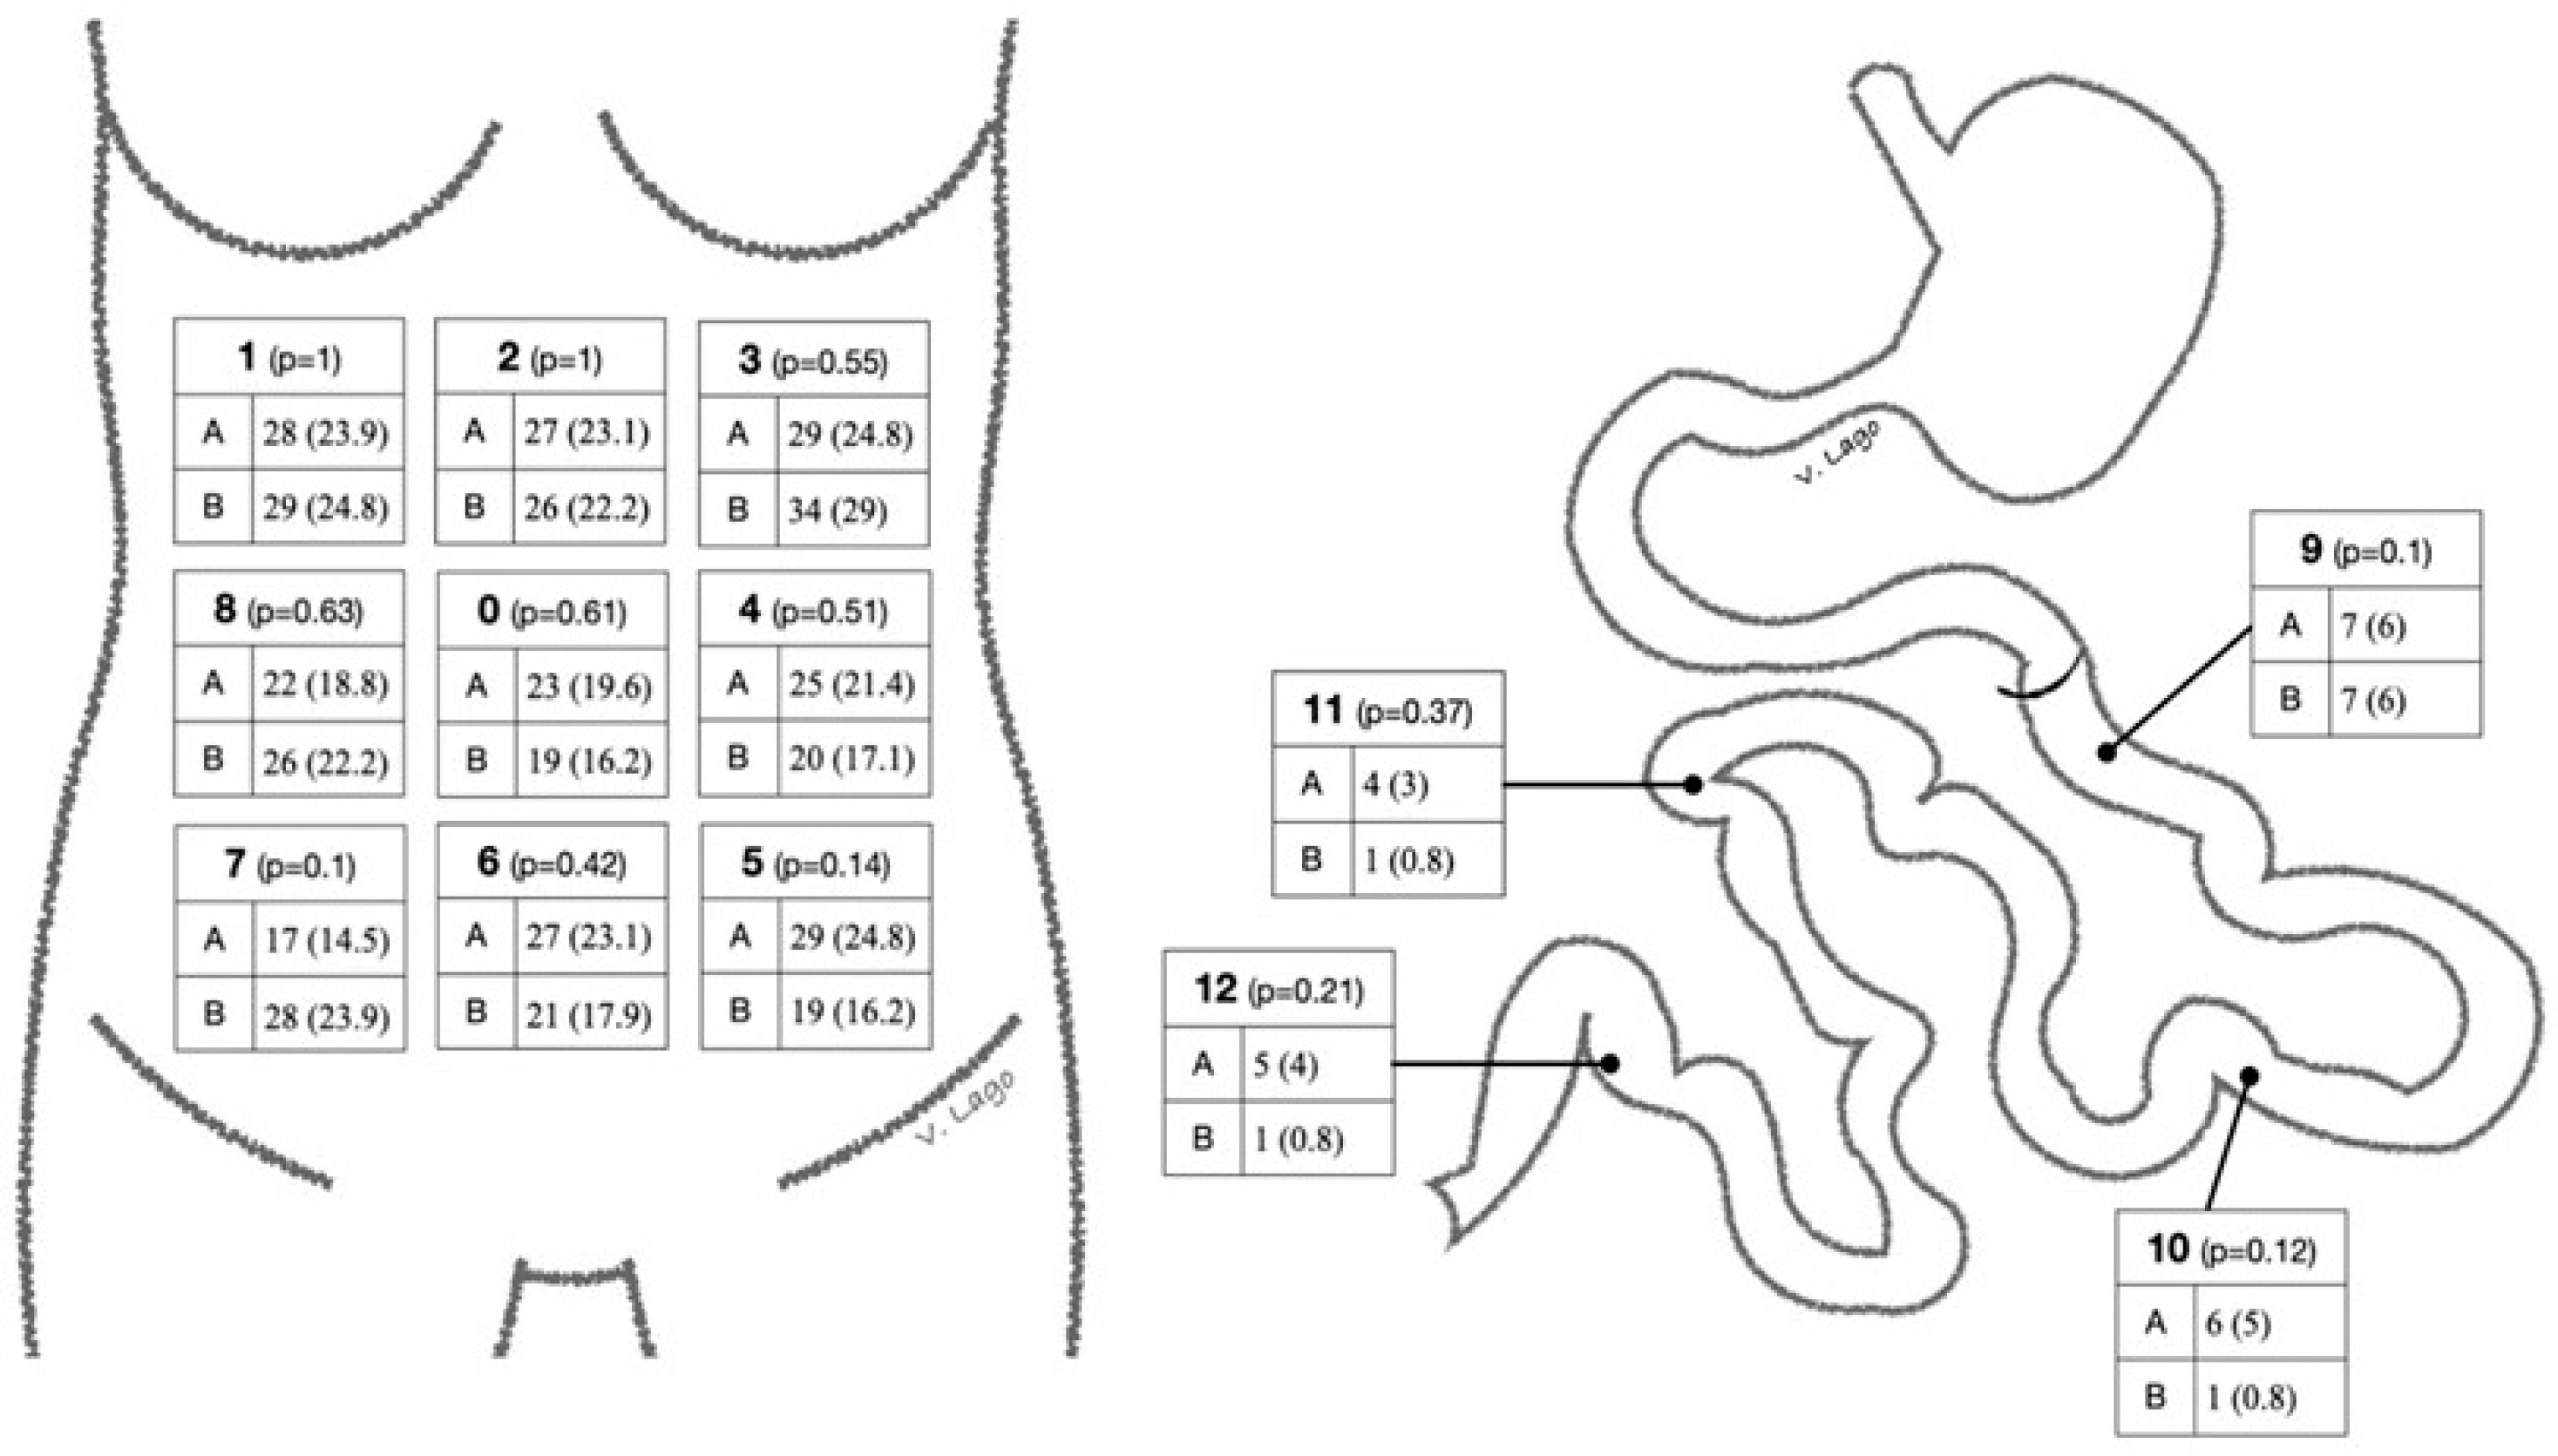
| Global 0.624 | 9 1.00 | 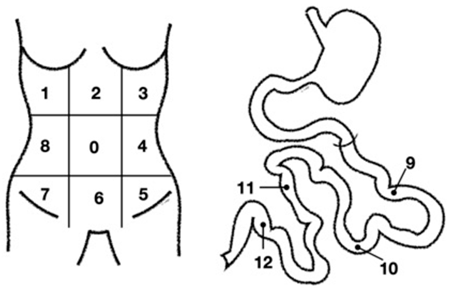 | ||
| 1 0.513 | 2 0.488 | 3 0.632 | 10 0.275 | |
| 8 0.634 | 0 0.421 | 4 0.534 | 11 NA | |
| 7 0.485 | 6 0.530 | 5 0.533 | 12 NA | |
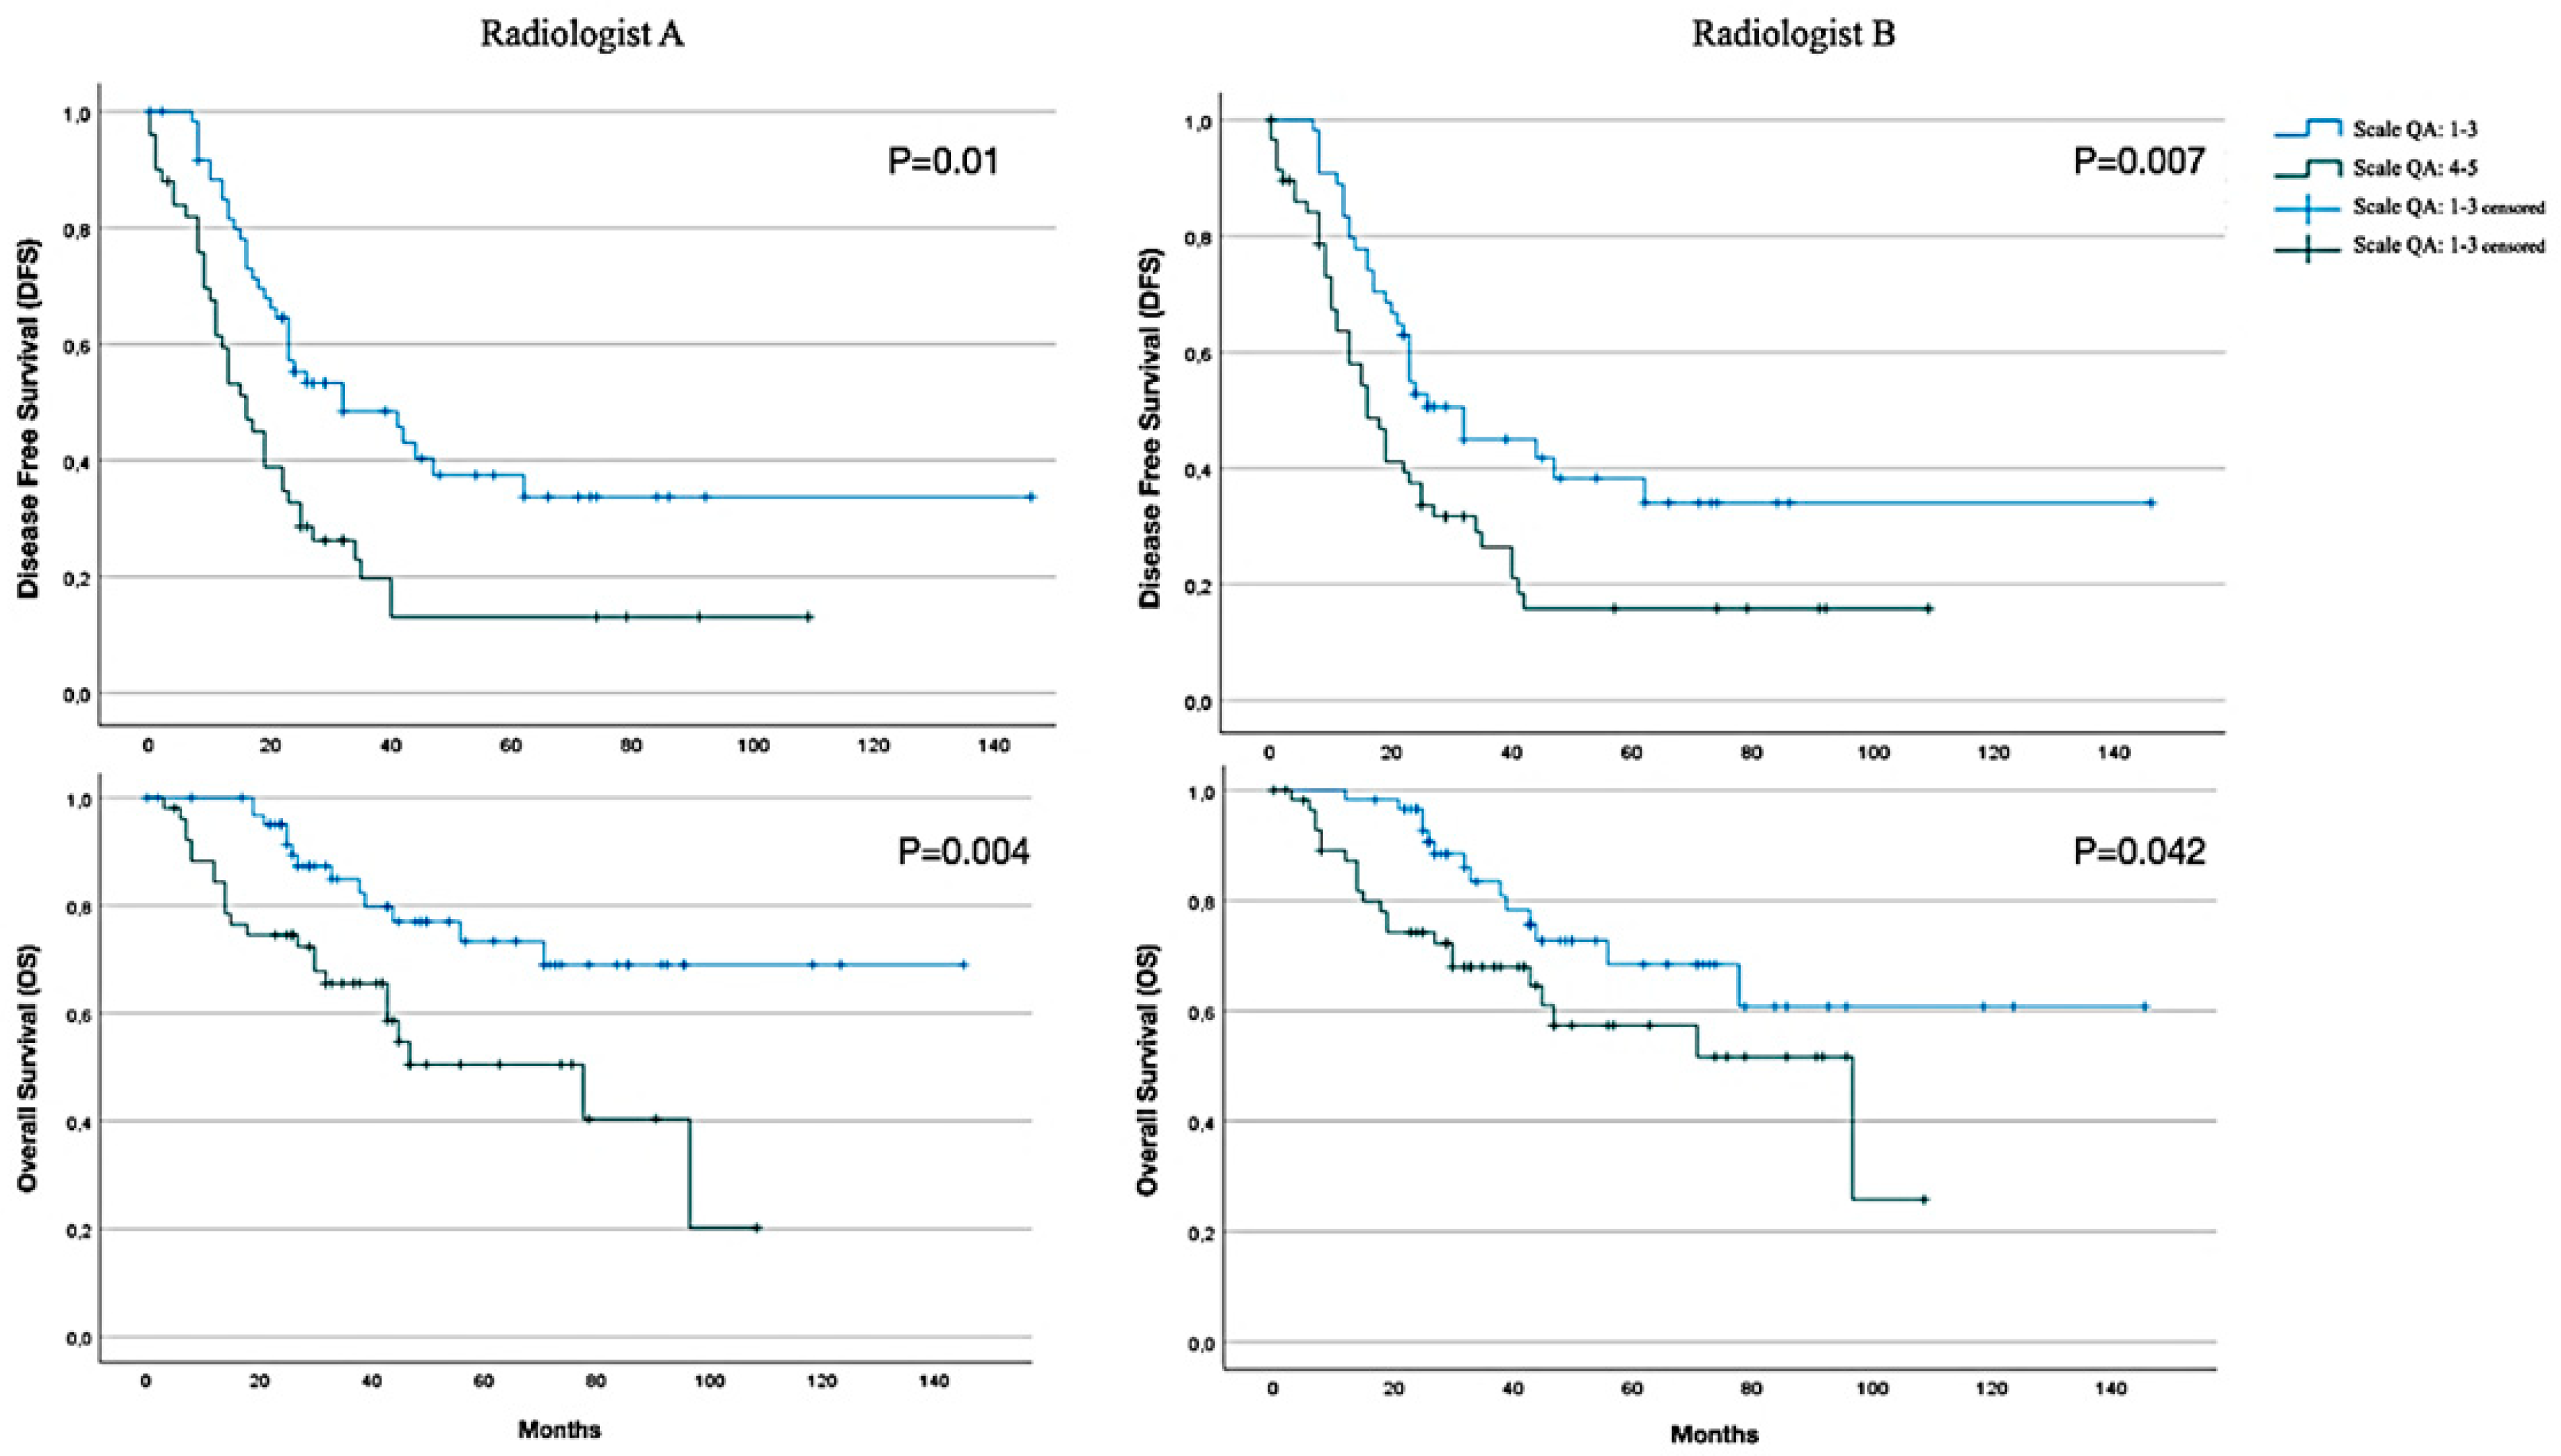
| CT report PCI (Radiologist A) | n (%) | |
| Scale QA: 1–3 | 65 (55.6) | |
| Scale QA: 4–5 | 52 (44.4) | |
| CT report PCI (Radiologist B) | n (%) | |
| Scale QA: 1–3 | 59 (50.6) | |
| Scale QA: 4–5 | 58 (49.4) | |
| DFS (Radiologist A) | Mean ± DS (95% CI) | Median ± DS (95% CI) |
| Scale QA: 1–3 | 65.3 ± 8.6 (48.4–82.3) | 32 ± 10.1 (12.2–51.8) |
| Scale QA: 4–5 | 28.1 ± 5.2 (17.9–38.2) | 16 ± 2.4 (11.2–20.8) |
| All | 50.9 ± 5.9 (39.3–62.6) | 26 ± 2.2 (18.7–27.3) |
| DFS (Radiologist B) | ||
| Scale QA: 1–3 | 65.2 ± 9.2 (47.2–83.2) | 32 ± 4 (24.1–39.8) |
| Scale QA: 4–5 | 31.6 ± 5.1 (21.5–41.6) | 16 ± 2.4 (11.2–20.8) |
| All | 50.9 ± 5.9 (39.3–62.6) | 23 ± 2.2 (18.7–27.3) |
| OS (Radiologist A) | ||
| Scale QA: 1–3 | 112.9 ± 7.9 (97.3–128.5) | NA |
| Scale QA: 4–5 | 61.6 ± 6.6 (48.6–74.6) | 78 ± 21.7 (35.5–120.5) |
| All | 92.6 ± 7.8 (77.4–108) | 97 ± NA (NA–NA) |
| OS (Radiologist B) | ||
| Scale QA: 1–3 | 105.9 ± 9.1 (87.9–123.8) | NA |
| Scale QA: 4–5 | 66.9 ± 6.4 (54.3–79.5) | 97 ± 29.7 (38.6–155) |
| All | 92.6 ± 7.8 (77.4–108) | 97 ± NA (NA–NA) |
Disclaimer/Publisher’s Note: The statements, opinions and data contained in all publications are solely those of the individual author(s) and contributor(s) and not of MDPI and/or the editor(s). MDPI and/or the editor(s) disclaim responsibility for any injury to people or property resulting from any ideas, methods, instructions or products referred to in the content. |
© 2025 by the authors. Licensee MDPI, Basel, Switzerland. This article is an open access article distributed under the terms and conditions of the Creative Commons Attribution (CC BY) license (https://creativecommons.org/licenses/by/4.0/).
Share and Cite
Trelis Blanes, A.; Lago, V.; Pérez Martínez, R.; Belloch Ripollés, V.; Montoliu, G.; Padilla-Iserte, P.; Gurrea, M.; Cárdenas Rebollo, J.M.; Domingo, S. Residual Tumour at CT Scan Based on Radiologic Peritoneal Carcinomatosis Index After Optimal Cytoreduction in Advanced Ovarian Cancer: A True Prognostic Factor. Cancers 2025, 17, 746. https://doi.org/10.3390/cancers17050746
Trelis Blanes A, Lago V, Pérez Martínez R, Belloch Ripollés V, Montoliu G, Padilla-Iserte P, Gurrea M, Cárdenas Rebollo JM, Domingo S. Residual Tumour at CT Scan Based on Radiologic Peritoneal Carcinomatosis Index After Optimal Cytoreduction in Advanced Ovarian Cancer: A True Prognostic Factor. Cancers. 2025; 17(5):746. https://doi.org/10.3390/cancers17050746
Chicago/Turabian StyleTrelis Blanes, Alexandra, Víctor Lago, Rosario Pérez Martínez, Vicente Belloch Ripollés, Guillermina Montoliu, Pablo Padilla-Iserte, Marta Gurrea, Jose Miguel Cárdenas Rebollo, and Santiago Domingo. 2025. "Residual Tumour at CT Scan Based on Radiologic Peritoneal Carcinomatosis Index After Optimal Cytoreduction in Advanced Ovarian Cancer: A True Prognostic Factor" Cancers 17, no. 5: 746. https://doi.org/10.3390/cancers17050746
APA StyleTrelis Blanes, A., Lago, V., Pérez Martínez, R., Belloch Ripollés, V., Montoliu, G., Padilla-Iserte, P., Gurrea, M., Cárdenas Rebollo, J. M., & Domingo, S. (2025). Residual Tumour at CT Scan Based on Radiologic Peritoneal Carcinomatosis Index After Optimal Cytoreduction in Advanced Ovarian Cancer: A True Prognostic Factor. Cancers, 17(5), 746. https://doi.org/10.3390/cancers17050746