
Pain Accelerates, Swelling and Sensory Disturbances Delay Diagnosis in Mesenchymal Tumors

 , , and
Simple Summary
Abstract
1. Introduction
2. Materials and Methods
2.1. Study Design
2.2. Study Objective
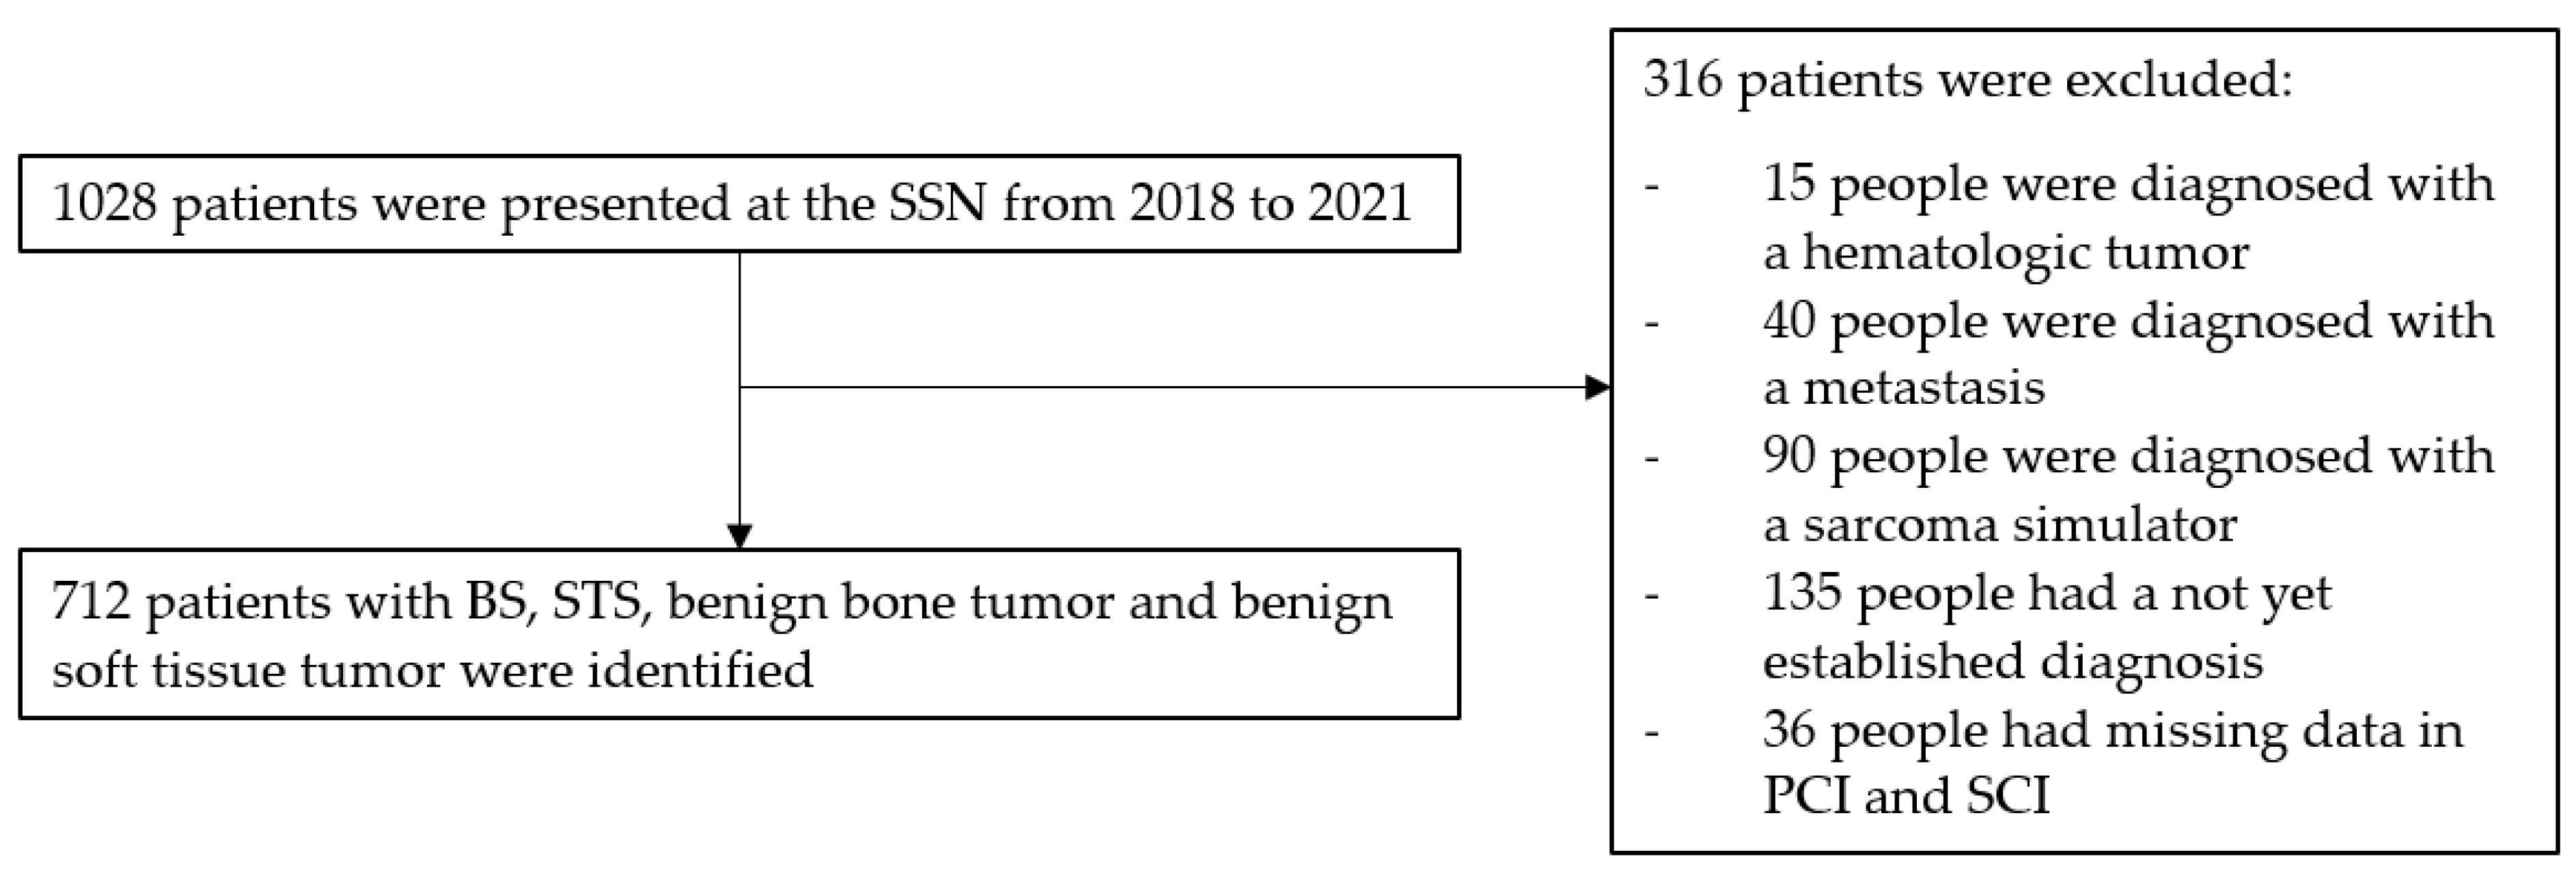
2.3. Selection Criteria
- Patients diagnosed with STS, BS, BSTT or BBT within the study period.
- Availability of complete medical records regarding documented symptom presentation and diagnostic timelines.
- Exclusion Criteria:
- Patients with incomplete medical records where key dates (e.g., first physician visit) could not be determined.
- Patients who received prior treatment for mesenchymal tumors before presentation to the SSN.
- Secondary mesenchymal tumors resulting from metastasis.
2.4. Data Collection
- Demographic Information: Age, sex.
- Tumor Characteristics: WHO diagnosis, histological type, tumor grade (for malignant tumors), size, anatomical location (head and neck, superficial trunk, deep trunk, limb girdle, extremities and viscera) and depth (superficial or deep).
- Symptom presentation: Types of symptoms reported, classified into specific categories.
- Diagnostic Timelines:
- o Date of Symptom Onset: First symptom attributed to the mesenchymal tumor.
- o First Physician Visit: Date of initial medical consultation.
- o Referral Dates: Dates of referral from primary to secondary care and from secondary care to the sarcoma center/tertiary care.
- o Diagnosis Date: Date of histologically confirmed diagnosis.
2.5. Definition of the Intervals
- Patient Interval (PI): Time from symptom onset to the first medical consultation.
- Primary Care Interval (PCI): Time from the first medical consultation to referral to secondary care.
- Secondary Care Interval (SCI): Time from secondary care consultation to referral to the sarcoma center.
- Tertiary Care Interval (TCI): Time from sarcoma center consultation to histological diagnosis.
- Diagnostic Interval (DI): Sum of PCI, SCI and TCI, representing the time from the patient’s first medical consultation to the histological diagnosis.
- Total Interval (TI): Sum of PI, PCI, SCI and TCI, representing the total time from symptom onset to the histological diagnosis.
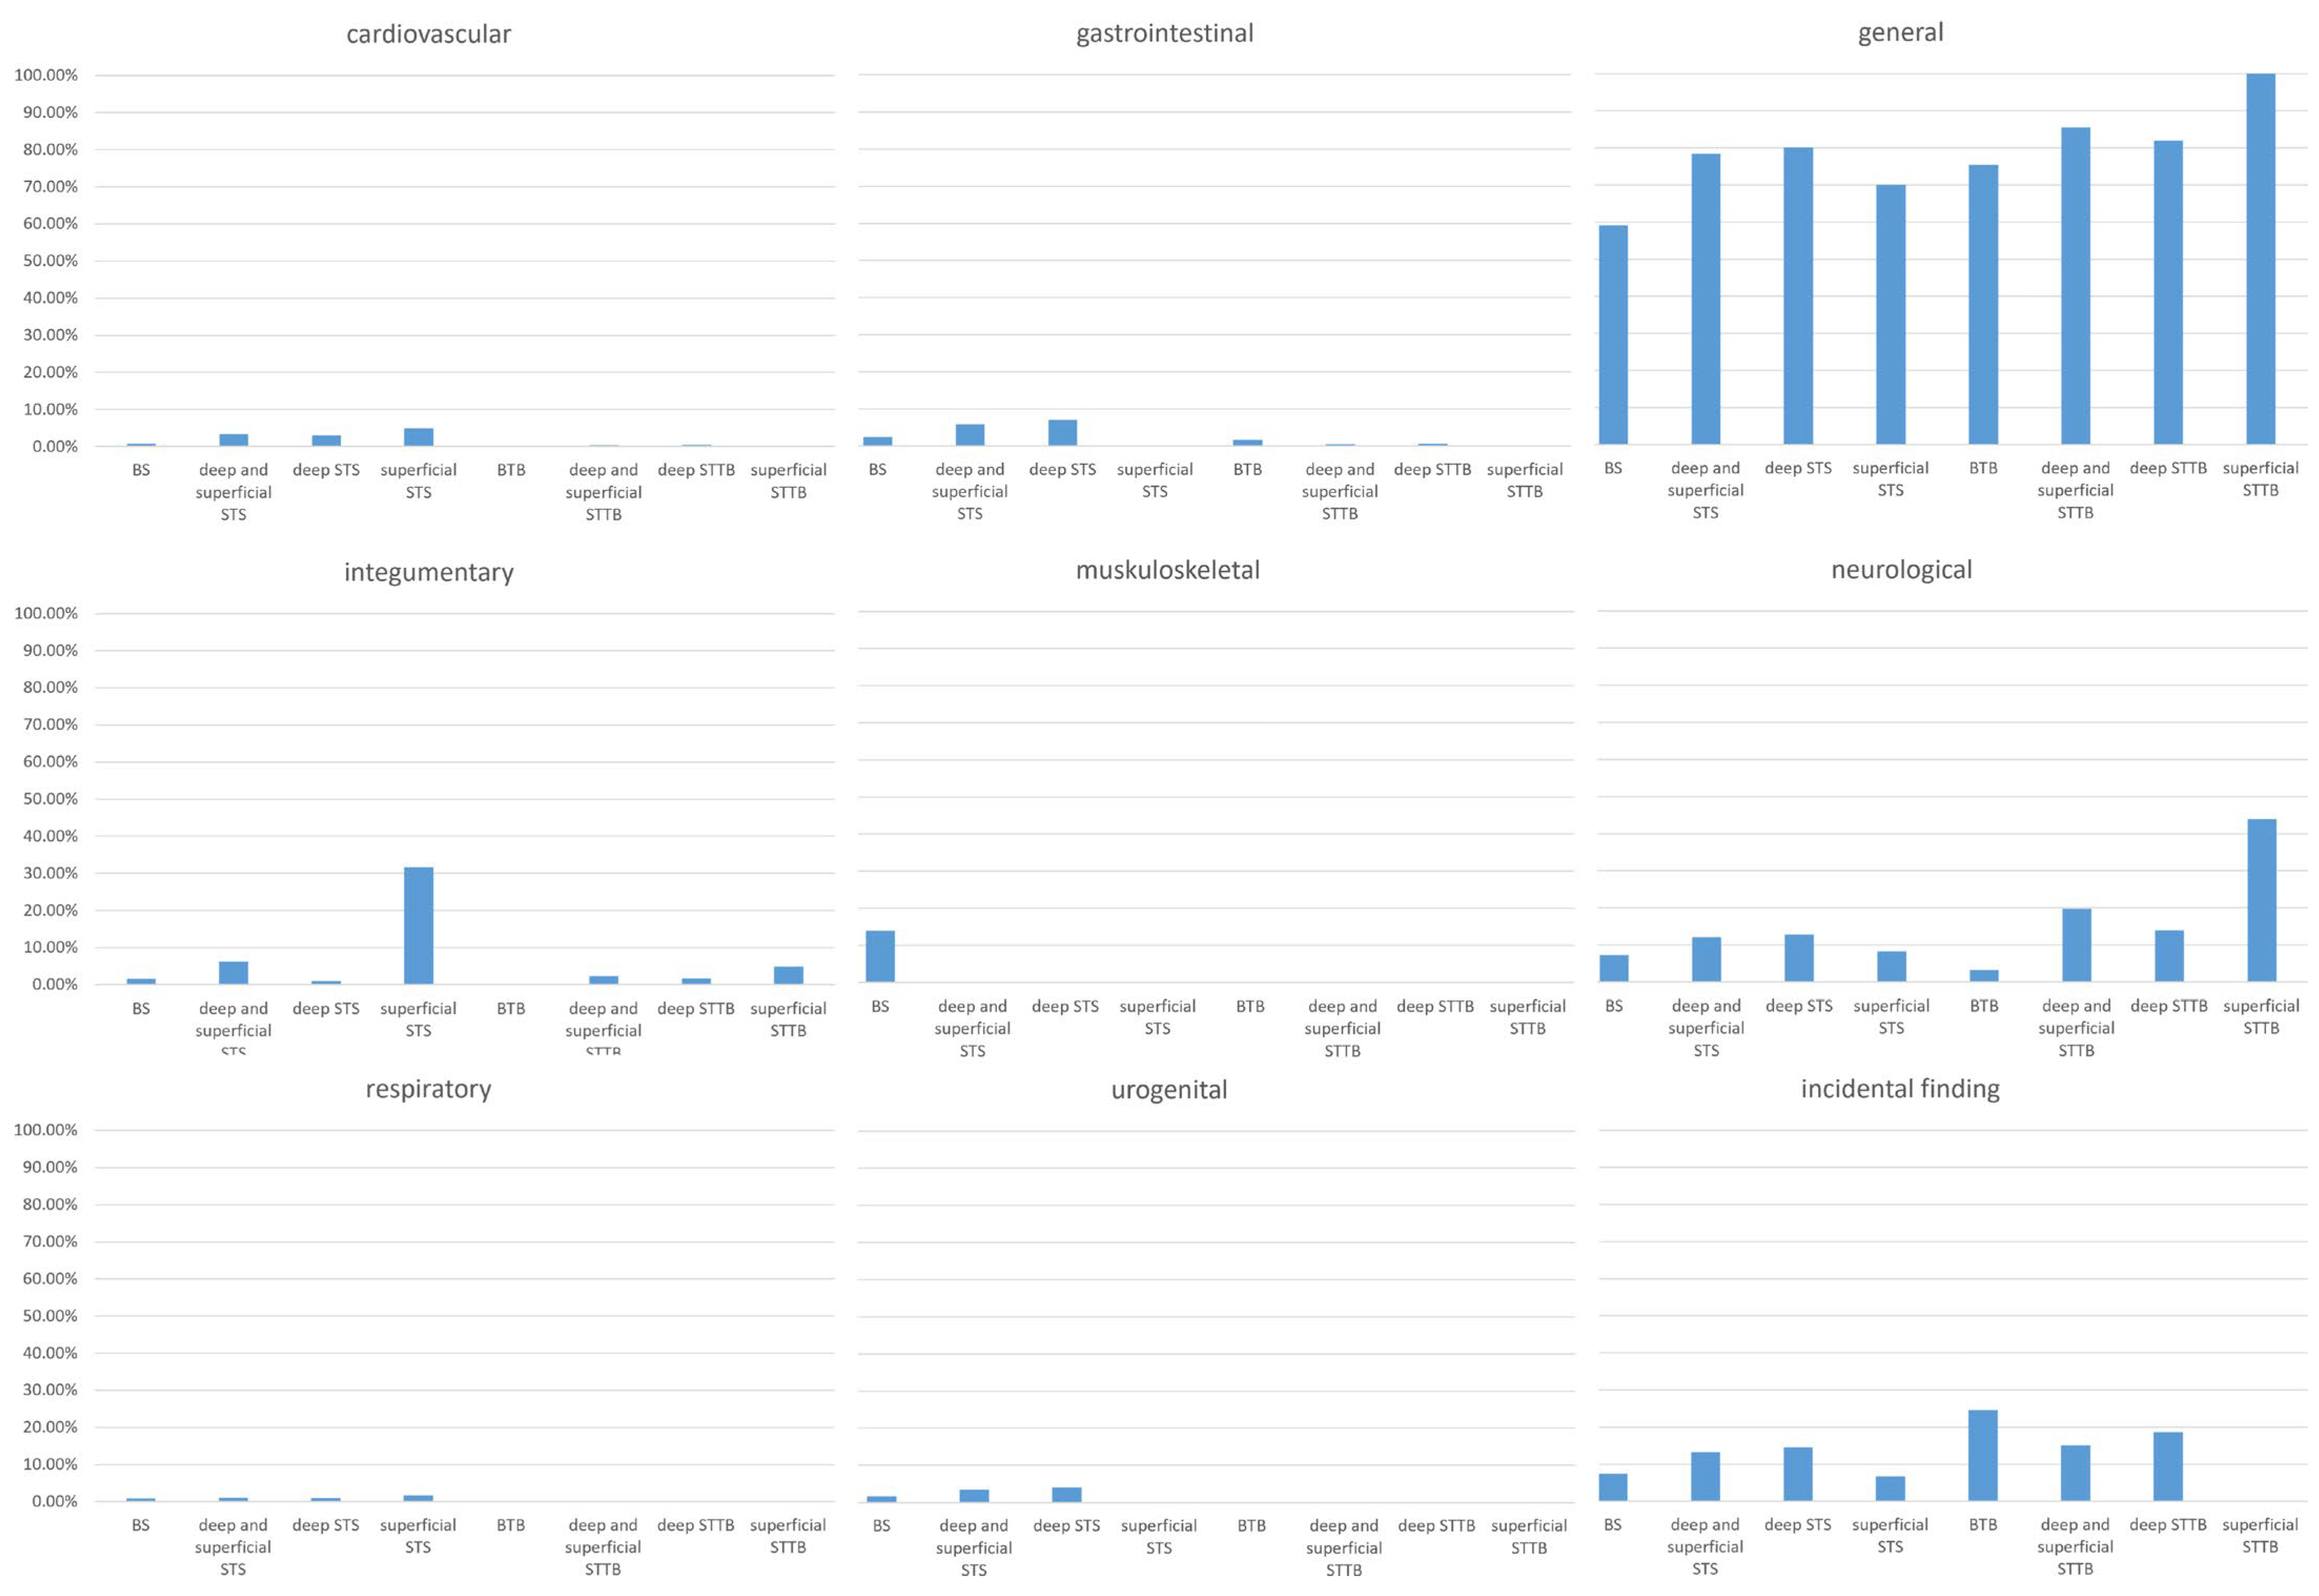
2.6. Classification of the Symptoms
- Circulatory: Symptoms related to the circulatory system (e.g., edema, cold foot, increased resting heart rate).
- Gastrointestinal: Symptoms related to the digestive tract (e.g., constipation, diarrhea, emesis, loss of appetite, abdominal distension).
- General Symptoms: Non-specific symptoms affecting overall health (e.g., pain, swelling (local increase in volume), fever, fatigue, night sweats, weight loss).
- Integumentary: Symptoms affecting the skin and related tissues (e.g., skin lesions, exophytic tumors, poorly healing wounds, discoloration, ulceration).
- Musculoskeletal: Symptoms related to muscles and bones (e.g., cramps, loss of strength, fasciculations, loss of function).
- Neurological: Symptoms related to the nervous system and sensory functions (e.g., headache, tinnitus, sensory disturbances).
- Respiratory: Symptoms related to breathing and the respiratory tract (e.g., dyspnea, coughing, voice changes).
- Urogenital: Symptoms affecting the urinary and reproductive systems (e.g., acute renal failure, hematuria, dysuria, postmenopausal bleeding).
- Incidental Findings: Unexpected findings detected during routine exams or follow-ups (e.g., incidental findings during cancer control or preoperative examinations), often retrospectively accompanied by symptoms like swelling or pain.
- Not Available (NA): Cases where symptom data were missing or unavailable.
2.7. Tumor Grading and Classification
2.8. Statiscial Analysis
2.9. Ethical Considerations
3. Results
3.1. Patient and Tumor Characteristics
3.1.1. Demographic Data
Age Distribution
Gender Distribution
3.1.2. Tumor Characteristics
Tumor Grade (Applicable to Malignant Tumors Only)
Tumor Location
Tumor Size
3.2. Symptom Prevalence and Impact on the Diagnostic Interval
3.2.1. Circulatory Symptoms
3.2.2. Gastrointestinal Symptoms
3.2.3. General Symptoms
3.2.4. Integumentary Symptoms
3.2.5. Musculoskeletal Symptoms
3.2.6. Neurological Symptoms
3.2.7. Respiratory Symptoms
3.2.8. Urogenital Symptoms
3.2.9. Incidental Findings
4. Discussion
5. Conclusions
Author Contributions
Funding
Institutional Review Board Statement
Informed Consent Statement
Data Availability Statement
Acknowledgments
Conflicts of Interest
Appendix A

| Overall | Bone Sarcoma | Soft-Tissue Sarcoma | Benign Bone Tumor | Benign Soft-Tissue Tumor | |||||||||
|---|---|---|---|---|---|---|---|---|---|---|---|---|---|
| Deep and Superficial | Deep | Superficial | Deep and Superficial | Deep | Superficial | ||||||||
| n = 712 | n = 82 | p-Value a | n = 356 | n = 296 | p-Value b | n = 60 | n = 61 | p-Value c | n = 213 | n = 172 | p-Value d | n = 41 | |
| Patient Interval, weeks | 90.0 (22.0, 284.0) | 7.8 (2.7, 27.5) | 0.46 | 8.8 (2.1, 29.0) | 8.3 (2.0, 24.4) | 0.01 | 20.7 (4.2, 130.6) | 19.1 (4.3, 52.1) | 0.17 | 21.6 (6.4, 109.6) | 19.8 (6.3, 75.1) | 0.22 | 29.9 (9.0, 176.4) |
| Diagnostic Interval, weeks | 46.0 (25.5, 95.5) | 7.6 (3.1, 14.2) | 0.89 | 6.7 (3.7, 13.3) | 6.9 (3.9, 13.7) | 0.22 | 5.7 (3.6, 9.3) | 19.8 (6.8, 79.7) | 0.005 | 6.0 (3.6, 13.4) | 6.0 (3.6, 14.6) | 0.35 | 5.6 (3.6, 9.5) |
| Primary Care Interval, weeks | 4.0 (0.0, 18.5) | 0.6 (0.1, 6.5) | 0.14 | 0.4 (0.0, 1.4) | 0.4 (0.0, 1.3) | 0.31 | 0.0 (0.0, 1.4) | 0.8 (0.0, 44.9) | 0.30 | 0.7 (0.0, 3.1) | 0.7 (0.0, 4.4) | 0.15 | 0.3 (0.0, 1.0) |
| Secondary Care Interval, weeks | 26.0 (12.0, 57.0) | 2.2 (0.9, 6.6) | 0.005 | 4.3 (2.1, 9.1) | 3.9 (1.9, 8.1) | 0.01 | 8.1 (4.9, 10.2) | 2.6 (1.0, 10.7) | 0.47 | 3.5 (1.6, 7.5) | 3.9 (1.7, 10.0) | 0.14 | 2.6 (1.5, 3.8) |
| Tertiary Care Interval, weeks | 14.0 (5.0, 26.3) | 2.1 (1.0, 3.7) | 0.006 | 1.3 (−0.6, 3.4) | 1.6 (−0.2, 3.6) | 0.01 | 0.9 (−3.3, 1.9) | 3.1 (2.0, 8.1) | 0.14 | 2.6 (1.8, 4.1) | 2.6 (1.7, 4.0) | 0.36 | 2.7 (1.9, 5.8) |
| Total Interval, weeks | 213.0 (84.0, 762.2) | 22.8 (11.9, 56.7) | 0.82 | 23.3 (10.4, 59.4) | 20.9 (10.4, 55.3) | 0.07 | 34.8 (12.3, 148.0) | 100.5 (48.1, 206.6) | 0.22 | 48.2 (17.7, 193.3) | 43.0 (14.7, 150.6) | 0.04 | 138.1 (29.1, 304.4) |
| Characteristic | BS | STS | BBT | BSTT | ||||
|---|---|---|---|---|---|---|---|---|
| Deep and Superficial STS | Deep STS | Superficial STS | Deep and Superficial BSTT | Deep BSTT | Superficial BSTT | |||
| n = 82 | n = 356 | n = 296 | n = 60 | n = 61 | n = 213 | n = 172 | n = 41 | |
| Symptom class | ||||||||
| gastrointestinal | 3 (3.7%) | 21 (5.9%) | 21 (7.1%) | 0 (0.0%) | 1 (1.6%) | 1 (0.5%) | 1 (0.6%) | 0 (0.0%) |
| urogenital | 2 (2.4%) | 12 (3.4%) | 12 (4.1%) | 0 (0.0%) | 0 (0.0%) | 0 (0.0%) | 0 (0.0%) | 0 (0.0%) |
| circulatory | 1 (1.2%) | 12 (3.4%) | 9 (3.0%) | 3 (5.0%) | 0 (0.0%) | 1 (0.5%) | 1 (0.6%) | 0 (0.0%) |
| general | 72 (87.8%) | 279 (78.4%) | 237 (80.1%) | 42 (70.0%) | 46 (75.4%) | 182 (85.5%) | 141 (82.0%) | 41 (100.0%) |
| integumental | 2 (2.4%) | 22 (6.2%) | 3 (1.0%) | 19 (31.7%) | 0 (0.0%) | 5 (2.4%) | 3 (1.7%) | 2 (4.9%) |
| neurological | 9 (11.0%) | 43 (12.1%) | 38 (12.8%) | 5 (8.3%) | 2 (3.3%) | 42 (19.7%) | 24 (14.0%) | 18 (43.9%) |
| respiratory | 1 (1.2%) | 4 (1.1%) | 3 (1.0%) | 1 (1.7%) | 0 (0.0%) | 0 (0.0%) | 0 (0.0%) | 0 (0.0%) |
| musculoskeletal | 17 (20.7%) | 0 (0.0%) | 0 (0.0%) | 0 (0.0%) | 0 (0.0%) | 0 (0.0%) | 0 (0.0%) | 0 (0.0%) |
| incidental finding | 9 (11.0%) | 47 (13.2%) | 43 (14.5%) | 4 (6.7%) | 15 (24.6%) | 32 (15.0%) | 32 (18.6%) | 0 (0.0%) |
| NA | 0 (0.0%) | 4 (1.1%) | 3 (1.0%) | 1 (1.7%) | 0 (0.0%) | 0 (0.0%) | 0 (0.0%) | 0 (0.0%) |
References
- Choi, J.H.; Ro, J.Y. The 2020 WHO classification of tumors of soft tissue: Selected changes and new entities. Adv. Anat. Pathol. 2021, 28, 44–58. [Google Scholar] [CrossRef] [PubMed]
- Gatta, G.; Capocaccia, R.; Botta, L.; Mallone, S.; De Angelis, R.; Ardanaz, E.; Comber, H.; Dimitrova, N.; Leinonen, M.K.; Siesling, S.; et al. Burden and centralised treatment in Europe of rare tumours: Results of RARECAREnet-a population-based study. Lancet Oncol. 2017, 18, 1022–1039. [Google Scholar] [CrossRef] [PubMed]
- van der Graaf, W.T.A.; Orbach, D.; Judson, I.R.; Ferrari, A. Soft tissue sarcomas in adolescents and young adults: A comparison with their paediatric and adult counterparts. Lancet Oncol. 2017, 18, e166–e175. [Google Scholar] [CrossRef] [PubMed]
- Kasper, B.; Baumgarten, C.; Garcia, J.; Bonvalot, S.; Haas, R.; Haller, F.; Hohenberger, P.; Penel, N.; Messiou, C.; van der Graaf, W.T.; et al. An update on the management of sporadic desmoid-type fibromatosis: A European Consensus Initiative between Sarcoma PAtients EuroNet (SPAEN) and European Organization for Research and Treatment of Cancer (EORTC)/Soft Tissue and Bone Sarcoma Group (STBSG). Ann. Oncol. 2017, 28, 2399–2408. [Google Scholar] [CrossRef]
- Clark, M.A.; Fisher, C.; Judson, I.; Thomas, J.M. Soft-tissue sarcomas in adults. N. Engl. J. Med. 2005, 353, 701–711. [Google Scholar] [CrossRef]
- Buvarp Dyrop, H.; Vedsted, P.; Rædkjær, M.; Safwat, A.; Keller, J. Routes to Diagnosis for Suspected Sarcoma: The Impact of Symptoms and Clinical Findings on the Diagnostic Process. Sarcoma 2016, 2016, 8639272. [Google Scholar] [CrossRef]
- Soomers, V.; Husson, O.; Young, R.; Desar, I.; Van der Graaf, W. The sarcoma diagnostic interval: A systematic review on length, contributing factors and patient outcomes. ESMO Open 2020, 5, e000592. [Google Scholar] [CrossRef]
- Olesen, F.; Hansen, R.P.; Vedsted, P. Delay in diagnosis: The experience in Denmark. Br. J. Cancer 2009, 101 (Suppl. 2), S5–S8. [Google Scholar] [CrossRef]
- Weller, D.; Vedsted, P.; Rubin, G.; Walter, F.M.; Emery, J.; Scott, S.; Campbell, C.; Andersen, R.S.; Hamilton, W.; Olesen, F.; et al. The Aarhus statement: Improving design and reporting of studies on early cancer diagnosis. Br. J. Cancer 2012, 106, 1262–1267. [Google Scholar] [CrossRef]
- Elyes, M.; Heesen, P.; Schelling, G.; Bode-Lesniewska, B.; Studer, G.; Fuchs, B. Enhancing Healthcare for Sarcoma Patients: Lessons from a Diagnostic Pathway Efficiency Analysis. Cancers 2023, 15, 4892. [Google Scholar] [CrossRef]
- Ray-Coquard, I.; Montesco, M.C.; Coindre, J.M.; Dei Tos, A.P.; Lurkin, A.; Ranchère-Vince, D.; Vecchiato, A.; Decouvelaere, A.V.; Mathoulin-Pélissier, S.; Albert, S.; et al. Sarcoma: Concordance between initial diagnosis and centralized expert review in a population-based study within three European regions. Ann. Oncol. 2012, 23, 2442–2449. [Google Scholar] [CrossRef] [PubMed]
- Thway, K.; Fisher, C. Histopathological diagnostic discrepancies in soft tissue tumours referred to a specialist centre. Sarcoma 2009, 2009, 741975. [Google Scholar] [CrossRef] [PubMed]
- McPhail, S.; Johnson, S.; Greenberg, D.; Peake, M.; Rous, B. Stage at diagnosis and early mortality from cancer in England. Br. J. Cancer 2015, 112 (Suppl. 1), S108–S115. [Google Scholar] [CrossRef] [PubMed]
- Seinen, J.; Almquist, M.; Styring, E.; Rydholm, A.; Nilbert, M. Delays in the management of retroperitoneal sarcomas. Sarcoma 2010, 2010, 702573. [Google Scholar] [CrossRef]
- Brasme, J.F.; Chalumeau, M.; Oberlin, O.; Valteau-Couanet, D.; Gaspar, N. Time to diagnosis of Ewing tumors in children and adolescents is not associated with metastasis or survival: A prospective multicenter study of 436 patients. J. Clin. Oncol. 2014, 32, 1935–1940. [Google Scholar] [CrossRef]
- Sneppen, O.; Hansen, L.M. Presenting symptoms and treatment delay in osteosarcoma and Ewing’s sarcoma. Acta Radiol. Oncol. 1984, 23, 159–162. [Google Scholar] [CrossRef]
- Pan, K.L.; Chan, W.H.; Chia, Y.Y. Initial symptoms and delayed diagnosis of osteosarcoma around the knee joint. J. Orthop. Surg. 2010, 18, 55–57. [Google Scholar] [CrossRef]
- Biscaglia, R.; Gasbarrini, A.; Böhling, T.; Bacchini, P.; Bertoni, F.; Picci, P. Osteosarcoma of the bones of the foot—An easily misdiagnosed malignant tumor. In Mayo Clinic Proceedings; Elsevier: Amsterdam, The Netherlands, 1998; pp. 842–847. [Google Scholar]
- George, A.; Grimer, R. Early symptoms of bone and soft tissue sarcomas: Could they be diagnosed earlier? Ann. R. Coll. Surg. Engl. 2012, 94, 261–266. [Google Scholar] [CrossRef]
- Hardes, J.; Gosheger, G.; Budny, T. Knochensarkome. Z. Orthop. Unf. 2018, 156, 105–124. [Google Scholar] [CrossRef]
- Meyer, J.S.; Nadel, H.R.; Marina, N.; Womer, R.B.; Brown, K.L.; Eary, J.; Gorlick, R.; Grier, H.E.; Randall, R.L.; Lawlor, E.R. Imaging guidelines for children with Ewing sarcoma and osteosarcoma: A report from the Children’s Oncology Group Bone Tumor Committee. Pediatr. Blood Cancer 2008, 51, 163–170. [Google Scholar] [CrossRef]
- Gronchi, A.; Miah, A.B.; Dei Tos, A.P.; Abecassis, N.; Bajpai, J.; Bauer, S.; Biagini, R.; Bielack, S.; Blay, J.Y.; Bolle, S.; et al. Soft tissue and visceral sarcomas: ESMO-EURACAN-GENTURIS Clinical Practice Guidelines for diagnosis, treatment and follow-up. Ann. Oncol. 2021, 32, 1348–1365. [Google Scholar] [CrossRef] [PubMed]
- Enneking, W.F. The issue of the biopsy. JBJS 1982, 64, 1119–1120. [Google Scholar] [CrossRef]
- Andreou, D.; Bielack, S.; Carrle, D.; Kevric, M.; Kotz, R.; Winkelmann, W.; Jundt, G.; Werner, M.; Fehlberg, S.; Kager, L. The influence of tumor-and treatment-related factors on the development of local recurrence in osteosarcoma after adequate surgery. An analysis of 1355 patients treated on neoadjuvant Cooperative Osteosarcoma Study Group protocols. Ann. Oncol. 2011, 22, 1228–1235. [Google Scholar] [CrossRef] [PubMed]
- van den Berg, H.; Slaar, A.; Kroon, H.M.; Taminiau, A.H.; Hogendoorn, P. Results of diagnostic review in pediatric bone tumors and tumorlike lesions. J. Pediatr. Orthop. 2008, 28, 561–564. [Google Scholar] [CrossRef] [PubMed]
- Mankin, H.J.; Lange, T.A.; Spanier, S. The hazards of biopsy in patients with malignant primary bone and soft-tissue tumors. JBJS 1982, 64, 1121–1127. [Google Scholar] [CrossRef]
| BS | STS | BBT | BSTT | |||||
|---|---|---|---|---|---|---|---|---|
| Deep and Superficial STS | Deep STS | Superficial STS | Deep and Superficial BSTT | Deep BSTT | Superficial BSTT | |||
| n = 82 | n = 356 | n = 296 | n = 60 | n = 61 | n = 213 | n = 172 | n = 41 | |
| Age, years | 44.0 (19.0, 65.0) | 60.0 (46.0, 72.0) | 60.0 (46.0, 72.0) | 61.5 (42.3, 74.3) | 34.0 (23.0, 45.0) | 55.0 (44.0, 63.0) | 56.0 (44.0, 65.0) | 54.0 (44.0, 61.0) |
| Female, (%) | 30 (36.6%) | 178 (50.0%) | 145 (49.0%) | 33 (55.0%) | 30 (49.2%) | 110 (51.6%) | 90 (52.3%) | 20 (48.8%) |
| Grade | ||||||||
| G1 | 7 (8.5%) | 67 (18.8%) | 52 (17.6%) | 15 (25.0%) | not applicable | not applicable | not applicable | not applicable |
| G2 | 5 (6.1%) | 49 (13.7%) | 41 (13.9%) | 8 (13.3%) | not applicable | not applicable | not applicable | not applicable |
| G3 | 26 (31.7%) | 100 (28.1%) | 85 (28.7%) | 15 (25.0%) | not applicable | not applicable | not applicable | not applicable |
| NA | 44 (53.7%) | 140 (39.3%) | 118 (39.9%) | 22 (36.7%) | not applicable | not applicable | not applicable | not applicable |
| Region | ||||||||
| Head and Neck | 2 (2.4%) | 19 (5.3%) | 9 (3.0%) | 10 (16.7%) | 4 (6.6%) | 11 (5.2%) | 6 (3.5%) | 5 (12.2%) |
| Superficial Trunk | - | 22 (6.2%) | - | 22 (36.7%) | - | 6 (2.8%) | - | 6 (14.6%) |
| Deep Trunk | 15 (18.3%) | 116 (32.6%) | 116 (39.2%) | - | 7 (11.5%) | 34 (16.0%) | 34 (19.8%) | - |
| Limb Girdle | 32 (39.0%) | 81 (22.8%) | 73 (24.7%) | 8 (13.3%) | 18 (29.5%) | 73 (34.3%) | 59 (34.3%) | 14 (34.2%) |
| Extremities | 33 (40.2%) | 108 (30.3%) | 88 (29.7%) | 20 (33.3%) | 32 (52.5%) | 89 (41.8%) | 73 (42.4%) | 16 (39.0%) |
| Viscera | - | 10 (2.8%) | 10 (3.4%) | - | - | - | - | - |
| Size, mm | 60.0 (39.5, 85.0) | 70.0 (32.0, 124.0) | 86.0 (45.0, 130.0) | 28.0 (20.0, 44.0) | 31.5 (11.5, 50.5) | 60.0 (38.3, 97.3) | 61.0 (39.0, 100.5) | 54.0 (35.5, 79.5) |
| 0–50 mm, n | 25 (30.5%) | 106 (29.8%) | 70 (23.6%) | 36 (60.0%) | 33 (54.1%) | 83 (39.0%) | 65 (37.4%) | 18 (43.9%) |
| 51–100 mm, n | 30 (36.6%) | 67 (18.8%) | 59 (19.9%) | 8 (13.3%) | 10 (16.4%) | 72 (33.8%) | 55 (32.0%) | 17 (41.5%) |
| 101–150 mm, n | 11 (13.4%) | 50 (14.1%) | 50 (16.9%) | 0 (0.0%) | 1 (1.6%) | 29 (13.6%) | 27 (15.7%) | 2 (4.9%) |
| >150 mm, n | 1 (1.2%) | 42 (11.8%) | 41 (13.9%) | 1 (1.7%) | 0 (0.0%) | 14 (6.6%) | 13 (7.6%) | 1 (2.4%) |
| NA | 15 (18.3%) | 91 (25.6%) | 76 (25.7%) | 15 (25.0%) | 17 (27.8%) | 15 (7.0%) | 12 (7.0%) | 3 (7.3%) |
| BS | STS | BBT | BSTT | |||||
|---|---|---|---|---|---|---|---|---|
| Deep and Superficial STS | Deep STS | Superficial STS | Deep and Superficial BSTT | Deep BSTT | Superficial BSTT | |||
| n = 82 | n = 356 | n = 296 | n = 60 | n = 61 | n = 213 | n = 172 | n = 41 | |
| circulatory | ||||||||
| bleeding | 0 (0.0%) | 5 (1.4%) | 2 (0.7%) | 3 (5.0%) | 0 (0.0%) | 0 (0.0%) | 0 (0.0%) | 0 (0.0%) |
| hematoma | 0 (0.0%) | 4 (1.1%) | 3 (1.0%) | 1 (1.7%) | 0 (0.0%) | 0 (0.0%) | 0 (0.0%) | 0 (0.0%) |
| gastrointestinal | ||||||||
| constipation | 1 (1.2%) | 6 (1.7%) | 6 (2.0%) | 0 (0.0%) | 0 (0.0%) | 0 (0.0%) | 0 (0.0%) | 0 (0.0%) |
| increase in abdominal girth | 0 (0.0%) | 7 (2.0%) | 7 (2.4%) | 0 (0.0%) | 0 (0.0%) | 1 (0.5%) | 1 (0.6%) | 0 (0.0%) |
| loss of appetite | 0 (0.0%) | 5 (1.4%) | 5 (1.7%) | 0 (0.0%) | 0 (0.0%) | 0 (0.0%) | 0 (0.0%) | 0 (0.0%) |
| general symptoms | ||||||||
| difference in leg circumference | 0 (0.0%) | 7 (2.0%) | 6 (2.0%) | 1 (1.7%) | 0 (0.0%) | 2 (0.9%) | 2 (1.2%) | 0 (0.0%) |
| fatigue | 0 (0.0%) | 8 (2.3%) | 8 (2.7%) | 0 (0.0%) | 0 (0.0%) | 3 (1.4%) | 3 (1.7%) | 0 (0.0%) |
| fever | 1 (1.2%) | 4 (1.1%) | 4 (1.4%) | 0 (0.0%) | 1 (1.6%) | 0 (0.0%) | 0 (0.0%) | 0 (0.0%) |
| growing swelling | 9 (11.0%) | 88 (24.7%) | 67 (22.6%) | 21 (35.0%) | 7 (11.5%) | 80 (37.6%) | 57 (33.1%) | 23 (33.1%) |
| night sweats | 2 (2.4%) | 6 (1.7%) | 6 (2.0%) | 0 (0.0%) | 0 (0.0%) | 0 (0.0%) | 0 (0.0%) | 0 (0.0%) |
| pain | 65 (79.3%) | 138 (38.8%) | 131 (44.3%) | 7 (11.7%) | 43 (70.5%) | 78 (36.6%) | 68 (39.5%) | 10 (39.5%) |
| swelling | 25 (30.5%) | 210 (59.0%) | 165 (55.7%) | 45 (75.0%) | 21 (34.4%) | 160 (75.1%) | 120 (69.8%) | 40 (69.8%) |
| weight loss | 0 (0.0%) | 16 (4.5%) | 16 (5.4%) | 0 (0.0%) | 0 (0.0%) | 1 (0.5%) | 1 (0.6%) | 0 (0.0%) |
| incidental finding | ||||||||
| incidental finding | 9 (11.0%) | 46 (12.9%) | 42 (14.2%) | 4 (6.7%) | 15 (24.6%) | 32 (15.0%) | 32 (18.6%) | 0 (0.0%) |
| incidental finding after trauma | 3 (3.7%) | 2 (0.6%) | 2 (0.7%) | 0 (0.0%) | 8 (13.1%) | 3 (1.4%) | 3 (1.7%) | 0 (0.0%) |
| incidental finding at control of cancerous disease | 2 (2.4%) | 26 (7.3%) | 23 (7.8%) | 3 (5.0%) | 3 (4.9%) | 7 (3.3%) | 7 (4.1%) | 0 (0.0%) |
| integumental | ||||||||
| discoloration | 1 (1.2%) | 7 (2.0%) | 0 (0.0%) | 7 (11.7%) | 0 (0.0%) | 3 (1.4%) | 2 (1.2%) | 1 (2.4%) |
| exophytic tumor | 0 (0.0%) | 7 (2.0%) | 3 (1.0%) | 4 (6.7%) | 0 (0.0%) | 0 (0.0%) | 0 (0.0%) | 0 (0.0%) |
| pruritus | 1 (1.2%) | 2 (0.6%) | 0 (0.0%) | 2 (3.3%) | 0 (0.0%) | 1 (0.5%) | 0 (0.0%) | 1 (2.4%) |
| skin lesion | 0 (0.0%) | 7 (2.0%) | 3 (1.0%) | 4 (6.7%) | 0 (0.0%) | 0 (0.0%) | 0 (0.0%) | 0 (0.0%) |
| ulcerating swelling | 0 (0.0%) | 5 (1.4%) | 0 (0.0%) | 5 (8.%) | 0 (0.0%) | 0 (0.0%) | 0 (0.0%) | 0 (0.0%) |
| musculoskeletal system | ||||||||
| loss of function | 13 (15.9%) | 17 (4.8%) | 17 (5.7%) | 0 (0.0%) | 12 (19.7%) | 12 (5.6%) | 10 (5.8%) | 2 (4.9%) |
| loss of strength | 4 (4.9%) | 4 (1.1%) | 4 (1.4%) | 0 (0.0%) | 1 (1.6%) | 4 (1.9%) | 4 (2.3%) | 0 (0.0%) |
| respiratory system | ||||||||
| change of voice | 1 (1.2%) | 0 (0.0%) | 0 (0.0%) | 0 (0.0%) | 0 (0.0%) | 0 (0.0%) | 0 (0.0%) | 0 (0.0%) |
| dyspnea | 0 (0.0%) | 2 (0.6%) | 1 (0.3%) | 1 (1.7%) | 0 (0.0%) | 0 (0.0%) | 0 (0.0%) | 0 (0.0%) |
| neurological | ||||||||
| sensory disturbance | 8 (9.8%) | 40 (11.2%) | 35 (11.8%) | 5 (8.3%) | 2 (3.3%) | 42 (19.7%) | 24 (14.0%) | 18 (43.9%) |
| urogenital | ||||||||
| hematuria | 1 (1.2%) | 3 (0.8%) | 3 (1.0%) | 0 (0.0%) | 0 (0.0%) | 0 (0.0%) | 0 (0.0%) | 0 (0.0%) |
| pollakiuria | 0 (0.0%) | 4 (1.1%) | 4 (1.4%) | 0 (0.0%) | 0 (0.0%) | 0 (0.0%) | 0 (0.0%) | 0 (0.0%) |
| NA | 3 (3.7%) | 16 (4.5%) | 15 (5.1%) | 1 (1.7%) | 1 (1.6%) | 3 (1.4%) | 3 (1.7%) | 0 (0.0%) |
| DI | TI | ||||||||||||||
|---|---|---|---|---|---|---|---|---|---|---|---|---|---|---|---|
| PI | PCI | SCI | TCI | ||||||||||||
| Beta | 95% CI | p-Value | Beta | 95% CI | p-Value | Beta | 95% CI | p-Value | Beta | 95% CI | p-Value | Beta | 95% CI | p-Value | |
| Bone sarcoma (n = 82) | |||||||||||||||
| Symptoms | |||||||||||||||
| pain | −1787.5 | −2812.4, −762.6 | 0.001 | −226.4 | −478.9, 26.1 | 0.08 | −214.9 | −457.9, 28.2 | 0.08 | −8.0 | −22.8, 6.8 | 0.29 | −2556.8 | −3788.5, −1325.2 | <0.001 |
| swelling | 203.7 | −628.0, 1035.4 | 0.63 | 176.0 | −46.8, 398.8 | 0.12 | 174.7 | −43.8, 393.1 | 0.12 | −6.3 | −19.5, 7.0 | 0.35 | 476.2 | −579.1, 1531.6 | 0.37 |
| growing swelling | 1102.6 | −74.7, 2280.0 | 0.07 | 433.2 | 124.1, 742.3 | 0.007 | 433.7 | 129.4, 737.9 | 0.006 | 2.5 | −16.2, 21.2 | 0.79 | 1637.4 | 227.8, 3046.9 | 0.02 |
| sensory disturbance | −300.7 | 1567.7, 966.2 | 0.64 | 549.5 | 209.6, 889.4 | 0.002 | 550.1 | 215.4, 884.8 | 0.002 | −1.2 | −22.5, 20.0 | 0.91 | 235.9 | −1432.9, 1904.7 | 0.78 |
| Symptomclass | |||||||||||||||
| circulatory | −477.9 | −3888.7, 2932.8 | 0.78 | 43.7 | −877.6, 964.9 | 0.93 | 39.5 | −869.1, 948.1 | 0.93 | −1.5 | −51.4, 48.5 | 0.95 | −631.2 | 4541.1, 3278.6 | 0.75 |
| gastrointestinal | −481.3 | −2475.9, 1513.3 | 0.63 | −3.0 | −542.3, 536.2 | 0.99 | −4.5 | −536.2, 527.1 | 0.99 | −7.2 | −42.7, 28.4 | 0.69 | −628.1 | −3414.2, 2157.9 | 0.65 |
| general | 457.3 | −1970.1, 2884.7 | 0.71 | 73.6 | −268.3, 415.5 | 0.67 | 67.3 | −252.5, 387.2 | 0.68 | −13.7 | −34.6, 7.3 | 0.2 | 600.7 | −3309.5, 4510.9 | 0.76 |
| integumental | 90.99 | −2338.7, 2520.7 | 0.94 | −71.3 | −727.0, 584.4 | 0.83 | −75.0 | −721.5, 571.6 | 0.82 | −4.1 | −39.7, 31.5 | 0.82 | −174.5 | −2965.1, 2616.0 | 0.9 |
| musculoskeletal | −385.8 | −1338.7, 567.0 | 0.42 | −40.7 | −304.7, 223.3 | 0.76 | −37.2 | −296.8, 222.4 | 0.78 | 19.1 | 3.36, 34.7 | 0.02 | −271.1 | −1613.5, 1071.3 | 0.69 |
| respiratory | −478.9 | −3889.7, 2931.8 | 0.78 | −71.9 | −993.0, 849.3 | 0.88 | −31.4 | −940.0, 877.1 | 0.95 | −2.5 | −52.5, 47.5 | 0.92 | −705.5 | −4614.4, 3203.5 | 0.72 |
| neurological | −319.7 | −1522.9, 883.5 | 0.6 | 478.0 | 154.3, 801.6 | 0.004 | 477.9 | 159.2, 796.6 | 0.004 | −3.1 | −22.9, 16.8 | 0.76 | 99.8 | −1460.6, 1660.2 | 0.9 |
| urogenital | 268.3 | −2160.7, 2697.2 | 0.83 | −37.9 | −693.8, 617.9 | 0.91 | −36.5 | −683.2, 610.2 | 0.91 | 6.8 | −28.8, 42.3 | 0.71 | 68.1 | −2722.8, 2858.9 | 0.96 |
| Soft tissue sarcoma (n = 356) | |||||||||||||||
| Symptoms | |||||||||||||||
| pain | −258.6 | −574.7, 57.4 | 0.11 | −50.5 | −155.5, 54.5 | 0.35 | −80.3 | −200.8, 40.2 | 0.19 | 33.0 | −80.1, 146.1 | 0.57 | −442.1 | −853.4, −30.8 | 0.04 |
| swelling | −15.0 | −348.0, 317.9 | 0.93 | 108.1 | 4.5, 211.6 | 0.04 | 134.6 | 15.8, 253.4 | 0.03 | 28.8 | −82.5, 140.0 | 0.61 | 52.2 | −383.3, 487.7 | 0.81 |
| growing swelling | 118.4 | −230.5, 467.2 | 0.51 | 62.1 | −55.9, 180.1 | 0.3 | 127.3 | −8.4, 263.0 | 0.07 | 138.4 | 12.8, 264.1 | 0.03 | 235.2 | −220.2, 690.6 | 0.31 |
| sensory disturbance | 120.4 | −347.5, 588.3 | 0.61 | −82.4 | −244.2, 79.4 | 0.32 | −99.8 | −283.2, 83.6 | 0.29 | 166.1 | −8.3, 340.6 | 0.06 | 163.3 | −460.7, 787.3 | 0.61 |
| Symptomclass | |||||||||||||||
| circulatory | 594.7 | −216.2, 1405.6 | 0.15 | −80.8 | −350.1, 188.6 | 0.56 | −98.3 | −411.2, 214.7 | 0.54 | 58.9 | −220.5, 338.3 | 0.68 | 415.7 | −571.8, 1403.3 | 0.41 |
| gastrointestinal | −54.5 | −679.0, 570.0 | 0.86 | −78.3 | −284.8, 128.3 | 0.46 | −99.2 | −339.1, 140.8 | 0.42 | 121.1 | −112.4, 354.6 | 0.31 | −24.0 | −852.7, 804.8 | 0.96 |
| general | 209.2 | −280.0, 698.5 | 0.4 | 72.7 | −53.5, 199.0 | 0.26 | 88.2 | −58.2, 234.5 | 0.24 | 91.6 | −42.0, 225.2 | 0.18 | 252.8 | 0−379.9, 885.6 | 0.43 |
| integumental | −27.2 | −638.4, 584.0 | 0.93 | 98.5 | −123.4, 320.5 | 0.38 | 97.1 | −167.9, 362.0 | 0.47 | 53.4 | −157.4, 264.1 | 0.62 | 78.7 | −669.0, 826.3 | 0.84 |
| musculoskeletal | 83.6 | −555.1, 722.4 | 0.8 | −61.0 | −277.5, 155.5 | 0.58 | −79.3 | −324.9, 166.2 | 0.53 | 168.8 | −64.3, 401.9 | 0.16 | 258.2 | −595.3, 1111.6 | 0.55 |
| respiratory | −267.8 | −1658.2, 1122.6 | 0.71 | −78.0 | −538.7, 382.8 | 0.74 | −98.9 | −634.4, 436.6 | 0.72 | −229.4 | −686.2, 227.3 | 0.32 | −673.1 | −2287.0, 940.9 | 0.41 |
| neurological | 82.3 | −371.6, 536.2 | 0.72 | −83.3 | −241.2, 74.7 | 0.3 | −100.2 | −277.6, 77.3 | 0.27 | 163.4 | −8.6, 335.4 | 0.06 | 140.8 | −474.5, 756.2 | 0.65 |
| urogenital | −328.3 | −1141.1, 484.5 | 0.43 | −79.8 | −349.2, 189.5 | 0.56 | −101.3 | −414.3, 211.6 | 0.53 | 122.4 | −169.8, 414.6 | 0.41 | −321.1 | −1355.3, 713.1 | 0.54 |
| Deep soft tissue sarcoma (n = 296) | |||||||||||||||
| Symptoms | |||||||||||||||
| pain | −204.0 | −544.8, 136.7 | 0.24 | −50.5 | −164.9, 64.0 | 0.39 | −85.4 | −218.5, 47.7 | 0.21 | 36.6 | −95.0, 168.2 | 0.59 | −426.2 | −878.8, 26.4 | 0.07 |
| swelling | −164.4 | −518.9, 190.1 | 0.36 | 109.5 | −4.5, 223.6 | 0.06 | 142.0 | 9.7, 274.4 | 0.04 | 39.4 | −92.0, 170.8 | 0.56 | −114.0 | −591.5, 363.5 | 0.64 |
| growing swelling | 65.1 | −325.3, 455.3 | 0.74 | 26.7 | −109.2, 162.5 | 0.7 | 111.2 | −47.2, 269.5 | 0.17 | 162.1 | 6.8, 317.4 | 0.04 | 170.2 | −355.5, 695.9 | 0.52 |
| sensory disturbance | −95.7 | −592.6, 401.2 | 0.71 | −81.4 | −259.4, 96.6 | 0.37 | −102.3 | −306.5, 101.8 | 0.33 | 181.9 | −17.3, 381.2 | 0.07 | −24.8 | −691.6, 642.0 | 0.94 |
| Symptomclass | |||||||||||||||
| circulatory | −1.4 | −928.6, 925.8 | 0.99 | −79.5 | −396.0, 237.0 | 0.62 | −99.5 | −473.0, 273.9 | 0.6 | 63.3 | −269.5, 396.1 | 0.71 | −112.3 | −1211.4, 986.8 | 0.84 |
| gastrointestinal | 6.1 | −616.2, 628.4 | 0.99 | −78.3 | −290.3, 133.7 | 0.47 | −100.9 | −350.9, 149.1 | 0.43 | 125.7 | −127.6, 378.9 | 0.33 | 39.0 | −800.9, 878.9 | 0.93 |
| general | 110.9 | −486.1, 707.9 | 0.72 | 65.1 | −79.9, 210.1 | 0.38 | 83.8 | −85.6, 253.1 | 0.33 | 139.1 | −27.2, 305.4 | 0.1 | 138.4 | −678.4, 955.2 | 0.74 |
| integumental | −300.6 | −1886.9, 1285.8 | 0.71 | −43.0 | −585.1, 499.1 | 0.88 | −57.7 | −697.7, 582.3 | 0.86 | 50.2 | 518.6, 619.0 | 0.86 | −397.0 | −2270.8, 1476.8 | 0.68 |
| musculoskeletal | 146.1 | −490.0, 782.1 | 0.65 | −60.8 | −282.8, 161.3 | 0.59 | −80.8 | −336.5, 175.0 | 0.54 | 174.0 | −78.8, 426.7 | 0.18 | 325.2 | −538.7, 1189.1 | 0.46 |
| respiratory | −167.7 | −1754.3, 1419.0 | 0.84 | −76.7 | −618.8, 465.4 | 0.78 | −98.8 | −738.7, 541.1 | 0.76 | −321.4 | −888.6, 245.9 | 0.27 | −680.9 | −2553.1, 1191.3 | 0.47 |
| neurological | −119.6 | −599.7, 360.5 | 0.62 | −82.4 | −255.6, 90.8 | 0.35 | −102.7 | −299.3, 94.0 | 0.31 | 178.7 | −17.5, 374.8 | 0.07 | −41.8 | −698.5, 614.8 | 0.9 |
| urogenital | −271.9 | −1079.1, 535.3 | 0.51 | −79.5 | −355.1, 196.1 | 0.57 | −102.5 | −427.7, 222.7 | 0.54 | 126.2 | −189.9, 442.3 | 0.43 | −263.0 | −1307.9, 781.8 | 0.62 |
| Superficial soft tissue sarcoma (n = 60) | |||||||||||||||
| Symptoms | |||||||||||||||
| pain | −230.3 | −1429.3, 968.6 | 0.7 | −87.8 | −489.1, 313.5 | 0.66 | −100.2 | −507.8, 307.4 | 0.62 | 53.7 | −176.1, 283.4 | 0.64 | −215.0 | −1630.1, 1200.1 | 0.76 |
| swelling | 743.1 | −274.0, 1760.2 | 0.15 | 108.2 | −164.4, 380.8 | 0.43 | 106.8 | −178.6, 392.2 | 0.46 | −35.1 | −200.6, 130.5 | 0.67 | 804.1 | −324.5, 1932.7 | 0.16 |
| growing swelling | 188.0 | −634.0, 1010.0 | 0.65 | 204.2 | −36.1, 444.4 | 0.09 | 206.2 | 39.2, 451.6 | 0.1 | 61.6 | −92.1, 215.2 | 0.43 | 335.0 | −627.6, 1297.5 | 0.49 |
| sensory disturbance | 1705.0 | 394.7, 3015.3 | 0.02 | −87.8 | −489.1, 313.5 | 0.66 | −84.5 | −492.4, 323.4 | 0.68 | 55.3 | −259.8, 370.5 | 0.73 | 2037.6 | 199.2, 3876.1 | 0.03 |
| Symptomclass | |||||||||||||||
| circulatory | 2324.5 | 682.96, 3966.10 | 0.006 | −87.79 | −595.32, 419.73 | 0.73 | −94.42 | −609.88, 421.04 | 0.71 | 39.66 | −342.74, 422.056 | 0.84 | 2804.1 | 612.36, 4995.81 | 0.01 |
| general | 650.0 | −274.7, 1574.7 | 0.16 | 108.2 | −152.4, 368.7 | 0.41 | 108.7 | −162.5, 379.9 | 0.42 | −43.4 | −202.4, 115.5 | 0.59 | 693.9 | −368.2, 1756.0 | 0.2 |
| integumental | −360.6 | −1196.2, 475.0 | 0.39 | 163.5 | −94.6, 421.7 | 0.21 | 175.5 | −92.7, 443.7 | 0.2 | 57.3 | −98.7, 213.3 | 0.46 | −121.4 | −1100.3, 857.5 | 0.8 |
| respiratory | −665.7 | −3655.0, 2323.6 | 0.66 | −84.3 | −946.3, 777.7 | 0.85 | −98.4 | −973.6, 776.8 | 0.82 | 44.0 | −491.6, 579.5 | 0.87 | −719.7 | −3992.8, 2553.3 | 0.66 |
| neurological | 1705.0 | 394.7, 3015.3 | 0.01 | −87.8 | −489.1, 313.5 | 0.66 | −84.5 | −492.4, 323.4 | 0.68 | 55.3 | −259.8, 370.5 | 0.73 | 2037.6 | 199.2, 3876.1 | 0.03 |
| Benign bone tumor (n = 61) | |||||||||||||||
| Symptoms | |||||||||||||||
| pain | 41.2 | −270.3, 352.7 | 0.79 | −83.9 | −240.8, 72.9 | 0.29 | −85.7 | −242.0, 70.6 | 0.28 | 182.2 | −375.7, 740.2 | 0.5 | −308.5 | −2010.2, 1393.2 | 0.71 |
| swelling | 241.1 | −23.1, 505.4 | 0.07 | 77.4 | −77.8, 232.5 | 0.32 | 73.6 | −81.2, 228.4 | 0.34 | −257.4 | −777.0, 262.2 | 0.31 | −341.8 | −1913.9, 1230.3 | 0.65 |
| growing swelling | 383.0 | 17.8, 748.1 | 0.04 | 142.2 | −76.06, 360.4 | 0.2 | 141.7 | −75.9, 359.3 | 0.2 | −143.4 | −734.6, 447.7 | 0.61 | 301.1 | −1401.0, 2003.3 | 0.71 |
| sensory disturbance | 108.4 | −566.3, 783.1 | 0.75 | −82.0 | −475.5, 311.5 | 0.68 | −85.7 | −477.9, 306.6 | 0.66 | −89.4 | −937.5, 758.7 | 0.83 | −10.5 | −2429.0, 2408.1 | 0.99 |
| Symptomclass | |||||||||||||||
| gastrointestinal | −243.7 | −1185.9, 698.6 | 0.61 | −83.5 | −635.0, 468.1 | 0.76 | −87.1 | 637.0, 462.8 | 0.75 | NA | NA | NA | NA | NA | NA |
| general | 301.1 | −249.3, 851.5 | 0.28 | −24.3 | −216.1, 167.6 | 0.8 | −29.9 | −221.1, 161.3 | 0.76 | 178.9 | −982.6, 1340.5 | 0.75 | NA | NA | NA |
| musculoskeletal | −120.1 | −421.8, 181.5 | 0.43 | −92.8 | −270.4, 84.7 | 0.3 | −95.9 | −272.8, 81.0 | 0.28 | −222.9 | −807.1, 361.2 | 0.43 | −915.8 | −2550.0, 718.4 | 0.25 |
| neurological | 108.4 | −566.3, 783.1 | 0.75 | −82.0 | −475.5, 311.5 | 0.68 | −85.7 | −477.9, 306.6 | 0.66 | −89.4 | −937.5, 758.7 | 0.83 | −10.5 | −2429.0, 2408.1 | 0.99 |
| Benign soft tissue tumor (n = 213) | |||||||||||||||
| Symptoms | |||||||||||||||
| pain | −439.3 | −962.4, 83.7 | 0.1 | −11.0 | −110.9, 89.0 | 0.83 | −28.4 | −131.3, 74.5 | 0.59 | 2.5 | −40.7, 45.7 | 0.91 | −388.7 | −1094.6, 317.3 | 0.28 |
| swelling | 91.7 | −663.4, 846.8 | 0.81 | 69.1 | −43.4, 181.6 | 0.23 | 10.9 | −103.7, 125.6 | 0.85 | −25.2 | −72.5, 22.0 | 0.29 | 203.4 | −791.2, 1198.0 | 0.69 |
| growing swelling | 348.5 | −176.0, 873.1 | 0.19 | 34.6 | −67.6, 136.8 | 0.51 | 7.8 | −97.8, 113.5 | 0.88 | −34.6 | −76.9, 7.7 | 0.11 | 377.3 | −323.4, 1078.2 | 0.29 |
| sensory disturbance | 292.0 | −323.8, 907.8 | 0.35 | 153.7 | 35.9, 271.5 | 0.01 | 134.3 | 10.3, 258.3 | 0.03 | −41.0 | −91.4, 9.5 | 0.11 | 584.0 | −224.5, 1392.5 | 0.16 |
| Symptomclass | |||||||||||||||
| circulatory | −861.2 | −4374.3, 2651.8 | 0.63 | −69.1 | −729.2, 591.0 | 0.84 | −94.1 | −788.5, 600.3 | 0.79 | 2.5 | −254.9, 259.8 | 0.99 | −1213.2 | −5239.2, 2812.8 | 0.55 |
| gastrointestinal | −870.3 | −4383.3, 2642.7 | 0.63 | −69.1 | −729.2, 591.0 | 0.84 | −61.9 | −756.4, 632.6 | 0.86 | NA | NA | NA | NA | NA | NA |
| general | NA | NA | NA | −24.3 | −165.9, 117.3 | 0.74 | −115.5 | −254.1, 23.2 | 0.1 | −44.6 | −103.2, 14.0 | 0.14 | NA | NA | NA |
| integumental | 2447.1 | 898.8, 3995.5 | 0.002 | −55.6 | −438.8, 327.5 | 0.78 | −73.8 | −476.7, 329.2 | 0.72 | 30.7 | −99.1, 160.6 | 0.64 | 2666.1 | 679.8, 4652.4 | 0.009 |
| musculoskeletal | 81.3 | −863.8, 1026.4 | 0.87 | 114.6 | −62.0, 291.2 | 0.2 | 98.5 | −81.9, 278.8 | 0.28 | 13.0 | −67.2, 93.2 | 0.75 | 562.0 | −755.1, 1879.1 | 0.4 |
| neurological | 292.0 | −323.8, 907.8 | 0.35 | 153.7 | 35.9, 271.5 | 0.01 | 134.3 | 10.3, 258.3 | 0.03 | −41.0 | −91.4, 9.5 | 0.11 | 584.0 | −224.5, 1392.5 | 0.16 |
| Benign deep soft tissue tumor (n = 172) | |||||||||||||||
| Symptoms | |||||||||||||||
| pain | −323.9 | −878.3, 230.5 | 0.25 | 32.4 | −46.9, 111.7 | 0.42 | 7.2 | −81.6, 95.9 | 0.87 | 3.7 | −48.7, 56.1 | 0.89 | −208.8 | −966.0, 548.4 | 0.59 |
| swelling | −77.7 | −816.0, 660.5 | 0.84 | 45.7 | −40.6, 131.9 | 0.3 | −12.3 | −107.6, 83.0 | 0.8 | −34.2 | −88.9, 20.5 | 0.22 | 1.0 | −971.2, 973.2 | 0.99 |
| growing swelling | 309.5 | −259.8, 878.9 | 0.28 | 38.2 | −45.5, 121.9 | 0.37 | 7.7 | −86.5, 101.9 | 0.87 | −58.7 | −112.7, −4.7 | 0.03 | 383.3 | −391.8, 1158.5 | 0.33 |
| sensory disturbance | 150.7 | −587.2, 888.7 | 0.69 | 73.3 | −35.9, 182.4 | 0.19 | 53.5 | −70.9, 177.9 | 0.4 | −88.6 | −161.3, −16.0 | 0.02 | 399.6 | −612.9, 1412.1 | 0.44 |
| Symptomclass | |||||||||||||||
| circulatory | −748.0 | −4050.1, 2554.1 | 0.66 | −49.9 | −537.4, 437.6 | 0.84 | −78.9 | −634.5, 476.6 | 0.78 | 7.1 | −279.0, 293.2 | 0.96 | −1040.8 | −4876.7, 2795.2 | 0.59 |
| gastrointestinal | −757.1 | −4059.1, 2544.9 | 0.66 | −49.9 | −537.4, 437.6 | 0.84 | −46.8 | −602.4, 508.9 | 0.87 | NA | NA | NA | NA | NA | NA |
| general | NA | NA | NA | −47.9 | −153.7, 58.0 | 0.37 | −137.8 | −249.3, −26.4 | 0.02 | −52.1 | −118.3, 14.2 | 0.12 | NA | NA | NA |
| integumental | −370.3 | −2290.9, 1550.4 | 0.7 | −34.5 | −380.3, 311.3 | 0.84 | −61.7 | −455.8, 332.3 | 0.76 | 5.6 | −197.5, 208.7 | 0.96 | −1061.9 | −3783.6, 1659.9 | 0.44 |
| musculoskeletal | 89.9 | −868.8, 1048.6 | 0.85 | 165.0 | 26.7, 303.4 | 0.02 | 144.1 | −9.2, 297.3 | 0.07 | 15.6 | −83.0, 114.2 | 0.76 | 771.7 | −627.8, 2171.2 | 0.28 |
| neurological | 150.7 | −587.2, 888.7 | 0.69 | 73.3 | −35.9, 182.4 | 0.19 | 53.5 | −70.9, 177.9 | 0.4 | −88.6 | −161.3, −16.0 | 0.02 | 399.6 | −612.9, 1412.1 | 0.44 |
| Benign superficial soft tissue tumor (n = 41) | |||||||||||||||
| Symptoms | |||||||||||||||
| pain | −579.5 | −2123.0, 964.1 | 0.45 | −225.5 | −777.4, 326.5 | 0.41 | −210.3 | −724.4, 303.8 | 0.41 | 18.2 | −12.7, 49.0 | 0.24 | −466.4 | −2612.5, 1679.6 | 0.66 |
| swelling | 1208.0 | −3103.4, 5518.6 | 0.57 | 177.1 | −1132.2, 1486.5 | 0.78 | 173.1 | −1107.3, 1453.6 | 0.78 | NA | NA | NA | NA | NA | NA |
| growing swelling | 233.7 | −1109.6, 1577.1 | 0.73 | −47.2 | −525.6, 431.3 | 0.84 | −53.0 | −512.9, 406.9 | 0.82 | 22.3 | −1.5, 46.2 | 0.07 | −60.0 | −1784.0, 1663.9 | 0.94 |
| sensory disturbance | 213.6 | −1130.1, 1557.3 | 0.75 | 290.6 | −174.2, 755.5 | 0.21 | 287.9 | −158.7, 734.6 | 0.2 | 7.8 | −17.0, 32.6 | 0.52 | 376.7 | −1319.7, 2073.0 | 0.65 |
| Symptomclass | |||||||||||||||
| integumental | 6596.1 | 4350.1, 8842.2 | <0.001 | −165.8 | −1475.3, 1143.8 | 0.8 | −152.4 | −1433.3, 1128.4 | 0.81 | 43.3 | −4.8, 91.4 | 0.08 | 6216.6 | 3683.2, 8750.0 | <0.001 |
| musculoskeletal | 399.9 | −2697.3, 3497.0 | 0.8 | −183.7 | −1125.1, 757.7 | 0.69 | −187.4 | −1107.2, 732.5 | 0.68 | 3.7 | −47.1, 54.5 | 0.88 | −131.5 | −3594.1, 3331.2 | 0.94 |
| neurological | 213.6 | −1130.1, 1557.3 | 0.75 | 290.6 | −174.2, 755.5 | 0.21 | 287.9 | −158.7, 734.6 | 0.2 | 7.8 | −17.0, 32.6 | 0.52 | 376.7 | −1319.7, 2073.0 | 0.65 |
Disclaimer/Publisher’s Note: The statements, opinions and data contained in all publications are solely those of the individual author(s) and contributor(s) and not of MDPI and/or the editor(s). MDPI and/or the editor(s) disclaim responsibility for any injury to people or property resulting from any ideas, methods, instructions or products referred to in the content. |
© 2025 by the authors. Licensee MDPI, Basel, Switzerland. This article is an open access article distributed under the terms and conditions of the Creative Commons Attribution (CC BY) license (https://creativecommons.org/licenses/by/4.0/).
Share and Cite
Elyes, M.; Heesen, P.; Schelling, G.; Bode-Lesniewska, B.; Studer, G.; Fuchs, B.; on behalf of the Swiss Sarcoma Network. Pain Accelerates, Swelling and Sensory Disturbances Delay Diagnosis in Mesenchymal Tumors. Cancers 2025, 17, 510. https://doi.org/10.3390/cancers17030510
Elyes M, Heesen P, Schelling G, Bode-Lesniewska B, Studer G, Fuchs B, on behalf of the Swiss Sarcoma Network. Pain Accelerates, Swelling and Sensory Disturbances Delay Diagnosis in Mesenchymal Tumors. Cancers. 2025; 17(3):510. https://doi.org/10.3390/cancers17030510
Chicago/Turabian StyleElyes, Maria, Philip Heesen, Georg Schelling, Beata Bode-Lesniewska, Gabriela Studer, Bruno Fuchs, and on behalf of the Swiss Sarcoma Network. 2025. "Pain Accelerates, Swelling and Sensory Disturbances Delay Diagnosis in Mesenchymal Tumors" Cancers 17, no. 3: 510. https://doi.org/10.3390/cancers17030510
APA StyleElyes, M., Heesen, P., Schelling, G., Bode-Lesniewska, B., Studer, G., Fuchs, B., & on behalf of the Swiss Sarcoma Network. (2025). Pain Accelerates, Swelling and Sensory Disturbances Delay Diagnosis in Mesenchymal Tumors. Cancers, 17(3), 510. https://doi.org/10.3390/cancers17030510