Serum Fourier-Transform Infrared Spectroscopy with Machine Learning for Screening of Pediatric Acute Lymphoblastic Leukemia: A Proof-of-Concept Study
Simple Summary
Abstract
1. Introduction
2. Materials and Methods
2.1. Patient Material and Ethical Approval
2.2. Sample Preparation and Spectral Acquisition
2.3. Computational Preprocessing and Analysis
3. Results
3.1. Spectral Preprocessing and Global Overview

| Peak (cm−1) | Tentative Assignment | Direction (LEUK-PD vs. CONTROLS) | Effect Size (Cohen’s d) | q-Value |
|---|---|---|---|---|
| 1640 (amide I) | C=O stretching of proteins | ↑ LEUK-PD | 0.85 | 0.004 |
| 1545 (amide II) | N–H bending, C–N stretching | ↑ LEUK-PD | 0.62 | 0.021 |
| 1450 (CH2 scissoring) | Lipids/protein backbone | ↓ LEUK-PD | 0.55 | 0.030 |
| 2920 (CH2 stretch) | Lipids | ↓ LEUK-PD | 0.70 | 0.015 |
| 1080 (C–O, PO2−) | Nucleic acids/carbohydrates | ↑ LEUK-PD | 0.58 | 0.040 |
3.2. Peak-Level Analysis
3.3. Multivariate Classification
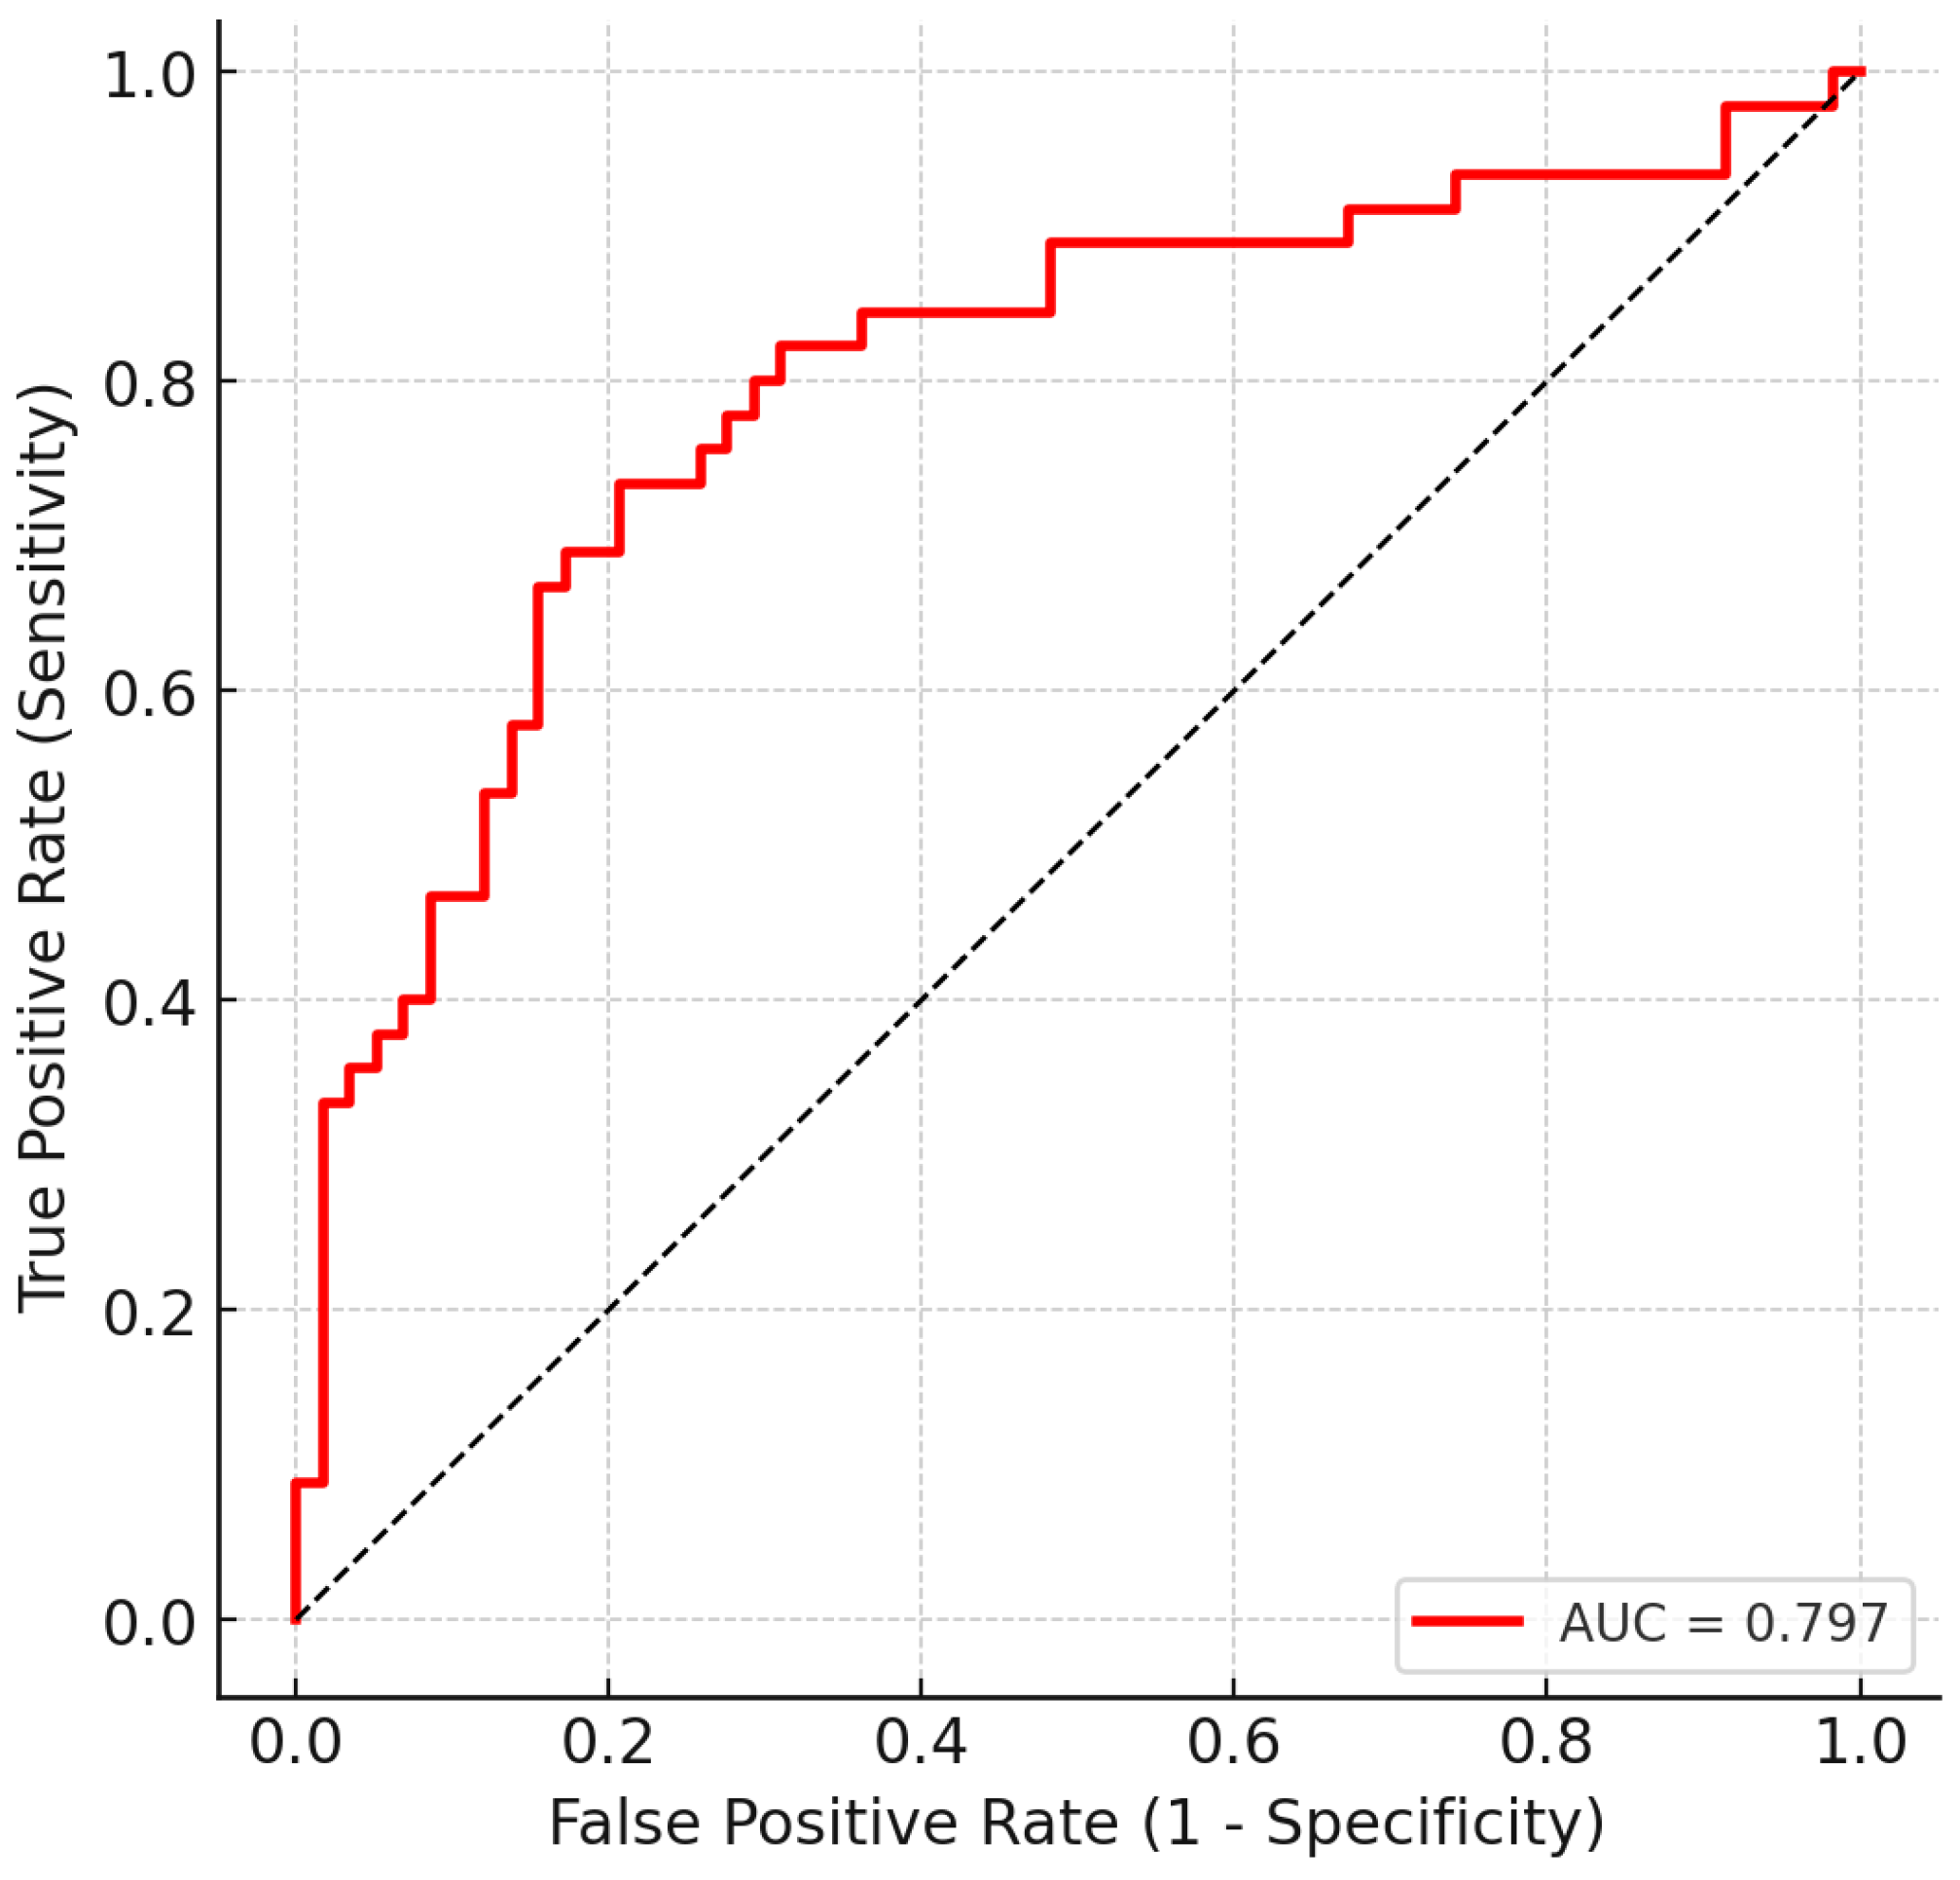
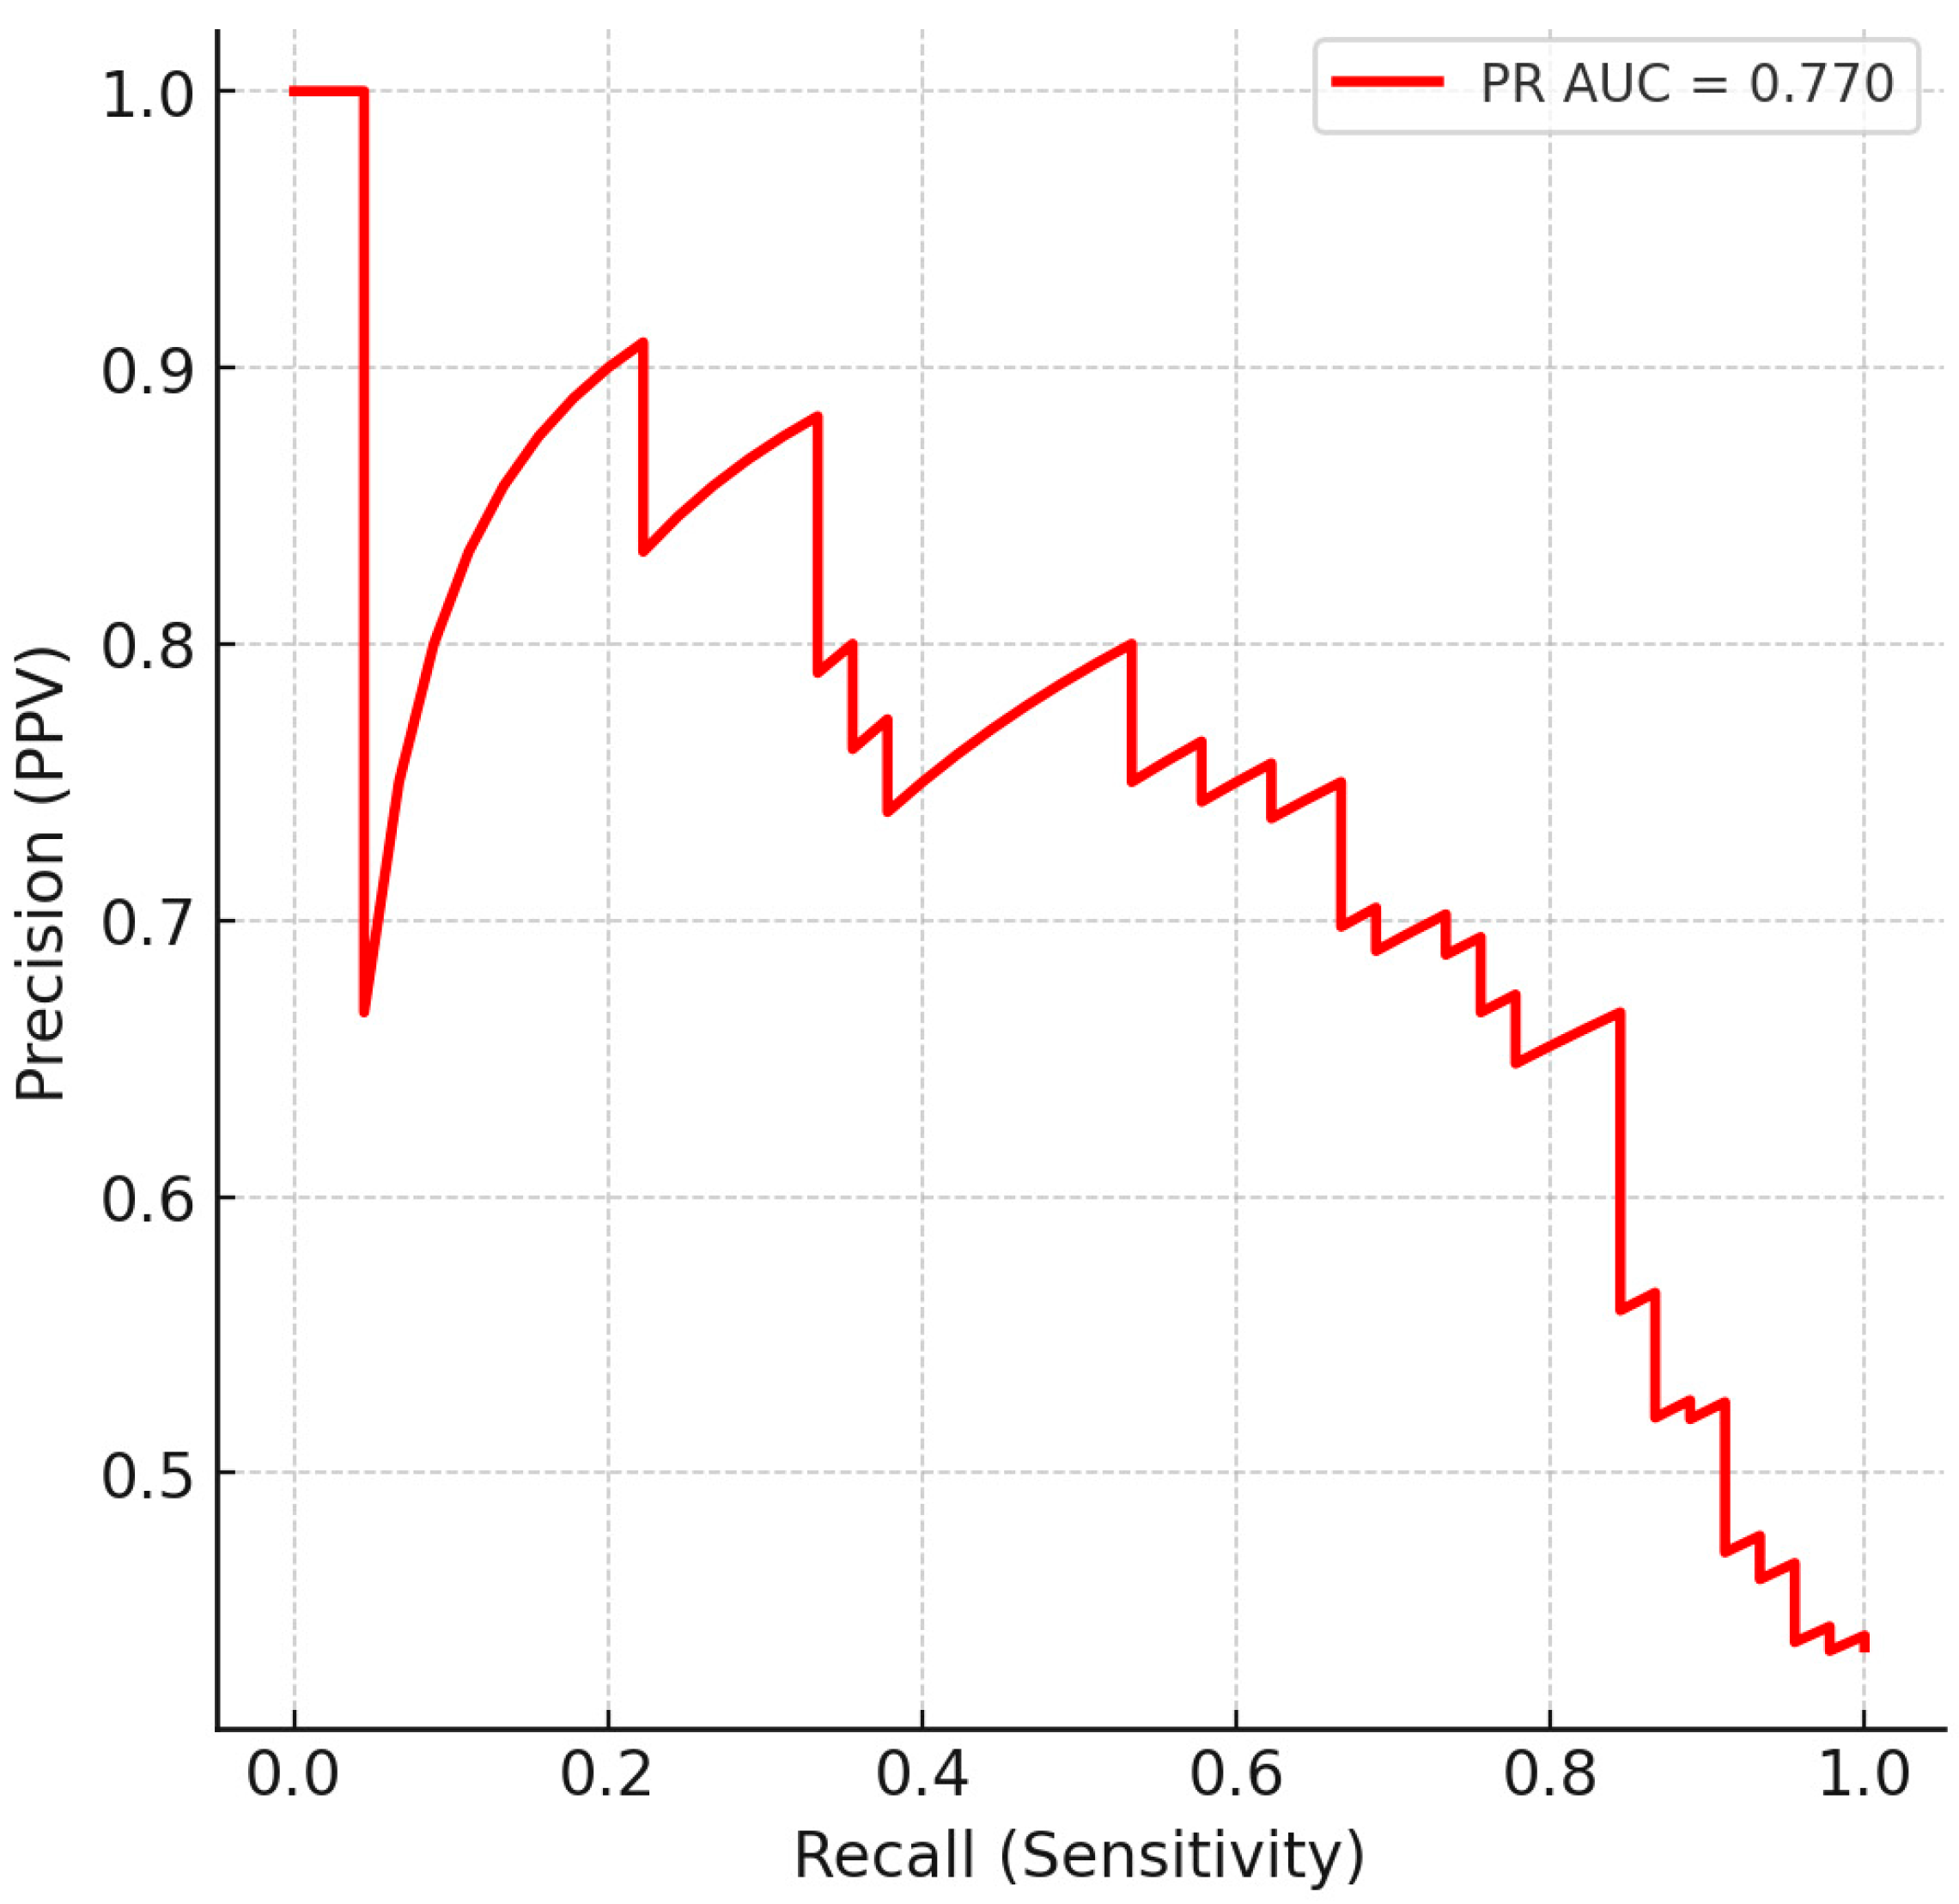
3.4. Confusion Matrix and Operating Characteristics
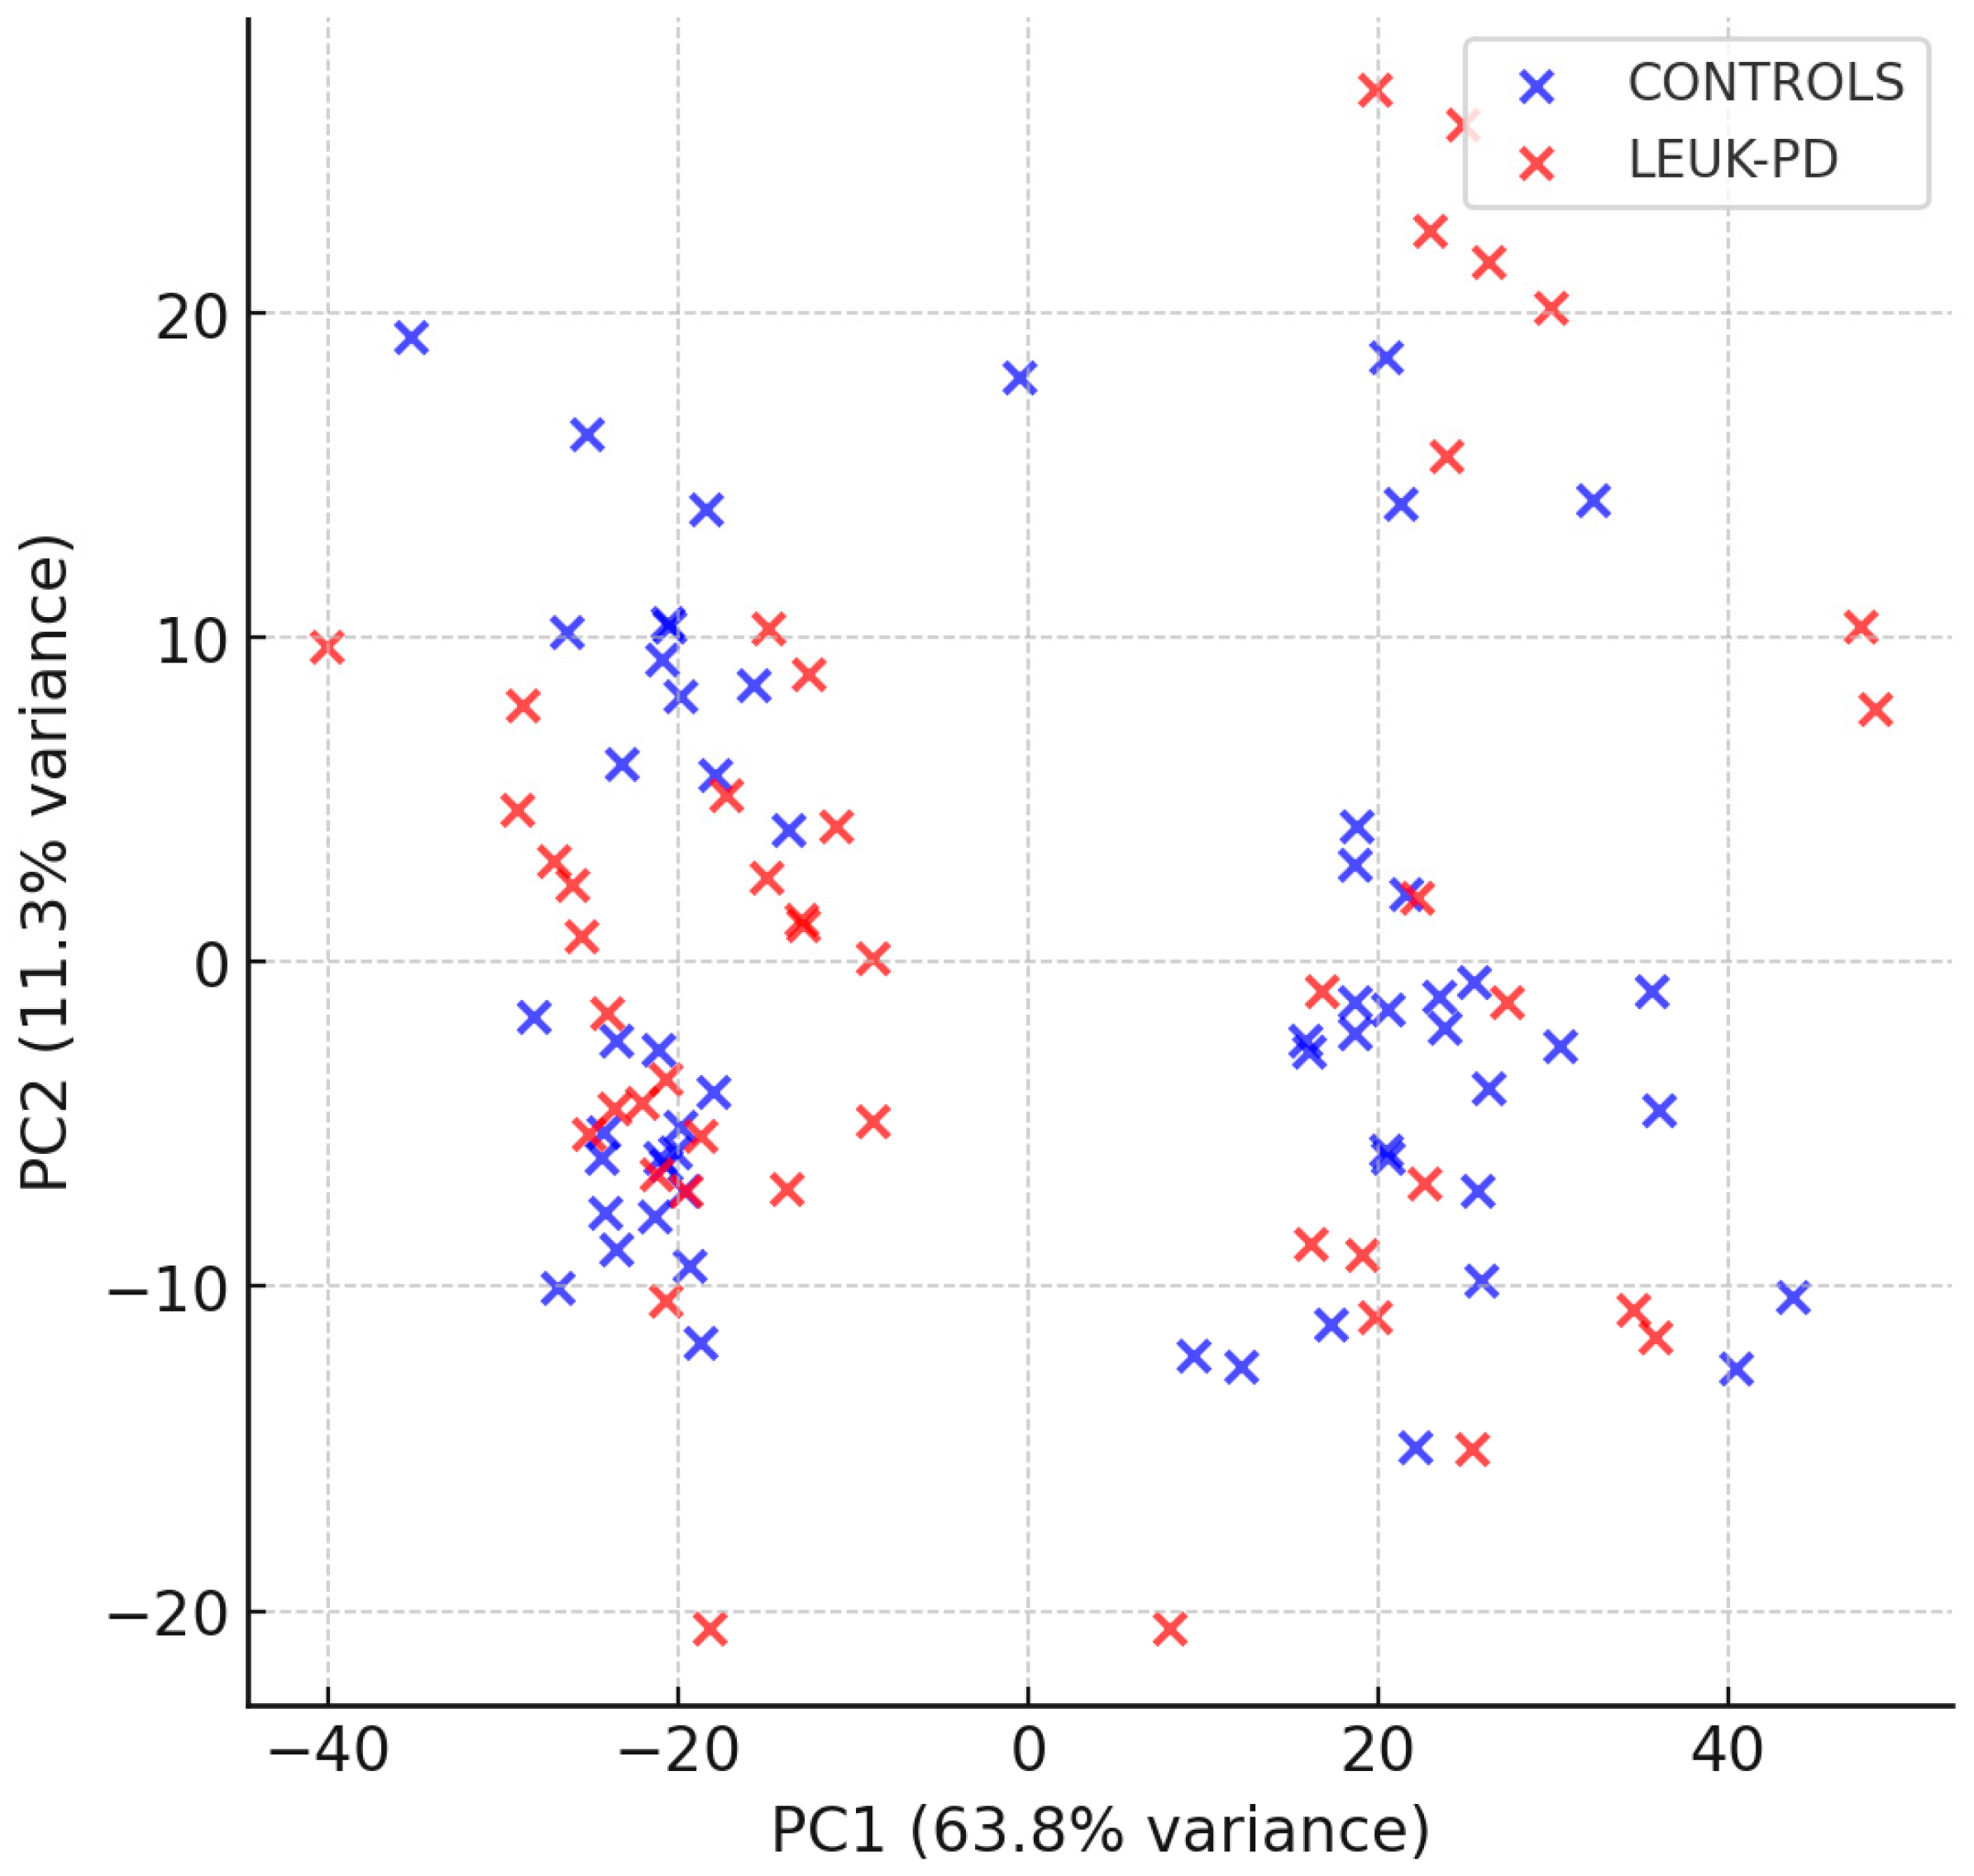
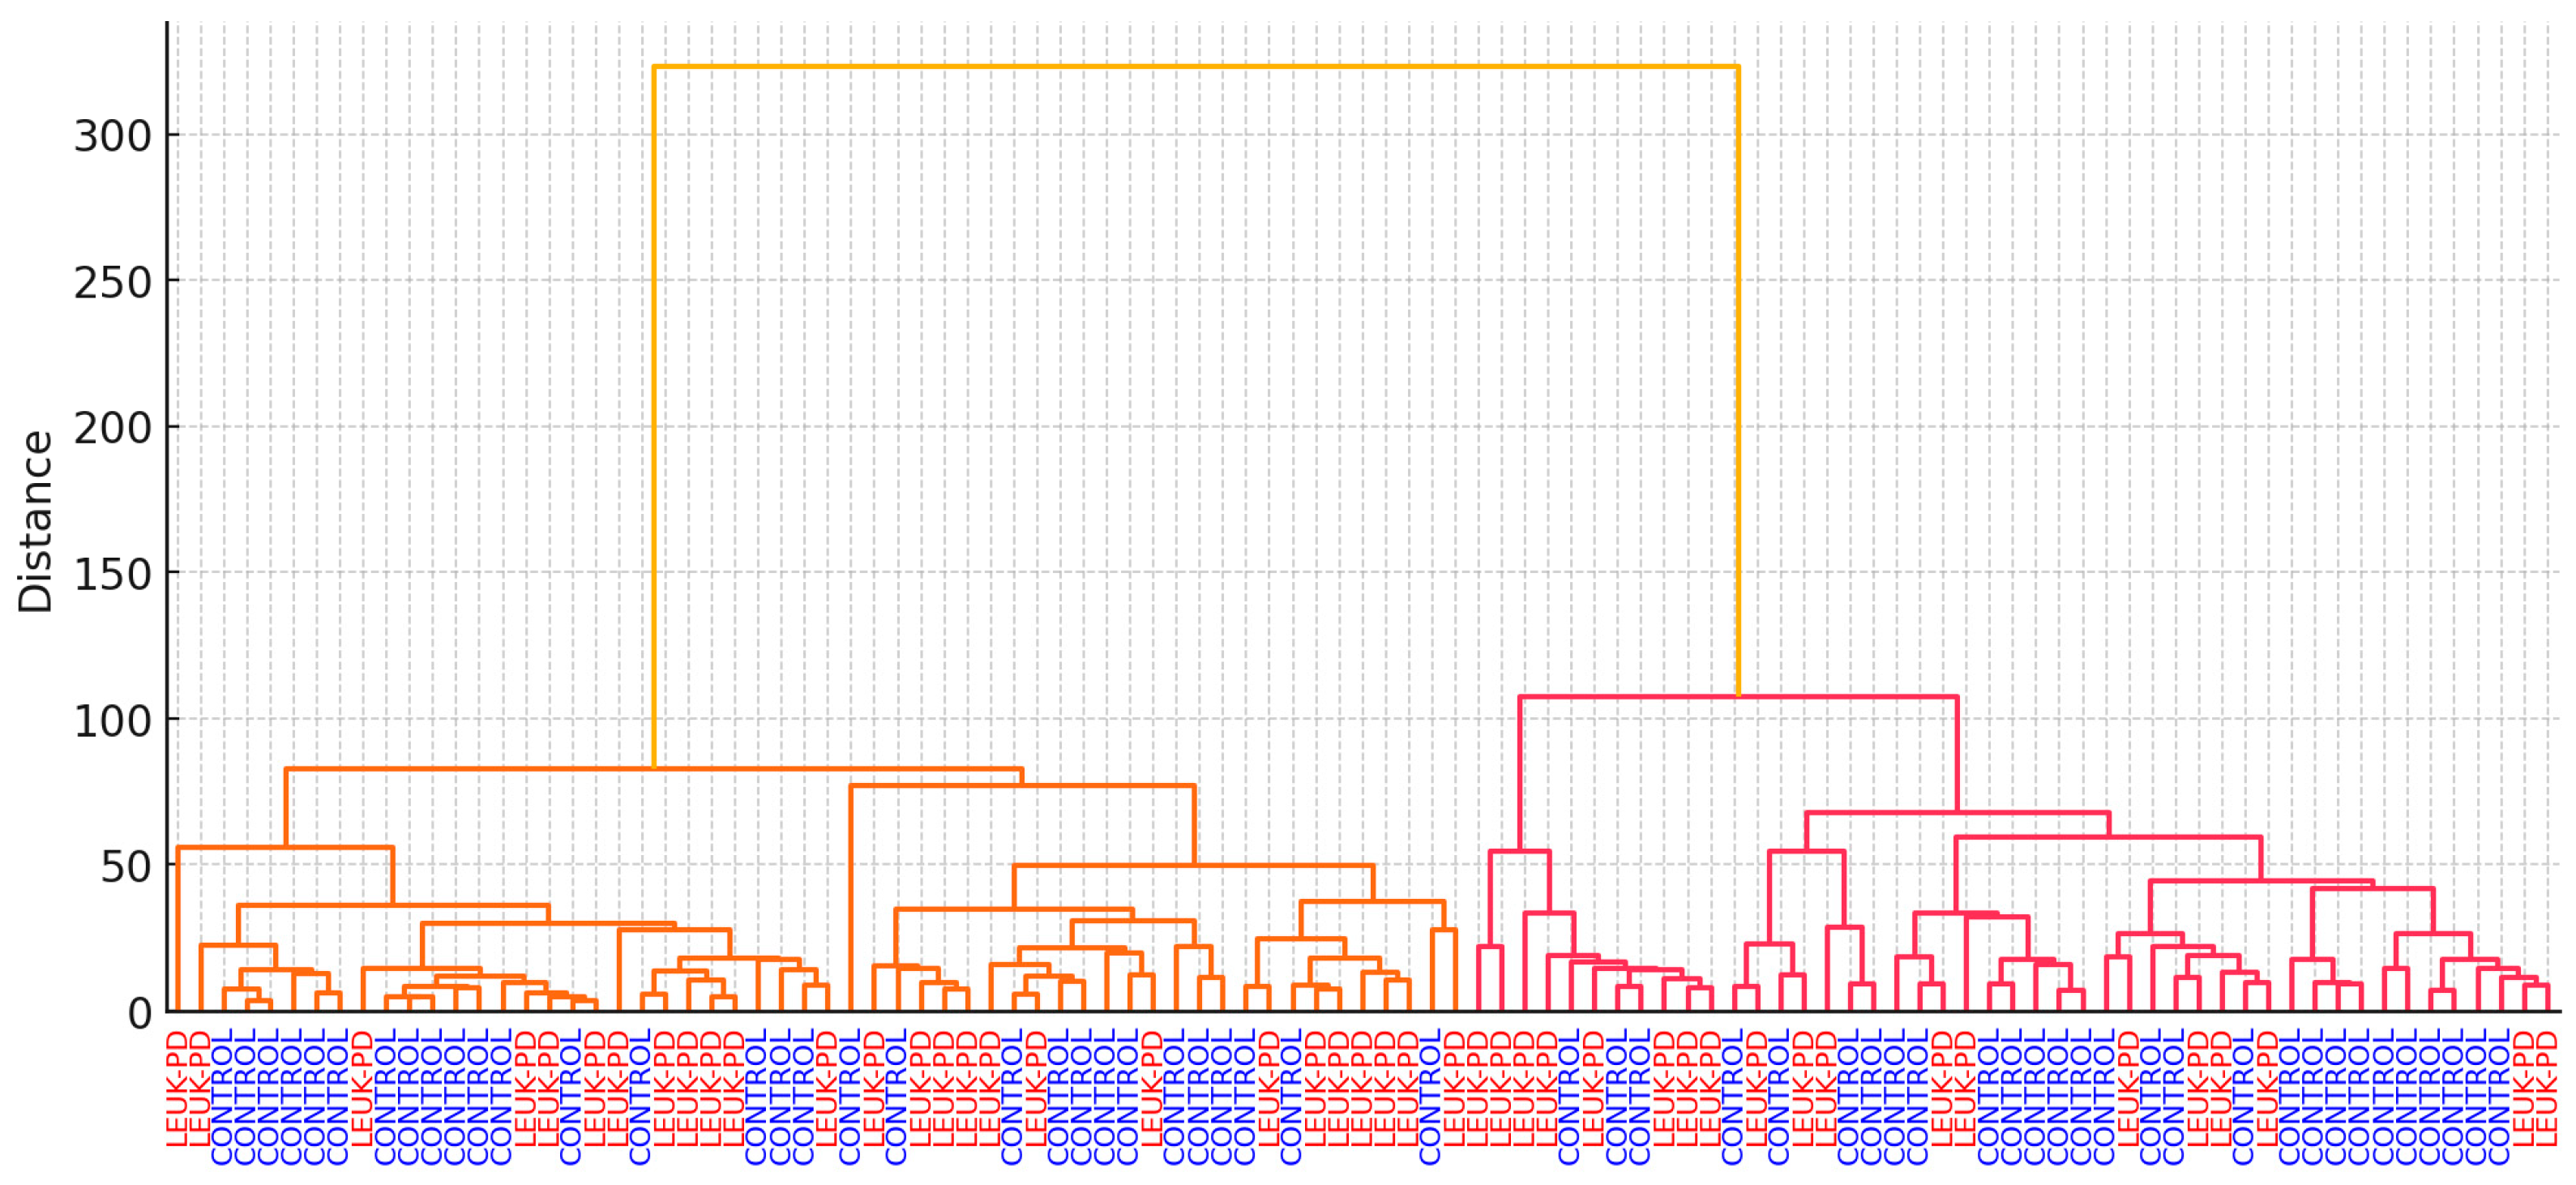
3.5. PCA and HCA
3.6. Stability Analysis
3.7. Alternative Classification Methods for Spectral Discrimination
4. Discussion
5. Conclusions
Supplementary Materials
Author Contributions
Funding
Institutional Review Board Statement
Informed Consent Statement
Data Availability Statement
Acknowledgments
Conflicts of Interest
Abbreviations
| ALL | Acute Lymphoblastic Leukemia |
| ATR | Attenuated Total Reflection |
| AUC | Area Under the Curve |
| AsLS | Asymmetric Least Squares |
| BM | Bone Marrow |
| CaF2 | Calcium Fluoride |
| EDTA | Ethylenediaminetetraacetic Acid |
| FDR | False Discovery Rate |
| FTIR/FT-IR | Fourier-Transform Infrared (Spectroscopy) |
| HC | Healthy Controls |
| HEMC | Hematology Controls (non-ALL) |
| HCA | Hierarchical Cluster Analysis |
| IC-BFM | International Berlin-Frankfurt-Münster protocol |
| LDA | Linear Discriminant Analysis |
| LEUK-PD | Pediatric Leukemia (ALL patients at diagnosis) |
| MCC | Matthews Correlation Coefficient |
| MRD | Minimal Residual Disease |
| MCT | Mercury Cadmium Telluride (detector) |
| OPUS | Operating Program for Universal Spectroscopy (Bruker software) |
| OOF | Out-Of-Fold (predictions) |
| PCA | Principal Component Analysis |
| PBS | Peripheral Blood Smear |
| PR | Precision–Recall |
| ROC | Receiver Operating Characteristic |
| SAA | Severe Aplastic Anemia |
| S-Monovette | Safety-Monovette (blood collection system, Sarstedt) |
| SNV | Standard Normal Variate (normalization) |
| SVM | Support Vector Machine |
References
- National Cancer Institute. Childhood Acute Lymphoblastic Leukemia Treatment (PDQ®)–Health Professional Version. In PDQ Cancer Information Summaries (NCI). Available online: https://www.cancer.gov/types/leukemia/hp/child-all-treatment-pdq (accessed on 2 September 2025).
- Porcu, P.; Cripe, L.D.; Ng, E.W.; Bhatia, S.; Danielson, C.M.; Orazi, A.; McCarthy, L.J. Hyperleukocytic leukemias and leukostasis: A review of pathophysiology, clinical presentation and management. Leuk Lymphoma. 2000, 39, 1–18. [Google Scholar] [CrossRef] [PubMed]
- Erlacher, M.; Strahm, B. Missing Cells: Pathophysiology, Diagnosis, and Management of (Pan)Cytopenia in Childhood. Front. Pediatr. 2015, 3, 64. [Google Scholar] [CrossRef] [PubMed]
- Terwilliger, T.; Abdul-Hay, M. Acute lymphoblastic leukemia: A comprehensive review and 2017 update. Blood Cancer J. 2017, 7, e577. [Google Scholar] [CrossRef]
- Movasaghi, Z.; Rehman, S.; Rehman, I.U. Fourier Transform Infrared (FTIR) Spectroscopy of Biological Tissues. Appl. Spectrosc. Rev. 2008, 43, 134–179. [Google Scholar] [CrossRef]
- Baker, M.J.; Trevisan, J.; Bassan, P.; Bhargava, R.; Butler, H.J.; Dorling, K.M.; Fielden, P.R.; Fogarty, S.W.; Fullwood, N.J.; Heys, K.A.; et al. Using Fourier transform IR spectroscopy to analyze biological materials. Nat. Protoc. 2014, 9, 1771–1791. [Google Scholar] [CrossRef]
- Hands, J.R.; Dorling, K.M.; Abel, P.; Ashton, K.M.; Brodbelt, A.; Davis, C.; Dawson, T.; Jenkinson, M.D.; Lea, R.W.; Walker, C.; et al. Attenuated Total Reflection Fourier Transform Infrared (ATR-FTIR) spectral discrimination of brain tumour severity from serum samples. J. Biophotonics 2014, 7, 189–199. [Google Scholar] [CrossRef]
- Ollesch, J.; Drees, S.L.; Heise, H.M.; Behrens, T.; Brüning, T.; Gerwert, K. FTIR spectroscopy of biofluids revisited: An automated approach to spectral biomarker identification. Anal. 2013, 138, 4092–4102. [Google Scholar] [CrossRef]
- Butler, H.J.; Ashton, L.; Bird, B.; Cinque, G.; Curtis, K.; Dorney, J.; Esmonde-White, K.; Fullwood, N.J.; Gardner, B.; Martin-Hirsch, P.L.; et al. Using Raman spectroscopy to characterize biological materials. Nat. Protoc. 2016, 11, 664–687. [Google Scholar] [CrossRef]
- Eilers, P.H.C. A Perfect Smoother. Anal. Chem. 2003, 75, 3631–3636. [Google Scholar] [CrossRef]
- Savitzky, A.; Golay, M.J.E. Smoothing and Differentiation of Data by Simplified Least Squares Procedures. Anal. Chem. 1964, 36, 1627–1639. [Google Scholar] [CrossRef]
- Barnes, R.J.; Dhanoa, M.S.; Lister, S.J. Standard Normal Variate Transformation and De-Trending of Near-Infrared Diffuse Reflectance Spectra. Appl. Spectrosc. 1989, 43, 772–777. [Google Scholar] [CrossRef]
- Benjamini, Y.; Hochberg, Y. Controlling the False Discovery Rate: A Practical and Powerful Approach to Multiple Testing. J. R. Stat. Soc. Ser. B Methodol. 1995, 57, 289–300. [Google Scholar] [CrossRef]
- Pedregosa, F.; Varoquaux, G.; Gramfort, A.; Michel, V.; Thirion, B.; Grisel, O.; Blondel, M.; Prettenhofer, P.; Weiss, R.; Dubourg, V.; et al. Scikit-learn: Machine Learning in Python. J. Mach. Learn. Res. 2011, 12, 2825–2830. [Google Scholar]
- Harris, C.R.; Millman, K.J.; van der Walt, S.J.; Gommers, R.; Virtanen, P.; Cournapeau, D.; Wieser, E.; Taylor, J.; Berg, S.; Smith, N.J.; et al. Array programming with NumPy. Nature 2020, 585, 357–362. [Google Scholar] [CrossRef]
- McKinney, W. Data structures for statistical computing in python. In Proceedings of the 9th Python in Science Conference, Austin, TX, USA, 28 June–3 July 2010; Volume 445, pp. 51–56. [Google Scholar]
- Virtanen, P.; Gommers, R.; Oliphant, T.E.; Haberland, M.; Reddy, T.; Cournapeau, D.; Burovski, E.; Peterson, P.; Weckesser, W.; Bright, J.; et al. SciPy 1.0 Contributors. SciPy 1.0 Fundamental Algorithms for Scientific Computing in Python. Nat. Methods 2020, 17, 261–272. [Google Scholar] [CrossRef]
- Hunter, J.D. Matplotlib: A 2D graphics environment. Comput. Sci. Eng. 2007, 9, 90–95. [Google Scholar] [CrossRef]
- Waskom, M.L. seaborn: Statistical data visualization. J. Open Source Softw. 2021, 6, 3021. [Google Scholar] [CrossRef]
- Theakstone, A.G.; Rinaldi, C.; Butler, H.J.; Cameron, J.M.; Confield, L.R.; Rutherford, S.H.; Sala, A.; Sangamnerkar, S.; Baker, M.J. Fourier-transform infrared spectroscopy of biofluids: A practical approach. Transl. Biophotonics 2021, 3, e202000025. [Google Scholar] [CrossRef]
- Chaber, R.; Kowal, A.; Jakubczyk, P.; Arthur, C.; Łach, K.; Wojnarowska-Nowak, R.; Kusz, K.; Zawlik, I.; Paszek, S.; Cebulski, J. A Preliminary Study of FTIR Spectroscopy as a Potential Non-Invasive Screening Tool for Pediatric Precursor B Lymphoblastic Leukemia. Molecules 2021, 26, 1174. [Google Scholar] [CrossRef]
- Delrue, C.; Speeckaert, R.; Oyaert, M.; Kerre, T.; Rottey, S.; Coopman, R.; Huvenne, W.; De Bruyne, S.; Speeckaert, M.M. Infrared Spectroscopy: A New Frontier in Hematological Disease Diagnosis. Int. J. Mol. Sci. 2023, 24, 17007. [Google Scholar] [CrossRef]
- Liu, K.-Z.; Shi, M.-H.; Mantsch, H.H. Molecular and chemical characterization of blood cells by infrared spectroscopy: A new optical tool in hematology. Blood Cells, Mol. Dis. 2005, 35, 404–412. [Google Scholar] [CrossRef]
- Mostaço-Guidolin, L.B.; Bachmann, L. Application of FTIR Spectroscopy for Identification of Blood and Leukemia Biomarkers: A Review over the Past 15 Years. Appl. Spectrosc. Rev. 2011, 46, 388–404. [Google Scholar] [CrossRef]
- Lee, M.; Sy, C.E.; Mesina, F.; Caguioa, P.; Castillo, M.R.I.; Bangaoil, R.; Punay, J.; Cobarrubias, M.C.; Tomas, R.C.; Albano, P.M. Acute Leukemia Diagnosis Through AI-Enhanced Attenuated Total Reflection Fourier Transform Infrared Spectroscopy of Peripheral Blood Smears. Appl. Spectrosc. 2025, 79, 967–985. [Google Scholar]
- Mordechai, S.; Mordehai, J.; Ramesh, J.; Levi, C.; Huleihal, M.; Erukhimovitch, V.; Moser, A.; Kapelushnik, J. Application of FTIR Microspectroscopy for the Follow-Up of Childhood Leukemia Chemotherapy; International Symposium on Optical Science and Technology: San Diego, CA, USA, 2001. [Google Scholar]
- Liu, K.; Xu, M.; Scott, D.A. Biomolecular characterisation of leucocytes by infrared spectroscopy. Br. J. Haematol. 2007, 136, 713–722. [Google Scholar] [CrossRef] [PubMed]
- Raouf, G.; Elkhateeb, W.; Toumah, H.; Quari, M.; Jaouni, S.; Elkebba, K.; Kumosani, T. Infrared spectroscopy of human bone marrow: Evidence of structural changes during acute leukemia. Int. J. Nano Biomater. 2009, 2, 289. [Google Scholar] [CrossRef]
- Babrah, J.; McCarthy, K.; Lush, R.J.; Rye, A.D.; Bessant, C.; Stone, N. Fourier transform infrared spectroscopic studies of T-cell lymphoma, B-cell lymphoid and myeloid leukaemia cell lines. Analyst 2008, 134, 763–768. [Google Scholar] [CrossRef] [PubMed]
- Babrah, J. A Study of FT-IR Spectroscopy for the Identification and Classification of Haematological Malignancies. Ph.D. Thesis, Cranfield University, Bedford, UK, 2009. Available online: http://dspace.lib.cranfield.ac.uk/handle/1826/4594 (accessed on 2 September 2025).
- Alamin, H.J.A. Spectroscopic Characterization of Leukemia Samples Using Laser Raman and Fourier Transform Infrared Spectroscopy. Ph.D. Thesis, Sudan University of Science and Technology, Khartoum, Sudan, 2011. [Google Scholar]
- Chandramalar, M.I.; Sankari, G. FTIR Spectral Investigation on Healthy and Cancerous Blood Samples-Acute Lymphocytic Leukemia (ALL) Coupled with Statistical Analysis. Der Pharma Chem. 2017, 9, 16–20. [Google Scholar]
- Huleihel, M.; Salman, A.; Talyshinsky, M.; Souprun, Y.; Erukhimovitch, V. Microspectroscopic investigation of malignant cells from cell culture and leukemic patients. Spectrosc. 2003, 17, 469–476. [Google Scholar] [CrossRef]
- Raouf, G.A.; Al Jaouni, S.K. Novel methodology of detecting minimal residual disease in acute lymphoblastic leukemia by using FTIR spectroscopy. J. Appl. Hematol. 2010, 1, 102–107. [Google Scholar]
- Chechekina, O.; Tropina, E.; Fatkhutdinova, L.; Zyuzin, M.; Bogdanov, A.; Ju, Y.; Boldyrev, K. Machine learning assisted rapid approach for quantitative prediction of biochemical parameters of blood serum with FTIR spectroscopy. Spectrochim. Acta Part A Mol. Biomol. Spectrosc. 2024, 326, 125283. [Google Scholar] [CrossRef]


| Group | No of Patients | Female/Male | Age (Years), Mean [Range] | Diagnoses |
|---|---|---|---|---|
| LEUK-PD (ALL) | 45 | 22/23 | 7.3 [1–17.6] | B-ALL (43), T-ALL (5); median blasts 85% |
| HEMC (hematology controls) | 44 | 20/24 | 10.5 [1.3–18.0] | anemia (6), thrombocytopenia (13), leukopenia (16), pancytopenia (8), other (1) |
| HC (healthy controls) | 14 | 7/7 | 10.5 [0.5–18] | Healthy children |
| TOTAL | 103 | |||
| Threshold | Sensitivity | Specificity | Precision | Accuracy | F1 | TP | FN | TN | FP |
|---|---|---|---|---|---|---|---|---|---|
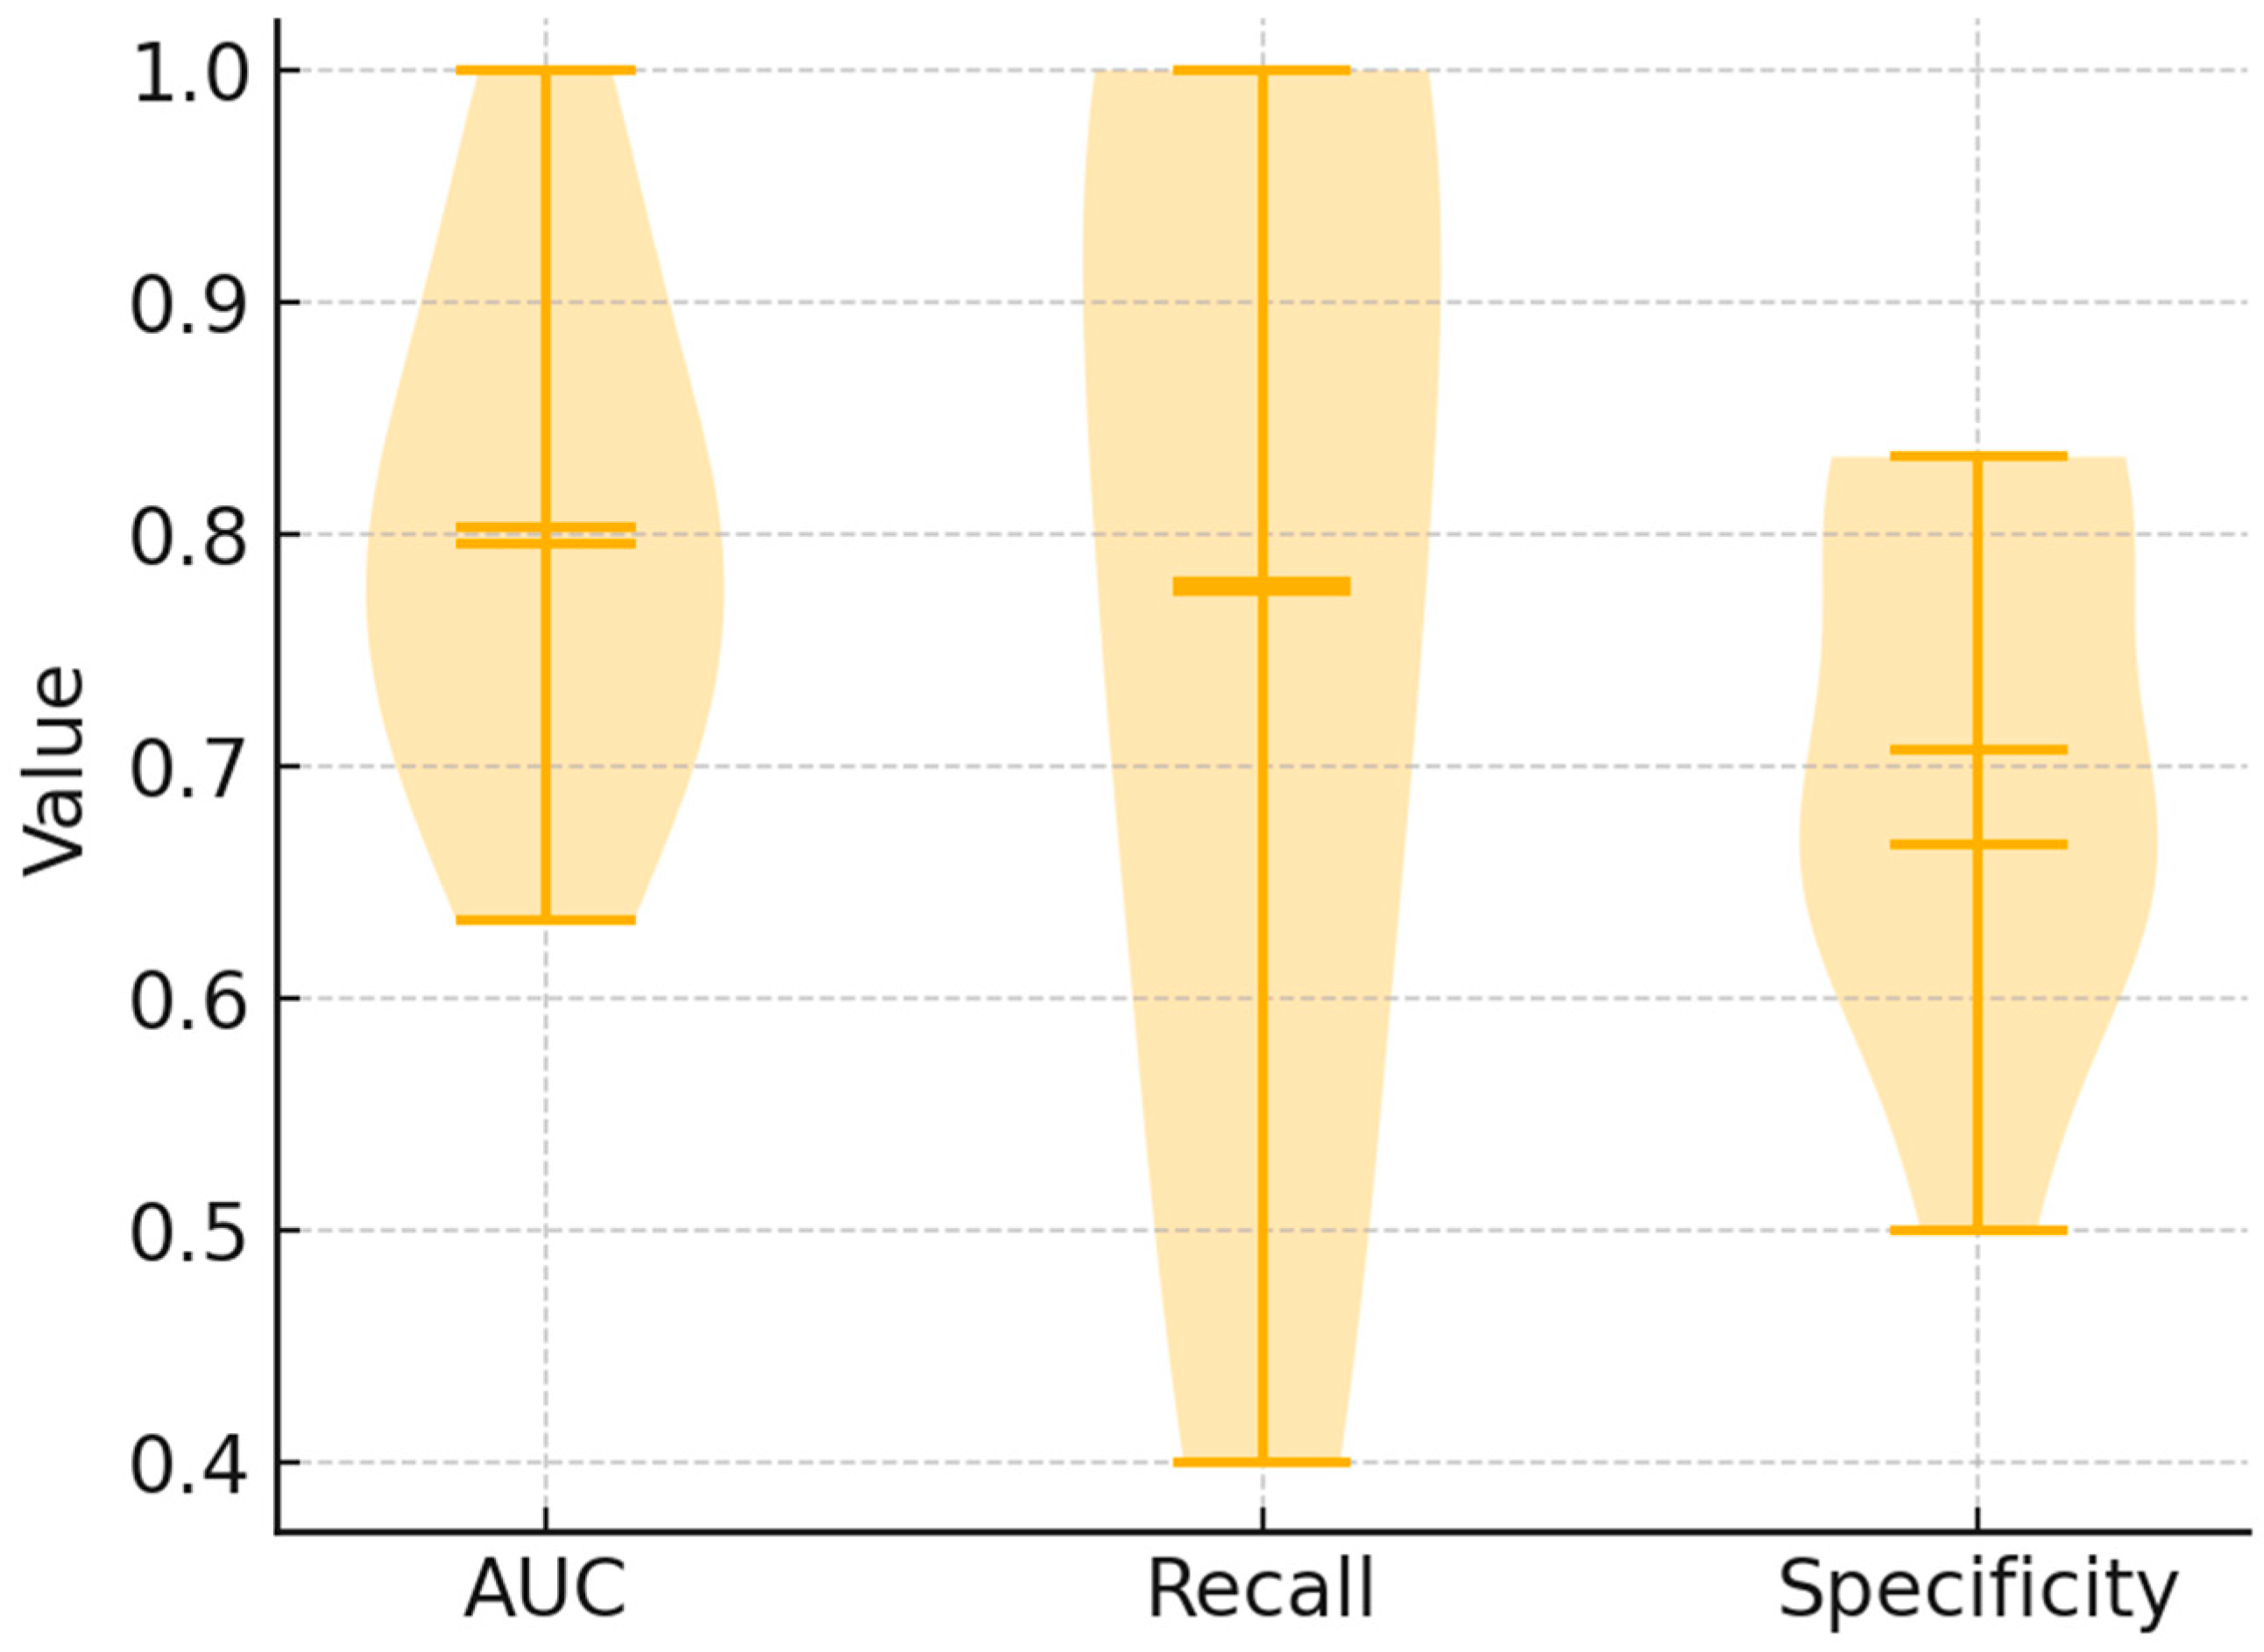
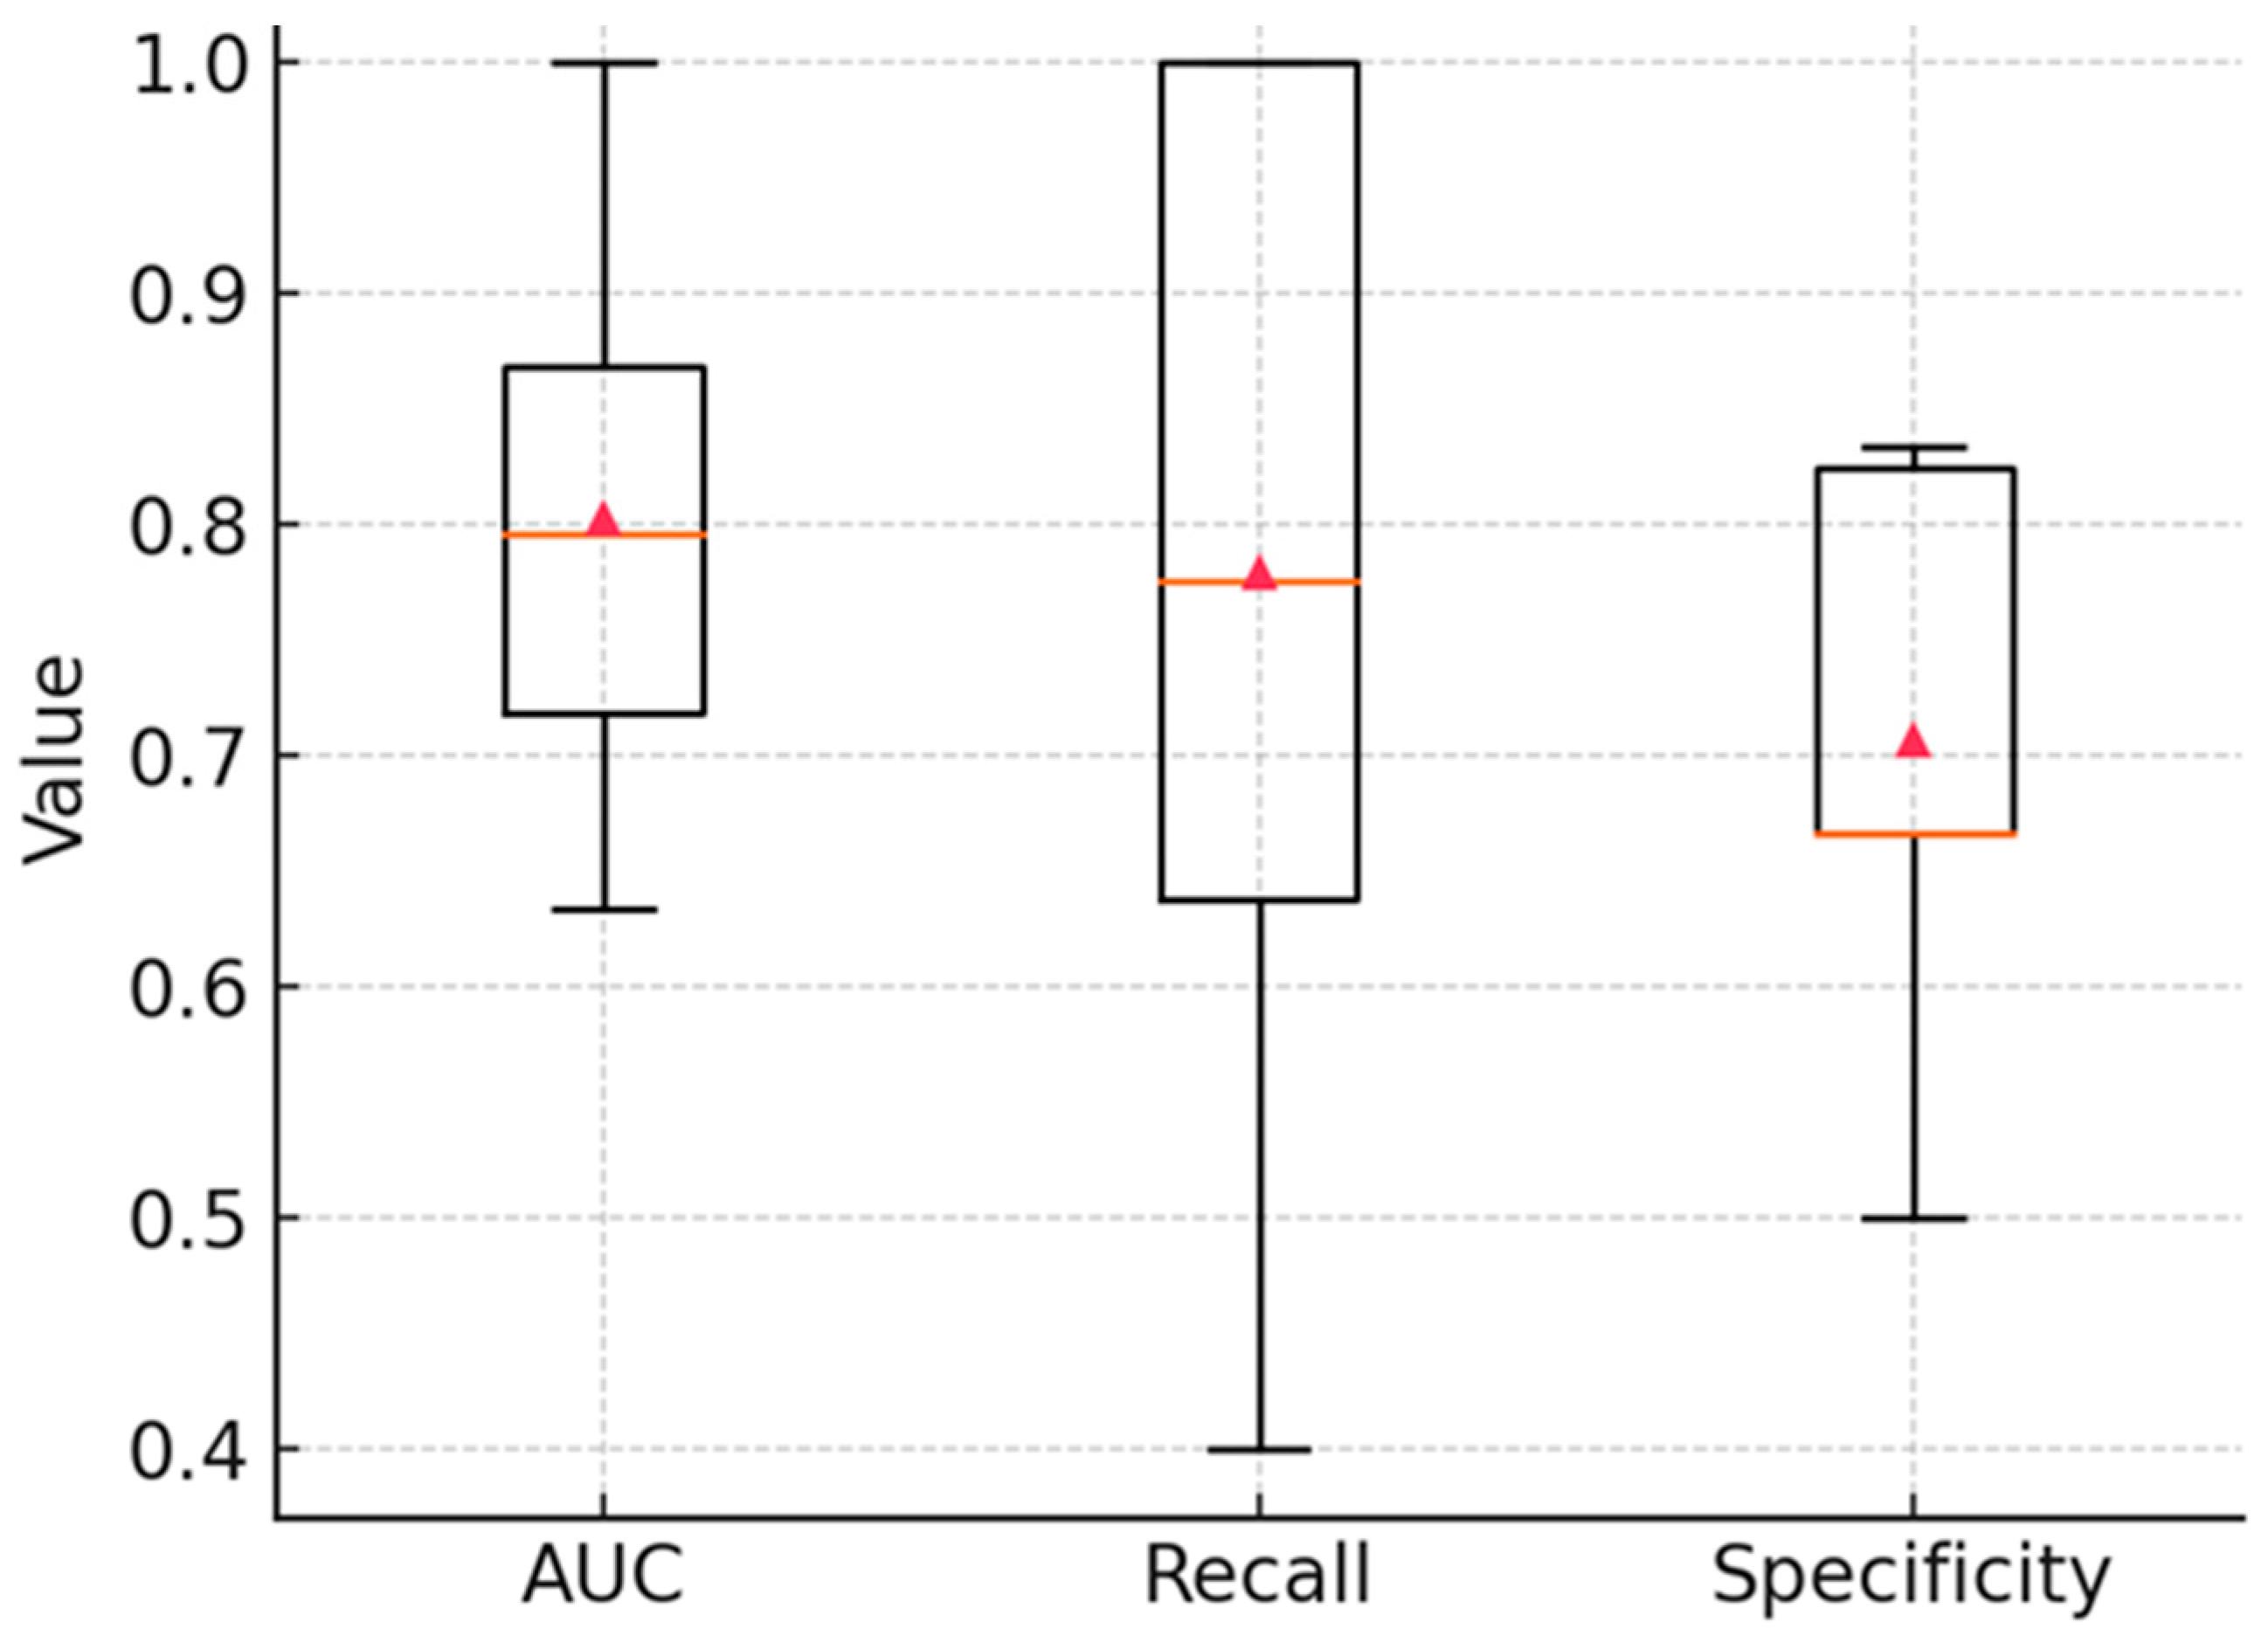
| 0.50 | 0.733 | 0.707 | 0.660 | 0.718 | 0.695 | 33 | 12 | 41 | 17 |
| 0.47 | 0.778 | 0.707 | 0.673 | 0.738 | 0.722 | 35 | 10 | 41 | 17 |
| 0.40 | 0.800 | 0.638 | 0.632 | 0.709 | 0.706 | 36 | 9 | 37 | 21 |
| 0.30 | 0.844 | 0.552 | 0.594 | 0.680 | 0.697 | 38 | 7 | 32 | 26 |
| Model | Accuracy | Sensitivity | Specificity | Precision | F1 | ROC AUC | Balanced Acc | MCC |
|---|---|---|---|---|---|---|---|---|
| Logistic Regression | 0.738 | 0.778 | 0.707 | 0.673 | 0.722 | 0.800 | 0.743 | 0.46 |
| SVM (linear) | 0.680 | 0.622 | 0.724 | 0.630 | 0.629 | 0.739 | 0.673 | 0.35 |
| Random Forest | 0.718 | 0.600 | 0.810 | 0.660 | 0.651 | 0.805 | 0.705 | 0.42 |
| LDA | 0.786 | 0.711 | 0.845 | 0.740 | 0.744 | 0.804 | 0.778 | 0.56 |
Disclaimer/Publisher’s Note: The statements, opinions and data contained in all publications are solely those of the individual author(s) and contributor(s) and not of MDPI and/or the editor(s). MDPI and/or the editor(s) disclaim responsibility for any injury to people or property resulting from any ideas, methods, instructions or products referred to in the content. |
© 2025 by the authors. Licensee MDPI, Basel, Switzerland. This article is an open access article distributed under the terms and conditions of the Creative Commons Attribution (CC BY) license (https://creativecommons.org/licenses/by/4.0/).
Share and Cite
Kowal, A.; Jakubczyk, P.; Bal, W.; Piasecka, Z.; Szuler, K.; Łach, K.; Sopel, K.; Cebulski, J.; Chaber, R. Serum Fourier-Transform Infrared Spectroscopy with Machine Learning for Screening of Pediatric Acute Lymphoblastic Leukemia: A Proof-of-Concept Study. Cancers 2025, 17, 3548. https://doi.org/10.3390/cancers17213548
Kowal A, Jakubczyk P, Bal W, Piasecka Z, Szuler K, Łach K, Sopel K, Cebulski J, Chaber R. Serum Fourier-Transform Infrared Spectroscopy with Machine Learning for Screening of Pediatric Acute Lymphoblastic Leukemia: A Proof-of-Concept Study. Cancers. 2025; 17(21):3548. https://doi.org/10.3390/cancers17213548
Chicago/Turabian StyleKowal, Aneta, Paweł Jakubczyk, Wioletta Bal, Zuzanna Piasecka, Klaudia Szuler, Kornelia Łach, Katarzyna Sopel, Józef Cebulski, and Radosław Chaber. 2025. "Serum Fourier-Transform Infrared Spectroscopy with Machine Learning for Screening of Pediatric Acute Lymphoblastic Leukemia: A Proof-of-Concept Study" Cancers 17, no. 21: 3548. https://doi.org/10.3390/cancers17213548
APA StyleKowal, A., Jakubczyk, P., Bal, W., Piasecka, Z., Szuler, K., Łach, K., Sopel, K., Cebulski, J., & Chaber, R. (2025). Serum Fourier-Transform Infrared Spectroscopy with Machine Learning for Screening of Pediatric Acute Lymphoblastic Leukemia: A Proof-of-Concept Study. Cancers, 17(21), 3548. https://doi.org/10.3390/cancers17213548


