

An Explainable AI Exploration of the Machine Learning Classification of Neoplastic Intracerebral Hemorrhage from Non-Contrast CT

 , , , and
Simple Summary
Abstract
1. Introduction
2. Methods
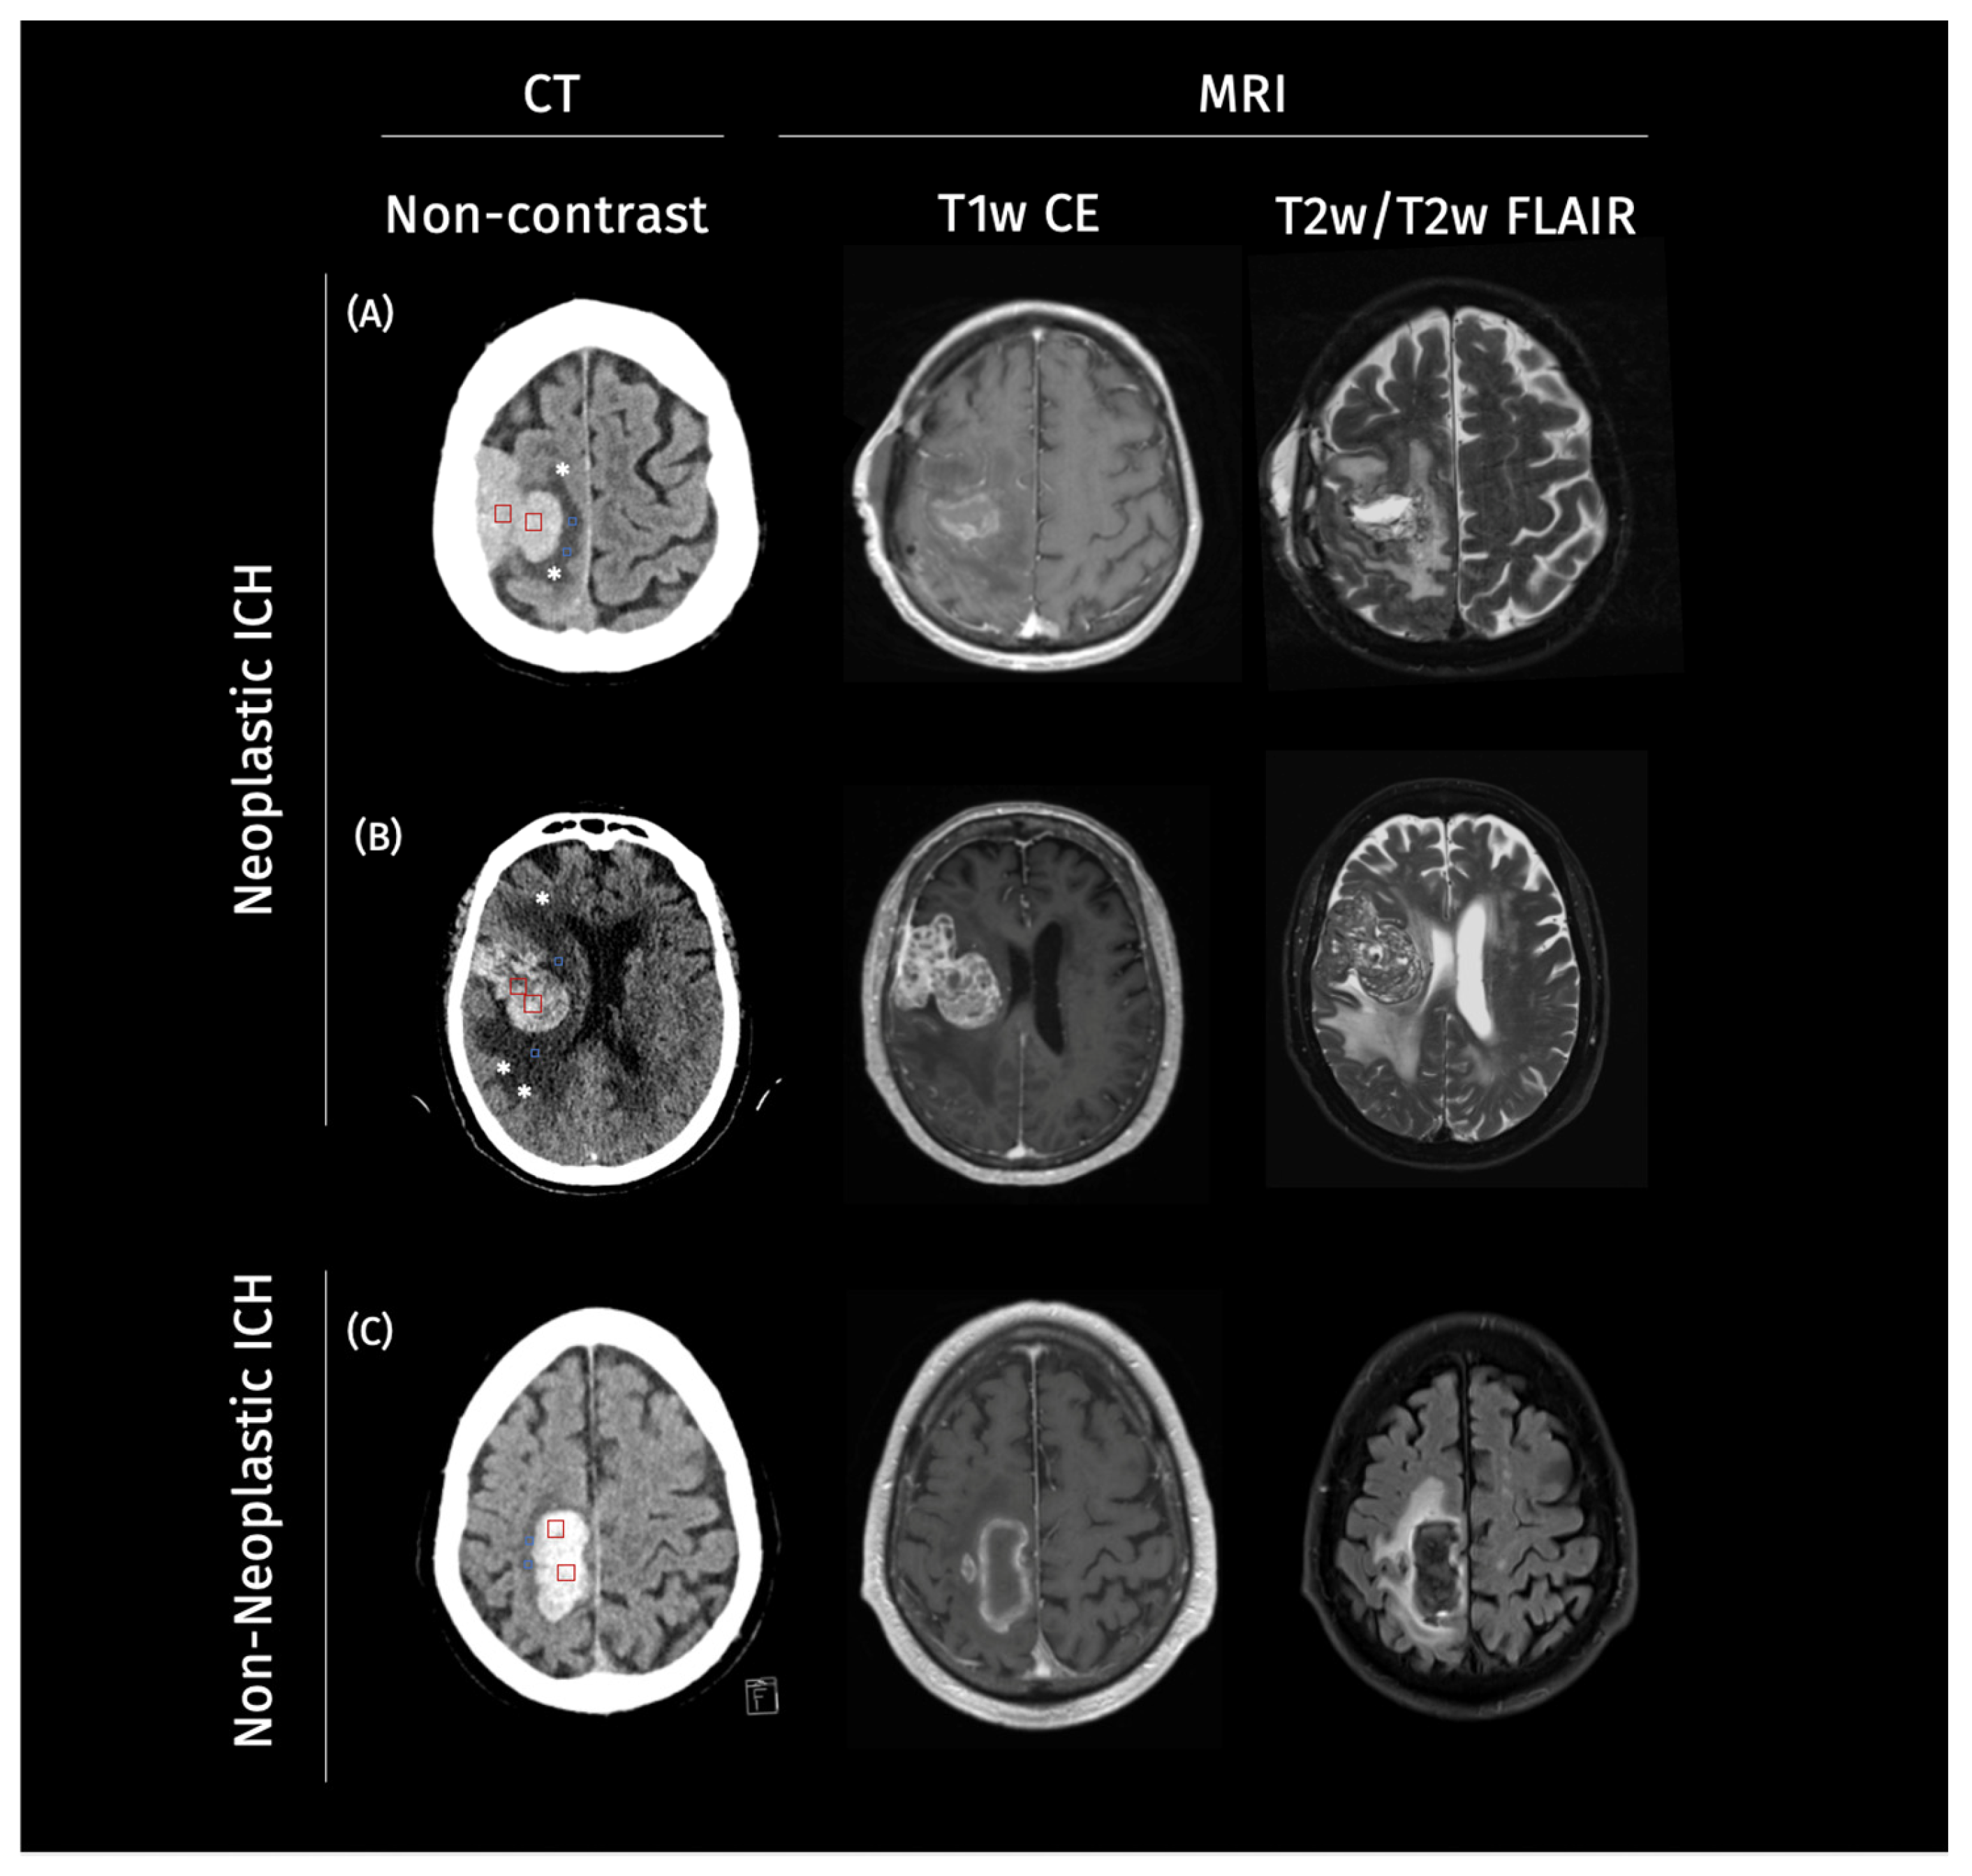
2.1. Study Population
2.2. Image Analysis and Preprocessing
2.3. Classification Pipeline
2.4. Explanation Methods
2.5. Faithfulness Metric
2.6. Statistical Analysis
3. Results
4. Discussion
5. Conclusions
Supplementary Materials
Author Contributions
Funding
Institutional Review Board Statement
Informed Consent Statement
Data Availability Statement
Conflicts of Interest
Abbreviations
| AUC | Area under the Curve |
| CNN | Convolutional Neural Network |
| CT | Computed Tomography |
| ICH | Intracerebral Hemorrhage |
| HU | Hounsfield Units |
| ML | Machine Learning |
| MRI | Magnetic Resonance Imaging |
| NifTI | Neuroimaging Informatics Technology Initiative |
| PACS | Picture Archiving and Communication System |
| PHE | Perihematomal Edema |
| ResNet | Deep Residual Network |
| XAI | Explainable Artificial Intelligence |
References
- Burth, S.; Ohmann, M.; Kronsteiner, D.; Kieser, M.; Löw, S.; Riedemann, L.; Laible, M.; Berberich, A.; Drüschler, K.; Rizos, T.; et al. Prophylactic anticoagulation in patients with glioblastoma or brain metastases and atrial fibrillation: An increased risk for intracranial hemorrhage? J. Neuro-Oncol. 2021, 152, 483–490. [Google Scholar] [CrossRef]
- Ostrowski, R.P.; He, Z.; Pucko, E.B.; Matyja, E. Hemorrhage in brain tumor—An unresolved issue. Brain Hemorrhages 2022, 3, 98–102. [Google Scholar] [CrossRef]
- Choi, G.; Park, D.-H.; Kang, S.-H.; Chung, Y.-G. Glioma mimicking a hypertensive intracerebral hemorrhage. J. Korean Neurosurg. Soc. 2013, 54, 125–127. [Google Scholar] [CrossRef] [PubMed]
- Eminovic, S.; Orth, T.; Dell’oRco, A.; Baumgärtner, L.; Morotti, A.; Wasilewski, D.; Guelen, M.S.; Scheel, M.; Penzkofer, T.; Nawabi, J. Clinical and imaging manifestations of intracerebral hemorrhage in brain tumors and metastatic lesions: A comprehensive overview. J. Neuro-Oncol. 2024, 170, 567–578. (In English) [Google Scholar] [CrossRef] [PubMed]
- Singla, N.; Aggarwal, A.; Vyas, S.; Sanghvi, A.; Salunke, P.; Garg, R. Glioblastoma Multiforme with Hemorrhage Mimicking an Aneurysm: Lessons Learnt. Ann. Neurosci. 2016, 23, 263–265. [Google Scholar] [CrossRef]
- Baiguissova, D.; Laghi, A.; Rakhimbekova, A.; Fakhradiyev, I.; Mukhamejanova, A.; Battalova, G.; Tanabayeva, S.; Zharmenov, S.; Saliev, T.; Kausova, G. An economic impact of incorrect referrals for MRI and CT scans: A retrospective analysis. Health Sci. Rep. 2023, 6, e1102. (In English) [Google Scholar] [CrossRef]
- Haddadi, S.; Dehghani, M.; D’AMato, G. Editorial: Delay in cancer diagnosis and factors affecting outcomes. Front. Public Health 2024, 12, 1442764. [Google Scholar] [CrossRef]
- Khanmohammadi, S.; Mobarakabadi, M.; Mohebi, F. The Economic Burden of Malignant Brain Tumors. Adv. Exp. Med. Biol. 2023, 1394, 209–221. [Google Scholar] [CrossRef]
- McGarvey, N.; Gitlin, M.; Fadli, E.; Chung, K.C. Increased healthcare costs by later stage cancer diagnosis. BMC Health Serv. Res. 2022, 22, 1155. [Google Scholar] [CrossRef]
- Yoo, H.; Jung, E.; Gwak, H.S.; Shin, S.H.; Lee, S.H. Surgical outcomes of hemorrhagic metastatic brain tumors. Cancer Res. Treat. 2011, 43, 102–107. [Google Scholar] [CrossRef]
- Choi, Y.; Rim, T.; Ahn, S.; Lee, S.-K. Discrimination of tumorous intracerebral hemorrhage from benign causes using CT densitometry. Am. J. Neuroradiol. 2015, 36, 886–892. [Google Scholar] [CrossRef]
- Nawabi, J.; Hanning, U.; Broocks, G.; Schön, G.; Schneider, T.; Fiehler, J.; Thaler, C.; Gellissen, S. Neoplastic and non-neoplastic causes of acute intracerebral hemorrhage on CT: The diagnostic value of perihematomal edema. Clin. Neuroradiol. 2020, 30, 271–278. [Google Scholar] [CrossRef]
- Nawabi, J.; Kniep, H.; Kabiri, R.; Broocks, G.; Faizy, T.D.; Thaler, C.; Schön, G.; Fiehler, J.; Hanning, U. Neoplastic and non-neoplastic acute intracerebral hemorrhage in CT brain scans: Machine learning-based prediction using radiomic image features. Front. Neurol. 2020, 11, 285. [Google Scholar] [CrossRef]
- Nawabi, J.; Orth, T.; Schulze-Weddige, S.; Baumgaertner, G.L.; Tietze, A.; Thaler, C.; Penzkofer, T. External validation of the diagnostic value of perihematomal edema characteristics in neoplastic and non-neoplastic intracerebral hemorrhage. Eur. J. Neurol. 2023, 30, 1686–1695. [Google Scholar] [CrossRef]
- Nawabi, J.; Schulze-Weddige, S.; Baumgärtner, G.L.; Orth, T.; Dell’Orco, A.; Morotti, A.; Mazzacane, F.; Kniep, H.; Hanning, U.; Scheel, M.; et al. End-to-end machine learning based discrimination of neoplastic and non-neoplastic intracerebral hemorrhage on computed tomography. Inform. Med. Unlocked 2025, 54, 101633. [Google Scholar] [CrossRef]
- Borys, K.; Schmitt, Y.A.; Nauta, M.; Seifert, C.; Krämer, N.; Friedrich, C.M.; Nensa, F. Explainable AI in medical imaging: An overview for clinical practitioners–Beyond saliency-based XAI approaches. Eur. J. Radiol. 2023, 162, 110786. [Google Scholar] [CrossRef] [PubMed]
- Martí-Fàbregas, J.; Prats-Sánchez, L.; Martínez-Domeño, A.; Camps-Renom, P.; Marín, R.; Jiménez-Xarrié, E.; Fuentes, B.; Dorado, L.; Purroy, F.; Arias-Rivas, S.; et al. The H-ATOMIC criteria for the etiologic classification of patients with intracerebral hemorrhage. PLoS ONE 2016, 11, e0156992. [Google Scholar] [CrossRef] [PubMed]
- Simonyan, K.; Vedaldi, A.; Zisserman, A. Deep inside convolutional networks: Visualising image classification models and saliency maps. arXiv 2013, arXiv:1312.6034. [Google Scholar]
- Shrikumar, A.; Greenside, P.; Shcherbina, A.; Kundaje, A. Not just a black box: Learning important features through propagating activation differences. arXiv 2016, arXiv:1605.01713. [Google Scholar]
- Smilkov, D.; Thorat, N.; Kim, B.; Viégas, F.; Wattenberg, M. Smoothgrad: Removing noise by adding noise. arXiv 2017, arXiv:1706.03825. [Google Scholar] [CrossRef]
- Lundberg, S.M.; Lee, S.-I. A unified approach to interpreting model predictions. Adv. Neural Inf. Process. Syst. 2017, 30. [Google Scholar]
- Selvaraju, R.R.; Cogswell, M.; Das, A.; Vedantam, R.; Parikh, D.; Batra, D. Grad-cam: Visual explanations from deep networks via gradient-based localization. In Proceedings of the 2017 IEEE International Conference on Computer Vision (ICCV), Venice, Italy, 22–29 October 2017; pp. 618–626. [Google Scholar]
- Chattopadhay, A.; Sarkar, A.; Howlader, P.; Balasubramanian, V.N. Grad-cam++: Generalized gradient-based visual explanations for deep convolutional networks. In Proceedings of the 2018 IEEE Winter Conference on Applications of Computer Vision (WACV), Lake Tahoe, NV, USA, 12–15 March 2018; pp. 839–847. [Google Scholar]
- Alvarez Melis, D.; Jaakkola, T. Towards robust interpretability with self-explaining neural networks. Adv. Neural Inf. Process. Syst. 2018, 31. [Google Scholar]
- Drappatz, J. Management of Vasogenic Edema in Patients with Primary and Metastatic Brain Tumors. Charité University Hospital Berlin. Available online: https://www.uptodate.com/contents/management-of-vasogenic-edema-in-patients-with-primary-and-metastatic-brain-tumors (accessed on 19 November 2024).
- Jain, R.; Ellika, S.; Scarpace, L.; Schultz, L.; Rock, J.; Gutierrez, J.; Patel, S.; Ewing, J.; Mikkelsen, T. Quantitative estimation of permeability surface-area product in astroglial brain tumors using perfusion CT and correlation with histopathologic grade. Am. J. Neuroradiol. 2008, 29, 694–700. [Google Scholar] [CrossRef]
- Jain, R.K.; di Tomaso, E.; Duda, D.G.; Loeffler, J.S.; Sorensen, A.G.; Batchelor, T.T. Angiogenesis in brain tumours. Nat. Rev. Neurosci. 2007, 8, 610–622. (In English) [Google Scholar] [CrossRef]
- Carrillo, J.; Lai, A.; Nghiemphu, P.; Kim, H.; Phillips, H.; Kharbanda, S.; Moftakhar, P.; Lalaezari, S.; Yong, W.; Ellingson, B.; et al. Relationship between Tumor Enhancement, Edema, Mutational Status, Promoter Methylation, and Survival in Glioblastoma. Am. J. Neuroradiol. 2012, 33, 1349–1355. (In English) [Google Scholar] [CrossRef] [PubMed]
- Ironside, N.; Chen, C.-J.; Ding, D.; Mayer, S.A.; Connolly, E.S. Perihematomal Edema After Spontaneous Intracerebral Hemorrhage. Stroke 2019, 50, 1626–1633. (In English) [Google Scholar] [CrossRef] [PubMed]
- Lee, K.-W.; Lo, C.-P. Acute cerebral infarction masked by a brain tumor. Case Rep. Neurol. 2011, 3, 179–184. [Google Scholar] [CrossRef] [PubMed]
- Nawabi, J.; Baumgaertner, G.L.; Schulze-Weddige, S.; Dell’Orco, A.; Morotti, A.; Mazzacane, F.; Kniep, H.; Schlunk, F.; Boehmer, M.F.H.; Akkurt, B.H.; et al. Cross-institutional automated multilabel segmentation for acute intracerebral hemorrhage, intraventricular hemorrhage, and perihematomal edema on CT. Radiol. Adv. 2025, 2, umaf012. [Google Scholar] [CrossRef]


| All ICH (n = 349) | Neoplastic ICH (n = 144) | Non-Neoplastic ICH (n = 205) | p-Value | |
|---|---|---|---|---|
| Age (years), median (IQR) | 67 (53; 78) | 66.5 (53; 78) | 67 (53;78) | 0.998 |
| Female, n (%) | 167 (47.85) | 69 (47.91) | 98 (47.80) | 0.983 |
| Δ symptom onset to imaging (days), median (IQR) | 0.46 (0.13; 1.71) | 0.95 (0.2; 5.0) | 0.32 (0.09;1.0) | 0.013 |
| Hypertension, n (%) | 157 (44.99) | 39 (27.08) | 118 (57.56) | <0.001 |
| CAA, n (%) | 49 (14.04) | - | 49 (23.90) | - |
| Oral anticoagulation, n (%) | 10 (2.87) | - | 10 (4.88) | - |
| Vascular malformation, n (%) | 63 (18.05) | - | 63 (30.73) | - |
| Metastasis, n (%) | 102 (29.23) | 102 (70.83) | - | - |
| Tumor, n (%) | 42 (12.03) | 42 (29.17) | - | - |
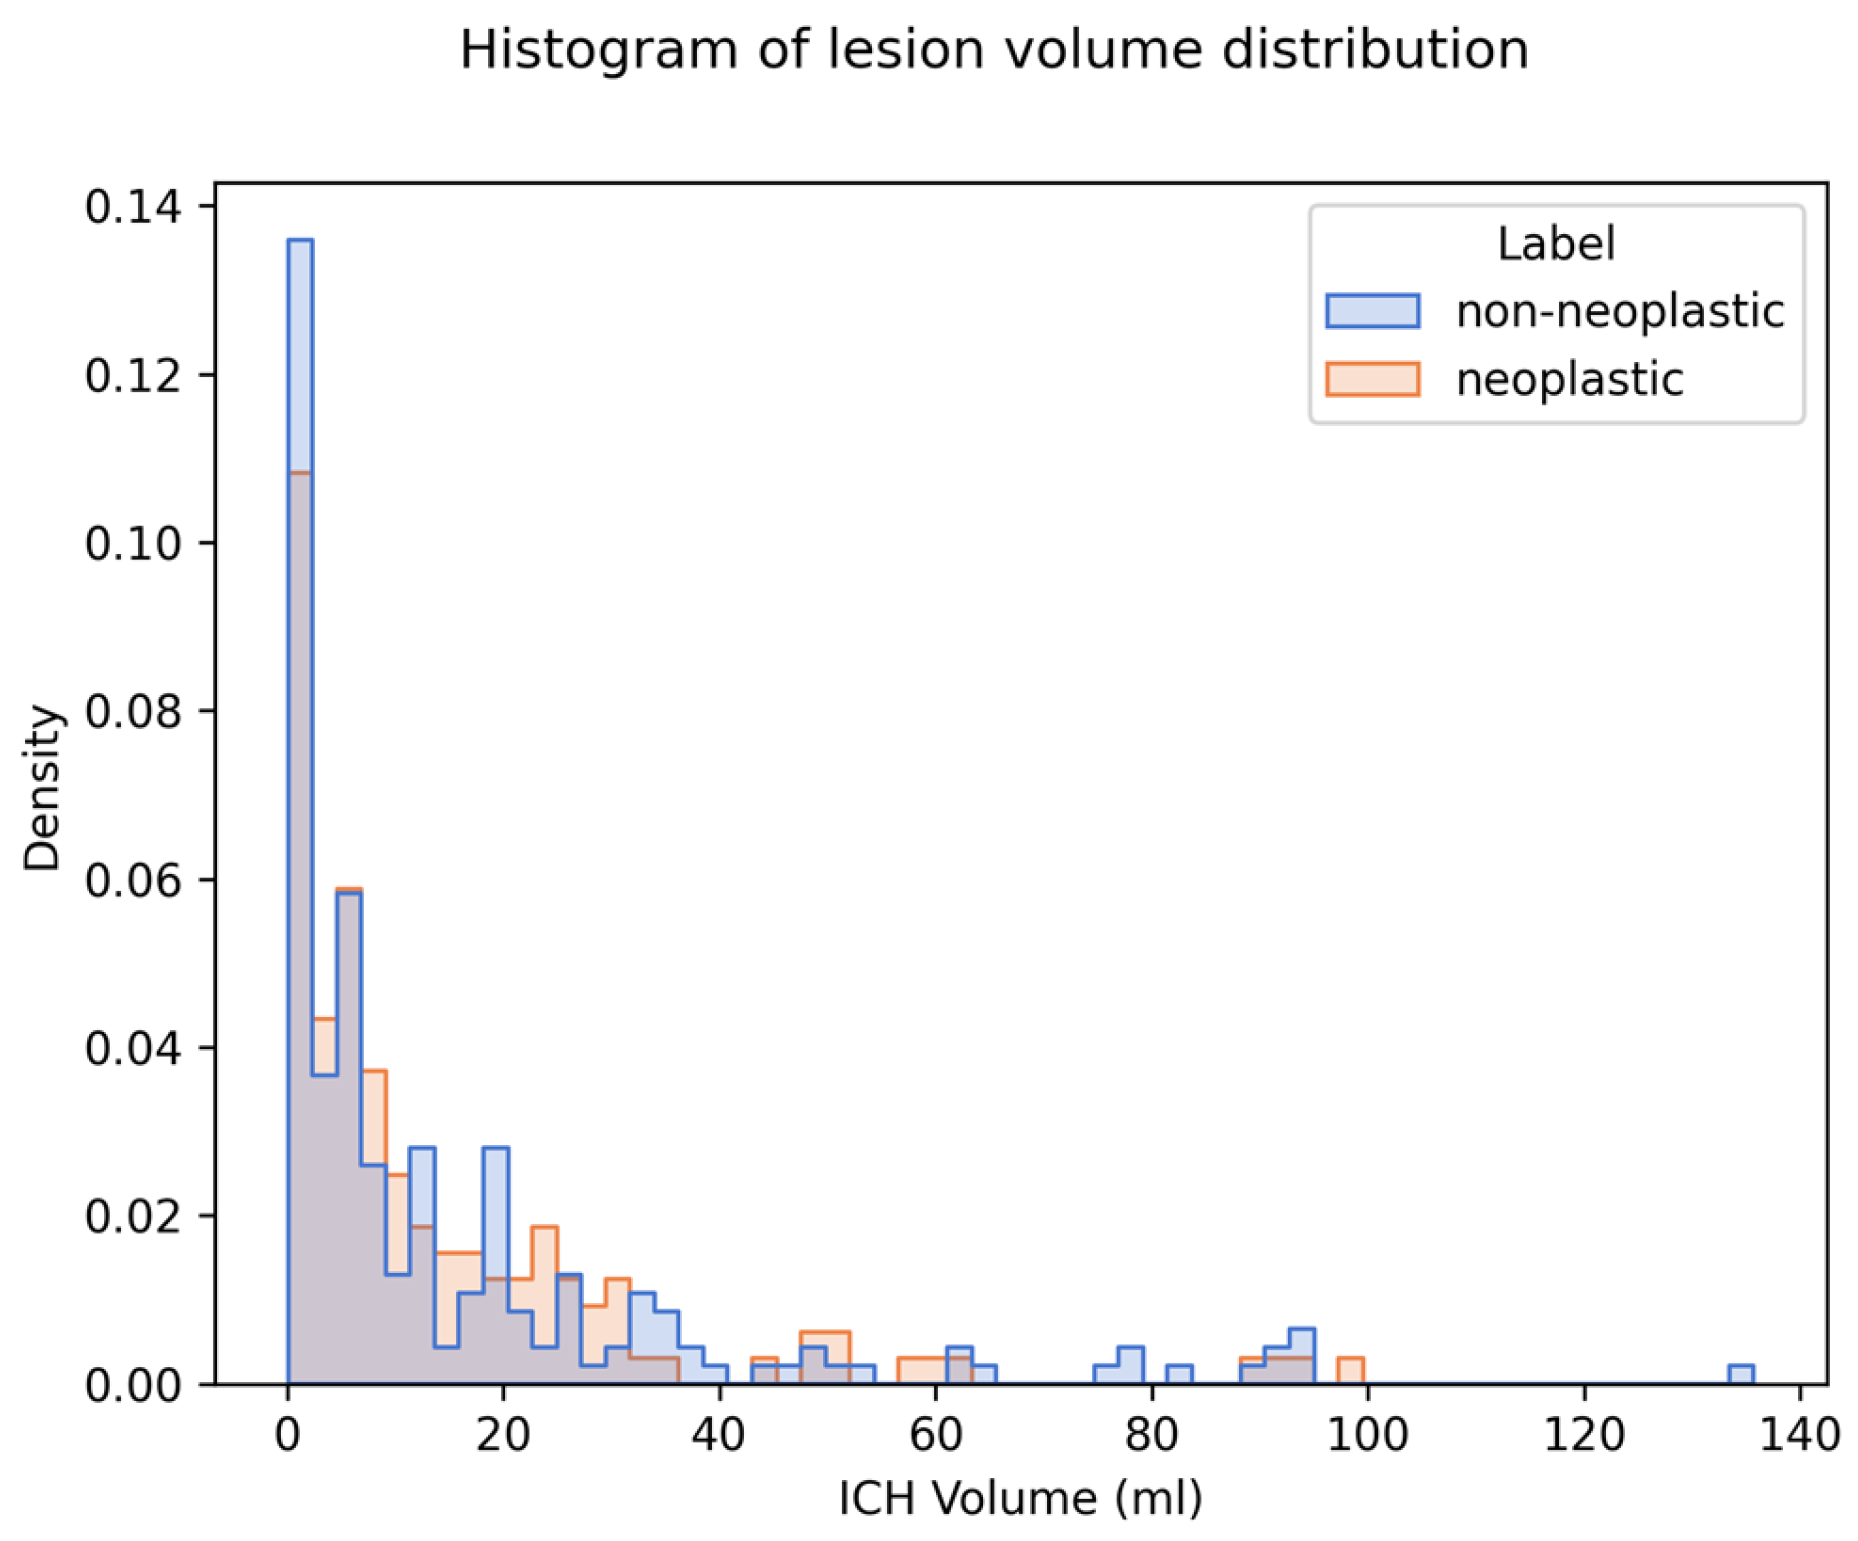
| Median ICH volume, mL (IQR) | 6.92 (2.12; 19.91) | 7.44 (2.50; 20.26) | 6.53 (1.76; 19.56) | 0.477 |
| Median PHE volume, mL (IQR) | 16.45 (7.01; 39.71) | 23.94 (14.24; 64.30) | 10.47 (5.32; 24.37) | <0.001 |
| Mean | Standard Deviation | |
|---|---|---|
| Saliency | 0.473 | 0.047 |
| InputXGradient | −0.256 | 0.181 |
| SmoothGrad | 0.233 | 0.077 |
| Gradient Shap | −0.092 | 0.258 |
| GradCam | 0.116 | 0.197 |
| GradCam++ | 0.49 | 0.153 |
| Guided GradCam | 0.031 | 0.051 |
| Lesion Size | Region | Neoplastic | Non-Neoplastic | p-Value |
|---|---|---|---|---|
| All | ICH | 0.615 | 0.663 | <0.001 |
| All | PHE | 0.430 | 0.439 | 0.54 |
| All | BG | 0.017 | 0.011 | <0.001 |
| Small | ICH | 0.684 | 0.717 | 0.002 |
| Small | PHE | 0.471 | 0.521 | 0.023 |
| Small | BG | 0.013 | 0.008 | <0.001 |
| Large | ICH | 0.561 | 0.600 | 0.008 |
| Large | PHE | 0.396 | 0.341 | 0.001 |
| Large | BG | 0.019 | 0.014 | <0.001 |
Disclaimer/Publisher’s Note: The statements, opinions and data contained in all publications are solely those of the individual author(s) and contributor(s) and not of MDPI and/or the editor(s). MDPI and/or the editor(s) disclaim responsibility for any injury to people or property resulting from any ideas, methods, instructions or products referred to in the content. |
© 2025 by the authors. Licensee MDPI, Basel, Switzerland. This article is an open access article distributed under the terms and conditions of the Creative Commons Attribution (CC BY) license (https://creativecommons.org/licenses/by/4.0/).
Share and Cite
Schulze-Weddige, S.; Baumgärtner, G.L.; Orth, T.; Tietze, A.; Scheel, M.; Wasilewski, D.; Wattjes, M.P.; Hanning, U.; Kniep, H.; Penzkofer, T.; et al. An Explainable AI Exploration of the Machine Learning Classification of Neoplastic Intracerebral Hemorrhage from Non-Contrast CT. Cancers 2025, 17, 2502. https://doi.org/10.3390/cancers17152502
Schulze-Weddige S, Baumgärtner GL, Orth T, Tietze A, Scheel M, Wasilewski D, Wattjes MP, Hanning U, Kniep H, Penzkofer T, et al. An Explainable AI Exploration of the Machine Learning Classification of Neoplastic Intracerebral Hemorrhage from Non-Contrast CT. Cancers. 2025; 17(15):2502. https://doi.org/10.3390/cancers17152502
Chicago/Turabian StyleSchulze-Weddige, Sophia, Georg Lukas Baumgärtner, Tobias Orth, Anna Tietze, Michael Scheel, David Wasilewski, Mike P. Wattjes, Uta Hanning, Helge Kniep, Tobias Penzkofer, and et al. 2025. "An Explainable AI Exploration of the Machine Learning Classification of Neoplastic Intracerebral Hemorrhage from Non-Contrast CT" Cancers 17, no. 15: 2502. https://doi.org/10.3390/cancers17152502
APA StyleSchulze-Weddige, S., Baumgärtner, G. L., Orth, T., Tietze, A., Scheel, M., Wasilewski, D., Wattjes, M. P., Hanning, U., Kniep, H., Penzkofer, T., & Nawabi, J. (2025). An Explainable AI Exploration of the Machine Learning Classification of Neoplastic Intracerebral Hemorrhage from Non-Contrast CT. Cancers, 17(15), 2502. https://doi.org/10.3390/cancers17152502