
Correction of Gradient Nonlinearity Bias in Apparent Diffusion Coefficient Measurement for Head and Neck Cancers Using Single- and Multi-Shot Echo Planar Diffusion Imaging

 ,
, 
Simple Summary
Abstract
1. Introduction
2. Materials and Methods
2.1. ADC Phantom Data Acquisition and Analysis
2.2. HNC Patient
2.3. HNC DW-MRI Data Acquisition
2.4. HNC Regions of Interest Contouring and Data Analysis
2.5. Statistical Analysis
3. Results
3.1. Phantom
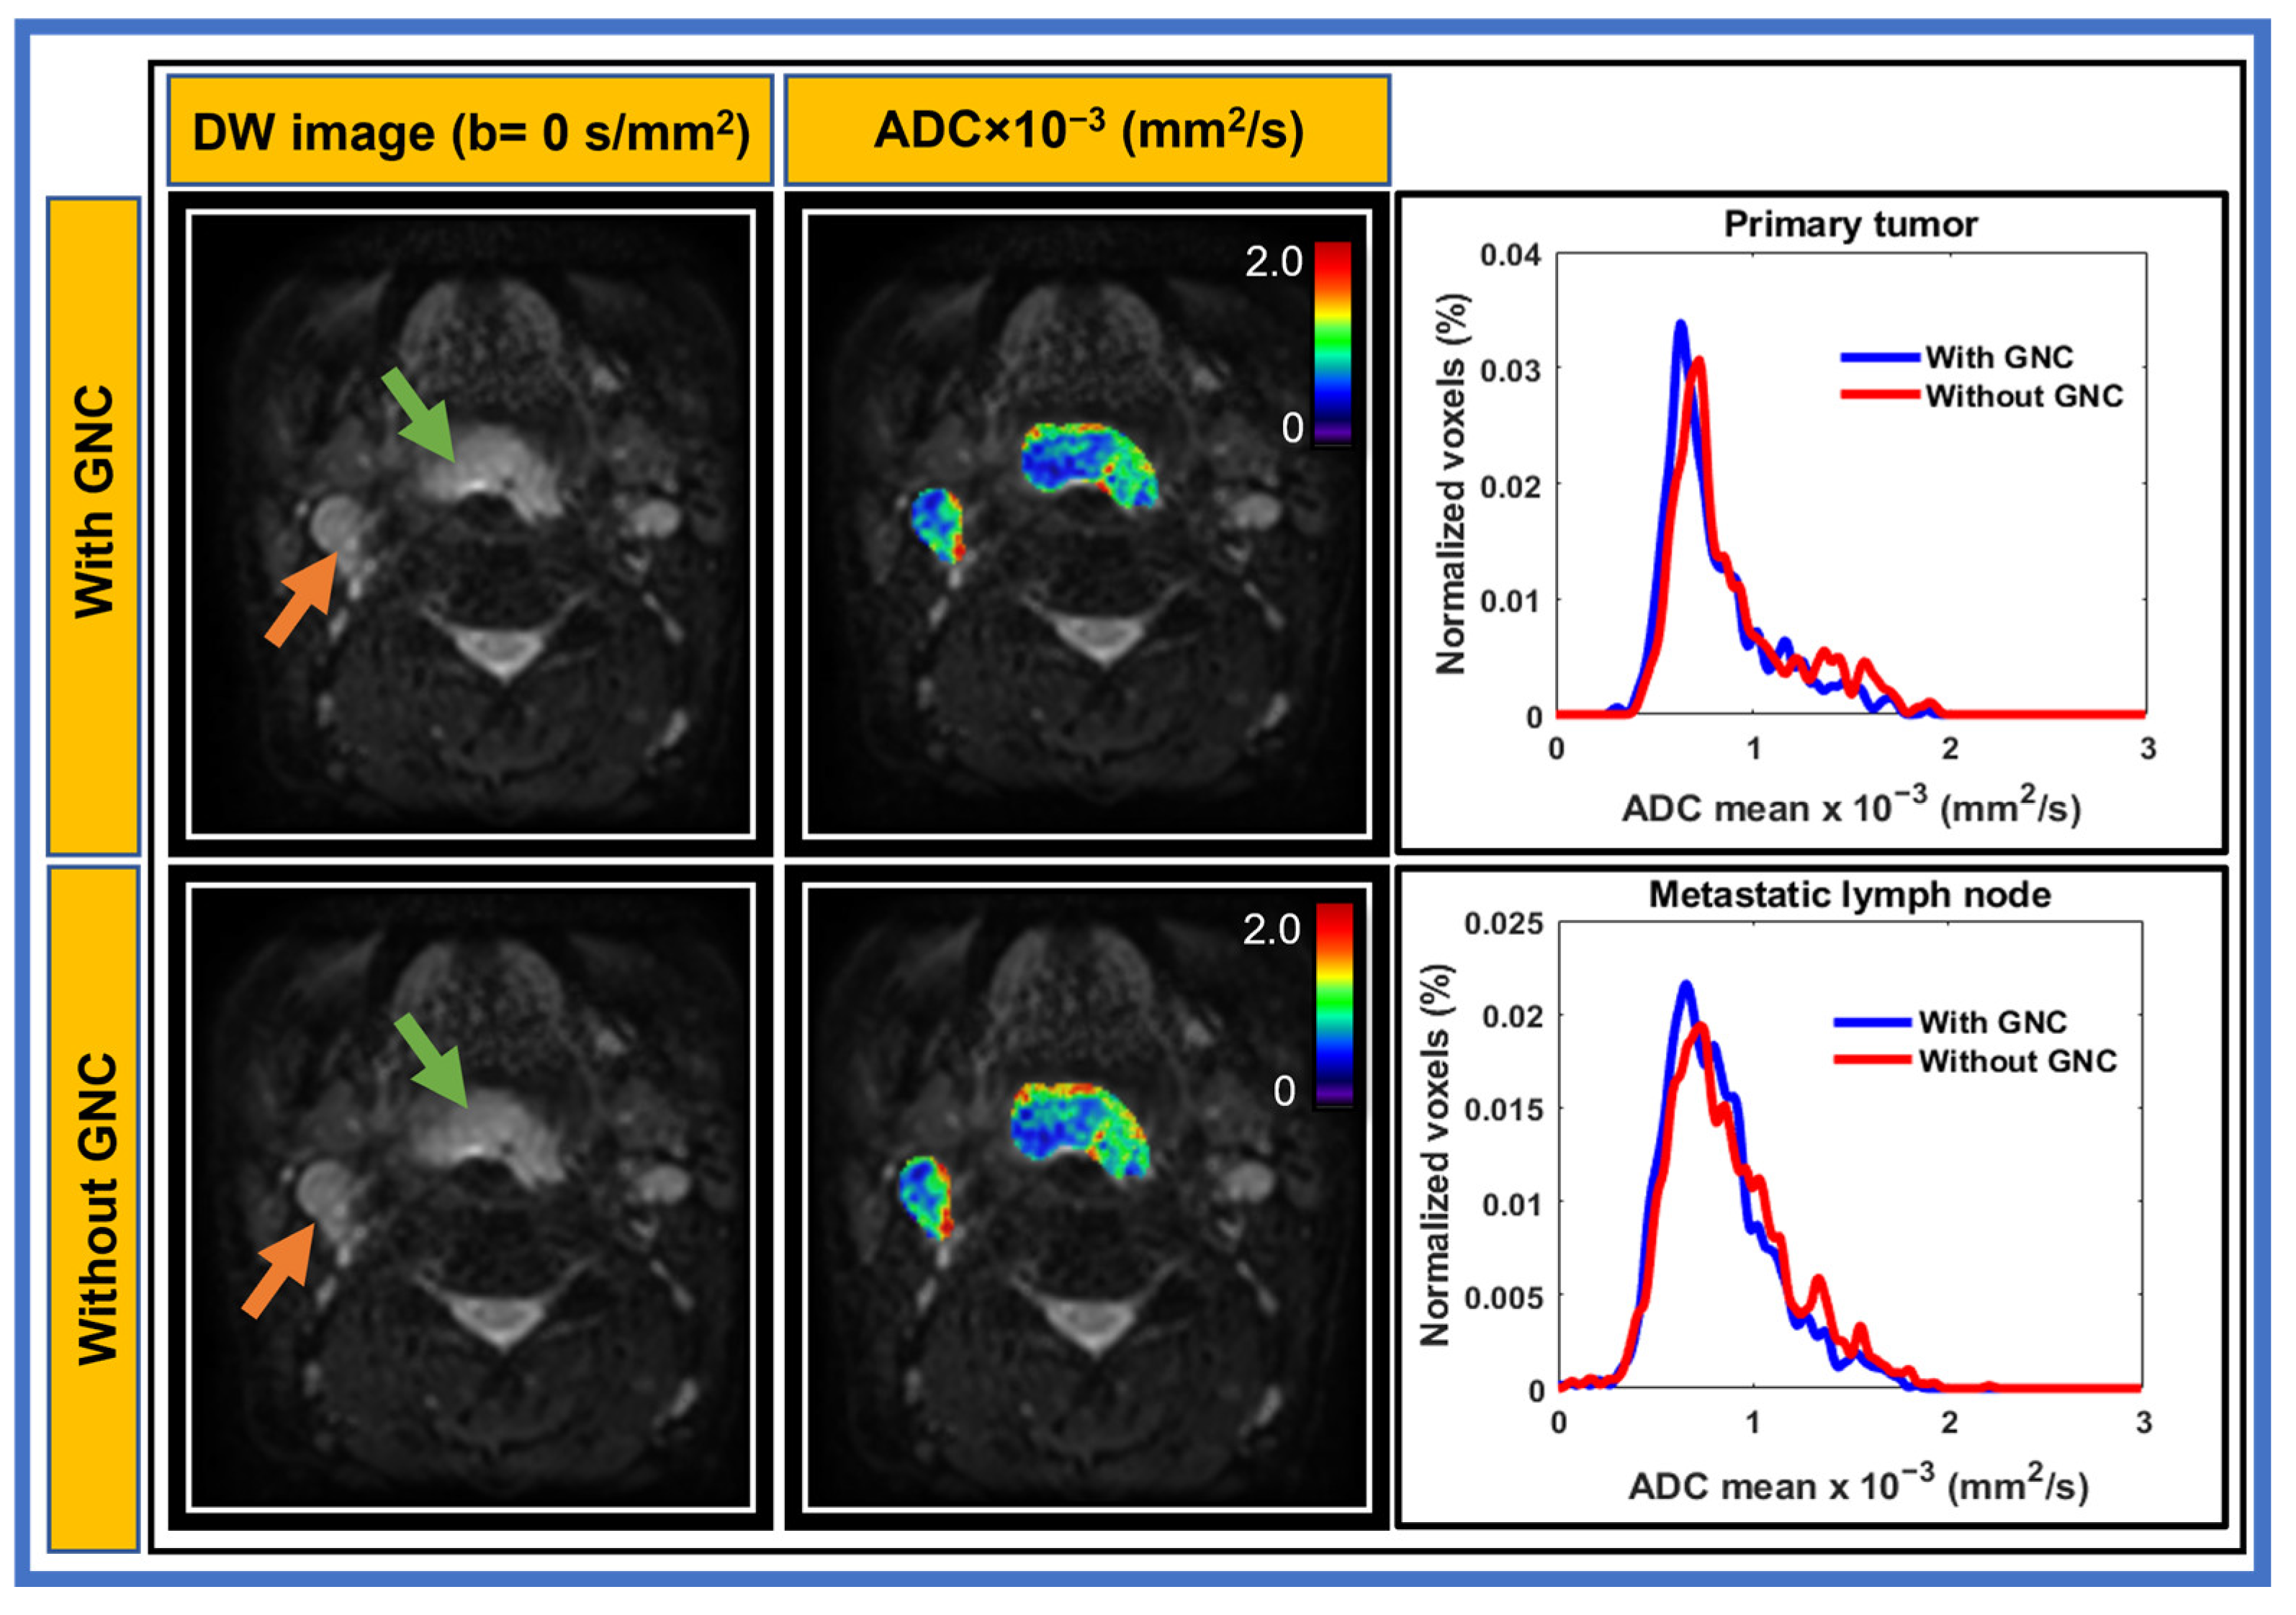
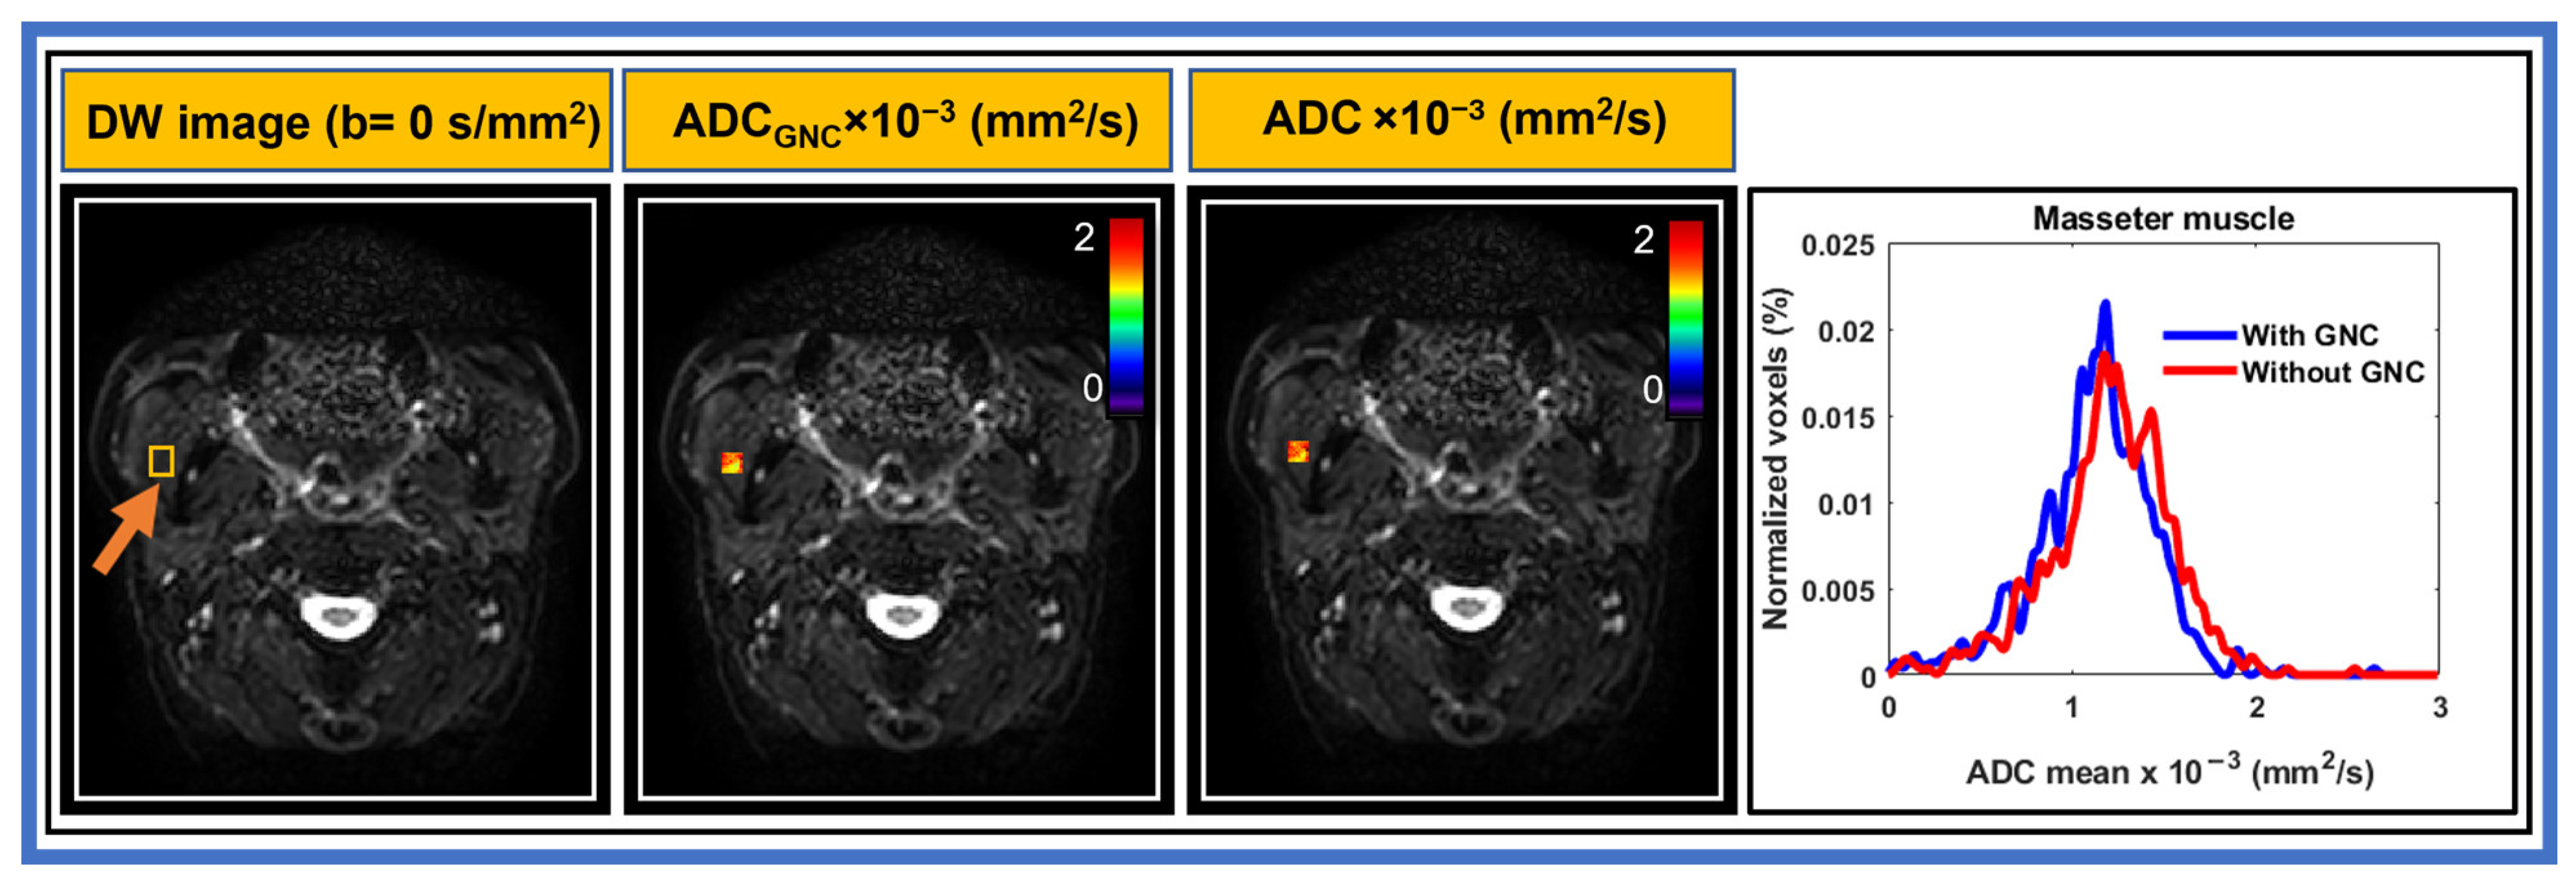
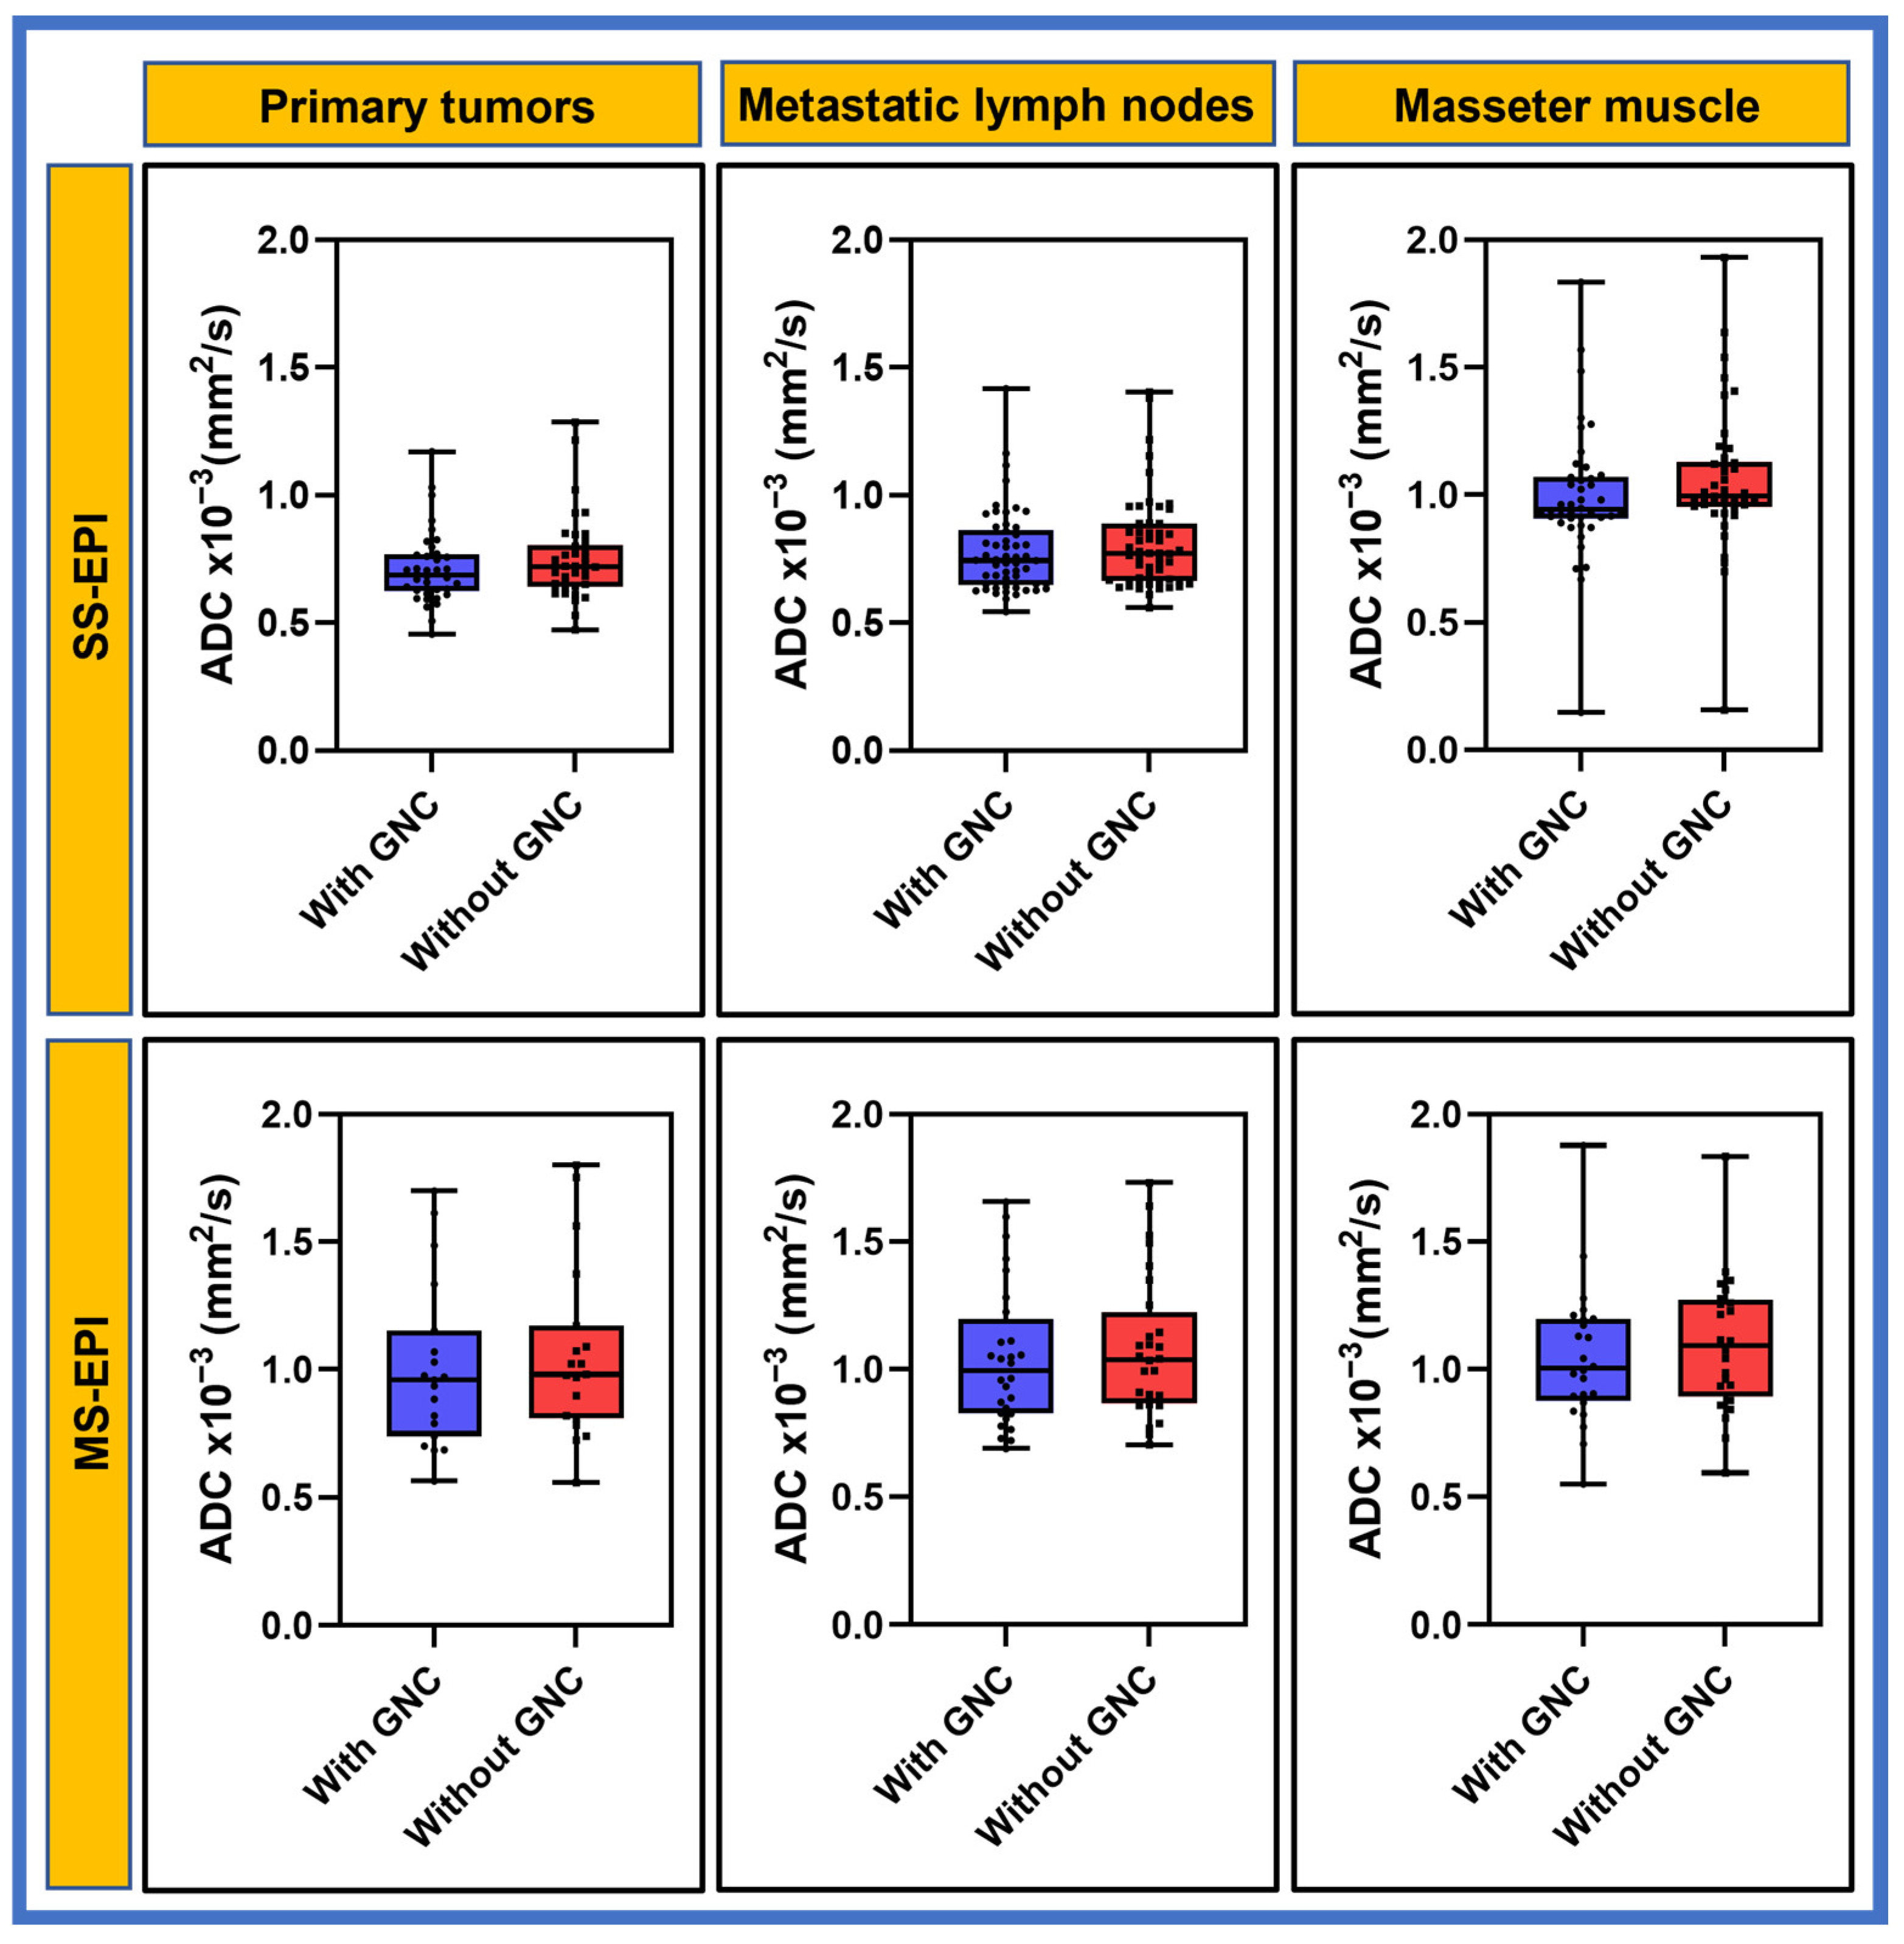
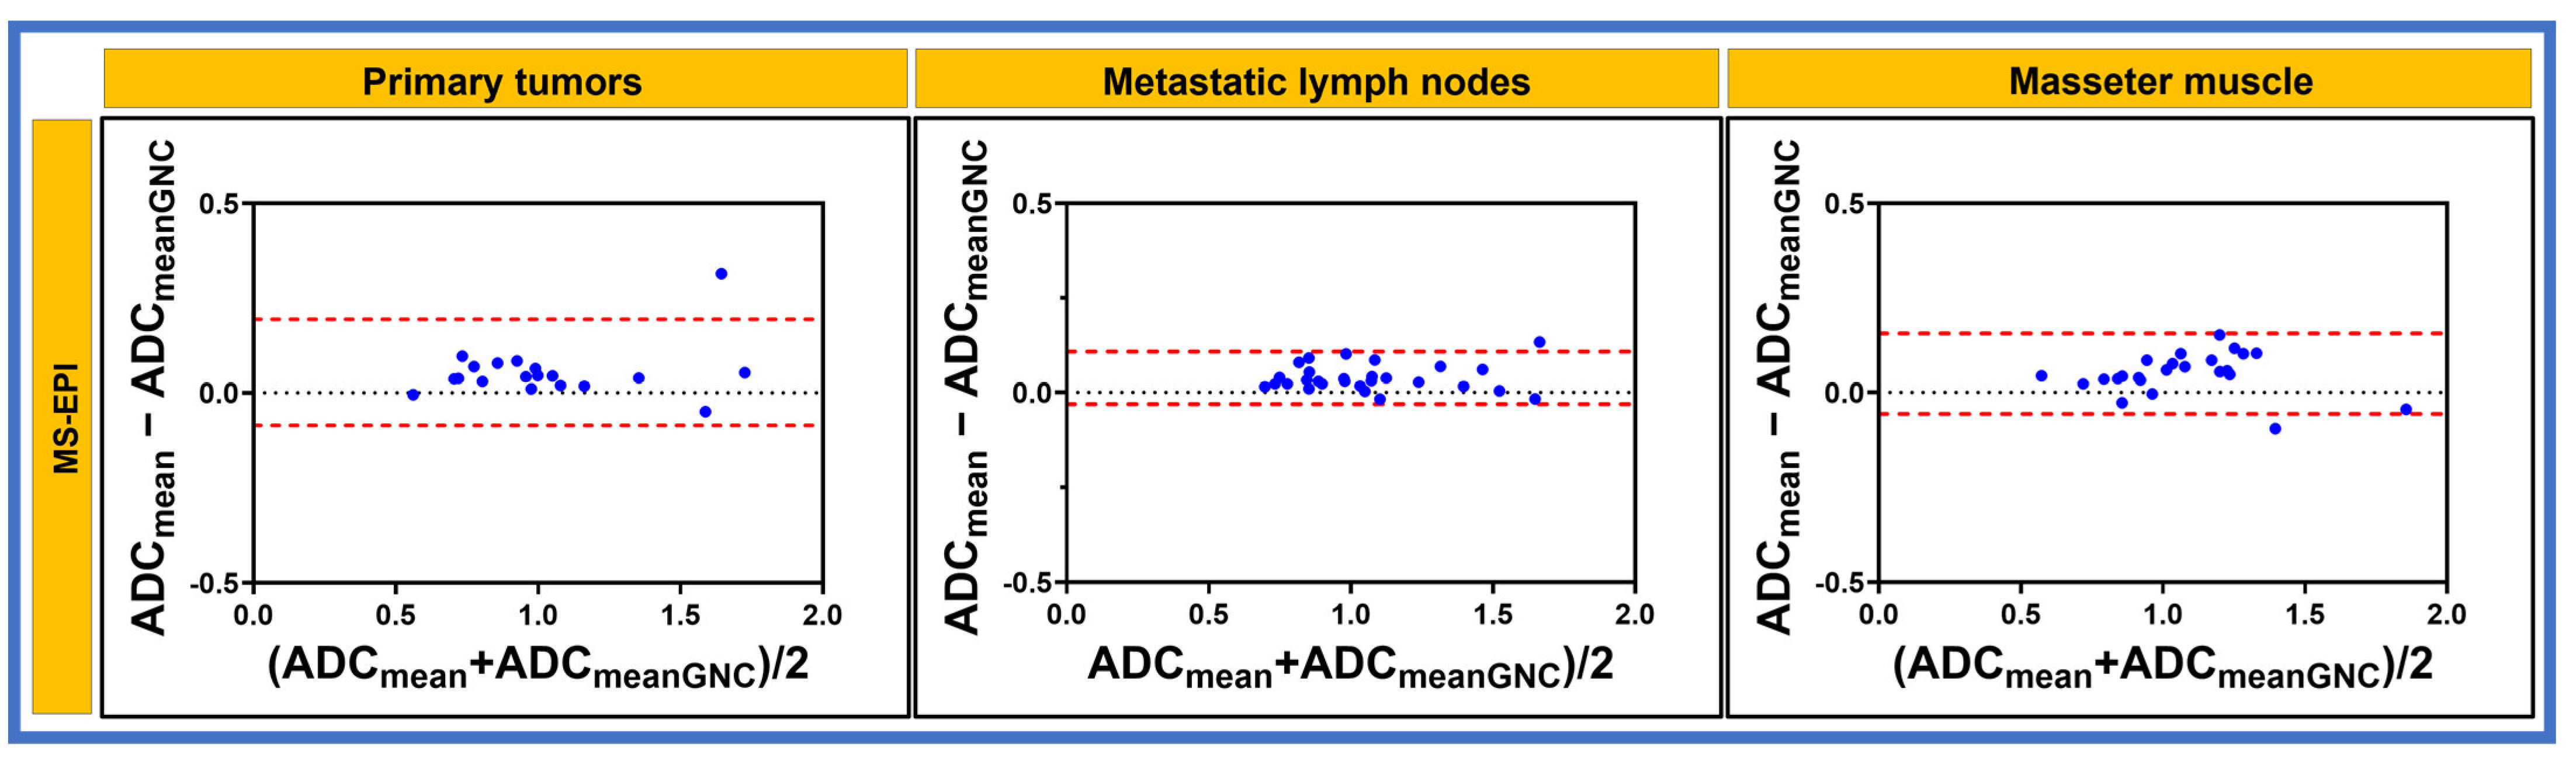
3.2. Patient
4. Discussion
5. Conclusions
Author Contributions
Funding
Institutional Review Board Statement
Informed Consent Statement
Data Availability Statement
Acknowledgments
Conflicts of Interest
References
- Chawla, S.; Kim, S.; Wang, S.; Poptani, H. Diffusion-weighted imaging in head and neck cancers. Future Oncol. 2009, 5, 959–975. [Google Scholar] [CrossRef] [PubMed]
- Vandecaveye, V.; De Keyzer, F.; Vander Poorten, V.; Dirix, P.; Verbeken, E.; Nuyts, S.; Hermans, R. Head and neck squamous cell carcinoma: Value of diffusion-weighted MR imaging for nodal staging. Radiology 2009, 251, 134–146. [Google Scholar] [CrossRef] [PubMed]
- Holzapfel, K.; Duetsch, S.; Fauser, C.; Eiber, M.; Rummeny, E.J.; Gaa, J. Value of diffusion-weighted MR imaging in the differentiation between benign and malignant cervical lymph nodes. Eur. J. Radiol. 2009, 72, 381–387. [Google Scholar] [CrossRef] [PubMed]
- Thoeny, H.C. Diffusion-weighted MRI in head and neck radiology: Applications in oncology. Cancer Imaging 2011, 10, 209–214. [Google Scholar] [CrossRef]
- Dai, Y.; King, A. State of the art MRI in head and neck cancer. Clin. Radiol. 2018, 73, 45–59. [Google Scholar] [CrossRef]
- Le Bihan, D. IVIM method measures diffusion and perfusion. Diagn Imaging 1990, 12, 133–136. [Google Scholar]
- Padhani, A.R.; Liu, G.; Koh, D.M.; Chenevert, T.L.; Thoeny, H.C.; Takahara, T.; Dzik-Jurasz, A.; Ross, B.D.; Van Cauteren, M.; Collins, D.; et al. Diffusion-weighted magnetic resonance imaging as a cancer biomarker: Consensus and recommendations. Neoplasia 2009, 11, 102–125. [Google Scholar] [CrossRef]
- Kato, H.; Kanematsu, M.; Tanaka, O.; Mizuta, K.; Aoki, M.; Shibata, T.; Yamashita, T.; Hirose, Y.; Hoshi, H. Head and neck squamous cell carcinoma: Usefulness of diffusion-weighted MR imaging in the prediction of a neoadjuvant therapeutic effect. Eur. Radiol. 2009, 19, 103–109. [Google Scholar] [CrossRef]
- Millen, R.; De Kort, W.W.B.; Koomen, M.; van Son, G.J.F.; Gobits, R.; Penning de Vries, B.; Begthel, H.; Zandvliet, M.; Doornaert, P.; Raaijmakers, C.P.J.; et al. Patient-derived head and neck cancer organoids allow treatment stratification and serve as a tool for biomarker validation and identification. Med 2023, 4, 290–310.e212. [Google Scholar] [CrossRef]
- Padhani, A.R.; Koh, D.-M. Diffusion MR imaging for monitoring of treatment response. Magn. Reson. Imaging Clin. 2011, 19, 181–209. [Google Scholar] [CrossRef]
- Padhani, A.R.; Patel, S.M. Diffusion-Weighted Imaging. In Clinical MRI of the Abdomen: Why, How, When; Springer: Berlin/Heidelberg, Germany, 2011; pp. 685–706. [Google Scholar]
- Meyer, H.J.; Leifels, L.; Hamerla, G.; Höhn, A.K.; Surov, A. ADC-histogram analysis in head and neck squamous cell carcinoma. Associations with different histopathological features including expression of EGFR, VEGF, HIF-1α, Her 2 and p53. A preliminary study. Magn. Reson. Imaging 2018, 54, 214–217. [Google Scholar] [CrossRef] [PubMed]
- Yuan, J.; Yeung, D.K.; Mok, G.S.; Bhatia, K.S.; Wang, Y.X.; Ahuja, A.T.; King, A.D. Non-Gaussian analysis of diffusion weighted imaging in head and neck at 3T: A pilot study in patients with nasopharyngeal carcinoma. PLoS ONE 2014, 9, e87024. [Google Scholar] [CrossRef] [PubMed]
- Kim, S.; Loevner, L.; Quon, H.; Sherman, E.; Weinstein, G.; Kilger, A.; Poptani, H. Diffusion-weighted magnetic resonance imaging for predicting and detecting early response to chemoradiation therapy of squamous cell carcinomas of the head and neck. Clin. Cancer Res. 2009, 15, 986–994. [Google Scholar] [CrossRef] [PubMed]
- Berrak, S.; Chawla, S.; Kim, S.; Quon, H.; Sherman, E.; Loevner, L.A.; Poptani, H. Diffusion weighted imaging in predicting progression free survival in patients with squamous cell carcinomas of the head and neck treated with induction chemotherapy. Acad. Radiol. 2011, 18, 1225–1232. [Google Scholar] [CrossRef]
- Vandecaveye, V.; Dirix, P.; De Keyzer, F.; Op de Beeck, K.; Vander Poorten, V.; Hauben, E.; Lambrecht, M.; Nuyts, S.; Hermans, R. Diffusion-weighted magnetic resonance imaging early after chemoradiotherapy to monitor treatment response in head-and-neck squamous cell carcinoma. Int. J. Radiat. Oncol. Biol. Phys. 2012, 82, 1098–1107. [Google Scholar] [CrossRef]
- Chawla, S.; Kim, S.G.; Loevner, L.A.; Wang, S.; Mohan, S.; Lin, A.; Poptani, H. Prediction of distant metastases in patients with squamous cell carcinoma of head and neck using DWI and DCE-MRI. Head. Neck 2020, 42, 3295–3306. [Google Scholar] [CrossRef]
- van der Hulst, H.J.; Vos, J.L.; Tissier, R.; Smit, L.A.; Martens, R.M.; Beets-Tan, R.G.H.; van den Brekel, M.W.M.; Zuur, C.L.; Castelijns, J.A. Quantitative Diffusion-Weighted Imaging Analyses to Predict Response to Neoadjuvant Immunotherapy in Patients with Locally Advanced Head and Neck Carcinoma. Cancers 2022, 14, 6235. [Google Scholar] [CrossRef]
- Mohamed, A.S.R.; Abusaif, A.; He, R.; Wahid, K.A.; Salama, V.; Youssef, S.; McDonald, B.A.; Naser, M.; Ding, Y.; Salzillo, T.C.; et al. Prospective validation of diffusion-weighted MRI as a biomarker of tumor response and oncologic outcomes in head and neck cancer: Results from an observational biomarker pre-qualification study. Radiother. Oncol. 2023, 183, 109641. [Google Scholar] [CrossRef]
- Paudyal, R.; Oh, J.H.; Riaz, N.; Venigalla, P.; Li, J.; Hatzoglou, V.; Leeman, J.; Nunez, D.A.; Lu, Y.; Deasy, J.O.; et al. Intravoxel incoherent motion diffusion-weighted MRI during chemoradiation therapy to characterize and monitor treatment response in human papillomavirus head and neck squamous cell carcinoma. J. Magn. Reason. Imaging 2017, 45, 1013–1023. [Google Scholar] [CrossRef]
- Doblas, S.; Almeida, G.S.; Blé, F.X.; Garteiser, P.; Hoff, B.A.; McIntyre, D.J.; Wachsmuth, L.; Chenevert, T.L.; Faber, C.; Griffiths, J.R.; et al. Apparent diffusion coefficient is highly reproducible on preclinical imaging systems: Evidence from a seven-center multivendor study. J. Magn. Reson. Imaging 2015, 42, 1759–1764. [Google Scholar] [CrossRef]
- Keenan, K.E.; Peskin, A.P.; Wilmes, L.J.; Aliu, S.O.; Jones, E.F.; Li, W.; Kornak, J.; Newitt, D.C.; Hylton, N.M. Variability and bias assessment in breast ADC measurement across multiple systems. J. Magn. Reson. Imaging 2016, 44, 846–855. [Google Scholar] [CrossRef] [PubMed]
- Obuchowski, N.A.; Bullen, J. Quantitative imaging biomarkers: Effect of sample size and bias on confidence interval coverage. Stat. Methods Med. Res. 2018, 27, 3139–3150. [Google Scholar] [CrossRef] [PubMed]
- Glover, G.H.; Pelc, N.J. Method for Correcting Image Distortion Due to Gradient Nonuniformity. United. States Patent 4,591,789, 27 May 1986. [Google Scholar]
- Bammer, R.; Markl, M.; Barnett, A.; Acar, B.; Alley, M.; Pelc, N.; Glover, G.; Moseley, M. Analysis and generalized correction of the effect of spatial gradient field distortions in diffusion-weighted imaging. Magn. Reson. Med. 2003, 50, 560–569. [Google Scholar] [CrossRef]
- Janke, A.; Zhao, H.; Cowin, G.J.; Galloway, G.J.; Doddrell, D.M. Use of spherical harmonic deconvolution methods to compensate for nonlinear gradient effects on MRI images. Magn. Reson. Med. 2004, 52, 115–122. [Google Scholar] [CrossRef]
- Malyarenko, D.I.; Ross, B.D.; Chenevert, T.L. Analysis and correction of gradient nonlinearity bias in apparent diffusion coefficient measurements. Magn. Reson. Med. 2014, 71, 1312–1323. [Google Scholar] [CrossRef]
- Tan, E.T.; Marinelli, L.; Slavens, Z.W.; King, K.F.; Hardy, C.J. Improved correction for gradient nonlinearity effects in diffusion-weighted imaging. J. Magn. Reson. Imaging 2013, 38, 448–453. [Google Scholar] [CrossRef]
- Tao, S.; Trzasko, J.D.; Gunter, J.L.; Weavers, P.T.; Shu, Y.; Huston, J.; Lee, S.K.; Tan, E.T.; Bernstein, M.A. Gradient nonlinearity calibration and correction for a compact, asymmetric magnetic resonance imaging gradient system. Phys. Med. Biol. 2017, 62, N18. [Google Scholar] [CrossRef] [PubMed]
- Mesri, H.Y.; David, S.; Viergever, M.A.; Leemans, A. The adverse effect of gradient nonlinearities on diffusion MRI: From voxels to group studies. NeuroImage 2020, 205, 116127. [Google Scholar] [CrossRef]
- Pang, Y.; Malyarenko, D.I.; Amouzandeh, G.; Barberi, E.; Cole, M.; Vom Endt, A.; Peeters, J.; Tan, E.T.; Chenevert, T.L. Empirical validation of gradient field models for an accurate ADC measured on clinical 3T MR systems in body oncologic applications. Phys. Med. 2021, 86, 113–120. [Google Scholar] [CrossRef]
- Malyarenko, D.I.; Newitt, D.C.; Amouzandeh, G.; Wilmes, L.J.; Tan, E.T.; Marinelli, L.; Devaraj, A.; Peeters, J.M.; Giri, S.; Vom Endt, A. Retrospective correction of ADC for gradient nonlinearity errors in multicenter breast DWI trials: ACRIN6698 multiplatform feasibility study. Tomography 2020, 6, 86–92. [Google Scholar] [CrossRef]
- Konar, A.S.; Fung, M.; Paudyal, R.; Oh, J.H.; Mazaheri, Y.; Hatzoglou, V.; Shukla-Dave, A. Diffusion-Weighted Echo Planar Imaging using MUltiplexed Sensitivity Encoding and Reverse Polarity Gradient in Head and Neck Cancer: An Initial Study. Tomography 2020, 6, 231–240. [Google Scholar] [CrossRef]
- Tamada, T.; Kido, A.; Ueda, Y.; Takeuchi, M.; Kanki, A.; Neelavalli, J.; Yamamoto, A. Comparison of single-shot EPI and multi-shot EPI in prostate DWI at 3.0 T. Sci. Rep. 2022, 12, 16070. [Google Scholar] [CrossRef] [PubMed]
- Chen, H.; Dai, K.; Zhong, S.; Zheng, J.; Zhang, X.; Yang, S.; Cao, T.; Wang, C.; Karasan, E.; Frydman, L.; et al. High-resolution multi-shot diffusion-weighted MRI combining markerless prospective motion correction and locally low-rank constrained reconstruction. Magn. Reson. Med. 2023, 89, 605–619. [Google Scholar] [CrossRef] [PubMed]
- Dong, Y.; Riedel, M.; Koolstra, K.; van Osch, M.J.P.; Börnert, P. Water/fat separation for self-navigated diffusion-weighted multishot echo-planar imaging. NMR Biomed. 2023, 36, e4822. [Google Scholar] [CrossRef]
- Amouzandeh, G.; Chenevert, T.L.; Swanson, S.D.; Ross, B.D.; Malyarenko, D.I. Temperature and concentration dependence of water diffusion in polyvinylpyrrolidone solutions. Med. Phys. 2022, 49, 3325–3332. [Google Scholar] [CrossRef]
- LoCastro, E.; Paudyal, R.; Konar, A.S.; LaViolette, P.S.; Akin, O.; Hatzoglou, V.; Goh, A.C.; Bochner, B.H.; Rosenberg, J.; Wong, R.J.; et al. A Quantitative Multiparametric MRI Analysis Platform for Estimation of Robust Imaging Biomarkers in Clinical Oncology. Tomography 2023, 9, 2052–2066. [Google Scholar] [CrossRef] [PubMed]
- Stejskal, E.O.; Tanner, J.E. Spin diffusion measurements: Spin echoes in the presence of a time-dependent field gradient. J. Chem. Phys. 1965, 42, 288–292. [Google Scholar] [CrossRef]
- King, A.D.; Chow, K.K.; Yu, K.H.; Mo, F.K.; Yeung, D.K.; Yuan, J.; Bhatia, K.S.; Vlantis, A.C.; Ahuja, A.T. Head and neck squamous cell carcinoma: Diagnostic performance of diffusion-weighted MR imaging for the prediction of treatment response. Radiology 2013, 266, 531–538. [Google Scholar] [CrossRef]
- Surov, A.; Meyer, H.J.; Wienke, A. Correlation between apparent diffusion coefficient (ADC) and cellularity is different in several tumors: A meta-analysis. Oncotarget 2017, 8, 59492–59499. [Google Scholar] [CrossRef]
- Habrich, J.; Boeke, S.; Fritz, V.; Koerner, E.; Nikolaou, K.; Schick, F.; Gani, C.; Zips, D.; Thorwarth, D. Reproducibility of diffusion-weighted magnetic resonance imaging in head and neck cancer assessed on a 1.5 T MR-Linac and comparison to parallel measurements on a 3 T diagnostic scanner. Radiother. Oncol. 2024, 191, 110046. [Google Scholar] [CrossRef]
- Lemainque, T.; Yoneyama, M.; Morsch, C.; Iordanishvili, E.; Barabasch, A.; Schulze-Hagen, M.; Peeters, J.M.; Kuhl, C.; Zhang, S. Reduction of ADC bias in diffusion MRI with deep learning-based acceleration: A phantom validation study at 3.0 T. Magn. Reson. Imaging 2024, 110, 96–103. [Google Scholar] [CrossRef] [PubMed]
- Widmann, G.; Henninger, B.; Kremser, C.; Jaschke, W. MRI sequences in head & neck radiology–state of the art. In RöFo-Fortschritte auf dem Gebiet der Röntgenstrahlen und der Bildgebenden Verfahren; Georg Thieme Verlag KG: Stuttgart, Gerany, 2017; pp. 413–422. [Google Scholar]
- Liao, C.; Cao, X.; Cho, J.; Zhang, Z.; Setsompop, K.; Bilgic, B. Highly efficient MRI through multi-shot echo planar imaging. In Proceedings of the Wavelets and Sparsity XVIII, San Diego, CA, USA, 13–15 August 2019; pp. 353–365. [Google Scholar]
- Aggarwal, H.K.; Mani, M.P.; Jacob, M. Multi-shot sensitivity-encoded diffusion MRI using model-based deep learning (MODL-MUSSELS). In Proceedings of the 2019 IEEE 16th International Symposium on Biomedical Imaging (ISBI 2019), Venice, Italy, 8–11 April 2019; pp. 1541–1544. [Google Scholar]
- Kim, Y.-Y.; Kim, M.-J.; Gho, S.-M.; Seo, N. Comparison of multiplexed sensitivity encoding and single-shot echo-planar imaging for diffusion-weighted imaging of the liver. Eur. J. Radiol. 2020, 132, 109292. [Google Scholar] [CrossRef] [PubMed]
- Altmann, S.; Mercado, M.A.A.; Brockstedt, L.; Kronfeld, A.; Clifford, B.; Feiweier, T.; Uphaus, T.; Groppa, S.; Brockmann, M.A.; Othman, A.E. Ultrafast brain MRI protocol at 1.5 T using deep learning and multi-shot EPI. Acad. Radiol. 2023, 30, 2988–2998. [Google Scholar] [CrossRef]
- Chen, H.; Tang, R.; Song, X.; Zong, R.; Liu, J.; Jin, C.; Deng, K. Comparison of single shot and multishot diffusion-weighted imaging in 5-T magnetic resonance imaging for brain disease diagnosis. Quant. Imaging Med. Surg. 2024, 14, 7291. [Google Scholar] [CrossRef]
- Chen, N.K.; Guidon, A.; Chang, H.C.; Song, A.W. A robust multi-shot scan strategy for high-resolution diffusion weighted MRI enabled by multiplexed sensitivity-encoding (MUSE). Neuroimage 2013, 72, 41–47. [Google Scholar] [CrossRef]
- Pruessmann, K.P.; Weiger, M.; Scheidegger, M.B.; Boesiger, P. SENSE: Sensitivity encoding for fast MRI. Magn. Reson. Med. 1999, 42, 952–962. [Google Scholar] [CrossRef]
- Aliotta, E.; Paudyal, R.; Dresner, A.; Shukla-Dave, A.; Lee, N.; Cerviño, L.; Otazo, R.; Yu, V.Y. Reduced-distortion diffusion weighted imaging for head and neck radiotherapy. Phys. Imaging Radiat. Oncol. 2024, 32, 100653. [Google Scholar] [CrossRef] [PubMed]
- Skare, S.; Newbould, R.D.; Clayton, D.B.; Albers, G.W.; Nagle, S.; Bammer, R. Clinical multishot DW-EPI through parallel imaging with considerations of susceptibility, motion, and noise. Magn. Reson. Med. 2007, 57, 881–890. [Google Scholar] [CrossRef]
- Soher, B.J.; Dale, B.M.; Merkle, E.M. A Review of MR Physics: 3T versus 1.5T. Magn. Reson. Imaging Clin. N. Am. 2007, 15, 277–290. [Google Scholar] [CrossRef]
- Srinivasan, A.; Dvorak, R.; Perni, K.; Rohrer, S.; Mukherji, S. Differentiation of benign and malignant pathology in the head and neck using 3T apparent diffusion coefficient values: Early experience. Am. J. Neuroradiol. 2008, 29, 40–44. [Google Scholar] [CrossRef]
- Lavdas, I.; Miquel, M.E.; McRobbie, D.W.; Aboagye, E.O. Comparison between diffusion-weighted MRI (DW-MRI) at 1.5 and 3 tesla: A phantom study. J. Magn. Reson. Imaging 2014, 40, 682–690. [Google Scholar] [CrossRef] [PubMed]


| Characteristics | n (%) |
|---|---|
| Age | |
| Median(range) 60 (39–87 years) | |
| Sex | |
| Male | 56 (93.3%) |
| Female | 4 (6.7%) |
| Clinical stage | |
| I | 5 (8.3%) |
| II | 19 (31.7%) |
| III | 16 (26.7%) |
| IV | 20 (33.3%) |
| Primary tumor location | |
| Oropharynx | 58 (96.6%) |
| Larynx | 2 (3.4%) |
| Method | PVP [%] | Isocenter | |ΔADC| × 10−3 mm2/s 1 | |rΔADC| (%) 2 | Off-Center (12 cm) | |ΔADC| × 10−3 mm2/s 1 | |rΔADC| (%) 2 | ||
|---|---|---|---|---|---|---|---|---|---|
| ADC × 10−3 (mm2/s) with GNC | ADC × 10−3 (mm2/s) Without GNC | ADC × 10−3 (mm2/s) with GNC | ADC × 10−3 (mm2/s) Without GNC | ||||||
| SS-EPI | 40 | 0.595 ± 0.024 | 0.598 ± 0.024 | 0.003 ± 0.001 | 0.5 ± 0.1 | 0.622 ± 0.070 | 0.505 ± 0.060 | 0.117 ± 0.010 | 18.8 ± 14.3 |
| 20 | 1.132 ± 0.055 | 1.142 ± 0.056 | 0.010 ± 0.001 | 0.9 ± 1.8 | 1.193 ± 0.105 | 0.992 ± 0.088 | 0.201 ± 0.017 | 16.8 ± 16.2 | |
| MS-EPI | 40 | 0.625 ± 0.062 | 0.628 ± 0.062 | 0.003 ± 0.001 | 0.5 ± 0.1 | 0.616 ± 0.042 | 0.546 ± 0.040 | 0.070 ± 0.002 | 11.4 ± 4.8 |
| 20 | 1.196 ± 0.013 | 1.199 ± 0.014 | 0.003 ± 0.001 | 0.3 ± 7.7 | 1.227 ± 0.038 | 0.986 ± 0.040 | 0.241 ± 0.002 | 19.6 ± 5.3 | |
| Method | Primary Tumor | Metastatic Lymph Nodes | Masseter Muscle | ||||
|---|---|---|---|---|---|---|---|
| SS-EPI | Number of patients (n) | 38 | 55 | 44 | |||
| with GNC | Without GNC | with GNC | Without GNC | with GNC | Without GNC | ||
| (Mean ± SD) × 10−3 (mm2/s) | 0.71 ± 0.14 | 0.75 ± 0.16 *** | 0.84 ± 0.35 | 0.87 ± 0.37 *** | 1.06 ± 0.36 | 1.15 ± 0.41 *** | |
| Skewness | 0.15 ± 0.44 | 0.17 ± 0.45 * | 0.42 ± 0.74 | 0.45 ± 0.74 * | −0.27 ± 0.78 | −0.24 ± 0.81 | |
| Kurtosis | 3.44 ± 1.04 | 3.48 ± 1.02 * | 4.45 ± 1.39 | 4.47 ± 1.45 | 4.12 ± 1.50 | 4.10 ± 1.50 | |
| MS-EPI | Number of patients (n) | 19 | 28 | 24 | |||
| (Mean ± SD) × 10−3 (mm2/s) | 1.00 ± 0.32 | 1.06 ± 0.34 ** | 1.04 ± 0.27 | 1.08 ± 0.28 *** | 1.04 ± 0.27 | 1.09 ± 0.27 *** | |
| Skewness | 0.59 ± 0.55 | 0.61 ± 0.62 | 0.35 ± 0.71 | 0.40 ± 0.66 * | −0.13 ± 0.56 | −0.08± 0.56 * | |
| Kurtosis | 3.94 ± 1.70 | 3.83 ± 1.76 | 3.88 ± 1.03 | 3.83 ± 0.90 | 3.61 ± 1.64 | 3.72 ± 1.58 | |
| Method | Region | Bias (Mean ± SD) × 10−3 (mm2/s) | Bias (95% CI) |
|---|---|---|---|
| SS-EPI | Primary tumors | 0.034 ± 0.070 | [0.17, −0.10] |
| Metastatic lymph nodes | 0.032 ± 0.062 | [0.15, −0.09] | |
| Masseter muscle | 0.058 ± 0.036 | [0.13, −0.01] | |
| MS-EPI | Primary tumors | 0.054 ± 0.071 | [0.19, −0.09] |
| Metastatic lymph nodes | 0.039 ± 0.035 | [0.11, −0.03] | |
| Masseter muscle | 0.050 ± 0.054 | [0.16, −0.06] |
Disclaimer/Publisher’s Note: The statements, opinions and data contained in all publications are solely those of the individual author(s) and contributor(s) and not of MDPI and/or the editor(s). MDPI and/or the editor(s) disclaim responsibility for any injury to people or property resulting from any ideas, methods, instructions or products referred to in the content. |
© 2025 by the authors. Licensee MDPI, Basel, Switzerland. This article is an open access article distributed under the terms and conditions of the Creative Commons Attribution (CC BY) license (https://creativecommons.org/licenses/by/4.0/).
Share and Cite
Paudyal, R.; Lema-Dopico, A.; Shah, A.D.; Hatzoglou, V.; Awais, M.; Aliotta, E.; Yu, V.; Chenevert, T.L.; Malyarenko, D.I.; Schwartz, L.H.; et al. Correction of Gradient Nonlinearity Bias in Apparent Diffusion Coefficient Measurement for Head and Neck Cancers Using Single- and Multi-Shot Echo Planar Diffusion Imaging. Cancers 2025, 17, 1796. https://doi.org/10.3390/cancers17111796
Paudyal R, Lema-Dopico A, Shah AD, Hatzoglou V, Awais M, Aliotta E, Yu V, Chenevert TL, Malyarenko DI, Schwartz LH, et al. Correction of Gradient Nonlinearity Bias in Apparent Diffusion Coefficient Measurement for Head and Neck Cancers Using Single- and Multi-Shot Echo Planar Diffusion Imaging. Cancers. 2025; 17(11):1796. https://doi.org/10.3390/cancers17111796
Chicago/Turabian StylePaudyal, Ramesh, Alfonso Lema-Dopico, Akash Deelip Shah, Vaios Hatzoglou, Muhammad Awais, Eric Aliotta, Victoria Yu, Thomas L. Chenevert, Dariya I. Malyarenko, Lawrence H. Schwartz, and et al. 2025. "Correction of Gradient Nonlinearity Bias in Apparent Diffusion Coefficient Measurement for Head and Neck Cancers Using Single- and Multi-Shot Echo Planar Diffusion Imaging" Cancers 17, no. 11: 1796. https://doi.org/10.3390/cancers17111796
APA StylePaudyal, R., Lema-Dopico, A., Shah, A. D., Hatzoglou, V., Awais, M., Aliotta, E., Yu, V., Chenevert, T. L., Malyarenko, D. I., Schwartz, L. H., Lee, N., & Shukla-Dave, A. (2025). Correction of Gradient Nonlinearity Bias in Apparent Diffusion Coefficient Measurement for Head and Neck Cancers Using Single- and Multi-Shot Echo Planar Diffusion Imaging. Cancers, 17(11), 1796. https://doi.org/10.3390/cancers17111796