Article

Establishment of Two Novel Ovarian Tumor Cell Lines with Characteristics of Mucinous Borderline Tumors or Dedifferentiated Carcinoma—Implications for Tumor Heterogeneity and the Complex Carcinogenesis of Mucinous Tumors

1
Department of Obstetrics and Gynecology, Faculty of Medicine, Shimane University, Izumo 693-8501, Japan
2
Exploratory Oncology Research and Clinical Trial Center (EPOC), National Cancer Center, Kashiwa 277-8577, Japan
3
Department of Legal Medicine, Faculty of Medicine, Shimane University, Izumo 693-8501, Japan
4
Department of Obstetrics and Gynecology, East Medical Center, Nagoya City University, Nagoya 464-8547, Japan
*
Authors to whom correspondence should be addressed.
Cancers 2025, 17(10), 1716; https://doi.org/10.3390/cancers17101716
Submission received: 2 April 2025 / Revised: 16 May 2025 / Accepted: 19 May 2025 / Published: 20 May 2025
(This article belongs to the Special Issue Gynecologic Cancer: From Diagnosis to Treatment)

Simple Summary

Mucinous borderline tumors of the ovary (MBOTs) are characterized by intermediate malignant potential; however, they are known to occasionally recur. The molecular mechanisms driving their carcinogenesis and tumor biology remain poorly understood, and experimental models for this tumor type are scarce. In the study presented herein, we established two independent cell lines from the tissues of a patient with an MBOT. In a patient-derived xenograft model, HMucBOT-1 retained MBOT morphology, whereas HMucBOT-2 exhibited features of mucinous carcinoma with undifferentiated components, with unique genetic alterations, including KRAS amplification. These cell lines can be used as a preclinical model of MBOTs and serve as a valuable tool for studying tumor heterogeneity and genetic diversity that may induce treatment failure or relapse.

Abstract

Background/objective: Mucinous borderline tumors of the ovary (MBOTs) are characterized by their unique histological features and intermediate malignant potential; however, the factors underlying their molecular carcinogenesis and tumor biology remain largely unknown. Developing cell lines from these tumors presents an ongoing challenge. The purpose of this study is to establish MBOT cell lines and characterize their biological features. Methods: Epithelial cells were collected and purified from surgically removed MBOT samples and then stably maintained with an extended life span by overexpressing CyclinD1/CDK4 in combination with human telomerase reverse transcriptase. The characterization of resulting cell lines was defined by morphology, growth kinetics, functional analysis, whole-exome sequencing, and tumorigenicity in mice. Results: Two independent cell lines, HMucBOT-1 and HMucBOT-2, were successfully established from the tissues of a patient with an MBOT, with the latter showing more aggressive growth capacity. In the patient-derived xenograft model, HMucBOT-1 cells retained the original morphological characteristics of the MBOT, whereas HMucBOT-2 cells displayed a transition to mucinous carcinoma accompanying undifferentiated carcinoma, suggestive of dedifferentiated carcinoma. Genetic analysis of the original tumor sample and HMucBOT-2 cells revealed shared oncogenic mutations. However, KRAS amplification and certain copy number alterations were uniquely observed in the HMucBOT-2 cells. Conclusions: The above results indicate that HMucBOT-1 can serve as a preclinical model for investigating the biological behavior of and potential targeted therapies for human MBOTs, with HMucBOT-2 serving as a valuable tool for studying the heterogeneity and genetic diversity of this tumor and explaining the potential causes of treatment failure or relapse.

1. Introduction

Cancer continues to represent a significant global health burden, accounting for millions of deaths each year. In 2022, an estimated 20 million new cancer cases and 9.7 million cancer-related deaths were reported worldwide [1]. In the United States, approximately 2.04 million new cancer cases and 618,000 deaths are projected for 2025 [2]. Among these, ovarian cancer remains one of the most lethal gynecologic malignancies, responsible for an estimated 206,839 deaths globally and 12,730 deaths annually in the United States [1,2]. Borderline ovarian tumors (BOTs), sometimes called tumors of low malignant potential, constitute a significant portion of ovarian cancer, accounting for 10–15% of all epithelial ovarian malignancies and a 5-year survival rate of 98% [3,4]. BOTs are fundamentally characterized by intermediate clinical aggressiveness with pathological features of moderate cellular proliferation and slight nuclear atypia but lacking destructive stromal invasion [5,6,7]. BOTs are classified into six subtypes based on the type of epithelial cells present as follows: serous (50%), mucinous (45%), and the less common endometrioid, clear cell, seromucinous, and borderline Brenner tumor [6,8]. Mucinous borderline tumors (MBOTs) and serous borderline tumors (SBOTs) account for over 90% of all BOTs [9], with MBOTs being the second most common type of BOT worldwide [10]. In Japan, MBOTs are the most common type of ovarian tumor, accounting for 57.7% of all cases, followed by SBOTs at 20.4% [11]. MBOTs, also known as atypical proliferative mucinous tumors, feature mucin-producing cells with borderline malignant potential [12,13,14]. The five-year survival rate for MBOTs without intraepithelial carcinoma or micro-invasion is approximately 95–98%, with a 1% mortality and a 4.2–7% recurrence risk, some of which may progress to MOCs [15,16,17,18,19,20]. MBOT is characterized by specific gene mutations of ARID1A, ARID1B, KRAS, CDKN2A, PIK3CA, TP53, PTEN, GNA11, or ERBB2, and almost the same mutations are also seen in MOC [21,22].
The most representative mutations in mucinous tumors are KRAS mutations and ERBB2 amplification/overexpression, which activate the MAPK signaling pathway, thereby promoting cell proliferation and tumor progression [23,24]. Wakazono et al. demonstrated that whole-genome doubling and extensive copy number alterations, including amplification of the KRAS mutant allele, were specifically observed in MOC recurrences arising from MBOTs [20]. In particular, while KRAS mutations are not observed in healthy ovaries, they are detected in 57% of benign mucinous ovarian tumors, 90% of MBOTs, and 76% of MOCs [25]. These findings suggest that KRAS mutations and copy number alterations may play a crucial role in the development of mucinous carcinoma.
Recent advances in cancer therapy have shifted from conventional approaches to more precise, personalized treatments driven by molecular profiling and targeted strategies [26]. However, the lack of robust preclinical models for rare tumors like MBOTs remains a barrier to understanding their pathogenesis and designing effective treatment strategies.
In the current study, we present two newly established novel cell lines derived from the tissues of a patient with an MBOT that are expected to aid in understanding the molecular carcinogenesis and heterogeneity of this rare tumor type, with the potential to lead to the identification of novel therapeutic targets.

2. Methods and Materials

2.1. Cell Preparation and Establishment of the Cell Lines

This study was approved by the Ethics Review Board of Shimane Medical University (IRB No. 20070305-1 and 20070305-2). The cell lines were established using a surgically removed ovarian tumor sample from a 62-year-old patient. The operation was performed at Shimane University Hospital, and the patient provided written informed consent for the use of her clinical and pathological specimens in this study.
Tissue samples were collected and submitted to primary culture based on previously established protocols [27,28]. In detail, tissues were collected from two different sites of the ovarian tumor’s papillary structure and then ground separately using sterile scissors, followed by gentle washing with sterile phosphate-buffered saline (PBS) to remove blood contaminants. Thereafter, the tissue fragments were enzymatically digested with collagenase type III (Washington Biochemical Corp., Lakewood, NJ, USA) supplemented with a ROCK inhibitor (Selleck Chemicals, Houston, TX, USA) and subsequently washed to remove residual debris. The digested tissues were then resuspended in 5% Dulbecco’s modified Eagle’s medium (DMEM) (WAKO, Osaka, Japan) and incubated with gentle agitation at 25 °C for 48 h to promote epithelial cell detachment. Lastly, purified epithelial cells were subjected to two independent primary cultures derived from different sites of the ovarian tumor.
To extend the life span of primary cultured cells, human telomerase reverse transcriptase (hTERT), Cyclin D1, and CDK4 (CDK4R24C: an inhibitor-resistant variant of CDK4) were overexpressed through lentivirus-mediated gene transfer through the utilization of the previously published gateway method [29,30]. The resultant cells were designated as HMucBOT-1 and HMucBOT-2, cultured in a mixture of DMEM and F12 (Thermo Fisher Scientific Inc., Waltham, MA, USA) at a ratio of 1:3 (WAKO, Osaka, Japan), supplemented with 5% fetal bovine serum (FBS; Gibco, Carlsbad, CA, USA), 1% penicillin–streptomycin (Pen-Strep; Sigma-Aldrich, St. Louis, MO, USA), Adenine HCL (WAKO, Osaka, Japan), Insulin (Sigma-Aldrich, St. Louis, MO, USA), Y-27632.2HCL (Selleck Chemicals, Houston, TX, USA), 17β-estradiol (Sigma-Aldrich, St. Louis, MO, USA), Hydrocortisone (Sigma-Aldrich, St. Louis, MO, USA), hEGF (PEPROTECH, Rocky Hill, NJ, USA), DMH1 (R&D Systems, Minneapolis, MN, USA), A-83-01 (R&D Systems, Minneapolis, MN, USA), and Cholera toxin (WAKO, Osaka, Japan), and maintained in an incubator with 5% CO2 at 37 °C [28].

2.2. Short Tandem Repeat (STR) Analysis

Genomic DNA was extracted from the original tumor tissue and its derived cultured cells (HMucBOT-1 and HMucBOT-2) using the DNeasy Blood and Tissue Kit (Qiagen, Hilden, Germany). DNA concentrations were measured using a NanoDrop 8000 spectrophotometer (Thermo Fisher Scientific, Waltham, MA, USA), and the samples were stored at −20 °C until further use. The samples were then submitted for STR profiling analysis (BEX Co., Ltd., Tokyo, Japan) targeting 16 loci (Supplementary Table S1) [31]. The data generated were interpreted using either GeneMapper 6.0 (Applied Biosystems, Thermo Fisher Scientific, Waltham, MA, USA) or PeakScanner software v1.0 (Applied Biosystems, Thermo Fisher, Waltham, MA, USA). The obtained STR profiles were compared with reference profiles from the ACC, DSMZ, and JRCB databases to assess matching.

2.3. Mouse Tumorigenicity

Female C.B-17/Icr-scid/scidJc1 (CLEA Japan, Inc., Shizuoka, Japan) SCID mice (mice were acclimatized for 4 weeks before experiments) aged 5–7 weeks were injected intraperitoneally and subcutaneously on the right dorsum with different amounts of the two cell lines (2 × 10⁴ or 2 × 10⁶ cells). Tumor growth was monitored through regular inspection and palpation twice a week. The tumors were then fixed in 4% buffered formaldehyde, and sections were stained with hematoxylin and eosin for further analysis.

2.4. Whole-Exome Sequencing

Whole-exome sequencing analysis was performed between the original tumor samples and the HMucBOT-2 cell line to compare the genetic alterations between them; the techniques utilized for genome sequencing are discussed in a previous publication [20]. The Agilent 2000 Tape Station (Agilent Technologies, Santa Clara, CA, USA) was first used to assess DNA integrity. Subsequently, Illumina MiSeq (San Diego, CA, USA) whole-exome sequencing using enriched amplicons was performed. The sequencing data were analyzed using the Genome Jack bioinformatics pipeline (Mitsubishi Space Software Co., Ltd., Tokyo, Japan). High analytical sensitivity and specificity were ensured throughout the investigation through the use of sequence alignment, variant calling, variant filtering, variant annotation, and variant prioritization.

2.5. Immunohistochemistry Assay

Immunohistochemical analysis was carried out on the paraffin-embedded tissues of mouse xenograft tumors. Briefly, 5 µm thick sections of paraffin-embedded tissues were serially cut. Selected sections were used for immunohistochemical (IHC) analysis or stained with hematoxylin and eosin for histological analysis. For the immunohistochemical analysis, the sections were deparaffinized and incubated with antibodies of CK7, Pax8, MUC1, AE1/AE2, CAM5.2, Desmin, EMA, S-100, Twist, Snail, Vimentin, and DMMR proteins overnight at 4 °C (Supplementary Table S2). Tris and EDTA buffer (pH 9, Ref-S3467, Dako, Carpinteria, CA, USA) was used for antigen retrieval. Using a light microscope, the samples were evaluated by pathologists at the department of pathology in our hospital, who were blinded to the clinicopathological variables.

2.6. Cell Proliferation Assay

The HMucBOT-1 and HMucBOT-2 cells were plated in U-bottomed 96-well plates at a density of 4000 cells per well. Cell count was measured indirectly using a methyl thiazolyl tetrazolium (MTT) assay [28,32]. The results are expressed as the mean ± standard deviation (SD) from independent triplicate experiments.

2.7. Soft Agar Colony Formation Assay

A total of 10,000 HMucBOT-1 and HMucBOT-2 cells were plated into 24-well plates with a top layer of 0.33% noble agar in 2X DMEM with 5% FBS and a bottom layer of 0.5% base agar in 2X DMEM with 5% FBS. Once the gel had solidified, each well was covered with 1 mL of culture medium and incubated at 37 °C. After 2 weeks, colonies larger than 0.05 mm in diameter were counted.

2.8. Invasion Assay

A cell invasion assay was conducted on the HMucBOT-1 and HMucBOT-2 cell lines using a Boyden chamber equipped with filter inserts (pore size: 8 µm), which were coated with Matrigel (40 µg; Collaborative Biomedical, Becton Dickinson Labware, Bedford, MA, USA) and placed in 24-well plates (Nucleopore, Pleasanton, CA, USA). In the assay, 2500 cells were seeded in the upper chamber, and the same medium was added to the lower chamber. After incubation for 24 h, the cells were fixed with methanol and stained with 0.05% crystal violet in phosphate-buffered saline (PBS) for 1 h at room temperature. Cells on the upper side of the filters were removed using cotton-tipped swabs, and the filters were rinsed with PBS. The invasive cells on the lower side of the filters were counted in four different fields at 200× magnification.

2.9. Migration Assay

The cell migration assay was conducted using wound-healing assays. HMucBOT-1 and HMucBOT-2 cells were plated in 6-well plates and allowed to adhere overnight. A sterile 200 μL pipette tip was used to create a scratch in the cell monolayer, generating a wound. The cells were then incubated for 24 h. Cells that moved into the wound area were considered migrating cells and were observed using an inverted Olympus phase-contrast microscope (Olympus Taiwan, Taipei, Taiwan). The healing rate was assessed by counting the number of migrating cells in four different areas for each assay.

2.10. Responses to Chemotherapeutic Agents

HMucBOT-1 and HMucBOT-2 cells (2 × 10³ per well) were seeded in triplicate into flat-bottomed, 96-well microtiter plates and incubated for 24, 48, and 72 h with culture media. The cells were then treated with paclitaxel at concentrations of 5, 10, 30, or 20 nmol/L or cisplatin at concentrations of 5, 15, 45, or 135 µmol/L. Cells treated with dimethyl sulfoxide (DMSO) at the corresponding concentrations served as negative controls. Next, 30 µL of 3-(4,5-dimethylthiazol-2-yl)-2,5-diphenyltetrazolium bromide solution (5 mg/mL) was added, and the mixture was incubated for 4 h. Thereafter, 100 µL of DMSO was added to dissolve the formazan crystals, and the mixture was shaken vigorously for 15 min. The optical density at 490 nm was measured using an enzyme-linked immunosorbent assay reader. Lastly, the IC50 value was calculated and evaluated using GraphPad Prism software (Version 7.04, GraphPad Software, LLC, San Diego, CA, USA).

2.11. Statistical Analysis

Data were analyzed using SPSS version 27 (SPSS Inc., Chicago, IL, USA). For continuous variables, Student’s t-test was applied, and Fisher’s exact test was used for categorical variables. Results from the three separate experiments are reported as the mean ± standard error.

3. Results

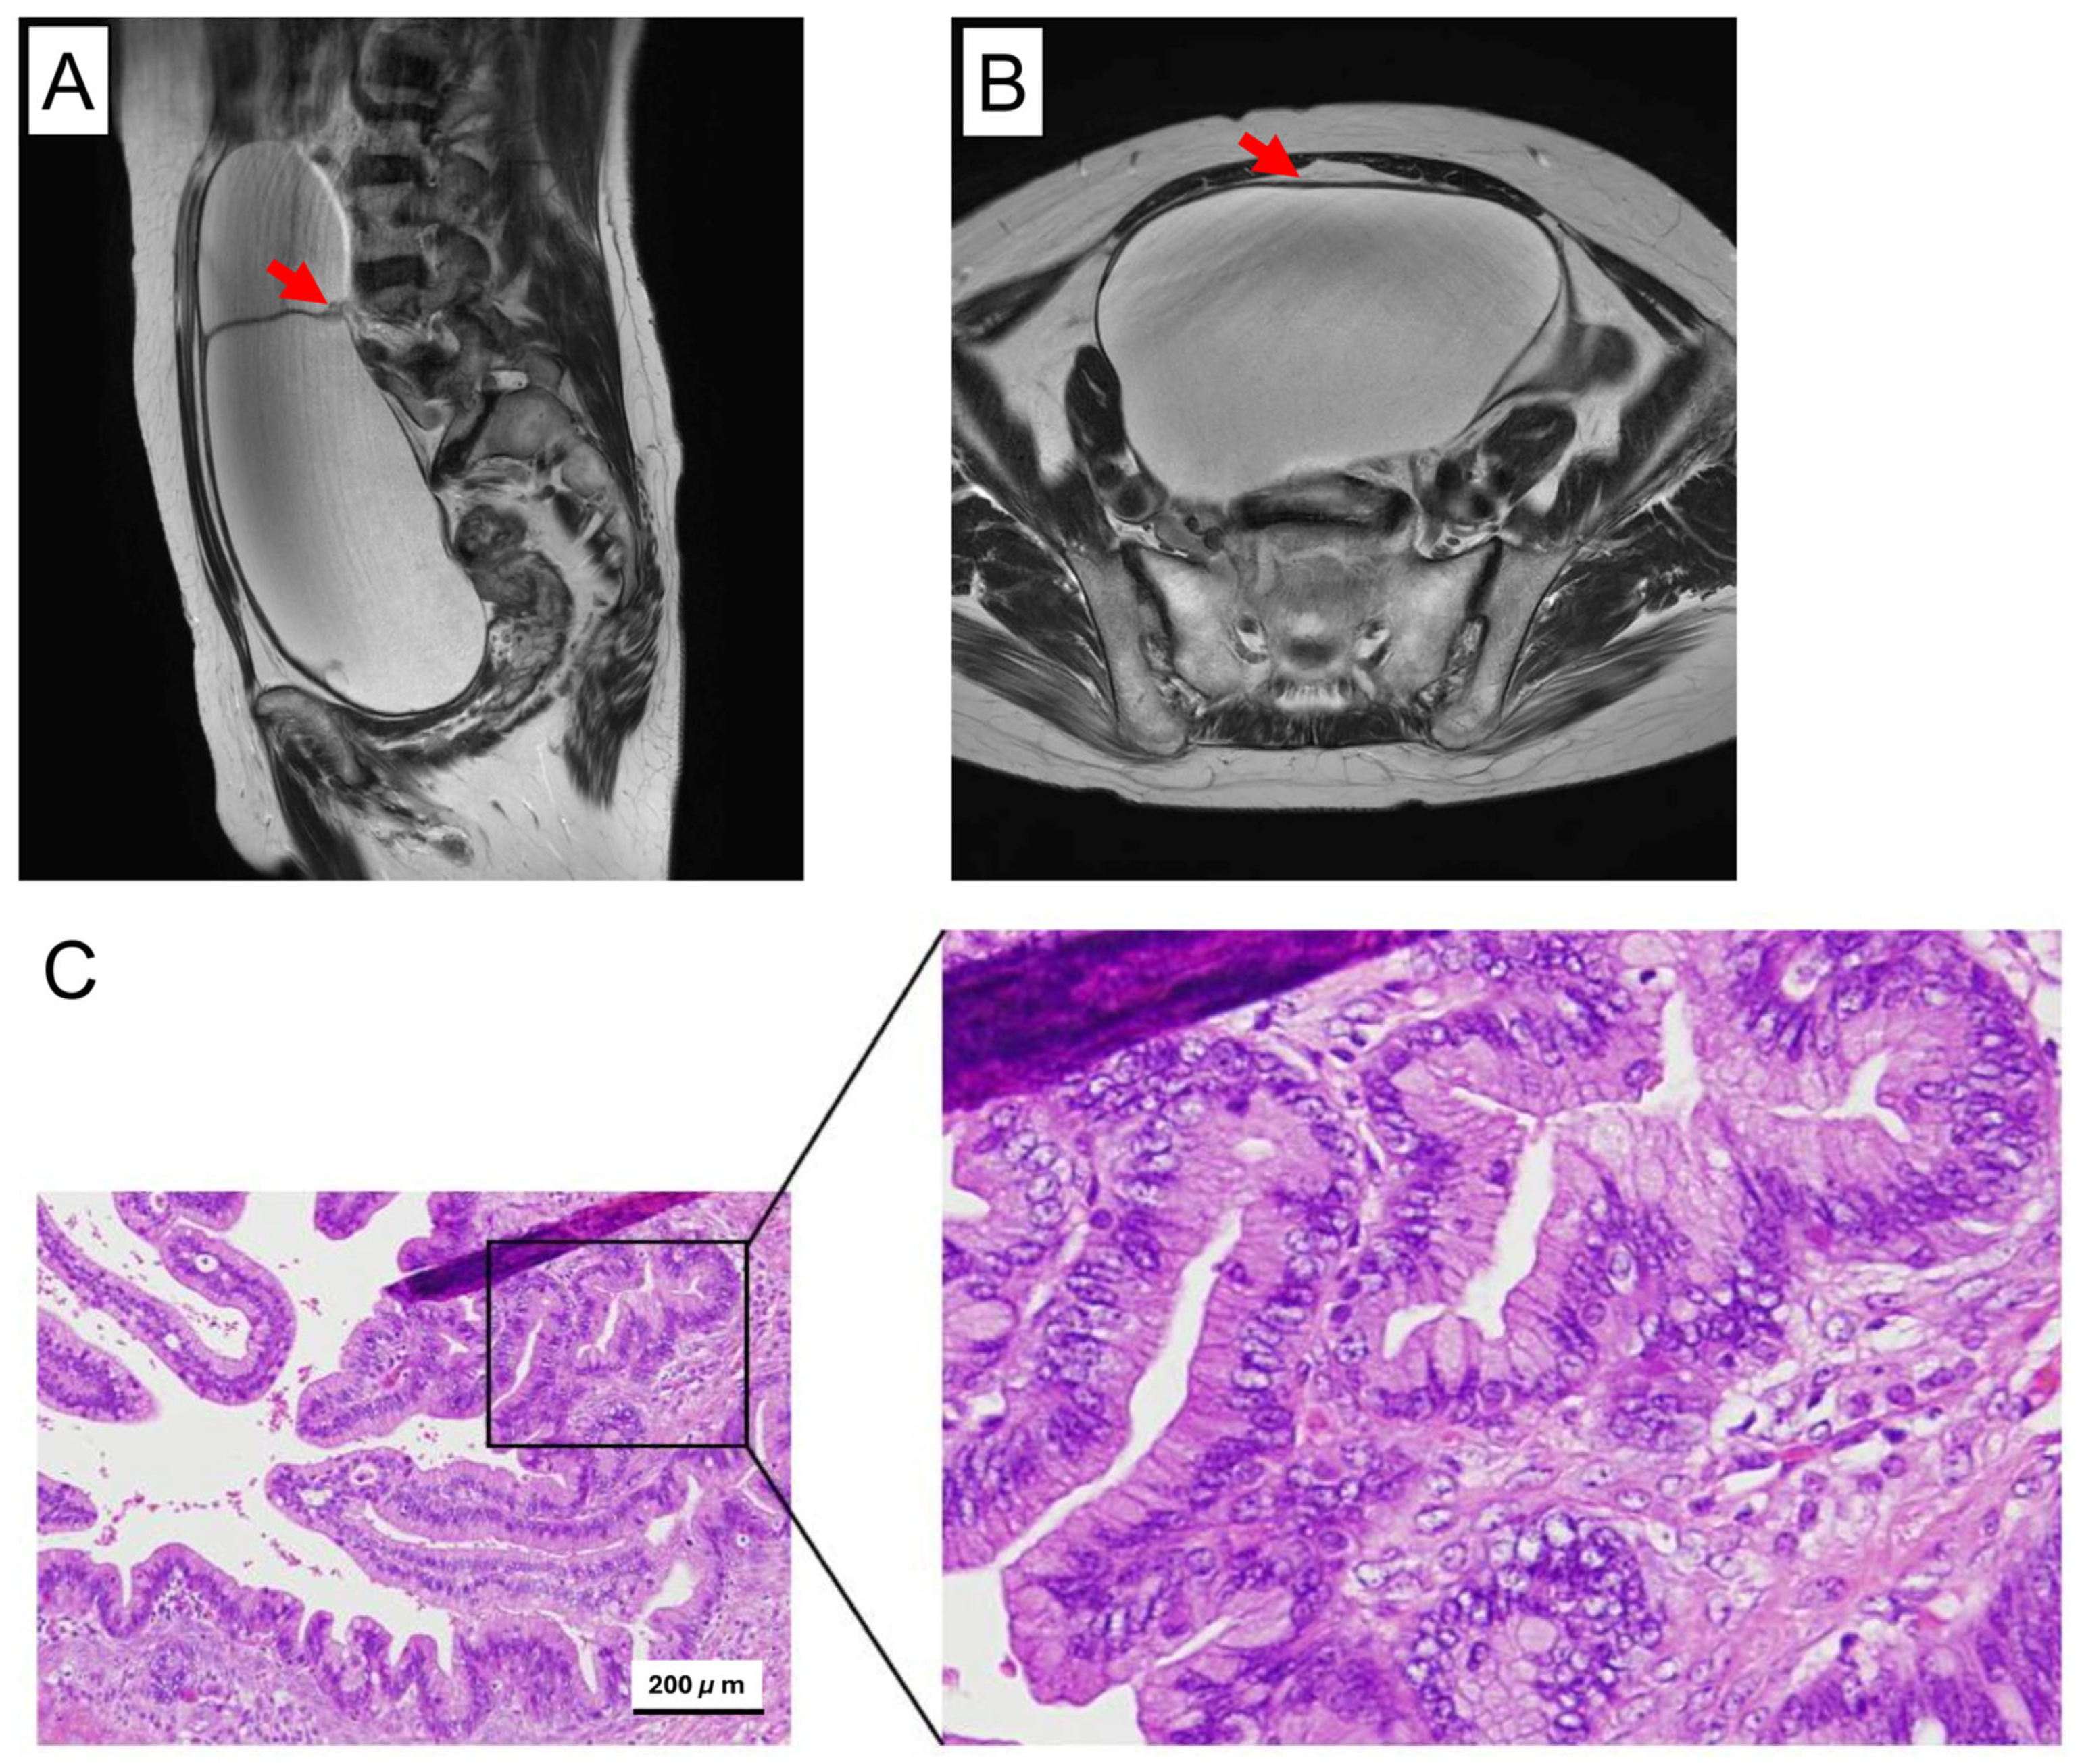
3.1. Histopathological Overview of the Original Tumor

In the present study, we focused on a 62-year-old woman suffering from a large ovarian cystic tumor that was considered benign to borderline upon preoperative diagnosis, given the size of the tumor and the presence of abundant partial-thickness septa but lacking apparent solid component within the tumor (Figure 1A). The patient underwent a bilateral salpingo-oophorectomy, revealing a right ovarian tumor measuring 24 × 18 cm. The post-operative pathological evaluation revealed that the tumor had a cystic structure lined with mucinous cells. Most of the tumor showed features typical of mucinous cystadenoma, including changes in the cyst wall, such as hyalinization and edema. In a few areas, papillary structures with cellular atypia were present, such as an increased nucleus-to-cytoplasm ratio and prominent nucleoli, but without stromal invasion. These features suggest a mucinous borderline malignancy (Figure 1B). Based on the above finding, the final pathological diagnosis was determined to be an MBOT. At present, the patient is being monitored closely without adjuvant chemotherapy.

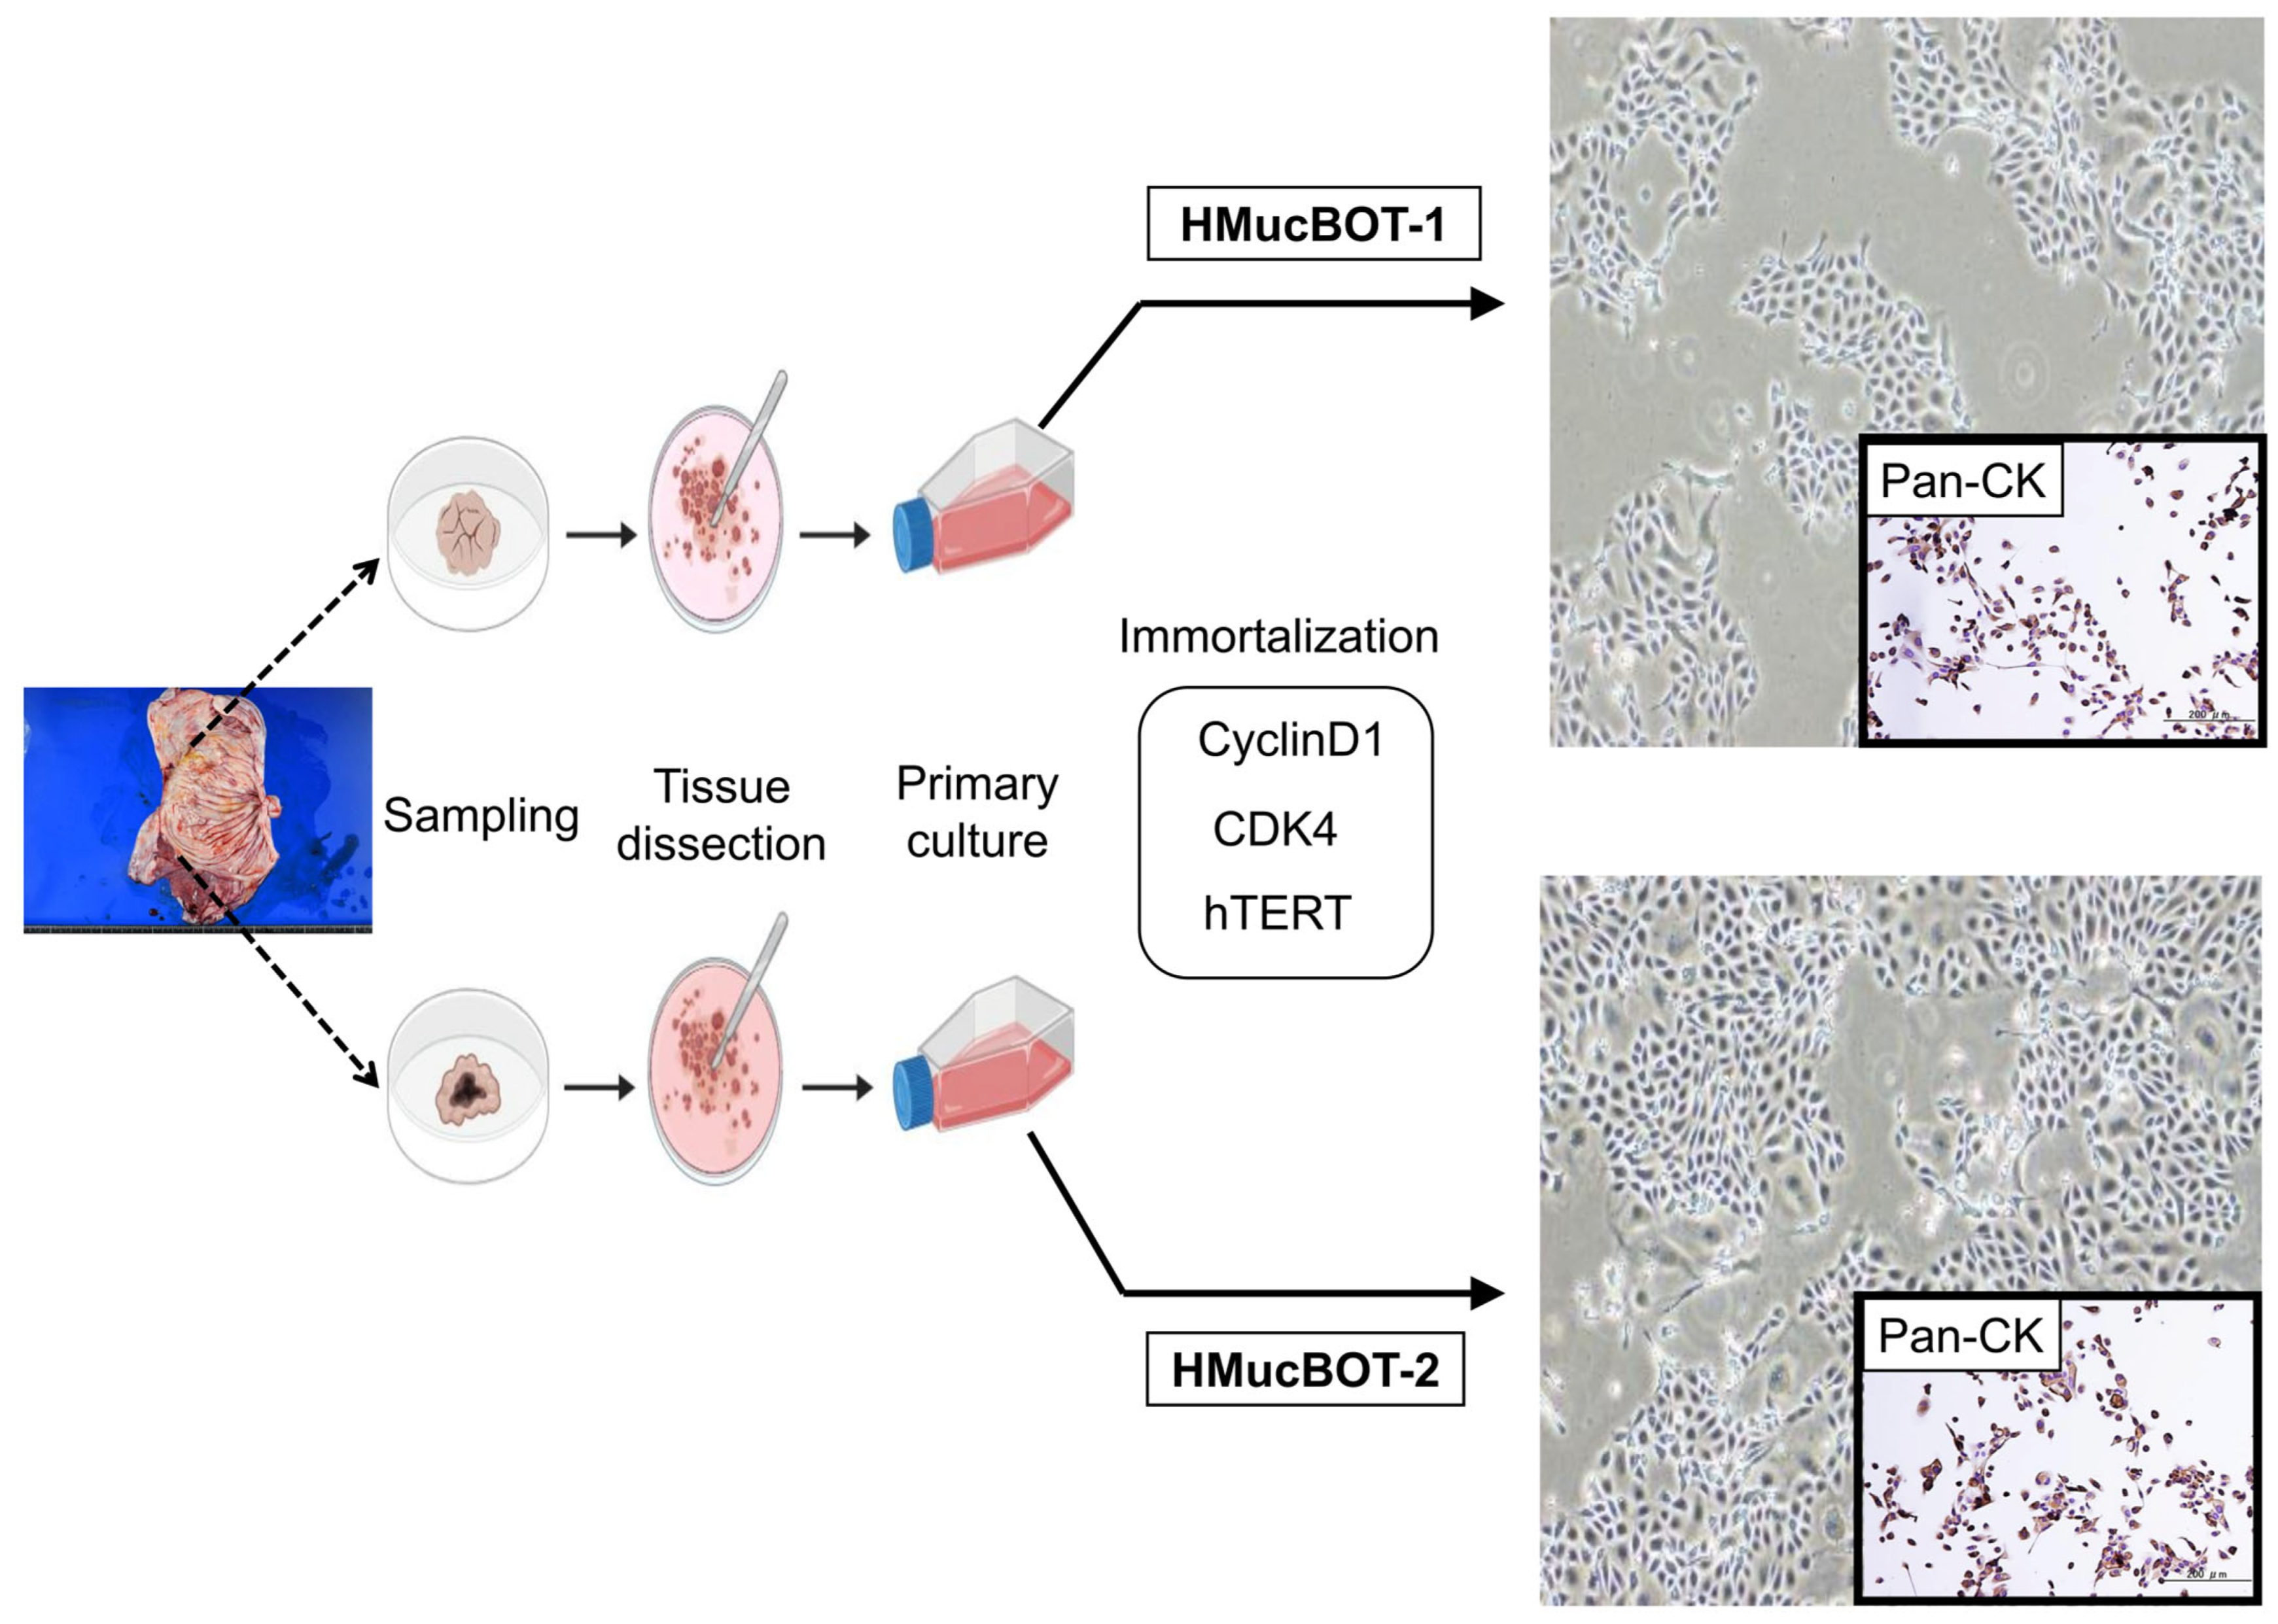
3.2. Establishment of the MBOT Cell Lines

Tissues were collected from two different sites of the ovarian tumor’s papillary structure shortly after the operation, and epithelial cells were isolated, purified, and subjected to primary culture (Figure 2). These cells were confirmed to exhibit typical epithelial morphology. To enable in-depth research, we sought to extend the life span of these cells, as isolated cells from clinical tumors are likely to undergo senescence once subjected to primary culture. There are two types of senescence: premature senescence and telomere-dependent senescence. The former can be overcome by inhibiting Rb activation, possibly through overexpression of activated CDK4 (CDK4R24C) and Cyclin D1, and the latter by overexpressing human telomerase reverse transcriptase (hTERT) to induce telomerase activity [33,34,35]. We therefore overexpressed these three factors through lentiviral transfection and successfully obtained cells with extended life spans. These cells continued to proliferate until at least 60 population doublings (PDs), indicating that they can be stably cultured for use in subsequent analyses.
The resulting cell lines were designated as HMucBOT-1 and HMucBOT-2, both exhibiting a polygonal, tightly packed morphology, characteristics of epithelial cells with Pan cytokeratin expression, resembling the cobblestone pattern (Figure 2). The STR patterns observed did not match any previously reported cell lines (Supplementary Table S1), confirming that HMucBOT-1 and HMucBOT-2 are original novel cell lines.
Epithelial fractions of sampled tissues were subjected to primary culture, followed by overexpression of CyclinD1, CDK4, and hTERT to overcome cellular senescence during the course of primary culture. Over time, these cells showed immortal features, preserving epithelial characteristics, such as Pan-cytokeratin (CK) expression.

3.3. Histological Diversity of Mouse Tumors Derived from HMucBOT-1 and HMucBOT-2 Cells

Although HMucBOT-1 and HMucBOT-2 cells were derived from the ovarian tumor pathologically diagnosed as an MBOT, there was no guarantee that these cells specifically originated from borderline lesions because the areas showing borderline histology were limited within the tumor in histological sections, which could not be macroscopically identified. We therefore sought to confirm their histological characteristics and malignant potential based on their tumorigenicity in mice.
The cells were independently inoculated into the SCID mice, and we were able to efficiently determine tumor development within 15–17 weeks following the injection of 2 × 10⁴ cells or 12–14 weeks after the injection of 2 × 10⁶ cells (Table 1).
Histological analysis involving HE staining of the tumor sections showed distinct tumor characteristics. Tumors derived from HMucBOT-1 cells retained the MBOT histology (Figure 3), consistent with the primary tumor’s features. However, unexpectedly, tumors derived from HMucBOT-2 cells exhibited carcinoma histology, with a mixture of mucinous and high-grade-type undifferentiated carcinoma components. We pathologically diagnosed this mouse tumor as dedifferentiated carcinoma. Based on the above results, it can be concluded that the histology of HMucBOT-1 and HMucBOT-2 cells significantly diverged in the mouse tumor model, possibly reflecting the heterogeneity of the original tumor.
HMucBOT-1 and HMucBOT-2 cells were injected into SCID mice, and tumorigenicity was observed. Both cells efficiently formed tumors, and HE staining of the tumors of HMucBOT-1 cells showed mucinous borderline histology, consistent with the original tumor. However, tumors of HMucBOT-2 cells exhibited dedifferentiated carcinoma, composed of mucinous carcinoma and undifferentiated carcinoma lesions. White arrows, mucinous carcinoma lesions; Black arrows, undifferentiated carcinoma lesions.

3.4. HMucBOT-2 Cells Showed Genetic Alterations Distinct from the Original Tumor

We focused on the findings that HMucBOT-2 cells showed undifferentiated carcinoma histology on mouse tumors despite the fact that the original tumors were pathologically diagnosed as MBOTs. To examine the molecular backgrounds of HMucBOT-2 cells, we performed whole-exome sequencing on macroscopically dissected MBOT lesions from the HE sections of the original tumors in addition to the HMucBOT-2 cells. Oncogenic mutations in KRAS, ARID1A, ARID1B, SMO, NF1, and BRIP1 were frequently detected in both samples (Table 2 and Table 3).
No threefold or higher copy number alterations were observed in the original tissue (Figure 4A). However, in HMucBOT-2 cells, significant chromosomal copy number alterations were identified in chromosome (Chr) 12, with it displaying a threefold gain in KRAS, KMT2D, CLIP1, and CDK4 (Figure 4B), and Chr 5, with it displaying a threefold gain in TERT, with some of these changes possibly being due to artificial genetic manipulations via CDK4 and hTERT overexpression. Copy number alterations were also observed in other chromosomes; however, they did not reach the threefold threshold.

3.5. Biological Behavior of HMucBOT-1 and HMucBOT-2 Cells

We were interested in investigating the differences between the biological behavior of both cells. To help us achieve this aim, we first tested the growth rates of the HMucBOT-1 and HMucBOT-2 cells using an MTT assay. The HMucBOT-2 cells showed a much greater proliferation capacity compared to the HMucBOT-1 cells, with the doubling time for the HMucBOT-2 cells being 58 h compared to 87 h for the HMucBOT-1 cells (Figure 5A) [36,37]. Their ability to form colonies on soft agar was subsequently assessed, and the HMucBOT-2 cells exhibited significantly greater colony-forming potential than the HMucBOT-1 cells (Figure 5B). Furthermore, the migration and invasion assay results demonstrated that HMucBOT-2 cells exhibited a higher capacity for both invasion and migration compared to HMucBOT-1 cells (Figure 5C,D). These findings highlight how HMucBOT-2 cells exhibit more aggressive and invasive features than HMucBOT-1 cells. Consistent with previous reports, our results indicate that KRAS amplification and additional copy number alterations in genes may confer greater tumor aggressiveness compared to KRAS mutation alone [38,39,40].

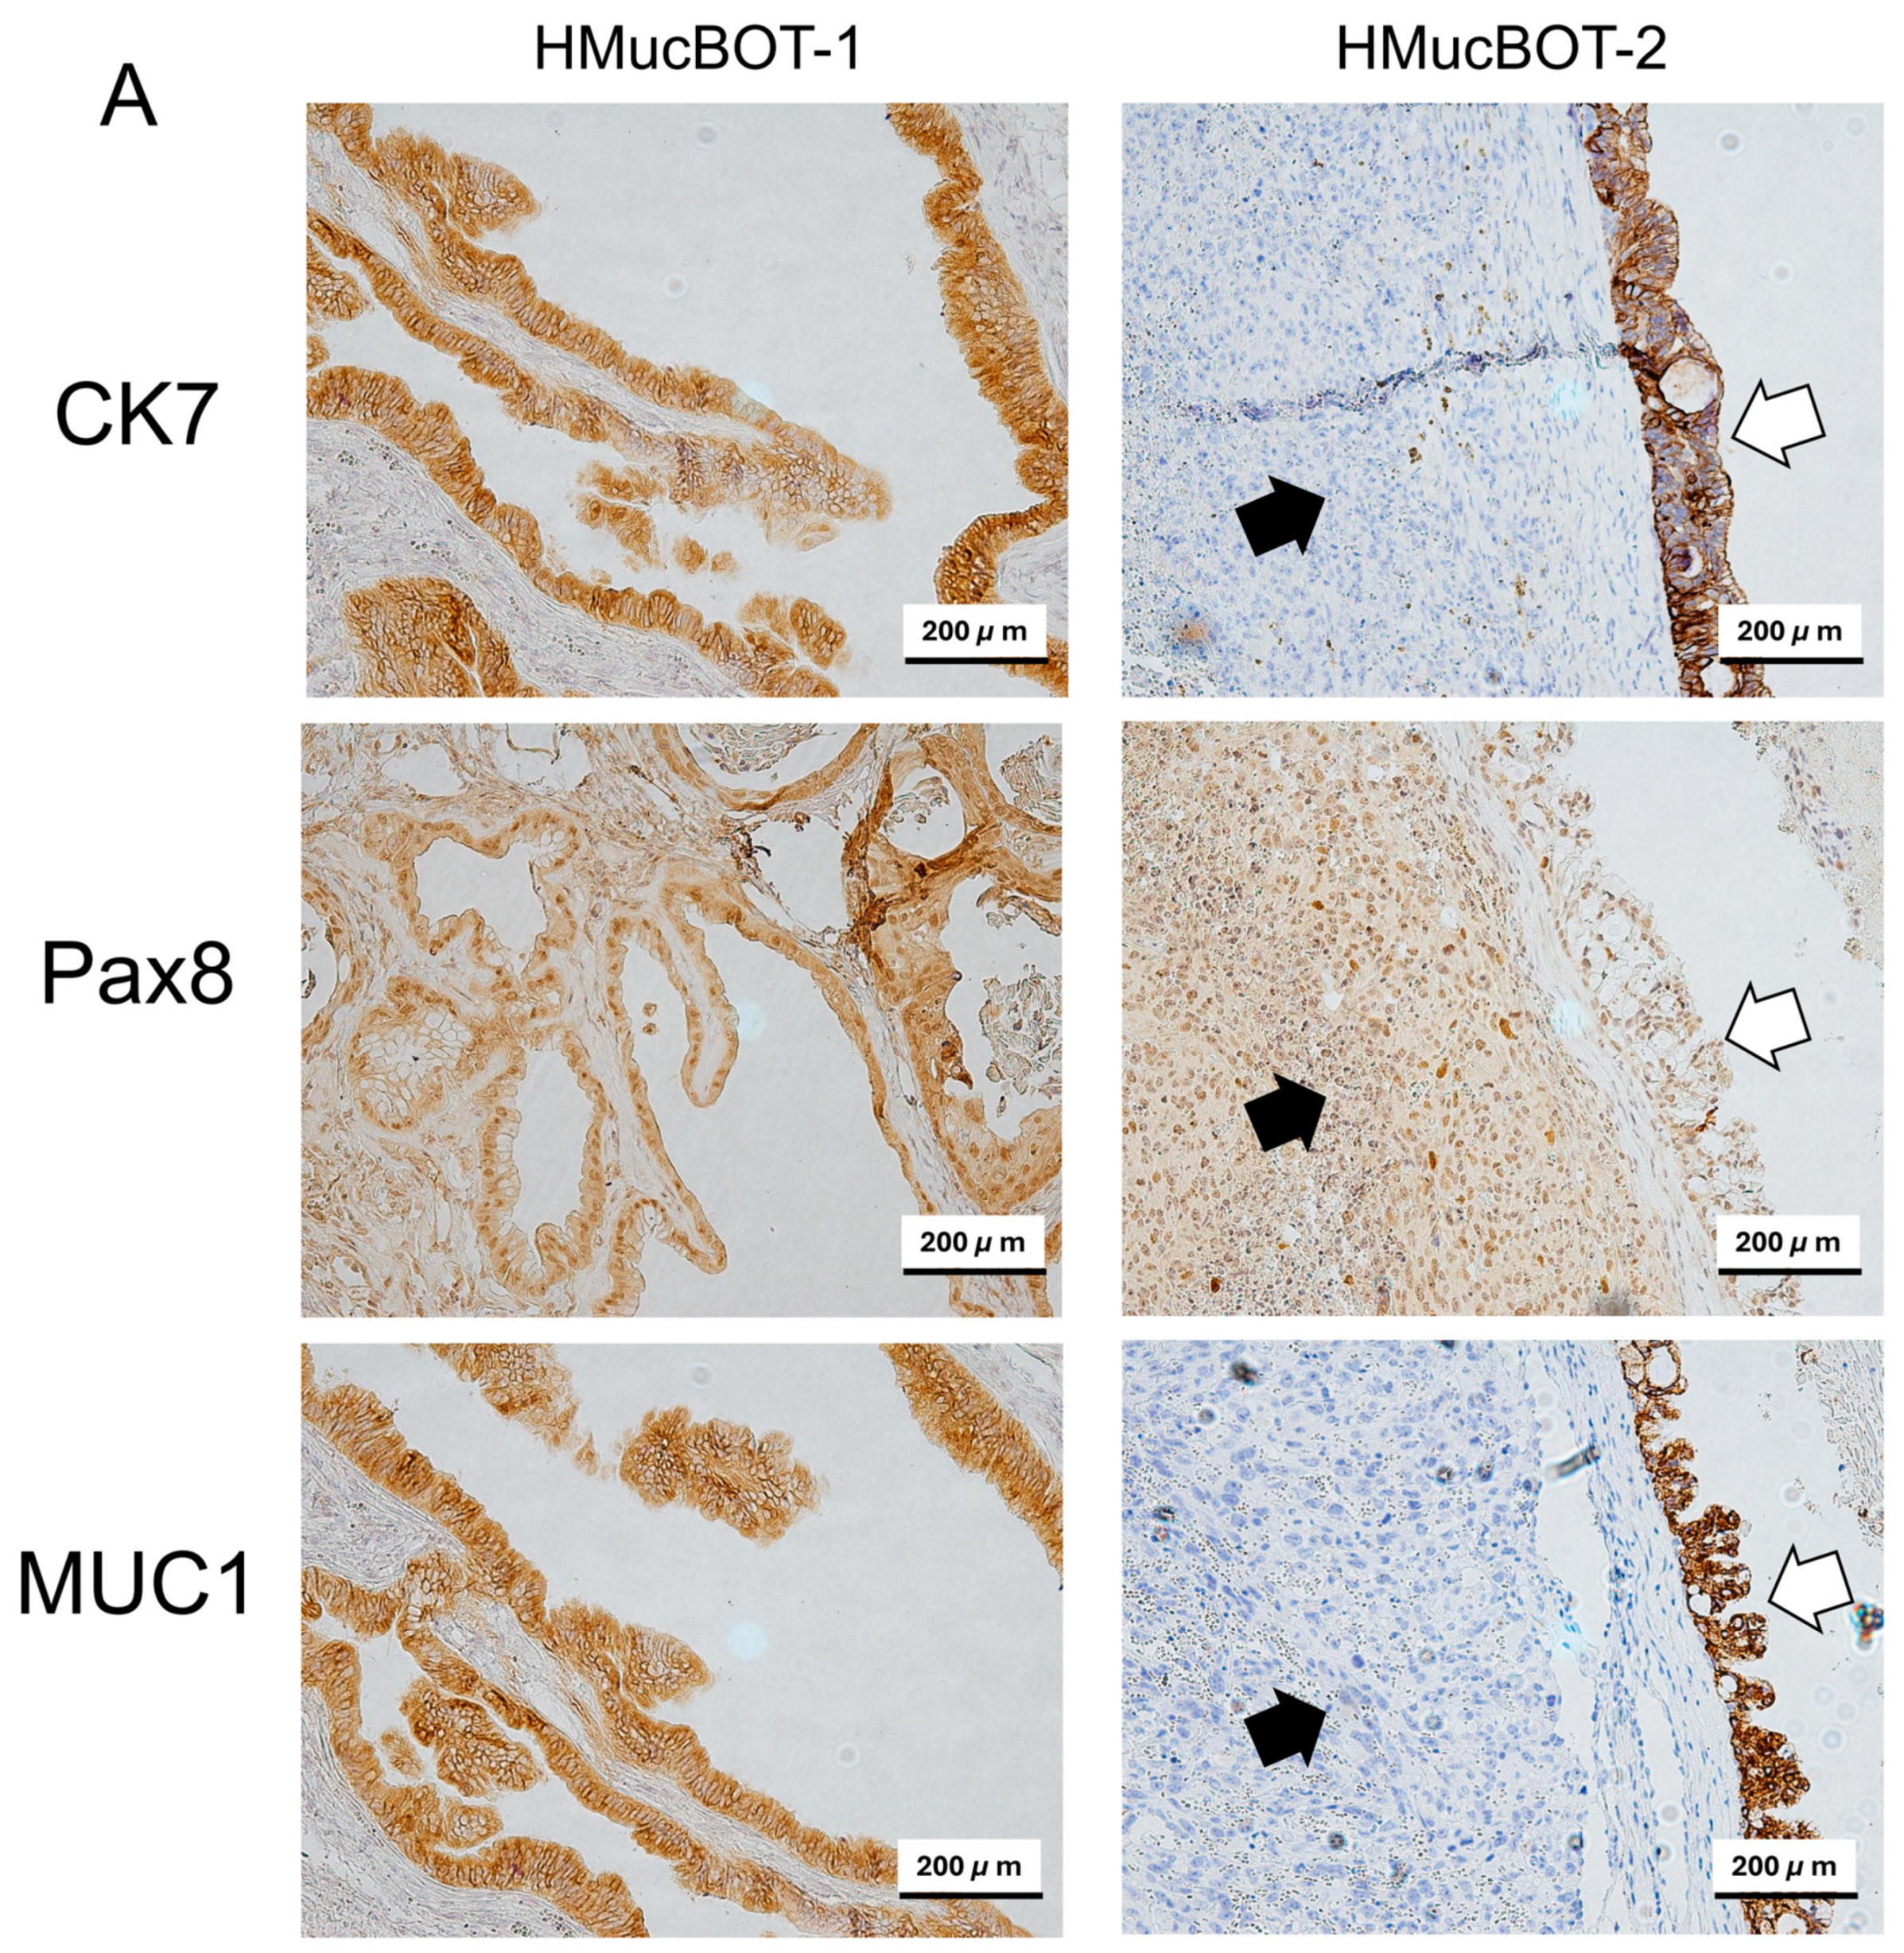
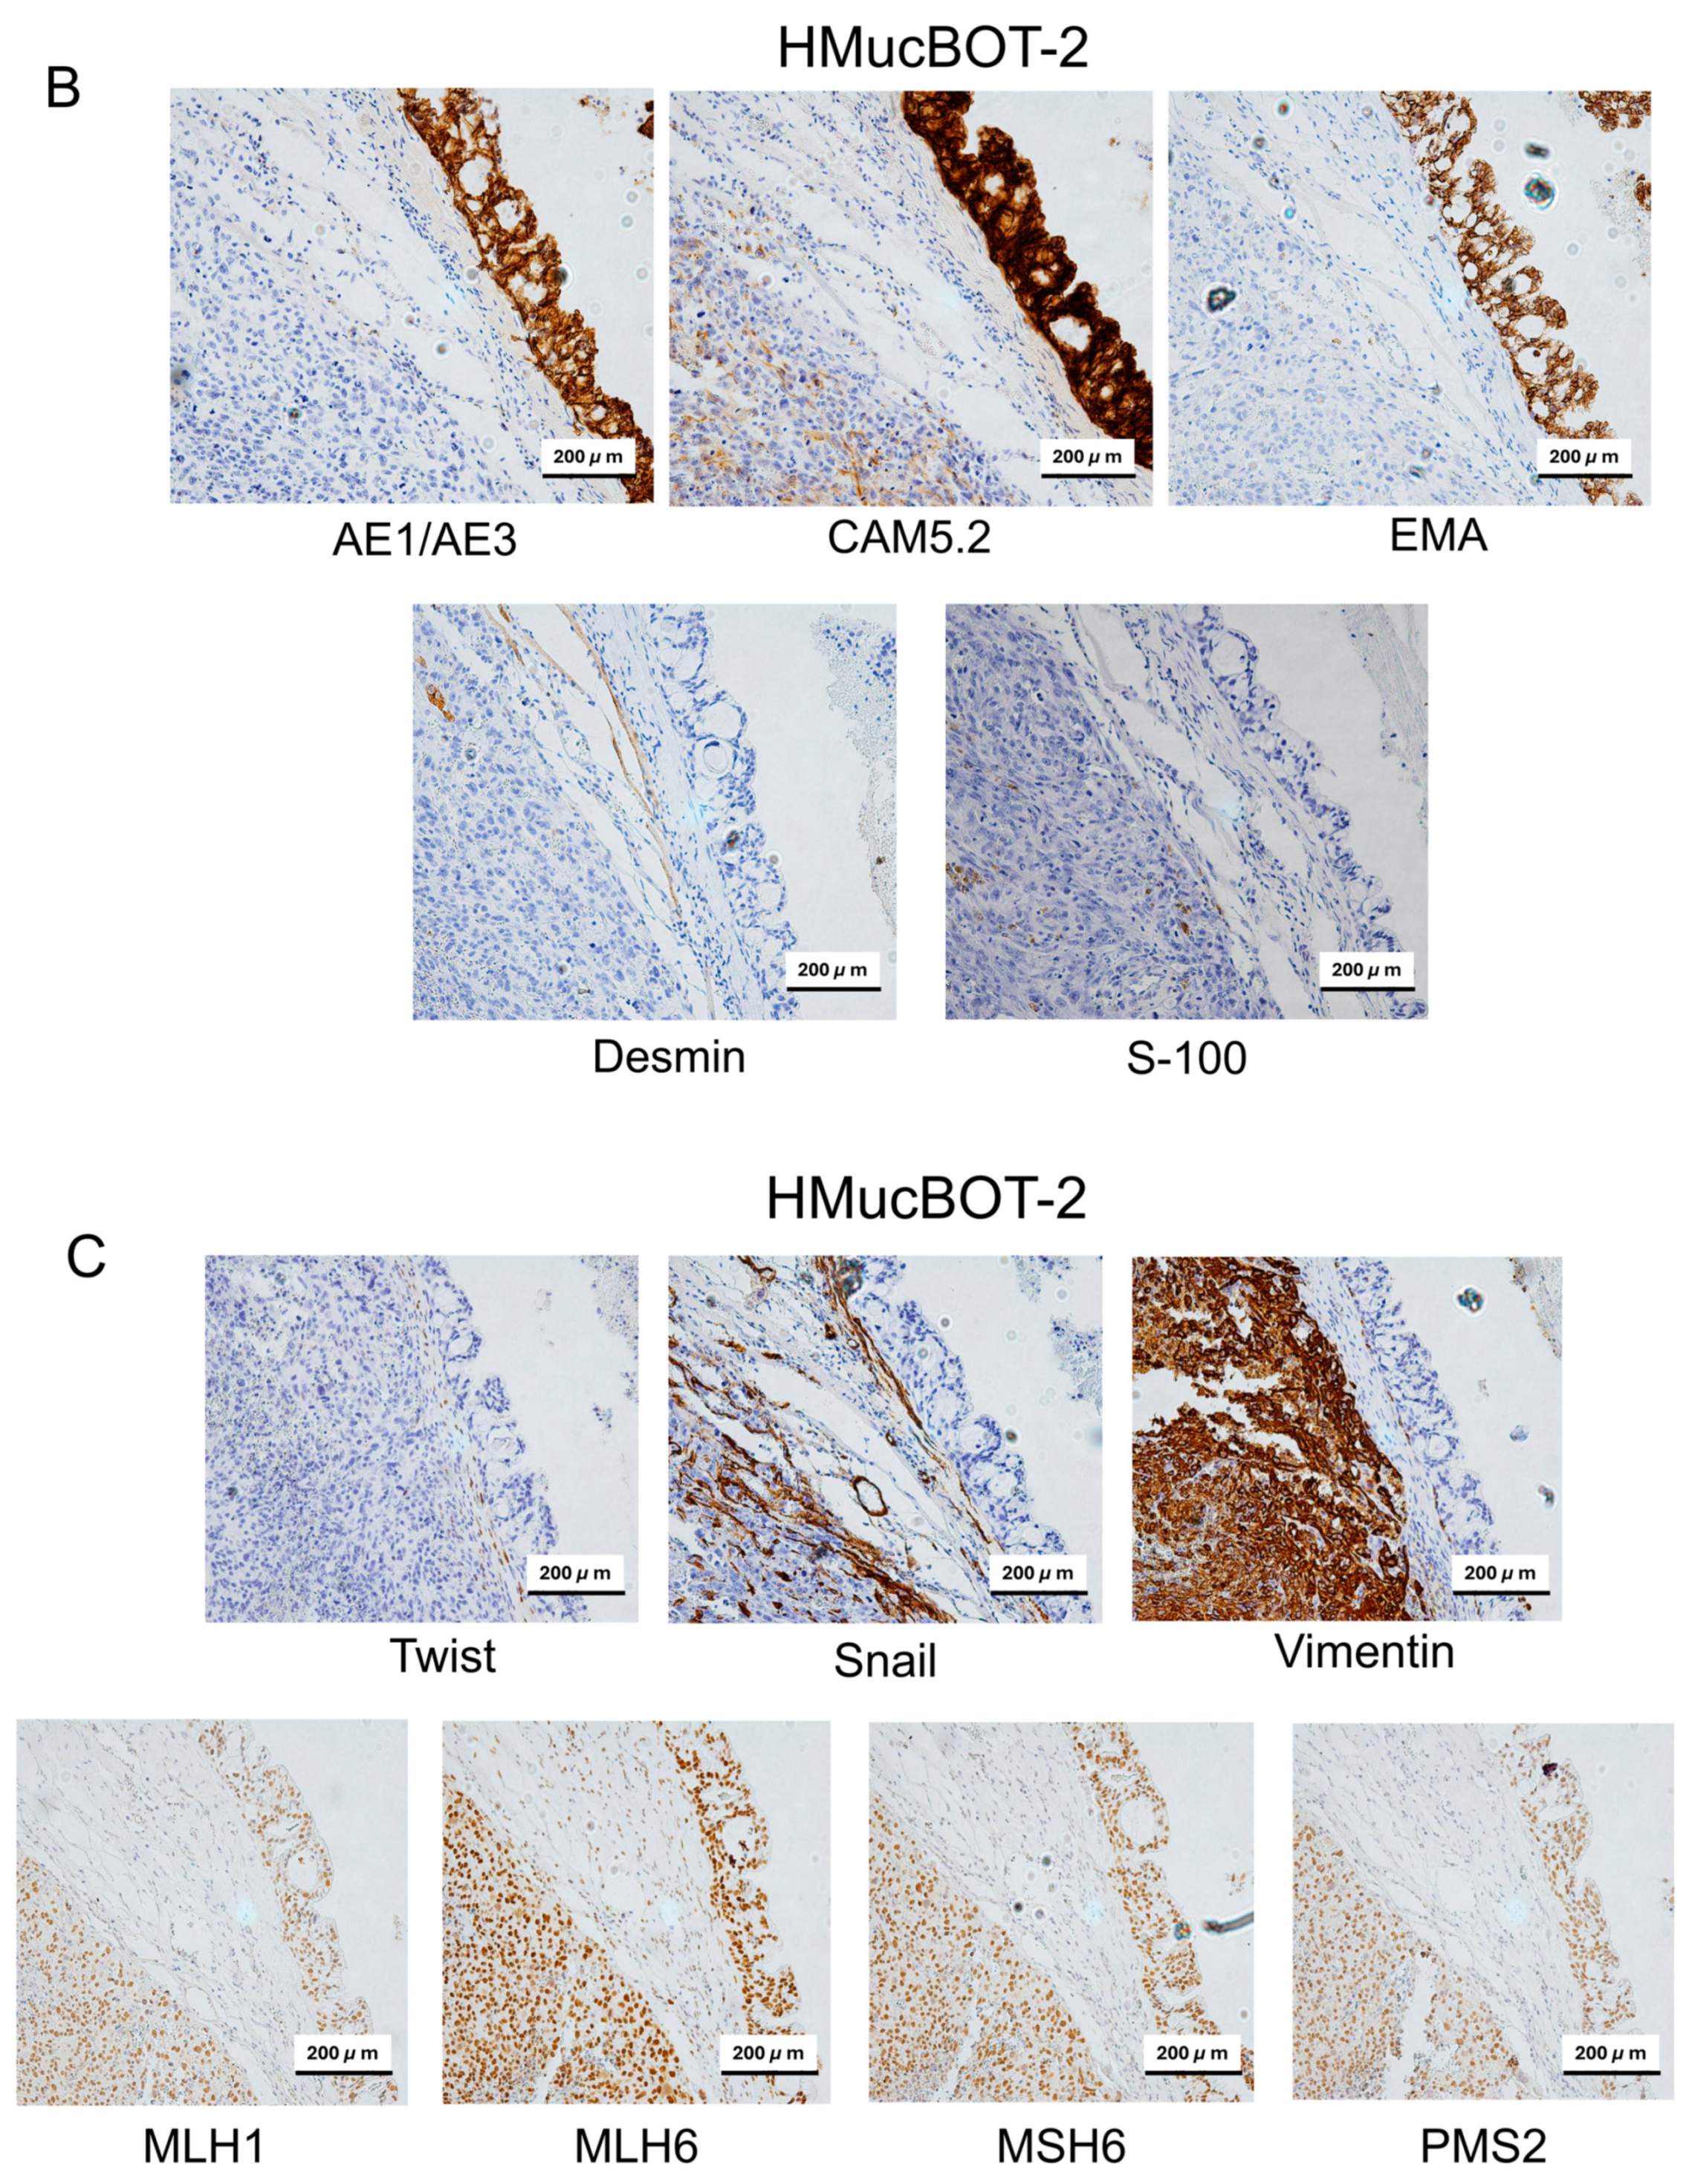
3.6. Characterization of Mouse Xenograft Tumors

To further characterize xenograft tumors of the HMucBOT-1 and HMucBOT-2 cells, we performed an immunohistochemical analysis. Typical epithelial markers were first examined in both cell lines and tumors. The HMucBOT-1 tumor expressed the epithelial markers CK7, PAX8, and MUC1 in the borderline lesions (Figure 6A); in addition, these markers were expressed in cell lines (Supplementary Figure S1). In a similar manner, in the HMucBOT-2 tumor, mucinous carcinoma lesions expressed all of these markers, with undifferentiated lesions exhibiting PAX8 expression but not CK7 or MUC1 expression.
We next focused on the expression of the dedifferentiated markers for the HMucBOT-2 tumor based on the results of previous studies [41,42,43,44,45]. The HMucBOT-2 tumor exhibited AE1/AE3, CAM 5.2, and EMA expression in mucinous carcinoma lesions but not undifferentiated lesions (Figure 6B). No significant expression of Desmin or S-100 was detected in both mucinous and undifferentiated carcinoma, consistent with the expression pattern of dedifferentiated carcinoma.
We further extended the IHC analysis for the HMucBOT-2 tumor in relation to epithelial–mesenchymal transition (EMT) markers. Twist expressions were negative for both mucinous and undifferentiated carcinoma lesions, whereas Snail and Vimentin expressions were positive in undifferentiated carcinoma lesions (Figure 6C).
The involvement of mismatch repair deficiency has been noted in dedifferentiated carcinoma in endometrial cancer [46,47,48]. We therefore investigated the marker expression of MLH1, MSH2, MSH6, and PMS2; however, they were all found to be present in both mucinous carcinoma and undifferentiated lesions, indicating the mismatch repair proficiency of this tumor (Figure 6C).

3.7. The Response to Cytotoxic Drugs

To further characterize the two types of cells in terms of clinical relevance, we conducted experiments to determine the cells’ responses to cytotoxic agents used in clinical practice to treat ovarian cancer. Because taxanes and platinum-based agents are the only representative chemotherapeutic agents for ovarian mucinous tumors, we examined the sensitivity of paclitaxel and cisplatin. Cell viability did not change significantly when the cells were treated with serial concentrations of paclitaxel or cisplatin for 24 h. However, it significantly decreased when the cells were treated for 72 h, with the half-maximal inhibitory concentration (IC50) of paclitaxel being roughly 11.6 and 12.5 nmol/L for HMucBOT-1 (Figure 7A) and HMucBOT-2, respectively, and the IC50 of cisplatin being 26.6 and 29.3 mmol/L, respectively (Figure 7B). These results indicated that these cells were at least partially sensitive to paclitaxel and cisplatin in vitro.

4. Discussion

Studies on ovarian carcinogenesis have primarily focused on ovarian cancer, with much less focus on borderline tumors, because the origin of the latter (from a healthy ovary or a benign cyst?) and their natural history remain largely unknown. In addition, the question of whether borderline tumors are precursors of ovarian cancer has yet to be definitively answered. Borderline tumors are rare tumors, and their clinical, pathological, and molecular characteristics significantly differ among each histological subtype, making research on this tumor type extremely difficult. Understanding the pathogenesis of borderline tumors therefore presents a challenge for gynecologic oncologists.
MBOTs are the second most prevalent type of ovarian tumor, accounting for 35–45% of all ovarian borderline tumors [10]. Although a limited number of articles cover the characteristics and clinical management of MBOTs, including their prognosis and recurrence patterns [19,49,50], the establishment of permanent cell lines from MBOTs remains constrained due to their rarity and the difficulty of stable culture. Patient-derived tumor cell lines retain essential tumor features and offer valuable platforms for investigating tumor biology, drug sensitivity, and personalized therapeutic strategies [51,52].
In the present study, we successfully established two novel cell lines, HMucBOT-1 and HMucBOT-2, from primary cultures derived from the tissues of a patient with an MBOT. The use of CyclinD1/CDK4 together with hTERT overexpression has been recognized as an established method to extend cellular life span, preserving the original nature of primary epithelial cells from a variety of tumor types [33,34,35]. These cells and their derived tumors show positive expression for the CK7, PAX8, and MUC1 proteins, confirming that they are of epithelial origin, possibly from mucinous adenoma or borderline lesion [27,53,54,55,56].
Despite originating from the same tumor, the two cell lines displayed distinct pathological characteristics. HMucBOT-1 retained morphological features of the original MBOT when xenografted into SCID mice, while HMucBOT-2 exhibited dedifferentiated carcinoma with features of both mucinous and high-grade undifferentiated carcinoma. At the time of tissue sampling following surgery on the patient’s tumor, we collected tissues from the papillary thickened sites of the septa; however, there was no guarantee that such areas specifically contained borderline cells because borderline lesions were not macroscopically detected, unlike during microscopic inspection. We speculate that cells with borderline characteristics or with more potential were fortunately included in the collected tissues, which might be the origin or source of HMucBOT-1 or HMucBOT-2 cells, considering their tumorigenic potential in mice.
The emergence of dedifferentiated carcinoma from HMucBOT-2 xenografts is notable, especially considering that histological findings from the original tumor demonstrated MBOTs with only small portions of borderline lesions. We speculate that there are two possible explanations for this diversity: either cells with borderline acquired carcinoma traits during culture or mouse xenografting or cells with carcinoma features were already present in the original tissues but only in minute portions that could not be detected through routine pathological inspection. We favor the latter hypothesis, which may reflect the tumor heterogeneity in MBOTs. In other words, MBOTs may contain cells with more malignant characteristics in a limited range of areas even under the final pathological diagnosis of MBOTs.
The whole-exome sequencing revealed a variety of common oncogenic mutations in the original tumor and HMucBOT-2, including KRAS, ARID1A, ARID1B, and NF1, while CDKN2A remained wild-type. Although DNA from FFPE and cultured cells can introduce technical biases [57], we followed stringent processing and quality control protocols to minimize these biases. Our consistent mutational profiles across original and derived samples underscore the reliability of our findings. Notably, while KRAS, CDKN2A, and ARID1A mutations are frequently observed in both MBOTs and mucinous ovarian carcinomas [21,58,59], our analysis also identified mutations in ARID1B, SMO, BRIP1, and NF1, as well as amplification of KMT2D and CLIP1 genes, which were not previously associated with MBOTs and MOCs, indicating novel molecular events of these tumors.
In particular, HMucBOT-2 demonstrated copy number gains in chromosomes 5 and 12 where KRAS, KMT2D, and CLIP1 are located and have been associated with cancer transformation.
KRAS mutations are the most frequent alterations observed in MOC (64.9%) and MBOTs (92.3%) [21], suggesting that our cell lines may therefore preserve or reflect the genetic features of these tumors. As a key oncogene, KRAS regulates the signaling pathways critical for cell proliferation and survival [60]. Mutations in KRAS can lead to constitutive activation of these pathways, resulting in uncontrolled cell growth and tumor development. When the mutant KRAS allele undergoes amplification, the increased gene copy number can lead to elevated expression of the mutant protein, further enhancing downstream signaling activity and promoting cancer progression [40,61].
Abnormalities in the KMT2D (lysine methyltransferase 2D) gene contribute to the development of various types of cancer, including medulloblastoma, melanoma, lymphomas, leukemia, and cancers of the lung, prostate, kidney, bladder, ovary, pancreas, esophagus, and stomach [62,63,64,65,66,67,68,69,70,71,72,73,74,75,76], disrupting genetic and epigenetic regulation and promoting tumor initiation, progression, and metastasis.
The CLIP1 (CAP-Gly-domain-containing linker protein 1) gene regulates microtubule dynamics and mediates cell migration, particularly in cancer metastasis. It aids the transport of proteins and organelles along microtubules, contributing to tumor progression in several types of cancer [77].
In fact, the results of the present in vitro study demonstrated that HMucBOT-2 cells show greater colony formation, invasion, and migration compared to HMucBOT-1 cells. Based on these findings, we speculate that additional genetic alterations observed in HMucBOT-2 cells may be involved in the development of dedifferentiated carcinoma and contribute to more aggressive behavior.
Although MBOTs rarely progress to invasive carcinoma, such progression appears to be driven by genomic events like mutant KRAS amplification and widespread copy number alterations. Amplified KRAS intensifies Ras–MAPK signaling, promoting uncontrolled proliferation [24,78]. Meanwhile, high copy number alterations in genes are the key drivers that influence the grade and progression of metastatic disease, contributing to uncontrolled cell growth, increased invasion, and therapy resistance [79,80,81]. Several previous studies have reported that high copy number alterations, along with amplification of mutant KRAS alleles and/or co-occurrence with TP53 mutations, may contribute to the progression of MBOTs to MOCs [20,82,83,84,85,86].
Recent advances in non-invasive diagnostics may facilitate early detection of these transitions. Liquid-biopsy-based detection of circulating tumor DNA (ctDNA) allows real-time monitoring of tumor-derived mutations [87]. Molecular barcoding has further improved the sensitivity of sequencing, allowing for the detection of low-frequency variants that may be missed by conventional methods [88]. Additionally, cell-free DNA (cfDNA) methylation profiling can reveal cancer-specific patterns for early diagnosis [89]. Together, these technologies may support individualized surveillance strategies and reduce misdiagnosis by improving molecular accuracy. Shishi He and colleagues established cell lines from both benign and malignant breast phyllodes tumors (PTs) obtained from different patients. These biphasic tumors contain both epithelial and stromal components. The established cell lines were xenografted into mice and subjected to various in vitro analyses. Their study provides a valuable model for exploring tumor heterogeneity and identifying potential therapeutic targets or biomarkers [90]. This approach supports our study by emphasizing the importance of patient-derived cell lines for investigating rare tumors and their progression.

5. Conclusions

In this study, we established two novel cell lines derived from a mucinous borderline ovarian tumor (MBOT). HMucBOT-1 preserved the morphological and molecular features of the original MBOT, whereas HMucBOT-2 displayed dedifferentiated characteristics, including features of mucinous and high-grade carcinoma. The differences between the two cell lines likely reflect the underlying tumor heterogeneity within MBOTs. One of the most important clinical implications of these findings is that the initial pathological diagnosis of surgical specimens does not always predict the clinical course, but unexpected relapse may occasionally occur. The clinicians should take note of this biology of MBOT.
Additionally, these cell lines serve as valuable models for studying the molecular basis of MBOT progression. HMucBOT-1 provides a platform for investigating early-stage tumor biology and preventive strategies, while HMucBOT-2 facilitates research into aggressive tumor behavior and malignant transformation. Together, these models support future efforts in molecular risk stratification, personalized therapy development, and improved clinical management of mucinous ovarian tumors.

Supplementary Materials

The following supporting information can be downloaded at: https://www.mdpi.com/article/10.3390/cancers17101716/s1. Table S1. STR profiles of two unique epithelial cell lines originated from the same sample of MBOT; Table S2. Description of primary antibodies; Figure S1. HMucBOT-1 and HMucBOT-2 cells showed positive expressions of CK7, PAX8, and MUC1.

Author Contributions

H.I.S., S.K. and U.F.Z. drafted the manuscript; H.I.S. and U.F.Z. conducted formal analysis and visualization; M.I., K.K., H.Y., S.B.S. and S.R. conducted the data collection; K.N. and S.K. participated in the study design; S.K. participated in the coordination of the study; T.K. assisted in developing immortalized cell lines. All authors have read and agreed to the published version of the manuscript.

Funding

This work was supported by JSPS KAKENHI Grant Number 24K02588 and S-SPRING (Japan Science and Technology Agency (JST)).

Institutional Review Board Statement

This study was conducted in accordance with the Declaration of Helsinki and approved by the Ethics Committee of Shimane University Faculty of Medicine, Izumo, Japan (IRB-No. 20070305-1 and No. 20070305-2).

Informed Consent Statement

Informed consent was obtained from all subjects participating in this study.

Data Availability Statement

The data presented in this study are available on request from the corresponding authors.

Acknowledgments

We gratefully acknowledge all members of the Department of Obstetrics and Gynecology, Shimane University Faculty of Medicine, for their helpful suggestions and advice. Additionally, we would like to thank Mamiko Nagase, a gynecological pathologist, for her kind assistance in examining and diagnosing the specimens. We also extend our appreciation to the Shimane University Animal Care Center for their support.

Conflicts of Interest

The authors declare that they have no conflicts of interest.

Abbreviations

The following abbreviations are used in this manuscript:
MBOTMucinous borderline ovarian tumor
STRShort tandem repeat
BOTBorderline ovarian tumor
MOCMucinous ovarian carcinoma
KRASKirsten rat sarcoma virus
ARID1AAT-rich interaction domain 1A
PIK3CAPhosphatidylinositol-4,5-bisphosphate 3-kinase catalytic subunit alpha
TP53Tumor protein 53
CNACopy number alteration
HMucBOTHuman mucinous borderline tumor
FFPEFormalin-fixed paraffin-embedded
EMTEpithelial-to-mesenchymal transition
MMRMismatch repair

References

  1. Bray, F.; Laversanne, M.; Sung, H.; Ferlay, J.; Siegel, R.L.; Soerjomataram, I.; Jemal, A. Global Cancer Statistics 2022: GLOBOCAN Estimates of Incidence and Mortality Worldwide for 36 Cancers in 185 Countries. CA Cancer J. Clin. 2024, 74, 229–263. [Google Scholar] [CrossRef] [PubMed]
  2. Siegel, R.L.; Kratzer, T.B.; Giaquinto, A.N.; Sung, H.; Jemal, A. Cancer Statistics, 2025. CA Cancer J. Clin. 2025, 75, 10–45. [Google Scholar] [CrossRef]
  3. Alvarez, R.M.; Vazquez-Vicente, D. Fertility Sparing Treatment in Borderline Ovarian Tumours. Ecancermedicalscience 2015, 9, 507. [Google Scholar] [CrossRef] [PubMed]
  4. Camara, C.; Caroline Vos, M.; de Rooij, B.H.; Pijnenborg, J.M.A.; Boll, D.; van de Poll-Franse, L.V.; Ezendam, N.P.M. The Role of Positive Psychological Changes in Anxiety and Depression of Patients with Ovarian Tumors and Their Partners: An Observational Study from the Population-Based PROFILES Registry. Support. Care Cancer 2019, 27, 423–431. [Google Scholar] [CrossRef] [PubMed]
  5. Hauptmann, S.; Friedrich, K.; Redline, R.; Avril, S. Ovarian Borderline Tumors in the 2014 WHO Classification: Evolving Concepts and Diagnostic Criteria. Virchows Arch. 2017, 470, 125–142. [Google Scholar] [CrossRef]
  6. Silverberg, S.G.; Bell, D.A.; Kurman, R.J.; Seidman, J.D.; Prat, J.; Ronnett, B.M.; Copeland, L.; Silva, E.; Gorstein, F.; Young, R.H. Borderline Ovarian Tumors: Key Points and Workshop Summary. Hum. Pathol. 2004, 35, 910–917. [Google Scholar] [CrossRef]
  7. Văduva, C.-C.; Constantinescu, C.; Ţenovici, M.; Boldeanu, L.; Istrate-Ofiţeru, A.-M. Conservative Treatment of Borderline Ovarian Tumors: A Retrospective Study. Rom. J. Morphol. Embryol. 2023, 64, 143–150. [Google Scholar] [CrossRef]
  8. Seidman, J.D.; Soslow, R.A.; Vang, R.; Berman, J.J.; Stoler, M.H.; Sherman, M.E.; Oliva, E.; Kajdacsy-Balla, A.; Berman, D.M.; Copeland, L.J. Borderline Ovarian Tumors: Diverse Contemporary Viewpoints on Terminology and Diagnostic Criteria with Illustrative Images. Hum. Pathol. 2004, 35, 918–933. [Google Scholar] [CrossRef]
  9. Song, T.; Lee, Y.-Y.; Choi, C.H.; Kim, T.-J.; Lee, J.-W.; Bae, D.-S.; Kim, B.-G. Histologic Distribution of Borderline Ovarian Tumors Worldwide: A Systematic Review. J. Gynecol. Oncol. 2013, 24, 44–51. [Google Scholar] [CrossRef]
  10. Young, R. WHO Classification of Tumours of Female Reproductive Organs, 2014th ed.; IARC: Lyon, France, 2014; ISBN 978-92-832-2435-8. [Google Scholar]
  11. Nagase, S.; Ohta, T.; Takahashi, F.; Yaegashi, N. Board members of the 2020 Committee on Gynecologic Oncology of the Japan Society of Obstetrics and Gynecology Annual Report of the Committee on Gynecologic Oncology, the Japan Society of Obstetrics and Gynecology: Annual Patient Report for 2017 and Annual Treatment Report for 2012. J. Obstet. Gynaecol. Res. 2021, 47, 1631–1642. [Google Scholar] [CrossRef]
  12. WHO Classification of Tumours Editorial Board. Female Genital Tumours; WHO: Geneva, Switzerland, 2020; ISBN 978-92-832-4504-9. [Google Scholar]
  13. Wahab, S.A.; Tobler, J.J. MR Imaging of Epithelial Ovarian Neoplasms Part I: Benign and Borderline. Magn. Reson. Imaging Clin. North. Am. 2023, 31, 43–52. [Google Scholar] [CrossRef] [PubMed]
  14. Herrington, C.S. Tumors of the Ovary, Maldeveloped Gonads, Fallopian Tube and Broad Ligament. Atlas of Tumor Pathology. Third Series, Fascicle 23 Robert E. Scully, Robert H. Young and Philip B. Clement. Armed Forces Institute of Pathology, Washington, DC, 1998. No. of Pages: 527. Price: $95.00. ISBN: 1881041433. J. Pathol. 1999, 189, 145. [Google Scholar] [CrossRef]
  15. Sun, L.; Li, N.; Song, Y.; Wang, G.; Zhao, Z.; Wu, L. Clinicopathologic Features and Risk Factors for Recurrence of Mucinous Borderline Ovarian Tumors: A Retrospective Study with Follow-up of More Than 10 Years. Int. J. Gynecol. Cancer 2018, 28, 1643–1649. [Google Scholar] [CrossRef]
  16. Karlsen, N.M.S.; Karlsen, M.A.; Høgdall, E.; Nedergaard, L.; Christensen, I.J.; Høgdall, C. Relapse and Disease Specific Survival in 1143 Danish Women Diagnosed with Borderline Ovarian Tumours (BOT). Gynecol. Oncol. 2016, 142, 50–53. [Google Scholar] [CrossRef] [PubMed]
  17. Song, T.; Lee, Y.-Y.; Choi, C.H.; Kim, T.-J.; Lee, J.-W.; Kim, B.-G.; Bae, D.-S. Prognosis in Patients with Serous and Mucinous Stage I Borderline Ovarian Tumors. Int. J. Gynecol. Cancer 2012, 22, 770–777. [Google Scholar] [CrossRef] [PubMed]
  18. Poonyakanok, V.; Warnnissorn, M.; Chaopotong, P. Oncological Outcomes and Risk Factors for Recurrence of Mucinous Borderline Ovarian Tumors: A 15-Year Experience at a Tertiary Center. J. Obstet. Gynaecol. Res. 2024, 50, 2081–2092. [Google Scholar] [CrossRef]
  19. Nakagawa, K.; Nakayama, K.; Nakamura, A.; Hadano, N.; Kurose, S.; Razia, S.; Aoki, S.; Kyo, S. A Novel Case of Recurrent Mucinous Borderline Ovarian Tumor: Early Relapse and Fatal Outcome. Reports 2022, 5, 15. [Google Scholar] [CrossRef]
  20. Wakazono, E.; Taki, M.; Watanabe, K.; Yamanoi, K.; Murakami, R.; Kakiuchi, N.; Yamaguchi, K.; Hamanishi, J.; Minamiguchi, S.; Ogawa, S.; et al. A Case Report of Mucinous Borderline Ovarian Tumor with Recurrence as Invasive Carcinoma with High Copy Number Alterations. Int. Cancer Conf. J. 2024, 13, 520–524. [Google Scholar] [CrossRef]
  21. Mackenzie, R.; Kommoss, S.; Winterhoff, B.J.; Kipp, B.R.; Garcia, J.J.; Voss, J.; Halling, K.; Karnezis, A.; Senz, J.; Yang, W.; et al. Targeted Deep Sequencing of Mucinous Ovarian Tumors Reveals Multiple Overlapping RAS-Pathway Activating Mutations in Borderline and Cancerous Neoplasms. BMC Cancer 2015, 15, 415. [Google Scholar] [CrossRef]
  22. Takahashi, M.; Nakamura, K.; Chiyoda, T.; Okada, C.; Nohara, S.; Takamatsu, R.; Yanazume, S.; Kobayashi, H.; Nishihara, H.; Yamagami, W. Transcriptome Concordance Between Borderline Tumors and Endometrioid Carcinoma: An Integrative Genomic Analysis. Cancer Med. 2025, 14, e70601. [Google Scholar] [CrossRef]
  23. Anglesio, M.S.; Kommoss, S.; Tolcher, M.C.; Clarke, B.; Galletta, L.; Porter, H.; Damaraju, S.; Fereday, S.; Winterhoff, B.J.; Kalloger, S.E.; et al. Molecular Characterization of Mucinous Ovarian Tumours Supports a Stratified Treatment Approach with HER2 Targeting in 19% of Carcinomas. J. Pathol. 2013, 229, 111–120. [Google Scholar] [CrossRef] [PubMed]
  24. Therachiyil, L.; Anand, A.; Azmi, A.; Bhat, A.; Korashy, H.M.; Uddin, S. Role of RAS Signaling in Ovarian Cancer. F1000Res 2022, 11, 1253. [Google Scholar] [CrossRef]
  25. Lee, Y.-J.; Lee, M.-Y.; Ruan, A.; Chen, C.-K.; Liu, H.-P.; Wang, C.-J.; Chao, W.-R.; Han, C.-P. Multipoint Kras Oncogene Mutations Potentially Indicate Mucinous Carcinoma on the Entire Spectrum of Mucinous Ovarian Neoplasms. Oncotarget 2016, 7, 82097–82103. [Google Scholar] [CrossRef] [PubMed]
  26. Sonkin, D.; Thomas, A.; Teicher, B.A. Cancer Treatments: Past, Present, and Future. Cancer Genet. 2024, 286–287, 18–24. [Google Scholar] [CrossRef]
  27. Hossain, M.M.; Nakayama, K.; Shanta, K.; Razia, S.; Ishikawa, M.; Ishibashi, T.; Yamashita, H.; Sato, S.; Iida, K.; Kanno, K.; et al. Establishment of a Novel In Vitro Model of Endometriosis with Oncogenic KRAS and PIK3CA Mutations for Understanding the Underlying Biology and Molecular Pathogenesis. Cancers 2021, 13, 3174. [Google Scholar] [CrossRef] [PubMed]
  28. Sohel, H.I.; Kiyono, T.; Zahan, U.F.; Razia, S.; Ishikawa, M.; Yamashita, H.; Kanno, K.; Sonia, S.B.; Nakayama, K.; Kyo, S. Establishment of a Novel In Vitro and In Vivo Model to Understand Molecular Carcinogenesis of Endometriosis-Related Ovarian Neoplasms. Int. J. Mol. Sci. 2025, 26, 1995. [Google Scholar] [CrossRef]
  29. Bono, Y.; Kyo, S.; Takakura, M.; Maida, Y.; Mizumoto, Y.; Nakamura, M.; Nomura, K.; Kiyono, T.; Inoue, M. Creation of Immortalised Epithelial Cells from Ovarian Endometrioma. Br. J. Cancer 2012, 106, 1205–1213. [Google Scholar] [CrossRef]
  30. Wölfel, T.; Hauer, M.; Schneider, J.; Serrano, M.; Wölfel, C.; Klehmann-Hieb, E.; De Plaen, E.; Hankeln, T.; Büschenfelde, K.-H.M.Z.; Beach, D. A p16INK4a-Insensitive CDK4 Mutant Targeted by Cytolytic T Lymphocytes in a Human Melanoma. Science 1995, 269, 1281–1284. [Google Scholar] [CrossRef]
  31. Kajiwara, K.; Tanemoto, T.; Wada, S.; Karibe, J.; Ihara, N.; Ikemoto, Y.; Kawasaki, T.; Oishi, Y.; Samura, O.; Okamura, K.; et al. Fetal Therapy Model of Myelomeningocele with Three-Dimensional Skin Using Amniotic Fluid Cell-Derived Induced Pluripotent Stem Cells. Stem Cell Rep. 2017, 8, 1701–1713. [Google Scholar] [CrossRef]
  32. Nakayama, K.; Miyazaki, K.; Kanzaki, A.; Fukumoto, M.; Takebayashi, Y. Expression and Cisplatin Sensitivity of Copper-Transporting P-Type Adenosine Triphosphatase (ATP7B) in Human Solid Carcinoma Cell Lines. Oncol. Rep. 2001, 8, 1285–1287. [Google Scholar] [CrossRef]
  33. Shiomi, K.; Kiyono, T.; Okamura, K.; Uezumi, M.; Goto, Y.; Yasumoto, S.; Shimizu, S.; Hashimoto, N. CDK4 and Cyclin D1 Allow Human Myogenic Cells to Recapture Growth Property without Compromising Differentiation Potential. Gene Ther. 2011, 18, 857–866. [Google Scholar] [CrossRef]
  34. Karst, A.M.; Drapkin, R. Primary Culture and Immortalization of Human Fallopian Tube Secretory Epithelial Cells. Nat. Protoc. 2012, 7, 1755–1764. [Google Scholar] [CrossRef]
  35. Maeda, T.; Tashiro, H.; Katabuchi, H.; Begum, M.; Ohtake, H.; Kiyono, T.; Okamura, H. Establishment of an Immortalised Human Ovarian Surface Epithelial Cell Line without Chromosomal Instability. Br. J. Cancer 2005, 93, 116–123. [Google Scholar] [CrossRef] [PubMed]
  36. Narayanan, B.; Buddenkote, T.; Smith, H.; Shah, M.; Freeman, S.; Hulse, D.; Funingana, G.; Alcaraz, M.-L.; Ortuzar, M.-C.; Brenton, J.; et al. Growth Kinetics of High-Grade Serous Ovarian Cancer Using Longitudinal Clinical Data—Implications for Early Detection. medRxiv 2024. [Google Scholar] [CrossRef]
  37. Chiang, Y.-C.; Cheng, W.-F.; Chang, M.-C.; Lu, T.-P.; Kuo, K.-T.; Lin, H.-P.; Hsieh, C.-Y.; Chen, C.-A. Establishment of a New Ovarian Cancer Cell Line CA5171. Reprod. Sci. 2015, 22, 725–734. [Google Scholar] [CrossRef]
  38. Wagner, P.L.; Stiedl, A.-C.; Wilbertz, T.; Petersen, K.; Scheble, V.; Menon, R.; Reischl, M.; Mikut, R.; Rubin, M.A.; Fend, F.; et al. Frequency and Clinicopathologic Correlates of KRAS Amplification in Non-Small Cell Lung Carcinoma. Lung Cancer 2011, 74, 118–123. [Google Scholar] [CrossRef]
  39. Rehkaemper, J.; Korenkov, M.; Quaas, A.; Rueschoff, J.; Pamuk, A.; Zander, T.; Hillmer, A.M.; Buettner, R.; Hoelscher, A.H.; Bruns, C.J.; et al. Amplification of KRAS and Its Heterogeneity in Non-Asian Gastric Adenocarcinomas. BMC Cancer 2020, 20, 587. [Google Scholar] [CrossRef] [PubMed]
  40. Birkeland, E.; Wik, E.; Mjøs, S.; Hoivik, E.A.; Trovik, J.; Werner, H.M.J.; Kusonmano, K.; Petersen, K.; Raeder, M.B.; Holst, F.; et al. KRAS Gene Amplification and Overexpression but Not Mutation Associates with Aggressive and Metastatic Endometrial Cancer. Br. J. Cancer 2012, 107, 1997–2004. [Google Scholar] [CrossRef]
  41. Balikani, L.; Policarpio-Nicolas, M.L.C. Undifferentiated Component of Dedifferentiated Endometrial Carcinoma Presenting as a “Small Round Cell” Malignancy in a Mediastinal Lymph Node, Mimicking Small Cell Carcinoma. Diagn. Cytopathol. 2023, 51, 519–524. [Google Scholar] [CrossRef]
  42. Tessier-Cloutier, B.; Kommoss, F.K.F.; Kolin, D.L.; Němejcová, K.; Smith, D.; Pors, J.; Stewart, C.J.R.; McCluggage, W.G.; Foulkes, W.D.; von Deimling, A.; et al. Dedifferentiated and Undifferentiated Ovarian Carcinoma: An Aggressive and Molecularly Distinct Ovarian Tumor Characterized by Frequent SWI/SNF Complex Inactivation. Mod. Pathol. 2024, 37, 100374. [Google Scholar] [CrossRef]
  43. Xu, Z.; Saikia, K.; Yuan, L. Dedifferentiated Endometrial Carcinoma Arising from Serous Carcinoma: Diagnostic Challenges and Recommendations. Gynecol. Oncol. Rep. 2023, 47, 101188. [Google Scholar] [CrossRef] [PubMed]
  44. Kim, S.; Bae, H.; Kim, H.-S. Dedifferentiated Leiomyosarcoma of the Uterine Corpus with Heterologous Component: Clinicopathological Analysis of Five Consecutive Cases from a Single Institution and Comprehensive Literature Review. Diagnostics 2024, 14, 160. [Google Scholar] [CrossRef]
  45. Makhdoum, S.; Quddus, M.R.; Lomme, M.M.; Hansen, K.; Lawrence, W.D. Dedifferentiated Endometrial Adenocarcinoma with Neuroendocrine Differentiation and Ballooning-Cell Features: Report of a Rare Entity with an Unusual Histology. Human. Pathol. Case Rep. 2019, 15, 92–94. [Google Scholar] [CrossRef]
  46. Travaglino, A.; Raffone, A.; Gencarelli, A.; Saracinelli, S.; Riccardi, C.; Mollo, A.; Zullo, F.; Insabato, L. Clinico-Pathological Features Associated with Mismatch Repair Deficiency in Endometrial Undifferentiated/Dedifferentiated Carcinoma: A Systematic Review and Meta-Analysis. Gynecol. Oncol. 2021, 160, 579–585. [Google Scholar] [CrossRef] [PubMed]
  47. Tafe, L.J.; Garg, K.; Chew, I.; Tornos, C.; Soslow, R.A. Endometrial and Ovarian Carcinomas with Undifferentiated Components: Clinically Aggressive and Frequently Underrecognized Neoplasms. Mod. Pathol. 2010, 23, 781–789. [Google Scholar] [CrossRef]
  48. Ono, R.; Nakayama, K.; Nakamura, K.; Yamashita, H.; Ishibashi, T.; Ishikawa, M.; Minamoto, T.; Razia, S.; Ishikawa, N.; Otsuki, Y.; et al. Dedifferentiated Endometrial Carcinoma Could Be A Target for Immune Checkpoint Inhibitors (Anti PD-1/PD-L1 Antibodies). Int. J. Mol. Sci. 2019, 20, 3744. [Google Scholar] [CrossRef]
  49. Laban, M.; Chen, X.; Guo, B. Seromucinous and Mucinous Borderline Ovarian Tumors: We Need to Know More. Reprod. Sci. 2023, 30, 1684–1685. [Google Scholar] [CrossRef]
  50. Shylasree, T.S.; Mahajan, D.; Chaturvedi, A.; Menon, S.; Gupta, S.; Thakur, M.; Poddar, P.; Maheshwari, A. Clinicopathological and Oncological Outcomes of Borderline Mucinous Tumours of Ovary: A Large Case Series. Indian. J. Surg. Oncol. 2024, 15, 88–94. [Google Scholar] [CrossRef]
  51. Sharma, S.V.; Haber, D.A.; Settleman, J. Cell Line-Based Platforms to Evaluate the Therapeutic Efficacy of Candidate Anticancer Agents. Nat. Rev. Cancer 2010, 10, 241–253. [Google Scholar] [CrossRef]
  52. He, J.; Zhang, C.; Ozkan, A.; Feng, T.; Duan, P.; Wang, S.; Yang, X.; Xie, J.; Liu, X. Patient-Derived Tumor Models and Their Distinctive Applications in Personalized Drug Therapy. Mechanobiol. Med. 2023, 1, 100014. [Google Scholar] [CrossRef]
  53. Lakshmi Haridas, K.; Menon, A.; Deepthi, B. Borderline Ovarian Mucinous Tumor with Anaplastic Carcinomatous Mural Nodule: A Case Report. Gynecol. Oncol. Rep. 2021, 37, 100809. [Google Scholar] [CrossRef]
  54. Dundr, P.; Singh, N.; Nožičková, B.; Němejcová, K.; Bártů, M.; Stružinská, I. Primary Mucinous Ovarian Tumors vs. Ovarian Metastases from Gastrointestinal Tract, Pancreas and Biliary Tree: A Review of Current Problematics. Diagn. Pathol. 2021, 16, 20. [Google Scholar] [CrossRef] [PubMed]
  55. Hou, R.; Jiang, L.; Liu, D.; Lin, B.; Hu, Z.; Gao, J.; Zhang, D.; Zhang, S.; Iwamori, M. Lewis(y) Antigen Promotes the Progression of Epithelial Ovarian Cancer by Stimulating MUC1 Expression. Int. J. Mol. Med. 2017, 40, 293–302. [Google Scholar] [CrossRef]
  56. Lan, Y.; Ni, W.; Tai, G. Expression of MUC1 in Different Tumours and Its Clinical Significance (Review). Mol. Clin. Oncol. 2022, 17, 161. [Google Scholar] [CrossRef]
  57. Liu, H.; Li, Y.; Karsidag, M.; Tu, T.; Wang, P. Technical and Biological Biases in Bulk Transcriptomic Data Mining for Cancer Research. J. Cancer 2025, 16, 34–43. [Google Scholar] [CrossRef] [PubMed]
  58. Wu, C.H.; Mao, T.-L.; Vang, R.; Ayhan, A.; Wang, T.-L.; Kurman, R.J.; Shih, I.-M. Endocervical-Type Mucinous Borderline Tumors Are Related to Endometrioid Tumors Based on Mutation and Loss of Expression of ARID1A. Int. J. Gynecol. Pathol. 2012, 31, 297–303. [Google Scholar] [CrossRef] [PubMed]
  59. Fontana, B.; Gallerani, G.; Salamon, I.; Pace, I.; Roncarati, R.; Ferracin, M. ARID1A in Cancer: Friend or Foe? Front. Oncol. 2023, 13, 1136248. [Google Scholar] [CrossRef]
  60. Shi, Y.; Zheng, H.; Wang, T.; Zhou, S.; Zhao, S.; Li, M.; Cao, B. Targeting KRAS: From Metabolic Regulation to Cancer Treatment. Mol. Cancer 2025, 24, 9. [Google Scholar] [CrossRef]
  61. Krasinskas, A.M.; Moser, A.J.; Saka, B.; Adsay, N.V.; Chiosea, S.I. KRAS Mutant Allele-Specific Imbalance Is Associated with Worse Prognosis in Pancreatic Cancer and Progression to Undifferentiated Carcinoma of the Pancreas. Mod. Pathol. 2013, 26, 1346–1354. [Google Scholar] [CrossRef]
  62. Kandoth, C.; McLellan, M.D.; Vandin, F.; Ye, K.; Niu, B.; Lu, C.; Xie, M.; Zhang, Q.; McMichael, J.F.; Wyczalkowski, M.A.; et al. Mutational Landscape and Significance across 12 Major Cancer Types. Nature 2013, 502, 333–339. [Google Scholar] [CrossRef]
  63. Campbell, J.D.; Alexandrov, A.; Kim, J.; Wala, J.; Berger, A.H.; Pedamallu, C.S.; Shukla, S.A.; Guo, G.; Brooks, A.N.; Murray, B.A.; et al. Distinct Patterns of Somatic Genome Alterations in Lung Adenocarcinomas and Squamous Cell Carcinomas. Nat. Genet. 2016, 48, 607–616. [Google Scholar] [CrossRef] [PubMed]
  64. Grasso, C.S.; Wu, Y.-M.; Robinson, D.R.; Cao, X.; Dhanasekaran, S.M.; Khan, A.P.; Quist, M.J.; Jing, X.; Lonigro, R.J.; Brenner, J.C.; et al. The Mutational Landscape of Lethal Castration-Resistant Prostate Cancer. Nature 2012, 487, 239–243. [Google Scholar] [CrossRef]
  65. Northcott, P.A.; Shih, D.J.H.; Peacock, J.; Garzia, L.; Sorana Morrissy, A.; Zichner, T.; Stütz, A.M.; Korshunov, A.; Reimand, J.; Schumacher, S.E.; et al. Subgroup-Specific Structural Variation across 1000 Medulloblastoma Genomes. Nature 2012, 488, 49–56. [Google Scholar] [CrossRef]
  66. Parsons, D.W.; Li, M.; Zhang, X.; Jones, S.; Leary, R.J.; Lin, J.C.-H.; Boca, S.M.; Carter, H.; Samayoa, J.; Bettegowda, C.; et al. The Genetic Landscape of the Childhood Cancer Medulloblastoma. Science 2011, 331, 435–439. [Google Scholar] [CrossRef] [PubMed]
  67. Pugh, T.J.; Weeraratne, S.D.; Archer, T.C.; Pomeranz Krummel, D.A.; Auclair, D.; Bochicchio, J.; Carneiro, M.O.; Carter, S.L.; Cibulskis, K.; Erlich, R.L.; et al. Medulloblastoma Exome Sequencing Uncovers Subtype-Specific Somatic Mutations. Nature 2012, 488, 106–110. [Google Scholar] [CrossRef]
  68. Jones, D.T.W.; Jäger, N.; Kool, M.; Zichner, T.; Hutter, B.; Sultan, M.; Cho, Y.-J.; Pugh, T.J.; Hovestadt, V.; Stütz, A.M.; et al. Dissecting the Genomic Complexity Underlying Medulloblastoma. Nature 2012, 488, 100–105. [Google Scholar] [CrossRef]
  69. Robinson, G.; Parker, M.; Kranenburg, T.A.; Lu, C.; Chen, X.; Ding, L.; Phoenix, T.N.; Hedlund, E.; Wei, L.; Zhu, X.; et al. Novel Mutations Target Distinct Subgroups of Medulloblastoma. Nature 2012, 488, 43–48. [Google Scholar] [CrossRef] [PubMed]
  70. Morin, R.D.; Mendez-Lago, M.; Mungall, A.J.; Goya, R.; Mungall, K.L.; Corbett, R.D.; Johnson, N.A.; Severson, T.M.; Chiu, R.; Field, M.; et al. Frequent Mutation of Histone-Modifying Genes in Non-Hodgkin Lymphoma. Nature 2011, 476, 298–303. [Google Scholar] [CrossRef]
  71. Dalgliesh, G.L.; Furge, K.; Greenman, C.; Chen, L.; Bignell, G.; Butler, A.; Davies, H.; Edkins, S.; Hardy, C.; Latimer, C.; et al. Systematic Sequencing of Renal Carcinoma Reveals Inactivation of Histone Modifying Genes. Nature 2010, 463, 360–363. [Google Scholar] [CrossRef]
  72. Gui, Y.; Guo, G.; Huang, Y.; Hu, X.; Tang, A.; Gao, S.; Wu, R.; Chen, C.; Li, X.; Zhou, L.; et al. Frequent Mutations of Chromatin Remodeling Genes in Transitional Cell Carcinoma of the Bladder. Nat. Genet. 2011, 43, 875–878. [Google Scholar] [CrossRef]
  73. Hillman, R.T.; Celestino, J.; Terranova, C.; Beird, H.C.; Gumbs, C.; Little, L.; Nguyen, T.; Thornton, R.; Tippen, S.; Zhang, J.; et al. KMT2D/MLL2 Inactivation Is Associated with Recurrence in Adult-Type Granulosa Cell Tumors of the Ovary. Nat. Commun. 2018, 9, 2496. [Google Scholar] [CrossRef] [PubMed]
  74. Bailey, P.; Chang, D.K.; Nones, K.; Johns, A.L.; Patch, A.-M.; Gingras, M.-C.; Miller, D.K.; Christ, A.N.; Bruxner, T.J.C.; Quinn, M.C.; et al. Genomic Analyses Identify Molecular Subtypes of Pancreatic Cancer. Nature 2016, 531, 47–52. [Google Scholar] [CrossRef]
  75. The Cancer Genome Atlas Research Network; Kim, J.; Bowlby, R.; Mungall, A.J.; Robertson, A.G.; Odze, R.D.; Cherniack, A.D.; Shih, J.; Pedamallu, C.S.; Cibulskis, C.; et al. Integrated Genomic Characterization of Oesophageal Carcinoma. Nature 2017, 541, 169–175. [Google Scholar] [CrossRef]
  76. The Cancer Genome Atlas Research Network; Bass, A.J.; Thorsson, V.; Shmulevich, I.; Reynolds, S.M.; Miller, M.; Bernard, B.; Hinoue, T.; Laird, P.W.; Curtis, C.; et al. Comprehensive Molecular Characterization of Gastric Adenocarcinoma. Nature 2014, 513, 202–209. [Google Scholar] [CrossRef]
  77. Lee, Y.; Moon, S.; Seok, J.Y.; Lee, J.-H.; Nam, S.; Chung, Y.S. Characterization of the Genomic Alterations in Poorly Differentiated Thyroid Cancer. Sci. Rep. 2023, 13, 19154. [Google Scholar] [CrossRef]
  78. Linehan, A.; O’Reilly, M.; McDermott, R.; O’Kane, G.M. Targeting KRAS Mutations in Pancreatic Cancer: Opportunities for Future Strategies. Front Med. 2024, 11, 1369136. [Google Scholar] [CrossRef] [PubMed]
  79. Shahrouzi, P.; Forouz, F.; Mathelier, A.; Kristensen, V.N.; Duijf, P.H.G. Copy Number Alterations: A Catastrophic Orchestration of the Breast Cancer Genome. Trends Mol. Med. 2024, 30, 750–764. [Google Scholar] [CrossRef]
  80. Grist, E.; Friedrich, S.; Brawley, C.; Mendes, L.; Parry, M.; Ali, A.; Haran, A.; Hoyle, A.; Gilson, C.; Lall, S.; et al. Accumulation of Copy Number Alterations and Clinical Progression across Advanced Prostate Cancer. Genome Med. 2022, 14, 102. [Google Scholar] [CrossRef]
  81. Bassaganyas, L.; Pinyol, R.; Esteban-Fabró, R.; Torrens, L.; Torrecilla, S.; Willoughby, C.E.; Franch-Expósito, S.; Vila-Casadesús, M.; Salaverria, I.; Montal, R.; et al. Copy Number Alteration Burden Differentially Impacts Immune Profiles and Molecular Features of Hepatocellular Carcinoma. Clin. Cancer Res. 2020, 26, 6350–6361. [Google Scholar] [CrossRef]
  82. Perren, T.J. Mucinous Epithelial Ovarian Carcinoma. Ann. Oncol. 2016, 27 (Suppl. S1), i53–i57. [Google Scholar] [CrossRef]
  83. Prat, J. Pathology of Borderline and Invasive Cancers. Best. Pract. Res. Clin. Obstet. Gynaecol. 2017, 41, 15–30. [Google Scholar] [CrossRef]
  84. Cuatrecasas, M.; Villanueva, A.; Matias-Guiu, X.; Prat, J. K-Ras Mutations in Mucinous Ovarian Tumors: A Clinicopathologic and Molecular Study of 95 Cases. Cancer 1997, 79, 1581–1586. [Google Scholar] [CrossRef]
  85. Enomoto, T.; Weghorst, C.M.; Inoue, M.; Tanizawa, O.; Rice, J.M. K-Ras Activation Occurs Frequently in Mucinous Adenocarcinomas and Rarely in Other Common Epithelial Tumors of the Human Ovary. Am. J. Pathol. 1991, 139, 777–785. [Google Scholar]
  86. Xue, W.; Wu, K.; Guo, X.; Chen, C.; Huang, T.; Li, L.; Liu, B.; Chang, H.; Zhao, J. The Pan-Cancer Landscape of Glutamate and Glutamine Metabolism: A Comprehensive Bioinformatic Analysis across 32 Solid Cancer Types. Biochim. Biophys. Acta Mol. Basis Dis. 2024, 1870, 166982. [Google Scholar] [CrossRef] [PubMed]
  87. Jahangiri, L. Updates on Liquid Biopsies in Neuroblastoma for Treatment Response, Relapse and Recurrence Assessment. Cancer Genet. 2024, 288–289, 32–39. [Google Scholar] [CrossRef]
  88. Ohyama, H.; Hirotsu, Y.; Amemiya, K.; Mikata, R.; Amano, H.; Hirose, S.; Oyama, T.; Iimuro, Y.; Kojima, Y.; Mochizuki, H.; et al. Development of a Molecular Barcode Detection System for Pancreaticobiliary Malignancies and Comparison with Next-Generation Sequencing. Cancer Genet. 2024, 280–281, 6–12. [Google Scholar] [CrossRef] [PubMed]
  89. Gonzalez, T.; Nie, Q.; Chaudhary, L.N.; Basel, D.; Reddi, H.V. Methylation Signatures as Biomarkers for Non-Invasive Early Detection of Breast Cancer: A Systematic Review of the Literature. Cancer Genet. 2024, 282–283, 1–8. [Google Scholar] [CrossRef]
  90. He, S.; Xiao, X.; Lei, R.; Chen, J.; Huang, H.; Yilihamu, A.; Guo, M.; Tan, C.; Li, X.; Zhuang, Z.; et al. Establishment of Breast Phyllodes Tumor Cell Lines Preserving the Features of Phyllodes Tumors. BIO Integr. 2023, 4, 7. [Google Scholar] [CrossRef]
Figure 1. Histopathologic and morphologic features of the ovarian tumor. (A,B) Preoperative MR imaging of the original right ovarian tumor. The red arrow indicates thickened septa within the tumor. (C) Histological view of the HE-stained paraffin section of the ovarian tumor, representing a mucinous borderline tumor, exhibiting signs of mild atypia, such as an increased nucleus-to-cytoplasm ratio and prominent nucleoli, but lacking apparent interstitial invasion.
Cancers 17 01716 g001
Figure 2. Primary culture from the mucinous ovarian tumor and the process of immortalization.
Cancers 17 01716 g002
Figure 3. Mouse tumorigenicity to confirm histological reproduction of the original tumor.
Cancers 17 01716 g003
Figure 4. Copy number alterations of the original tumor and HMucBOT-2 cells. Copy number alterations (CNAs) and variant allele frequencies (VAFs) in the original ovarian tumor sample (A) and HMucBOT-2 cells (B). The significant chromosomal copy number alterations were identified in HMucBOT-2 cells at Chr 12 (shown as ✻✻), displaying a threefold gain in KRAS, KMT2D, CLIP1, and CDK4, and at Chr 5 (shown as ✻), with a threefold gain in TERT. CN, copy number.
Cancers 17 01716 g004
Figure 5. Growth properties of HMucBOT-1 and HMucBOT-2 cells. (A) MTT assay: The number of proliferating cells is shown for each cell type at a different time period. (B) Soft agar colony formation assay: Photographs of representative colonies (≥50 µm) after 14 days of seeding obtained through transmitted light microscopy. (C) Invasion assay: The number of invading cells is shown in each cell type at 24, 48, and 72 h. * p < 0.05. (D) Wound-healing assay: The number of migrating cells is shown in each cell type at different times. * p < 0.05. The error bar indicates the standard deviation (Student’s t-test was used; NS p > 0.05, * p < 0.05; replicates: n  =  3).
Cancers 17 01716 g005aCancers 17 01716 g005b
Figure 6. Immunohistochemical analysis of xenograft tumors of HMucBOT-1 and HMucBOT-2 cells. (A) Both tumors of HMucBOT-1 and HMucBOT-2 cells showed positive expression of CK7, PAX8, and MUC1. The blank arrows highlight areas of mucinous carcinoma, and the black arrows indicate regions of undifferentiated carcinoma. (B) Tumors of HMucBOT-2 cells showed expression of AE1/AE3, CAM5.2, and EMA in mucinous carcinoma lesions but not Desmin or S-100, with them exhibiting typical patterns of dedifferentiated carcinoma. (C) Tumors of HMucBOT-2 cells showed expression of Snail and Vimentin but not Twist in undifferentiated lesions. Mismatch repair proteins (MLH1, MLH6, MSH6, and PMS2) were all expressed in the tumor, in both mucinous carcinoma and undifferentiated lesions.
Cancers 17 01716 g006aCancers 17 01716 g006b
Figure 7. Chemosensitivity assay. (A) Cells were treated with paclitaxel (1, 10, 20, or 30 nmol/L) for 24, 48, or 72 h, together with a control (drug carrier). The IC50 value after 72 h of treatment was 11.66 nmol/L for HMucBOT-1 and 12.53 nmol/L for HMucBOT-2. (B) Cells were treated with cisplatin (5, 15, 45, or 135 µmol/L) for 24, 48, or 72 h, together with a control (drug carrier). The IC50 value after 72 h of treatment was 26.58 µmol/L for HMucBOT-1 and 28.55 µmol/L for HMucBOT-2.
Cancers 17 01716 g007
Table 1. Tumor formation assay using HMucBOT-1 and HMucBOT-2 cell lines.
Cell Line NameResults (Tumor Formation in SCID Mice)Remarks
HMucBOT-15/5Mucinous borderline tumor
HMucBOT-25/5Dedifferentiated carcinoma
Table 2. Whole-exome sequencing analysis report of MBOT.
Gene TypeGeneMutation (VAF%)Plession ScoreCos.CV.CNAeCN
HRDARID1Ap.N106 * (21.6)2 Neutral2.5
HRDARID1Ap.L2270Ifs * 8 (23.0)2 Neutral2.5
OGKRASp.G12V (22.3)310,787PNeutral2.8
TSGCDKN2AWild type3 HD0.1
TSGARID1Bp.W1937 * (19.3)2 PNeutral2.1
TSGNF1p.K354N (31.1)2 PNeutral1.8
Other GAAp.S332L (12.1)0.5 Neutral……
MBOT, mucinous borderline ovarian tumor; HRD, homologous recombination deficiency; OG, oncogene; TSG, tumor suppressor gene; HD, homozygous deletion; P, pathogenic; VAF, variant allele frequency; Cos, cosmic; CV, ClinVar; CNA, copy number alteration; eCN, estimated copy number; *, indicating stop codon number.
Table 3. Whole-exome sequencing analysis report of HMucBOT-2.
Gene TypeGeneMutation (VAF%)Plession ScoreCos.CV.CNAeCN
HRDARID1Ap.N106 * (32.2)20 Neutral2.1
HRDARID1Ap.L2270Ifs * 8 (41.7)20 Neutral2.1
HRDBRIP1p.D153H (5.0)10 Neutral2.0
OGKRASp.G12V (31.6)310,787PAmp3.1
OGACSL3p.L186F (51.5)1.52 Neutral2
OGSUZ12p.V68A (6.2)10 Neutral2
OGTERTp.I587V (32.3)10 Amp3.3
OGGRM3p.R716M (6.9)10 Neutral2
OGEWSR1p.R511L (8.3)10 Neutral2
OGHMGA1p.K46R (5.9)10 Neutral2
OGIRF4p.A16T (54.0)10 Neutral2
OGGNASp.S340A (50.1)10 Neutral2
OGEZH2p.C329S (6.6)10 Neutral2
OGBIRC6p.N2640K (5.4)0.50 Neutral2
OGMPLp.S162T (5.8)0.50 Neutral2.1
OGCLIP1p.K1156I (6.6)0.50 Amp3.1
OGPTK6p.G10V (6.7)0.50 Neutral2
OGSPECC1p.K950R (5.1)0.50 Neutral2
OGCCND1c.415-2A>T (22.6)0.51 Neutral2
OGPDE4DIPp.E1577G (6.7)0.50 Neutral2.1
OGCDK4c.633-1G>A (21.7)0.50 Amp3.1
OGCDK4c.219-2A>C (27.1)0.50 Amp3.1
OGCCND1c.414+1G>C (10.2)00 Neutral2
OGCCND1c.574+1G>A (8.6)00 Neutral2
OGCCND1c.724-1G>A (8.2)00 Neutral2
OGCDK4c.820-2A>T (9.6)00 Amp3.1
OGCDK4c.819+2T>A (10.7)00 Amp3.1
OGCDK4c.684-1G>A (6.4)00 Amp3.1
OGCDK4c.683+1G>C (8.9)01 Amp3.1
OGCDK4c.632+2T>C (13.9)00 Amp3.1
OGCDK4c.218+2T>C (10.4)00 Amp3.1
TSGARID1Bp.W1937(41.3)20PNeutral2
TSGNF1p.K354N (44.2)20PNeutral2
TSGARID1Bp.E1340(5.4)1.50 Neutral2
TSGATP2B3c.2626-2A>G (5.2)1.50 Neutral1.7
TSGARHGEF12p.Q1266L (6.5)10 Neutral2
TSGRAD21p.I17F (5.0)11 Neutral1.9
TSGPTPN13p.G2262V (5.8)10 Neutral1.9
TSGTPM3p.K6M (5.1)10 Neutral2.1
TSGZFHX3p.M1294V (5.9)10 Neutral2
TSGSPENp.Y2819N (6.5)10 Neutral2.1
TSGUBR5p.P2036H (6.1)10 Neutral1.9
TSGUBR5p.C2034G (5.0)10 Neutral1.9
TSGKMT2Dp.A963T (5.5)0.50 Amp3.1
TSGCDKN2AWild type3 HD−0.7
OtherAPOBp.E1601K (43.5)10 -
OtherGAAp.S332L (44.3)10 -
OtherPOLQp.L2352F (5.7)0.50 Neutral2
OtherPRKCBp.R415S (6.0)0.50 Neutral2
OtherNBEAc.6585+2958G>C (6.4)0.50 Neutral1.9
OtherTTNp.T25595P (5.0)0.50 -
OtherTTNp.V21151L (5.0)0.50 -
OtherCTNND1p.P88T (5.2)0.50 Neutral2
OtherPCBP1p.N48H (6.1)0.50 Neutral2
OtherTMEM43p.G237E (6.9)0.50 -
OtherAFDNp.S1469R (6.2)0.50 -
OtherTTNp.I21153F (5.2)0.50 -
OtherTTNc.11311+3989T>G (5.3)0.50 -
HRD, homologous recombination deficiency; OG, oncogene; TSG, tumor suppressor gene; HD, homozygous deletion; P, pathogenic; Amp, amplification; VAF, variant allele frequency; Cos, cosmic; CV, ClinVar; CNA, copy number alteration; eCN, estimated copy number; *, indicating stop codon number.
Disclaimer/Publisher’s Note: The statements, opinions and data contained in all publications are solely those of the individual author(s) and contributor(s) and not of MDPI and/or the editor(s). MDPI and/or the editor(s) disclaim responsibility for any injury to people or property resulting from any ideas, methods, instructions or products referred to in the content.

