
The Association Between Heatmap Position and the Diagnostic Accuracy of Artificial Intelligence for Colorectal Polyp Diagnosis
 , , , , , ,
  ,
,  and
and
Simple Summary
Abstract
1. Introduction
2. Materials and Methods
2.1. Data Collection and Preprocessing
2.2. Network Architectures
2.3. Statistical Analysis
3. Results
3.1. Patients and Colorectal Polyps
3.2. Diagnostic Performance of the Artificial Intelligence Algorithms
3.3. Factors Associated with a Correct Algorithm Diagnosis
4. Discussion
5. Conclusions
Author Contributions
Funding
Institutional Review Board Statement
Informed Consent Statement
Data Availability Statement
Acknowledgments
Conflicts of Interest
Abbreviations
| AI | Artificial intelligence |
| BLI | Blue light imaging |
| CADe | Computer-aided detection |
| CADx | Computer-aided diagnosis |
| GEE | Generalized estimating equations |
| Grad-CAM | Gradient-weighted class activation mapping |
| CI | Confidence interval |
| HDWL | High-definition white light |
| LCI | Linked color imaging |
| NBI | Narrow-band imaging |
| NPV | Negative predictive value |
| OR | Odds ratio |
| PPV | Positive predictive value |
Appendix A

| Patient Characteristics | N = 195 |
|---|---|
| Gender, n (%) | |
| Male | 130 (66.7) |
| Female | 66 (33.3) |
| Age, mean (SD) | 65.8 (7.1) |
| Number of polyps per patient, n (%) | |
| 1 | 97 (49.7) |
| 2 | 47 (24.1) |
| 3 | 28 (14.4) |
| 4 | 15 (7.7) |
| 5 | 7 (3.6) |
| 6 | 1 (0.5) |
References
- Hassan, C.; Balsamo, G.; Lorenzetti, R.; Zullo, A.; Antonelli, G. Artificial Intelligence Allows Leaving-In-Situ Colorectal Polyps. Clin. Gastroenterol. Hepatol. 2022, 20, 2505–2513.e2504. [Google Scholar] [CrossRef] [PubMed]
- Kader, R.; Cid-Mejias, A.; Brandao, P.; Islam, S.; Hebbar, S.; Puyal, J.G.; Ahmad, O.F.; Hussein, M.; Toth, D.; Mountney, P.; et al. Polyp characterization using deep learning and a publicly accessible polyp video database. Dig. Endosc. 2023, 35, 645–655. [Google Scholar] [CrossRef]
- Houwen, B.; Hassan, C.; Coupe, V.M.H.; Greuter, M.J.E.; Hazewinkel, Y.; Vleugels, J.L.A.; Antonelli, G.; Bustamante-Balen, M.; Coron, E.; Cortas, G.A.; et al. Definition of competence standards for optical diagnosis of diminutive colorectal polyps: European Society of Gastrointestinal Endoscopy (ESGE) Position Statement. Endoscopy 2022, 54, 88–99. [Google Scholar] [CrossRef]
- Rex, D.K.; Kahi, C.; O’Brien, M.; Levin, T.R.; Pohl, H.; Rastogi, A.; Burgart, L.; Imperiale, T.; Ladabaum, U.; Cohen, J.; et al. The American Society for Gastrointestinal Endoscopy PIVI (Preservation and Incorporation of Valuable Endoscopic Innovations) on real-time endoscopic assessment of the histology of diminutive colorectal polyps. Gastrointest. Endosc. 2011, 73, 419–422. [Google Scholar] [CrossRef] [PubMed]
- Schulz, P.J.; Lwin, M.O.; Kee, K.M.; Goh, W.W.B.; Lam, T.Y.T.; Sung, J.J.Y. Modeling the influence of attitudes, trust, and beliefs on endoscopists’ acceptance of artificial intelligence applications in medical practice. Front. Public. Health 2023, 11, 1301563. [Google Scholar] [CrossRef]
- Poon, A.I.F.; Sung, J.J.Y. Opening the black box of AI-Medicine. J. Gastroenterol. Hepatol. 2021, 36, 581–584. [Google Scholar] [CrossRef] [PubMed]
- Mori, Y.; Jin, E.H.; Lee, D. Enhancing artificial intelligence-doctor collaboration for computer-aided diagnosis in colonoscopy through improved digital literacy. Dig. Liver Dis. 2024, 56, 1140–1143. [Google Scholar] [CrossRef]
- Parasa, S.; Berzin, T.; Leggett, C.; Gross, S.; Repici, A.; Ahmad, O.F.; Chiang, A.; Coelho-Prabhu, N.; Cohen, J.; Dekker, E. Consensus statements on the current landscape of artificial intelligence applications in endoscopy, addressing roadblocks, and advancing artificial intelligence in gastroenterology. Gastrointest. Endosc. 2024, 101, 2–9. [Google Scholar] [CrossRef]
- Reverberi, C.; Rigon, T.; Solari, A.; Hassan, C.; Cherubini, P.; Group, G.I.G.C.S.; Cherubini, A. Experimental evidence of effective human-AI collaboration in medical decision-making. Sci. Rep. 2022, 12, 14952. [Google Scholar] [CrossRef]
- Selvaraju, R.R.; Cogswell, M.; Das, A.; Vedantam, R.; Parikh, D.; Batra, D. Grad-CAM: Visual explanations from deep networks via gradient-based localization. Int. J. Comput. Vis. 2020, 128, 336–359. [Google Scholar] [CrossRef]
- Thijssen, A.; Schreuder, R.R.; Fonolla, R.; van der Zander, Q.; Scheeve, T.; Winkens, B.; Subramaniam, S.; Bhandari, P.; de With, P.; Masclee, A.; et al. Automatic textual description of colorectal polyp features: Explainable artificial intelligence. Endosc. Int. Open 2023, 11, E513–E518. [Google Scholar] [CrossRef]
- An, J.; Joe, I. Attention map-guided visual explanations for deep neural networks. Appl. Sci. 2022, 12, 3846. [Google Scholar] [CrossRef]
- Jin, E.H.; Lee, D.; Bae, J.H.; Kang, H.Y.; Kwak, M.S.; Seo, J.Y.; Yang, J.I.; Yang, S.Y.; Lim, S.H.; Yim, J.Y.; et al. Improved Accuracy in Optical Diagnosis of Colorectal Polyps Using Convolutional Neural Networks with Visual Explanations. Gastroenterology 2020, 158, 2169–2179.e2168. [Google Scholar] [CrossRef] [PubMed]
- Ghassemi, M.; Oakden-Rayner, L.; Beam, A.L. The false hope of current approaches to explainable artificial intelligence in health care. Lancet Digit. Health 2021, 3, e745–e750. [Google Scholar] [CrossRef] [PubMed]
- Wada, K. Labelme: Image Polygonal Annotation with Python, Version v4.6.0; Zenodo: Geneva, Switzerland, 2016.
- Dehghani, N.; Thijssen, A.; Van Der Zander, Q.E.; Schreuder, R.-M.; Schoon, E.J.; Van Der Sommen, F. Evaluating Confidence Calibration in Endoscopic Diagnosis Models. In Proceedings of the IEEE/CVF Conference on Computer Vision and Pattern Recognition, Seattle, WA, USA, 16–22 June 2024; pp. 5020–5025. [Google Scholar]
- Boers, T.G.; Fockens, K.N.; van der Putten, J.A.; Jaspers, T.J.; Kusters, C.H.; Jukema, J.B.; Jong, M.R.; Struyvenberg, M.R.; de Groof, J.; Bergman, J.J. Foundation models in gastrointestinal endoscopic AI: Impact of architecture, pre-training approach and data efficiency. Med. Image Anal. 2024, 98, 103298. [Google Scholar] [CrossRef]
- Kusters, K.C.; Scheeve, T.; Dehghani, N.; van der Zander, Q.E.; Schreuder, R.-M.; Masclee, A.A.; Schoon, E.J.; van der Sommen, F. Colorectal polyp classification using confidence-calibrated convolutional neural networks. In Proceedings of the Medical Imaging 2022: Computer-Aided Diagnosis, San Diego, CA, USA, 20–24 February 2022; pp. 456–468. [Google Scholar]
- Rondonotti, E.; Bergna, I.M.B.; Paggi, S.; Amato, A.; Andrealli, A.; Scardino, G.; Tamanini, G.; Lenoci, N.; Mandelli, G.; Terreni, N.; et al. White light computer-aided optical diagnosis of diminutive colorectal polyps in routine clinical practice. Endosc. Int. Open 2024, 12, E676–E683. [Google Scholar] [CrossRef]
- Weigt, J.; Repici, A.; Antonelli, G.; Afifi, A.; Kliegis, L.; Correale, L.; Hassan, C.; Neumann, H. Performance of a new integrated computer-assisted system (CADe/CADx) for detection and characterization of colorectal neoplasia. Endoscopy 2022, 54, 180–184. [Google Scholar] [CrossRef]
- Abdulrazzaq, M.M.; Ramaha, N.T.; Hameed, A.A.; Salman, M.; Yon, D.K.; Fitriyani, N.L.; Syafrudin, M.; Lee, S.W. Consequential advancements of self-supervised learning (SSL) in deep learning contexts. Mathematics 2024, 12, 758. [Google Scholar] [CrossRef]
- van der Sommen, F.; de Groof, J.; Struyvenberg, M.; van der Putten, J.; Boers, T.; Fockens, K.; Schoon, E.J.; Curvers, W.; de With, P.; Mori, Y.; et al. Machine learning in GI endoscopy: Practical guidance in how to interpret a novel field. Gut 2020, 69, 2035–2045. [Google Scholar] [CrossRef]
- de Groof, A.J.; Struyvenberg, M.R.; van der Putten, J.; van der Sommen, F.; Fockens, K.N.; Curvers, W.L.; Zinger, S.; Pouw, R.E.; Coron, E.; Baldaque-Silva, F.; et al. Deep-Learning System Detects Neoplasia in Patients With Barrett’s Esophagus With Higher Accuracy Than Endoscopists in a Multistep Training and Validation Study With Benchmarking. Gastroenterology 2020, 158, 915–929.e914. [Google Scholar] [CrossRef]
- Jaspers, T.J.M.; Boers, T.G.W.; Kusters, C.H.J.; Jong, M.R.; Jukema, J.B.; de Groof, A.J.; Bergman, J.J.; de With, P.H.N.; van der Sommen, F. Robustness evaluation of deep neural networks for endoscopic image analysis: Insights and strategies. Med. Image Anal. 2024, 94, 103157. [Google Scholar] [CrossRef] [PubMed]
- Naqvi, R.A.; Haider, A.; Kim, H.S.; Jeong, D.; Lee, S.-W. Transformative Noise Reduction: Leveraging a Transformer-Based Deep Network for Medical Image Denoising. Mathematics 2024, 12, 2313. [Google Scholar] [CrossRef]
- Sharif, S.; Naqvi, R.A.; Mehmood, Z.; Hussain, J.; Ali, A.; Lee, S.-W. Meddeblur: Medical image deblurring with residual dense spatial-asymmetric attention. Mathematics 2022, 11, 115. [Google Scholar] [CrossRef]

| Base Architecture | Number of Polyps | Pretraining | |
|---|---|---|---|
| Algorithm 1 | ResNet50 | 1359 | ImageNet-GastroNet |
| Algorithm 2 | EfficientNet-B4 | 1189 | ImageNet |
| Algorithm 3 | EfficientNet-B4 | 993 | ImageNet |
| Algorithm 4 | EfficientNet-B4 | 734 | ImageNet |
| Colorectal Polyp Characteristics | N = 376 |
|---|---|
| Size in mm, mean (SD) | 3.74 (3.1) |
| Size categories, n (%) 1 | |
| Diminutive (≤5 mm) | 337 (90.6) |
| Small (5–10 mm) | 25 (6.7) |
| Large (>10 mm) | 10 (2.7) |
| Location, n (%) 2 | |
| Rectum | 30 (8.0) |
| Sigmoid | 89 (23.7) |
| Descending colon | 37 (9.9) |
| Splenic flexure | 2 (0.5) |
| Transverse colon | 94 (25.1) |
| Hepatic flexure | 11 (2.9) |
| Ascending colon | 76 (20.3) |
| Cecum | 36 (9.6) |
| Histology, n (%) | |
| Premalignant | |
| Tubular adenoma | 299 (79.5) |
| Sessile serrated lesion | 32 (8.5) |
| Tubulovillous adenoma | 14 (3.7) |
| Traditionally serrated adenoma | 3 (0.8) |
| Benign | |
| Hyperplastic polyp | 28 (7.4) |
| Endoscopy brand, n (%) | |
| Fujifilm | 212 (56.4) |
| Olympus | 164 (43.6) |
| Images per polyp, mean (SD) | 5.7 (3.4) |
| Algorithm 1 | Algorithm 2 | Algorithm 3 | Algorithm 4 | |
|---|---|---|---|---|
| Sensitivity, % (95% CI) | 80.6 (77.1–84.0) | 75.3 (72.0–78.6) | 65.3 (61.6–69.1) | 79.4 (76.2–82.6) |
| Specificity, % (95% CI) | 58.1 (41.7–74.5) | 54.6 (39.2–70.1) | 56.8 (39.2–74.5) | 40.4 (27.8–52.9) |
| PPV, % (95% CI) | 97.0 (95.4–98.7) | 96.6 (94.5–98.6) | 96.2 (93.8–98.6) | 95.7 (93.5–98.0) |
| NPV, % (95% CI) | 15.0 (7.3–22.8) | 11.4 (6.0–16.9) | 8.8 (4.5–13.1) | 10.3 (5.5–15.1) |
| Diagnostic accuracy, % (95% CI) | 79.3 (76.0–82.7) | 74.1 (70.9–77.4) | 64.8 (61.2–68.5) | 77.2 (74.0–80.5) |
| AUROC, % (95% CI) | 69.5 (64.1–74.8) | 64.7 (59.3–70.1) | 61.0 (55.7–66.3) | 59.7 (54.1–65.3) |
| Algorithm 1 | Algorithm 2 | Algorithm 3 | Algorithm 4 | |||||||||
|---|---|---|---|---|---|---|---|---|---|---|---|---|
| OR [95% CI] | p Value | Adjusted p Value # | OR [95% CI] | p Value | Adjusted p Value # | OR [95% CI] | p Value | Adjusted p Value # | OR [95% CI] | p Value | Adjusted p Value # | |
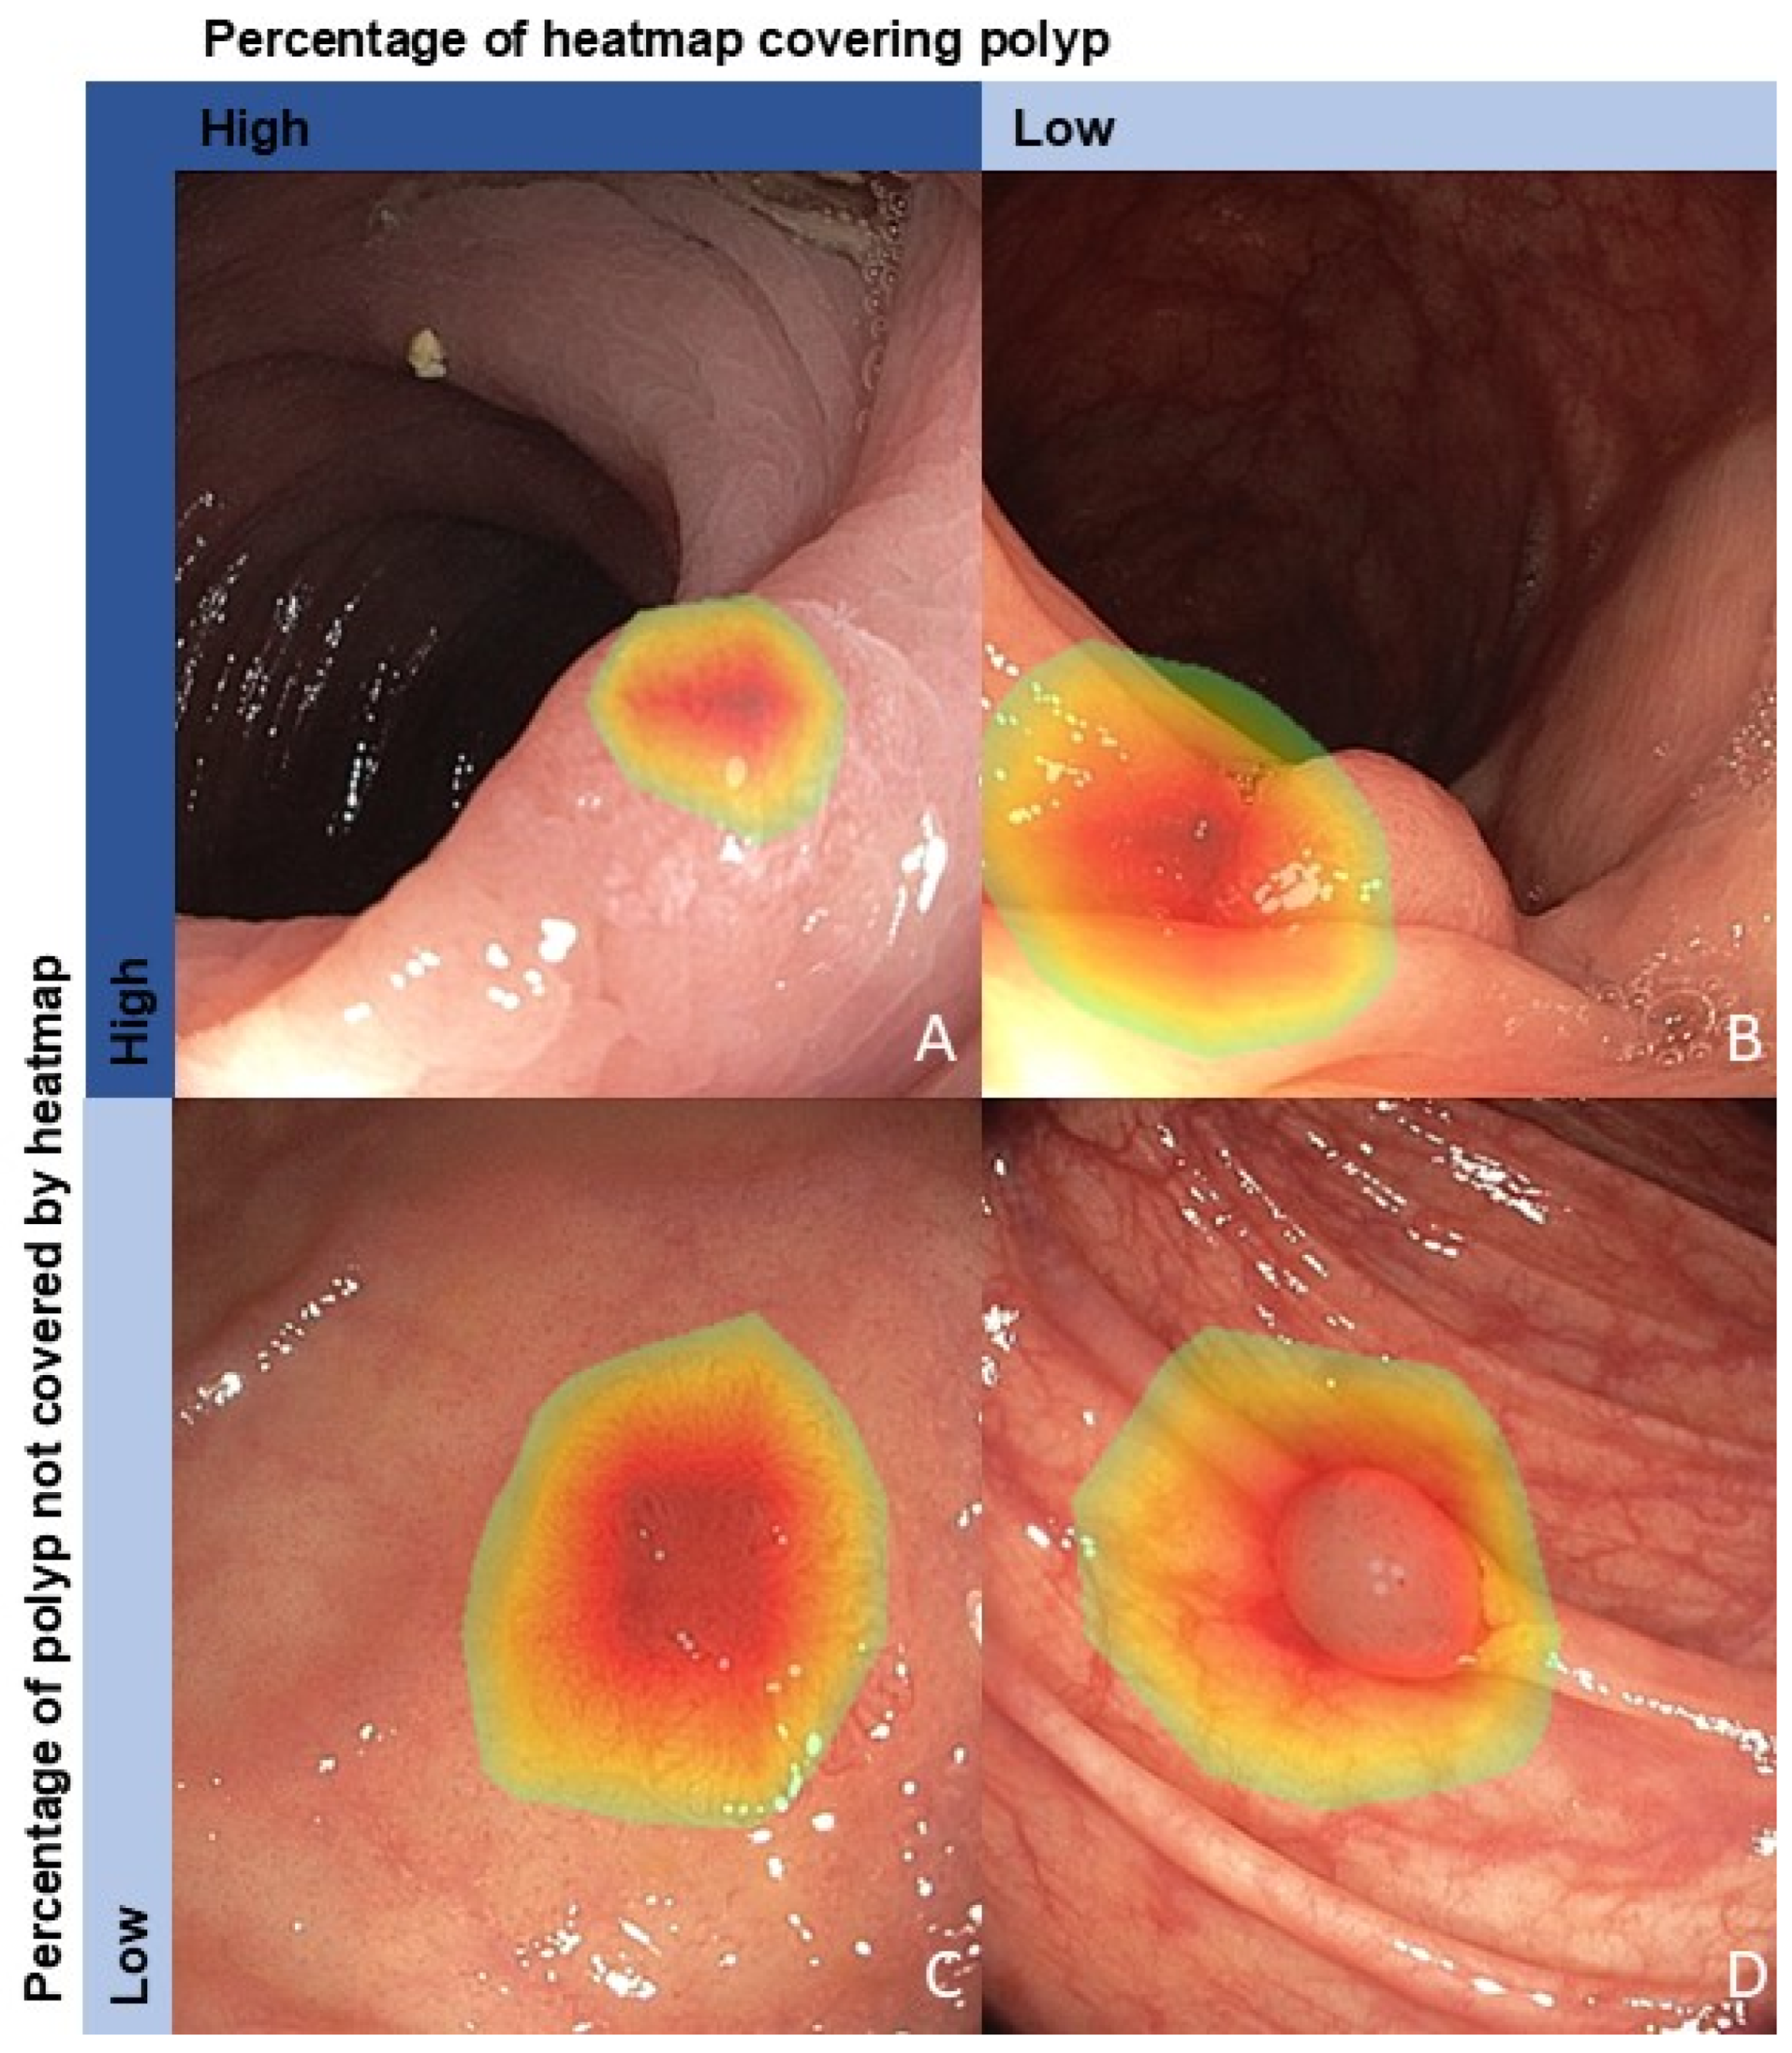
| Percentage of heatmap covering polyp | 1.013 [1.006–1.019] | <0.001 * | 0.003 * | 1.025 [1.011–1.039] | <0.001 * | 0.008 * | 1.038 [1.024–1.053] | <0.001 * | 0.008 * | 1.039 [1.020–1.058] | <0.001 * | 0.004 * |
| Percentage of polyp not covered by heatmap | 1.006 [1.003–1.010] | <0.001 * | 0.003 * | 0.992 [0.985–1.000] | 0.044 * | 0.117 | 0.995 [0.989–1.001] | 0.098 | 0.392 | 0.995 [0.986–1.004] | 0.280 | 0.560 |
| Endoscopy brand Olympus | 1.812 [1.181–2.779] | 0.006 * | 0.012 * | 1.328 [0.938–1.881] | 0.109 | 0.218 | 1.220 [0.877–1.698] | 0.237 | 0.539 | 1.481 [1.006–2.180] | 0.046 * | 0.123 |
| Histology premalignant | 4.002 [2.075–7.720] | <0.001 * | 0.003 * | 2.720 [1.465–5.049] | 0.002 * | 0.008 * | 1.272 [0.605–2.674] | 0.526 | 0.701 | 5.562 [2.909–10.636] | <0.001 * | 0.004 * |
| Age | 0.998 [0.971–1.025] | 0.871 | 0.871 | 1.000 [0.979–1.022] | 0.988 | 0.988 | 0.990 [0.971–1.010] | 0.337 | 0.539 | 0.996 [0.971–1.021] | 0.741 | 0.827 |
| Female gender | 1.071 [0.706–1.624] | 0.746 | 0.853 | 0.859 [0.605–1.218] | 0.392 | 0.523 | 1.022 [0.720–1.450] | 0.903 | 0.903 | 1.045 [0.702–1.558] | 0.827 | 0.827 |
| Location polyp right-sided | 1.282 [0.850–1.934] | 0.237 | 0.379 | 0.857 [0.602–1.220] | 0.392 | 0.523 | 0.834 [0.601–1.157] | 0.276 | 0.539 | 0.945 [0.641–1.392] | 0.774 | 0.827 |
| Polyp size | 0.980 [0.924–1.038] | 0.490 | 0.653 | 1.007 [0.950–1.068] | 0.807 | 0.922 | 1.014 [0.958–1.073] | 0.633 | 0.723 | 1.019 [0.950–1.093] | 0.599 | 0.827 |
Disclaimer/Publisher’s Note: The statements, opinions and data contained in all publications are solely those of the individual author(s) and contributor(s) and not of MDPI and/or the editor(s). MDPI and/or the editor(s) disclaim responsibility for any injury to people or property resulting from any ideas, methods, instructions or products referred to in the content. |
© 2025 by the authors. Licensee MDPI, Basel, Switzerland. This article is an open access article distributed under the terms and conditions of the Creative Commons Attribution (CC BY) license (https://creativecommons.org/licenses/by/4.0/).
Share and Cite
Thijssen, A.; Dehghani, N.; Schrauwen, R.W.M.; Keulen, E.T.P.; Rondagh, E.J.A.; van Avesaat, M.H.P.; Soufidi, K.; Reumkens, A.; Bours, P.H.A.; van der Zander, Q.E.W.; et al. The Association Between Heatmap Position and the Diagnostic Accuracy of Artificial Intelligence for Colorectal Polyp Diagnosis. Cancers 2025, 17, 1620. https://doi.org/10.3390/cancers17101620
Thijssen A, Dehghani N, Schrauwen RWM, Keulen ETP, Rondagh EJA, van Avesaat MHP, Soufidi K, Reumkens A, Bours PHA, van der Zander QEW, et al. The Association Between Heatmap Position and the Diagnostic Accuracy of Artificial Intelligence for Colorectal Polyp Diagnosis. Cancers. 2025; 17(10):1620. https://doi.org/10.3390/cancers17101620
Chicago/Turabian StyleThijssen, Ayla, Nikoo Dehghani, Ruud W. M. Schrauwen, Eric T. P. Keulen, Eveline J. A. Rondagh, Mark H. P. van Avesaat, Khalida Soufidi, Ankie Reumkens, Paul H. A. Bours, Quirine E. W. van der Zander, and et al. 2025. "The Association Between Heatmap Position and the Diagnostic Accuracy of Artificial Intelligence for Colorectal Polyp Diagnosis" Cancers 17, no. 10: 1620. https://doi.org/10.3390/cancers17101620
APA StyleThijssen, A., Dehghani, N., Schrauwen, R. W. M., Keulen, E. T. P., Rondagh, E. J. A., van Avesaat, M. H. P., Soufidi, K., Reumkens, A., Bours, P. H. A., van der Zander, Q. E. W., de With, P. H. N., Winkens, B., Sommen, F. v. d., & Schoon, E. J. (2025). The Association Between Heatmap Position and the Diagnostic Accuracy of Artificial Intelligence for Colorectal Polyp Diagnosis. Cancers, 17(10), 1620. https://doi.org/10.3390/cancers17101620