Article

TP53 Mutation-Specific Dysregulation of Store-Operated Calcium Entry and Apoptotic Sensitivity in Triple-Negative Breast Cancer

1
Life Sciences Institute, Dublin City University, D09 NR58 Dublin, Ireland
2
School of Nursing, Psychotherapy and Community Health, Dublin City University, D09 Y8VX Dublin, Ireland
3
School of Biotechnology, Dublin City University, D09 K20V Dublin, Ireland
*
Authors to whom correspondence should be addressed.
These authors contributed equally to this work.
Cancers 2025, 17(10), 1614; https://doi.org/10.3390/cancers17101614
Submission received: 25 March 2025 / Revised: 29 April 2025 / Accepted: 7 May 2025 / Published: 10 May 2025
(This article belongs to the Special Issue Calcium Signaling in Cancer Cell Progression)

Simple Summary

Triple-negative breast cancer (TNBC) is an aggressive and hard-to-treat form of breast cancer that has limited treatment options. In TNBC, changes in DNA (mutations) associated with the cancer, frequently occur in the TP53 gene. The TP53 gene normally helps cells repair damage or self-destruct when they are not functioning properly; however when mutated, TP53 cannot function properly. In this study, we found that different types of TP53 mutations, affect how cancer cells manage calcium—an important signal that controls how cells grow and die. Some of these mutations made the cancer cells less likely to die under stress, which may explain why they can resist certain treatments. To address this problem, we tested a TP53 reactivator that helps restore the normal functions of TP53. This TP53 reactivator increased calcium levels in the cancer cells and made them more responsive to treatment. Our findings help explain why some cancers are more aggressive and suggest a new approach to treatment by targeting both the mutant TP53 and the disrupted calcium signals. This could lead to better therapies and improved outcomes for people with TNBC.

Abstract

Background: Triple-negative breast cancer (TNBC) is an aggressive subtype lacking estrogen, progesterone, and HER2 receptors, and is associated with poor prognosis and limited targeted therapeutic options. TP53 mutations occur in the majority of TNBC cases, disrupting p53’s role in DNA repair and apoptosis. Beyond gene regulation, p53 also influences calcium signalling through store-operated calcium entry (SOCE), a critical pathway for cell survival and death. However, the impact of different TP53 mutation types on calcium signalling remains unclear. Methods: Calcium channel gene expression was analysed using publicly available TNBC datasets. Calcium channel expression and SOCE activity were assessed in TNBC cell lines with different TP53 mutations using quantitative PCR and calcium imaging (Fura-2AM). Cell proliferation was measured using acid phosphatase assays, while apoptosis was evaluated through caspase 3/7 activation using the Incucyte live-cell fluorescent imager. The p53 reactivator COTI-2 was tested for its ability to restore TP53 function and modulate calcium signalling. Results: Analysis revealed significant downregulation of CACNA1D in TP53-mutant TNBCs. TNBC cell lines harbouring frameshift and stop TP53 mutations exhibited reduced SOCE, lower CACNA1D expression, and resistance to thapsigargin-induced apoptosis compared to wild-type cells. In contrast, cells with the TP53 R273H missense mutation demonstrated similar calcium signalling and proliferation to TP53 wild-type cels. COTI-2 treatment restored CACNA1D expression and SOCE in frameshift and stop mutant cells, enhancing apoptotic sensitivity. Combined treatment with COTI-2 and thapsigargin resulted in a synergistic increase in apoptosis. Conclusions: This study identifies a novel link between TP53 mutation type and calcium signalling in TNBC. Reactivating mutant p53 with COTI-2 restores calcium-mediated apoptosis, supporting combination strategies targeting both TP53 dysfunction and calcium signalling.

1. Introduction

Breast cancer (BC) remains the most commonly diagnosed cancer among women worldwide, accounting for approximately 23.8% of all new cancer cases in females in 2022 [1]. It is a highly heterogenous and genetically complex disease, encompassing various molecular subtypes defined by distinct expression patterns of cell surface receptors [2]. Triple-negative breast cancer (TNBC), also known as basal-like BC, constitutes 10–15% of BC cases. It is characterised by the absence of estrogen (ER), progesterone (PR), and human epidermal growth factor receptor 2 (HER2) expression. As a result, this subtype does not respond to receptor-targeted therapies used for ER+ and HER2+ BC [2]. TNBC’s aggressive nature and limited availability of effective treatments contribute to its poorer survival rates [3]. Consequently, non-specific chemotherapy remains a key standard of care treatment, but less than 30% of patients achieve a complete response [3]. Moreover, TNBC exhibits the highest recurrence and mortality rates among BC subtypes [3]. Therefore, there is an urgent need to develop new therapeutic strategies to improve TNBC patient outcomes.
Tumour protein 53 (TP53) is a tumour suppressor gene (TSG) that encodes the p53 protein, known to play a major role in controlling cell division. Activated in response to cellular stressors, including DNA damage, p53 induces cell-cycle arrest, DNA repair, and apoptosis [4,5]. TP53 is the most mutated gene in human cancer, with a frequency of 40–50%. In TNBC, TP53 mutations are highly prevalent (~60–80%), occurring more frequently than in other BC subtypes [6]. However, these mutations are diverse in nature, with missense (~70%), stop (~10%), and frameshift (FS, ~10%) variants being the most common [7]. This heterogeneity complicates our understanding of their individual impact, as different mutations can lead to loss of wild-type p53 tumour suppressor function and/or acquisition of gain-of-function oncogenic properties [8]. Despite this, research has shown that certain TP53 mutants have been linked with enhanced invasion, migration, tumour survival, and resistance to apoptosis, which collectively contribute to a poorer prognosis and chemoresistance [9,10]. As a result, significant efforts have focused on targeting the mutant form of the resultant protein, p53, as a therapeutic strategy [8]. This has led to the development of novel p53 reactivators, which can restore p53 wild-type conformation and downregulate mutant expression [11,12]. TP53 restoration results in anti-tumorigenic effects such as inhibition of cancer proliferation and apoptosis induction [13,14]. Despite these advances, clinical trials have reported variable patient responses [15], highlighting the need for a more comprehensive understanding of the mechanisms underlying TP53 mutations to predict treatment outcomes and refine therapeutic strategies.
A key function of p53 is its ability to induce apoptosis through a well-established transcriptionally-dependent pathway, upregulating pro-apoptotic genes such as PUMA (p53 upregulated modulator of apoptosis) and NOXA (a BH3-only protein that promotes apoptosis) [16]. This process activates caspases and promotes cytochrome C release via dimerisation of BAX and BAK on the mitochondria [17]. Emerging research has demonstrated that p53 can also induce apoptosis via a transcriptionally-independent mechanism, notably through the modulation of intracellular calcium (Ca2+) [18]. In non-excitable cells, Ca2+ homeostasis is primarily regulated by store-operated current (SOC), which mediates Ca2+ release from the endoplasmic reticulum (ER) and facilitates Ca2+ entry through store-operated Ca2 entry (SOCE) across the plasma membrane (PM). This mechanism is integral to key cellular processes, including proliferation, survival, and apoptosis [19]. Aberrations in SOC activity have been linked to cancer progression, including BC [20,21,22], where they support hallmarks of malignancy such as proliferation, migration, and apoptotic resistance [23,24,25].
Notably, p53 has been shown to interact with SOC [18,26], facilitating Ca2+ loading into the endoplasmic reticulum (ER) via sarcoplasmic/ER Ca2+-ATPase (SERCA) [27] and promoting SOCE by regulating Ca2+ channels at the PM, such as transient receptor potential channel (TRPC6) [28]. Furthermore, by mediating Ca2+ transfer between the ER and mitochondria, p53 triggers apoptosis through the activation of caspase-3 and the cleavage of PARP [29]. However, studies have highlighted that disruption to p53 function or associated Ca2+ homeostasis can promote apoptotic resistance and reduced chemotherapy sensitivity [27,29]. Further research is required to understand how different TP53 mutations influence this pathway and to assess its therapeutic potential.
This study aimed to elucidate the impact of TP53 mutations on SOC activity and its contribution to apoptotic resistance in TNBC cells. Our findings demonstrate that TP53 mutations differentially impact Ca2+ channel expression and SOC activity. Specifically, certain FS or stop TP53 mutations contribute to apoptotic resistance by downregulating SOC activity. Notably, this effect can be restored through the use of p53 reactivators. This first-of-its-kind study provides critical insights into how TP53 mutation type can influence apoptotic sensitivity through Ca2+ modulation. Furthermore, our data suggest that targeting SOC channels in combination with p53 reactivation could yield synergistic therapeutic effects, offering a novel strategy for overcoming TNBC treatment resistance.

2. Materials and Methods

2.1. Bioinformatics

Differential expression analyses (DEAs) were carried out using Cancer Cell Line Encyclopaedia (CCLE) BC cell line microarray data and The Cancer Genome Atlas (TCGA) BC patient sample RNA-sequencing data using Bioconductor software packages (version 3.16, BiocManager 1.30.23) in RStudio (Version 4.2.2, release date 2022-10-31). Differentially expressed genes (DEGs) with log2 fold change (lfc) ≥ 2 and Benjamini-Hochberg adjusted (BH-adj). p-value ≤ 0.01 were identified in all BC subtypes, TP53 MUT vs. WT and TNBC/Basal TP53 MUT vs. all BC subtype WT. Volcano plots were generated to illustrate the DEGs. The DEGs were cross-analyzed using Venn diagrams to identify overlapping targets between datasets. Ca2+ genes were identified from the overlapping targets.

2.2. Cell Culture

This research employed several TNBC cell lines, grouped based on their TP53 mutation status, with CAL-51 (ATCC) representing TP53 wild-type. HDQ-P1 (DMSZ) (R213*) and MDA-MB-157 (ATCC) (A88fs) displayed rarer but more deleterious stop (nonsense) and frameshift mutations, respectively [30,31]. While MDA-MB-468 (R273H) and MFM223 (K132R) (both ATCC) harbour more common single nucleotide variant (SNV) missense mutations [32]. Each cell line was cultured in the outlined specific media; CAL-51-DMEM (Sigma-Aldrich, Merck KGaA, Dramstadt, Germany) 10% Fetal Bovine Serum (FBS; Gibco); HDQP1-DMEM 10% FBS and 2 mM L-glutamine (Gibco, Thermo Fisher Scientific, Waltham, MA, USA); MDA-MB-157-L15 (Corning®, Corning Inc., Corning, NY, USA) 10% FBS; MDA-MB-468-RPMI (Sigma-Aldrich) 10% FBS; MFM223-MEM (Sigma Aldrich) 10% FBS. Grown in T75 flasks at 37 °C in a humidified incubator containing 5% carbon dioxide. Cell lines were treated with sarco/endoplasmic reticulum Ca2+ ATPase (SERCA) inhibitor/ER stressor, thapsigargin (TG) (T9033, Sigma-Aldrich), prepared to 10 mM in DMSO. In addition, COTI-2, a third-generation thiosemicarbazone p53 reactivator (Selleckchem, Houston, TX, USA; Cat. No. S8580), was prepared at a concentration of 5 mM in DMSO. Restoring p53 function by binding to misfolded mutant p53 and inducing a conformational change that reactivates its tumour suppressor activity [33,34]. Due to its greater potency compared to other p53 reactivators, such as APR-246, and its higher specificity relative to broader-acting compounds such as α-mangostin, COTI-2 was selected as the most suitable agent for this investigation [35,36].

2.3. CACNA1D siRNA Knockdown

siRNA knockdown was performed on CAL-51 cell line to induce knockdown of CACNA1D gene, which codes for the protein Cav1.3. Cells were seeded into 6-well plates at 4 × 10⁵ cells per well, achieving 80% confluency following overnight incubation. Followed by treatment with either siRNA targeting gene CACNA1D (SiCACNA1D, Silencer Select, Thermo Fisher Scientific, Waltham, MA, USA; Cat. No.; 4392420) or siRNA non-targeting negative control (SiNeg, Silencer Select, Thermo Fisher Scientific, Waltham, MA, USA; Cat. No. 4390843). Prepared by adding 30 pmol of siRNA to Opti-MEM media (Sigma, Merck KGaA, Dramstadt, Germany) and separately 9 µL of Lipofectamine 3000 (Invitrogen, Thermo Fisher Scientific, Waltham, MA, USA) to Opti-MEM media. After 5 min, both tubes were mixed and left at room temperature (RT) to incubate for a further 20 min. Afterwards, culture media were removed from wells, and 250 µL of the transfection mix was added to the appropriate wells at a final concentration of 25 pmol of siRNA and 7.5 µL of Lipofectamine 3000, before making up the final volume per well to 2 mls with opti-MEM media. The plate was incubated at 37 °C, 5% CO2, for a period of 48 h ahead of qPCR or SOCE assays.

2.4. Real-Time PCR

Gene expression was assessed in the TNBC cell lines with or without 24 h COTI (100 nM) treatment. A High Pure RNA Isolation Kit (Roche, F. Hoffmann-La Roche Ltd., Basel, Switzerland) was used to extract RNA as per the manufacturer’s guidelines. Total RNA was quantified using a nanodrop, with purity determined through the A260/A280 ratio. Lyophilised primers (Sigma Aldrich, Merck KGaA, Dramstadt, Germany) were designed based on an exon-spanning sequence. Gene expression was measured using a One-step Luna qPCR kit (New England Biolabs, Ipswich, MA, USA) with the reaction mixture according to the kit instructions, including 10 μM primers (Sigma Aldrich, Merck KGaA, Dramstadt, Germany) (Supplementary Table S1) and 400 ng RNA. Loading three biological replicates for each cell line on a 96-well PCR plate, they were analysed using an Applied Biosystems QuantStudio 3 (Thermo Fischer Scientific, Waltham, MA, USA) instrument. The fold change in gene expression was calculated using the 2−ΔΔCT method with β-Actin as the housekeeping gene and CAL-51 (TNBC WT cell line) as the control group for baseline gene expression. The gene expression of the COTI-2-treated cell lines was normalised to the expression of the untreated cell lines.

2.5. Calcium Measurement

Relative changes in cytosolic calcium (Cac2+) were evaluated as previously described [37]. In brief, TNBC cells were grown in black 96-well plates before loading for 1 h in the dark at 37 °C with ratiometric Ca2+ dye Fura-2-AM (2 mM, Abcam, Abcam Ltd., Cambridge, UK) diluted in DMEM 10% FCS. Thereafter, the cells were washed with DMEM 10% FCS and incubated for 10 min, prior to being resuspended in 100 μL of Ca2+ free physiological saline solution (PSS, in mM NaCl 140, MgCl2 1, KCl 4, D-glucose 11.1 and HEPES 10, EGTA 1, adjusted to pH 7.4 with NaOH). A VICTOR multilabel plate reader was used to measure fluorescence at 510 nM after excitation at 340 and 380 nM to record SOC over 12 min. Basal cytosolic Ca2+ was measured for 100 s, followed by endoplasmic reticulum depletion induced by 5 µM TG and read for 400 s, before application of 2 mM CaCl2 to record store-operated Ca2+ entry (SOCE) for a further 200 s. Changes in basal Ca2+ were calculated by taking an average of the first 100 s. Changes in Cac2+ resulting from ER store release or Ca2+ entry following application of TG or CaCl2, respectively, were calculated by taking the average baseline away from the maximal peak value.

2.6. Proliferation Assay

MDA-MB-157, CAL-51 and HDQ-P1 were treated with or without TG (100 nM) for 5 days to promote ER stress-induced cell death. Proliferation was determined with the acid phosphatase assay as described previously [38]. All media were removed, and the wells were washed once with PBS. Paranitrophenol phosphate substrate (0.263 g of PNP in 100 mL sodium acetate buffer) was added to each well and incubated at 37 °C for 2 h. 50 μL of 1 M NaOH was added, and the absorbance was read at 405 nM (reference—620 nM). Inhibition of proliferation analysis was calculated as a percentage of untreated controls, with the Chou–Talalay equation via CalcuSyn ™ Version 2.0 used to determine the effective dose of the drug that inhibits 50% of growth (IC50).

2.7. Apoptosis Assay

IncuCyte’s live-cell imaging system was used to determine apoptosis induction. On a single 96-well plate, 3 × 10³ cells/well for each TNBC cell line were seeded before treatment with TG and COTI-2, at the indicated drug concentrations. Control wells were treated with media or DMSO, or were untreated. All assays were repeated in triplicate. Caspase 3/7 green dye (Sartorius AG, Gottingen, Germany; Cat. No. 4440) was loaded into each well as recommended, before the plate was incubated in the IncuCyte at 37 °C in 5% CO2. Apoptosis was detected when activated caspase 3/7 cleaved the inert dye, releasing the fluorescent dye, which was measured at 530 nM. IncuCyte 2022 A software was used for plate setup and continuous data acquisition of fluorescent signals at 4-h intervals over a 5-day period. The software automatically presented real-time kinetic changes in cell number and caspase 3/7 activation. Graphs and statistical analyses were performed using GraphPad Prism 7.

2.8. Statistical Analysis

The graphs were all prepared using the Prism software (GraphPad software, Inc., SanDiego, CA, USA). Except otherwise stated, results are reported as means +/− standard errors of the mean. A non-parametric test was used to assess non-normal sample distributions and N < 10. A Mann-Whitney test or a Wilcoxon test was used for non-parametric tests between two groups, and a Kruskal-Wallis test with Dunn’s multiple comparison test (MCT) was used for non-parametric tests between multiple groups. Statistical tests used are indicated in each figure legend, with significance considered as * p < 0.05, ** p < 0.01, *** p < 0.001 and **** p < 0.0001. Unless otherwise noted, all results are generated from at least three independent biological experiments denoted by N, with a total number of individual repeats in each experiment denoted by n.

3. Results

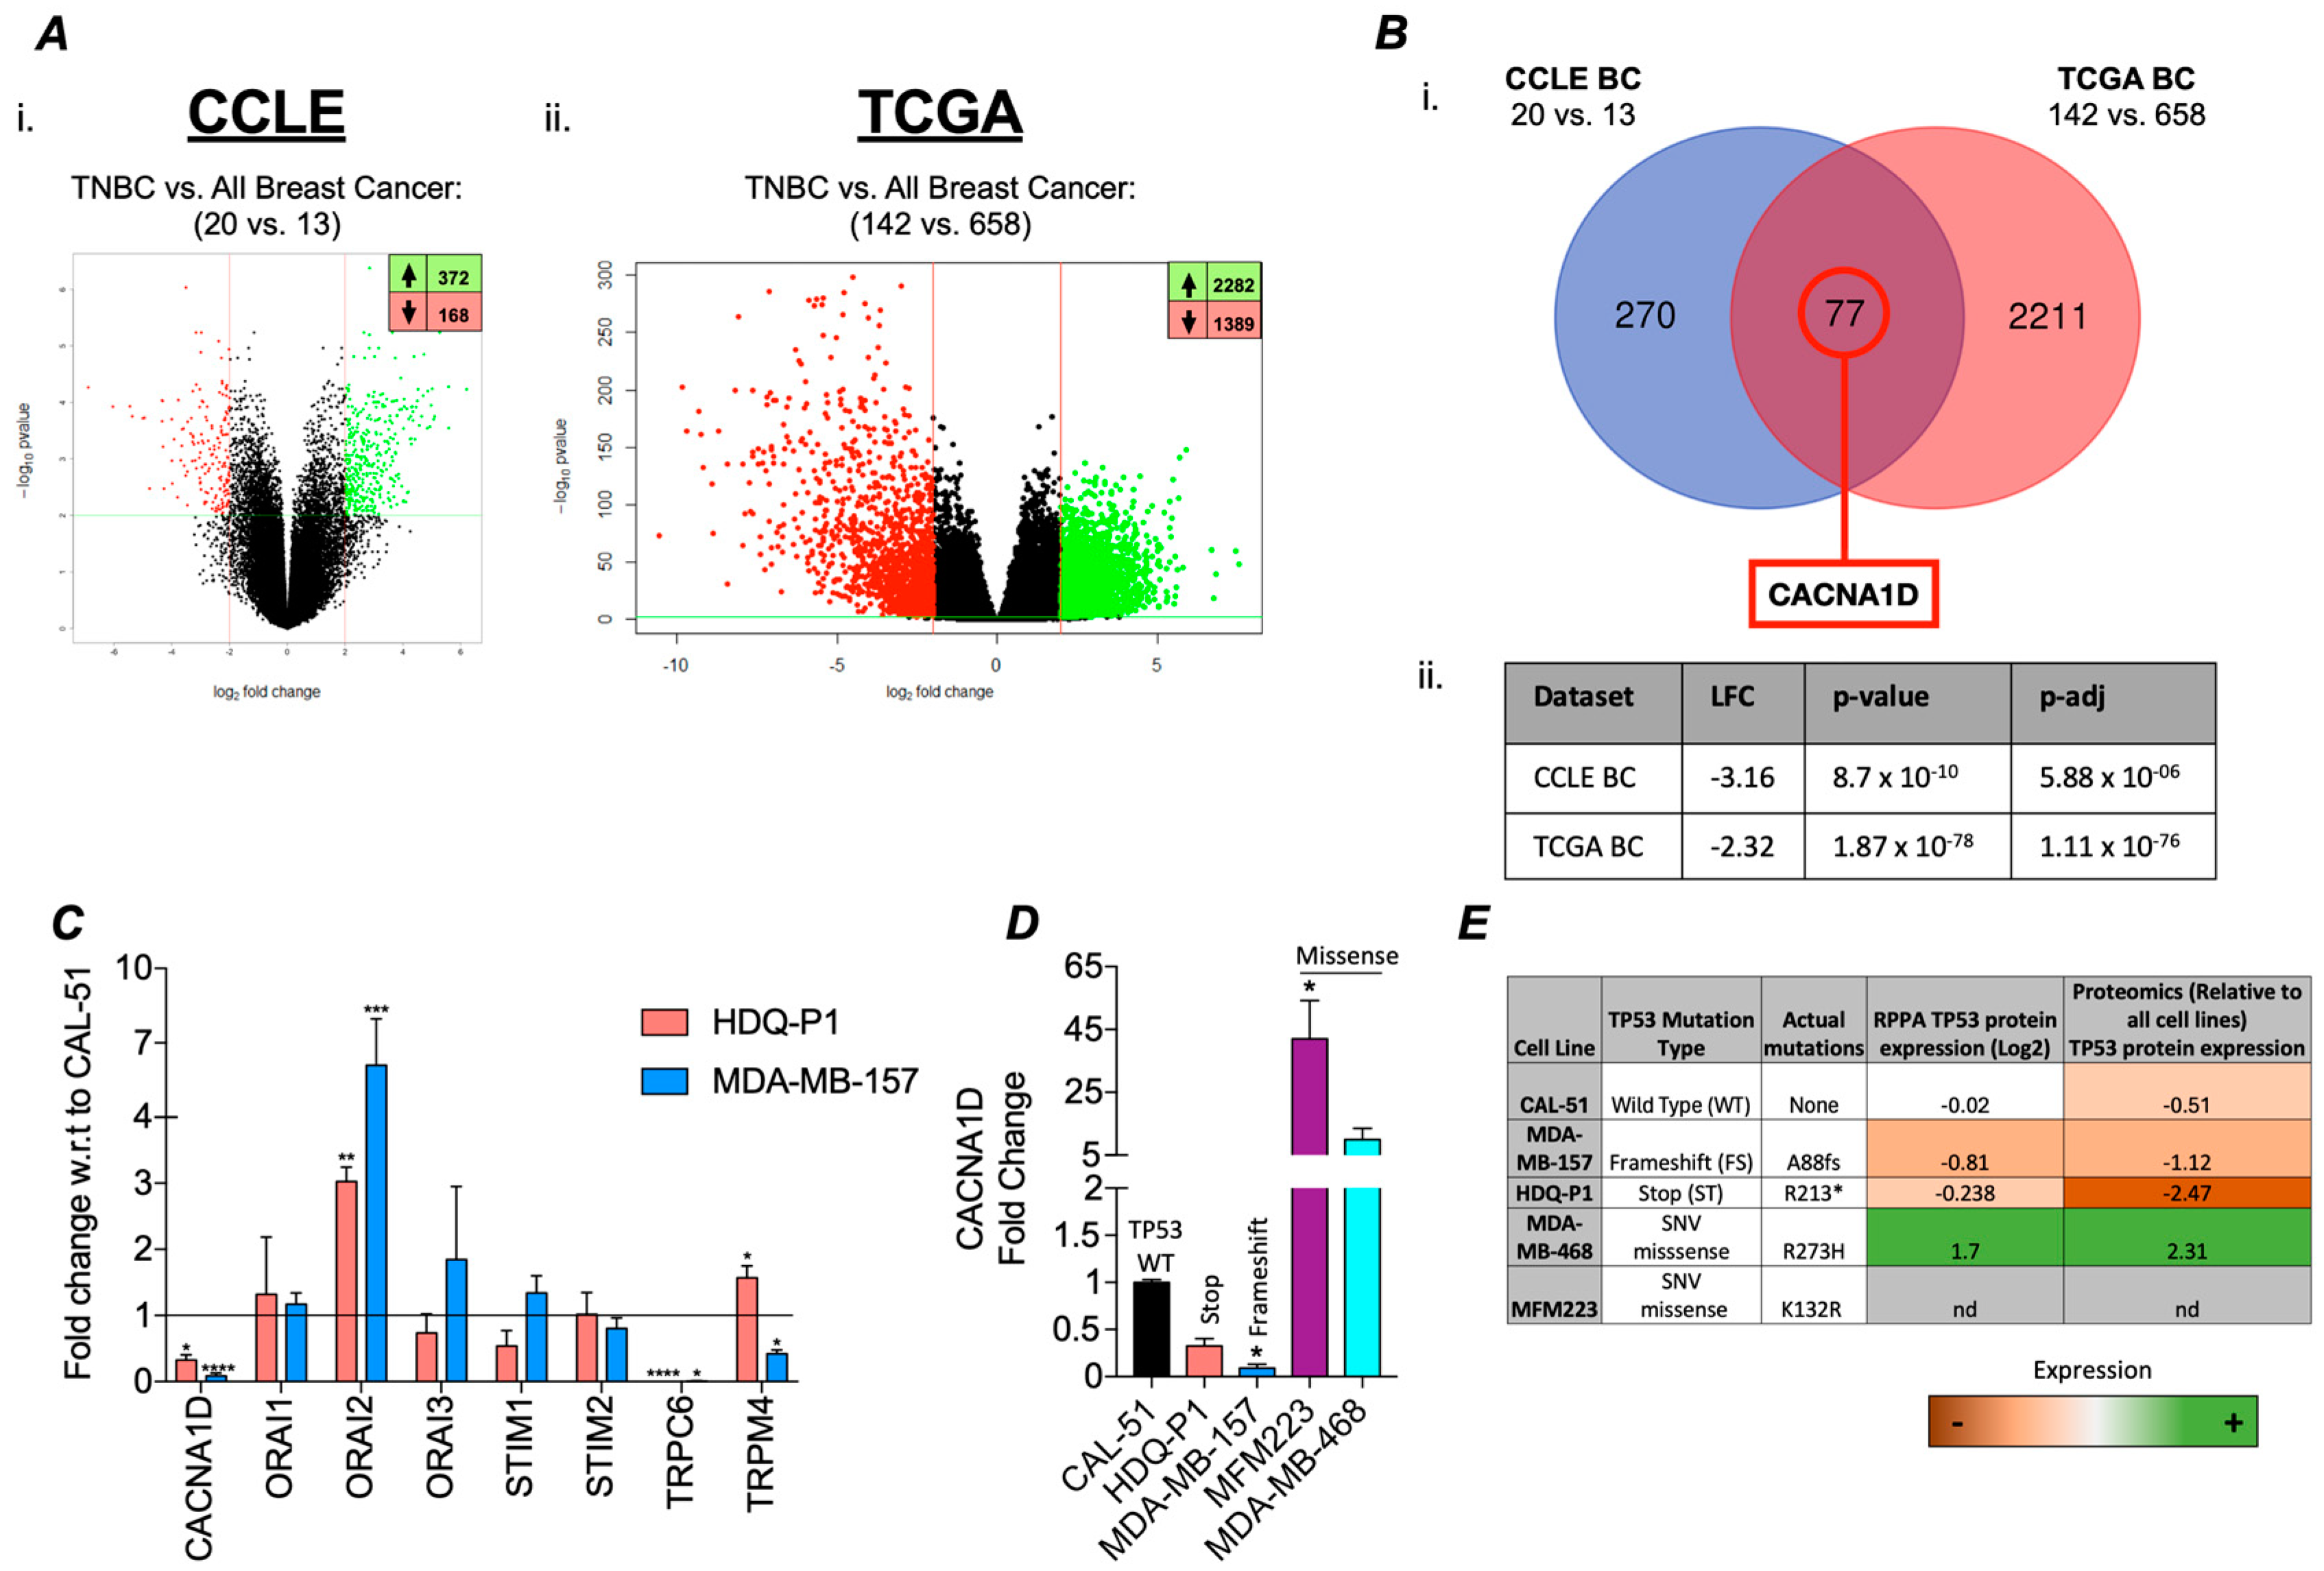
3.1. TP53 Mutations Associated with Differential Ca2+ Channel Gene Expression in TNBC

To determine the impact of TP53 mutations on gene expression, we performed a differential gene expression analysis (DGEA) between TP53 mutant TNBC to wild-type TP53 BCs (All subtypes). Our analysis revealed the significant dysregulation of 372 upregulated and 168 downregulated genes in the CCLE (cell line samples) dataset, and 2282 upregulated and 1389 downregulated genes in the TCGA (patient samples) dataset (Figure 1(Ai,Aii). From these datasets, we identified 77 genes that were commonly dysregulated in both datasets with a significant log2 fold change (log2FC) ≥ 2 (Figure 1(Bi)). Among these, CACNA1D, an L-type voltage-gated Ca2+ channel, was the only Ca2+ channel gene to exhibit significant differential expression, with downregulated expression in TP53 mutant samples in both the CCLE (log2FC = −3.16) and TCGA (log2FC = −2.32) datasets (Figure 1(Bii)). In the TCGA dataset, CACNA1D was also significantly downregulated in TP53-mutant samples across all breast cancers (lfc = −1.30; adj. p = 1.43 × 10−41), but the effect was less, suggesting a subtype-specific association between CACNA1D loss and TP53 mutation in TNBC. Furthermore, our analysis demonstrated in the TCGA database that in BC samples, reduced CACNA1D expression was associated with a significant reduction in disease-free survival (Supplementary Figure S1A,B) (HR: 1.604 (95% CI: 1.109–2.320), p < 0.0127, q < 0.0254). This effect was also evident in TNBC but failed to reach significance (HR: 1.402 (95% CI: 0.556–3.537)). Overall, this highlights CACNA1D as a target of clinical importance.
To validate this bioinformatic analysis, we measured the expression of a panel of Ca2+ channels linked to SOC in TP53 mutant cell lines HDQ-P1 and MDA-MB-157. Compared to the wild-type (WT) TP53 CAL-51 cell line, we observed a significant reduction in CACNA1D, TRPC6, and TRPM4 expression, alongside an upregulation of ORAI2 (Figure 1C). Given that CACNA1D produced the largest FC and considering the impact of different TP53 mutant types on survival outcomes in various cancers, including TNBC [39,40], we measured its expression in a broader panel of TP53 mutant TNBC cell lines. Identifying differential expression based on TP53 mutation type (Figure 1D). Cells harbouring more deleterious mutations, such as stop and frameshift mutations, including HDQ-P1 and MDA-MB-157, displayed a significant 3-fold and 11-fold decrease in CACNA1D expression, respectively, compared to CAL-51 (p < 0.05; Figure 2D). In contrast, cells with single-nucleotide variant (SNV) missense mutations, such as MDA-MB-468 and MFM-223, exhibited a 42-fold and 10-fold increase in CACNA1D expression relative to CAL-51 (p < 0.05). Changes in CACNA1D expression correlated with TP53 expression as outlined in Figure 1E. HDQ-P1 and MDA-MB-157, which have FS or Stop mutations that had low CACNA1D, also displayed lower levels of P53 expression. Alternatively, MDA-MB-468, which harbours a missense mutation and exhibited increased CACNA1D expression, demonstrated enhanced p53 expression. Collectively, these results indicated that TP53 mutation type influences Ca2+ channel expression in TNBC cells.

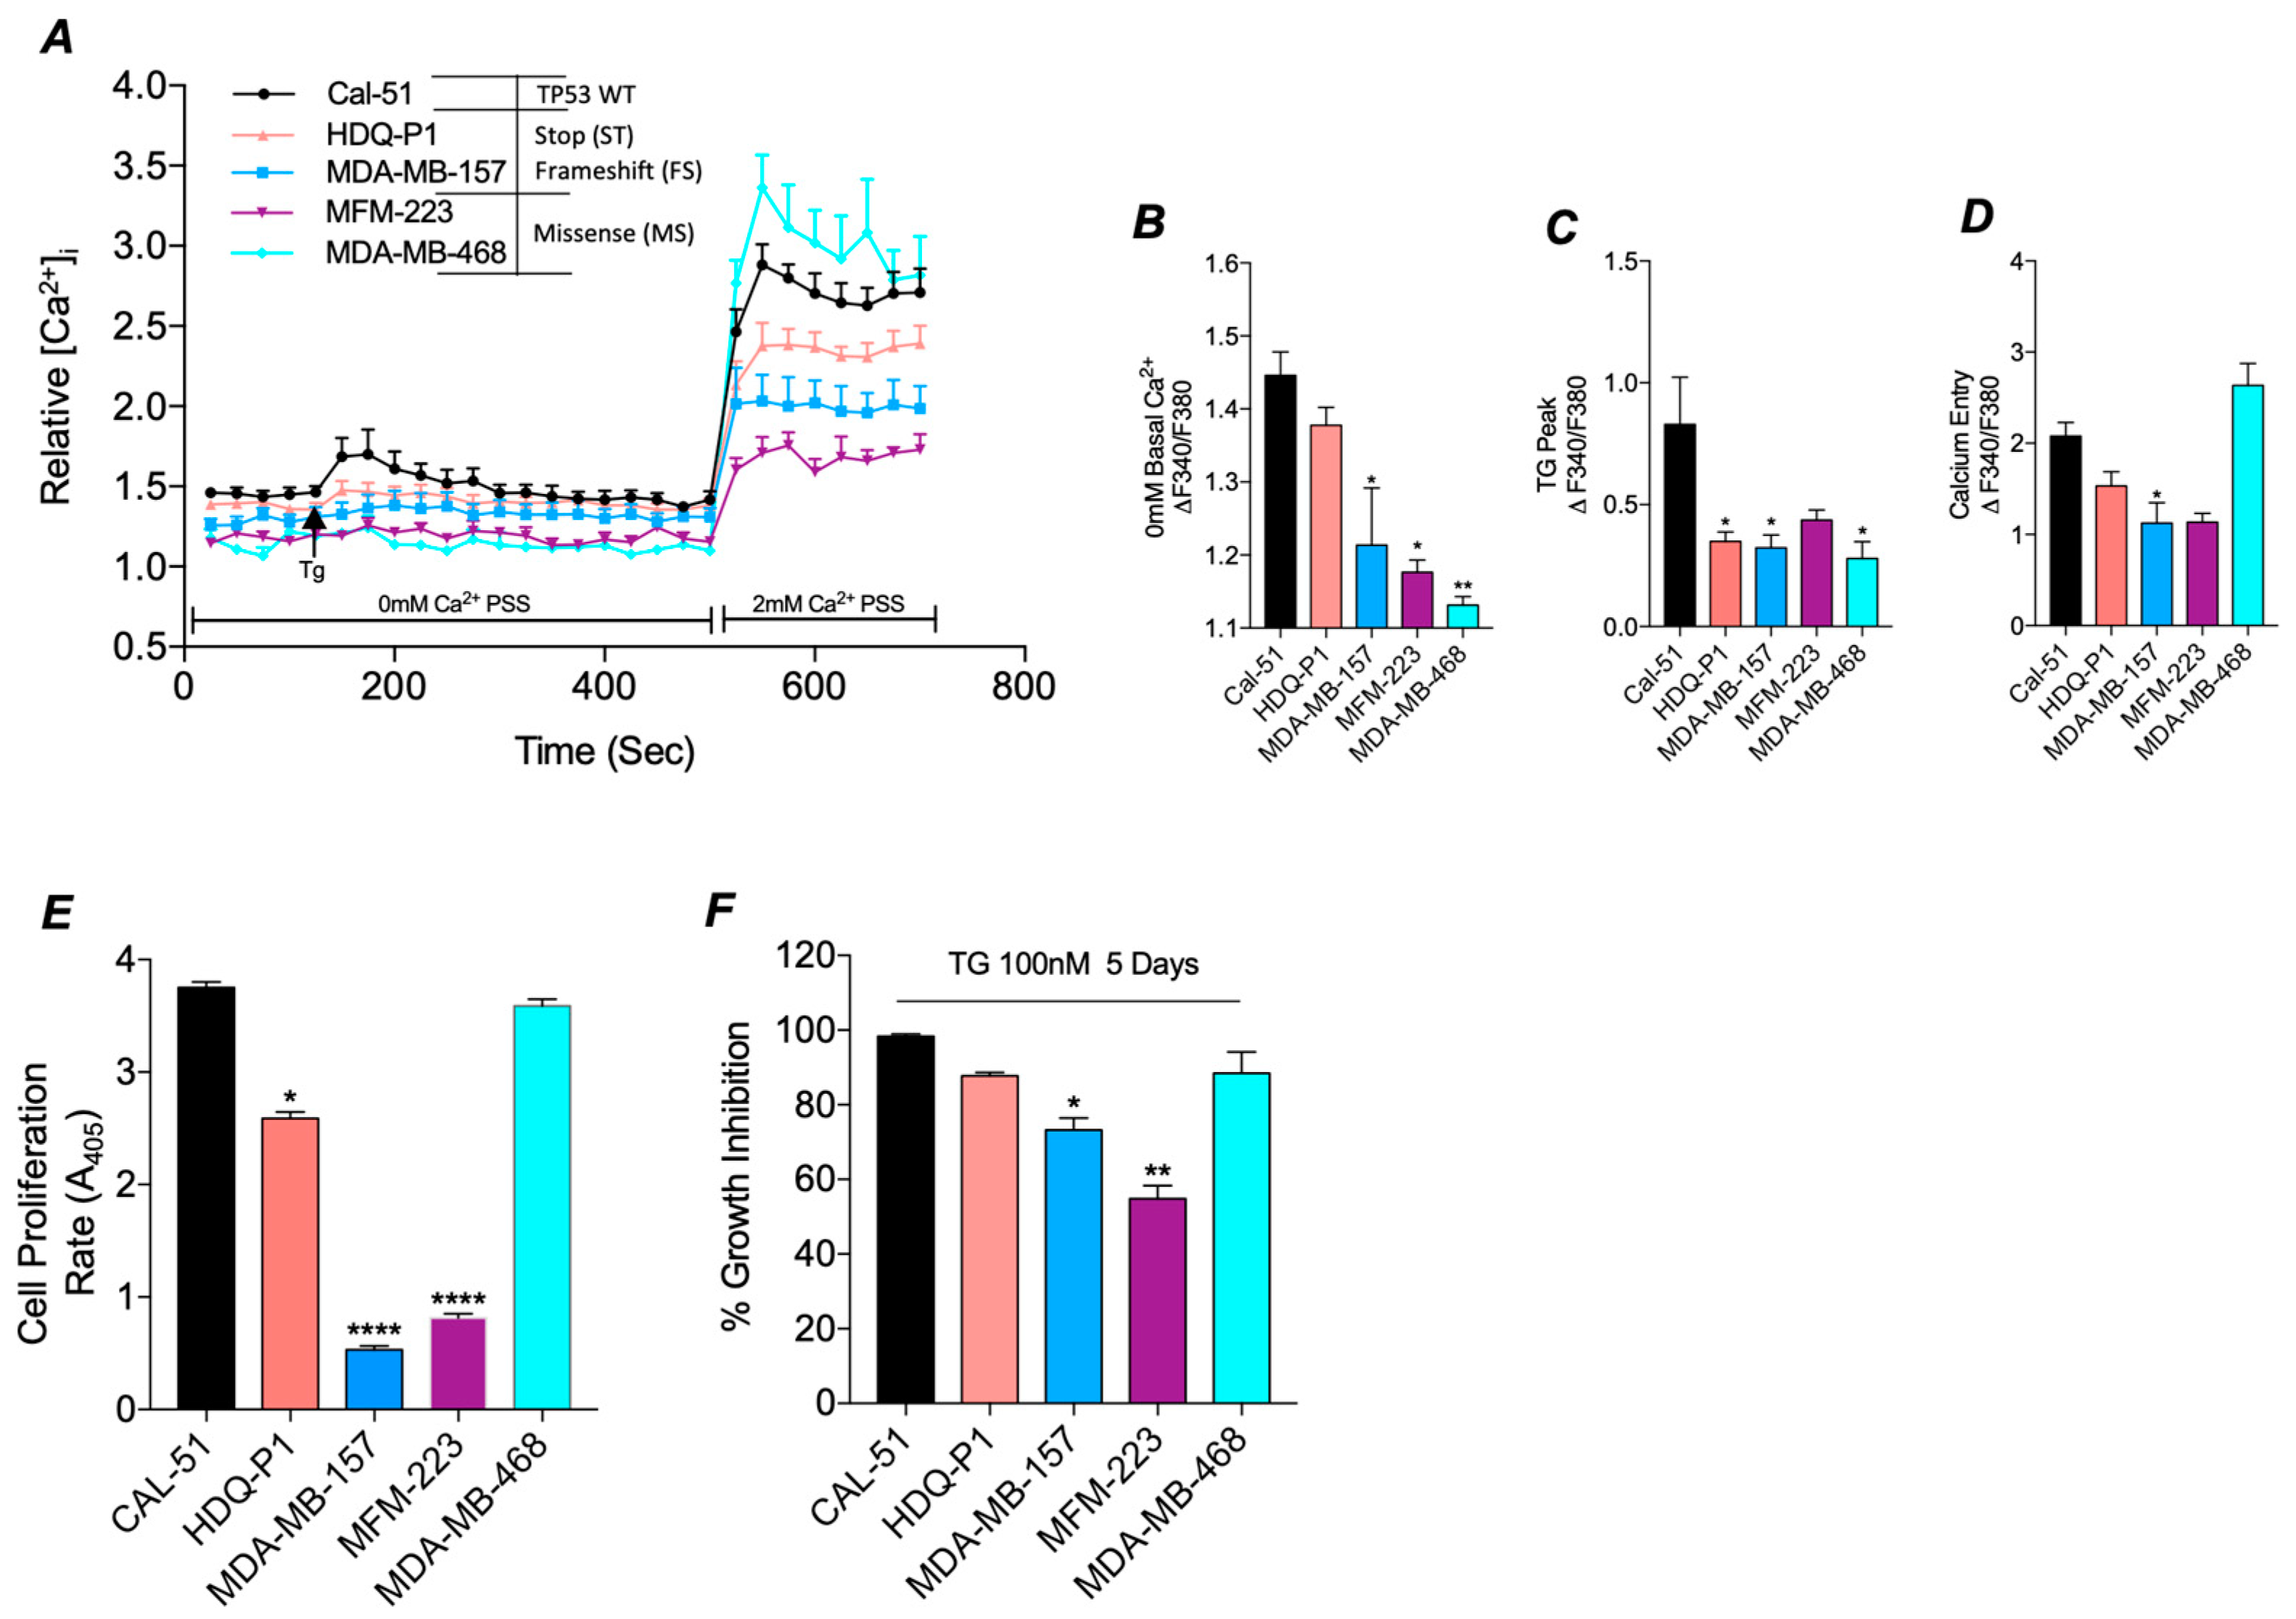
3.2. Mutant TP53 Impacts SOC and Proliferation in TNBC

To determine if the differential expression of CACNA1D in TP53 mutant TNBC cells had a functional impact, we measured SOC activity (Figure 2A). Measurements of basal cytosolic calcium (Cac2+) levels, relative to CAL-51, revealed a reduction in levels across all TP53 mutant cell lines, with a significant decrease observed in MDA-MB-157 (p < 0.05), MFM-223 (p < 0.05), and MDA-MB-468 (p < 0.01) (Figure 2B). In addition, all TP53 mutants failed to induce ER store release following TG treatment compared to CAL-51; with HDQ-P1, MDA-MB-157 and MDA-MB-468 displaying significant reductions in ER store release (p < 0.05, Figure 2C). Subsequent analysis of SOCE demonstrated a reduction in nearly all TP53 mutant cell lines relative to CAL-51, reaching significance in MDA-MB-157 (p < 0.05). In contrast, the missense mutant line, MDA-MB-468, exhibited a significant increase compared to Cal-51 (Figure 2D) (Reaching significance with Mann-Whitney vs. Cal-51 alone, p < 0.01).
Since altered SOC activity is known to influence proliferation and apoptosis, we next assessed the differences in proliferation rates and apoptotic sensitivity between TP53 mutant and WT cells [41]. Proliferation assays revealed significantly reduced proliferative rates in TP53 mutant cell lines with HDQ-P1 (p < 0.05), MDA-MB-157 (p < 0.0001) and MFM-223 (p < 0.0001) compared to TP53 WT CAL-51 cells (Figure 2E), correlating with a reduction in SOC. However, the rate of proliferation in the TP53 mutant line, MDA-MB-468, which displays higher levels of SOCE, was comparable to WT CAL-51 (Figure 2D).
We next sought to estimate anti-proliferative sensitivity by comparing growth inhibition in cells treated with ER stressor TG relative to DMSO control. We identified a reduction in growth inhibition in TP53 mutant lines that also had a reduction in SOC, reaching significance in MDA-MB-157 (p < 0.05) and MFM-223 (p < 0.01) compared to TP53 WT (Figure 2F). In contrast, CAL-51 and MDA-MB-468, both of which exhibited higher SOCE, displayed greater anti-proliferative sensitivity, with cell death rates of 98% and 88%, respectively (p < 0.0001; Figure 2F). These results suggest that mutant TP53 promotes altered Ca2+ channel expression and SOC, which in turn can impact proliferation rates.

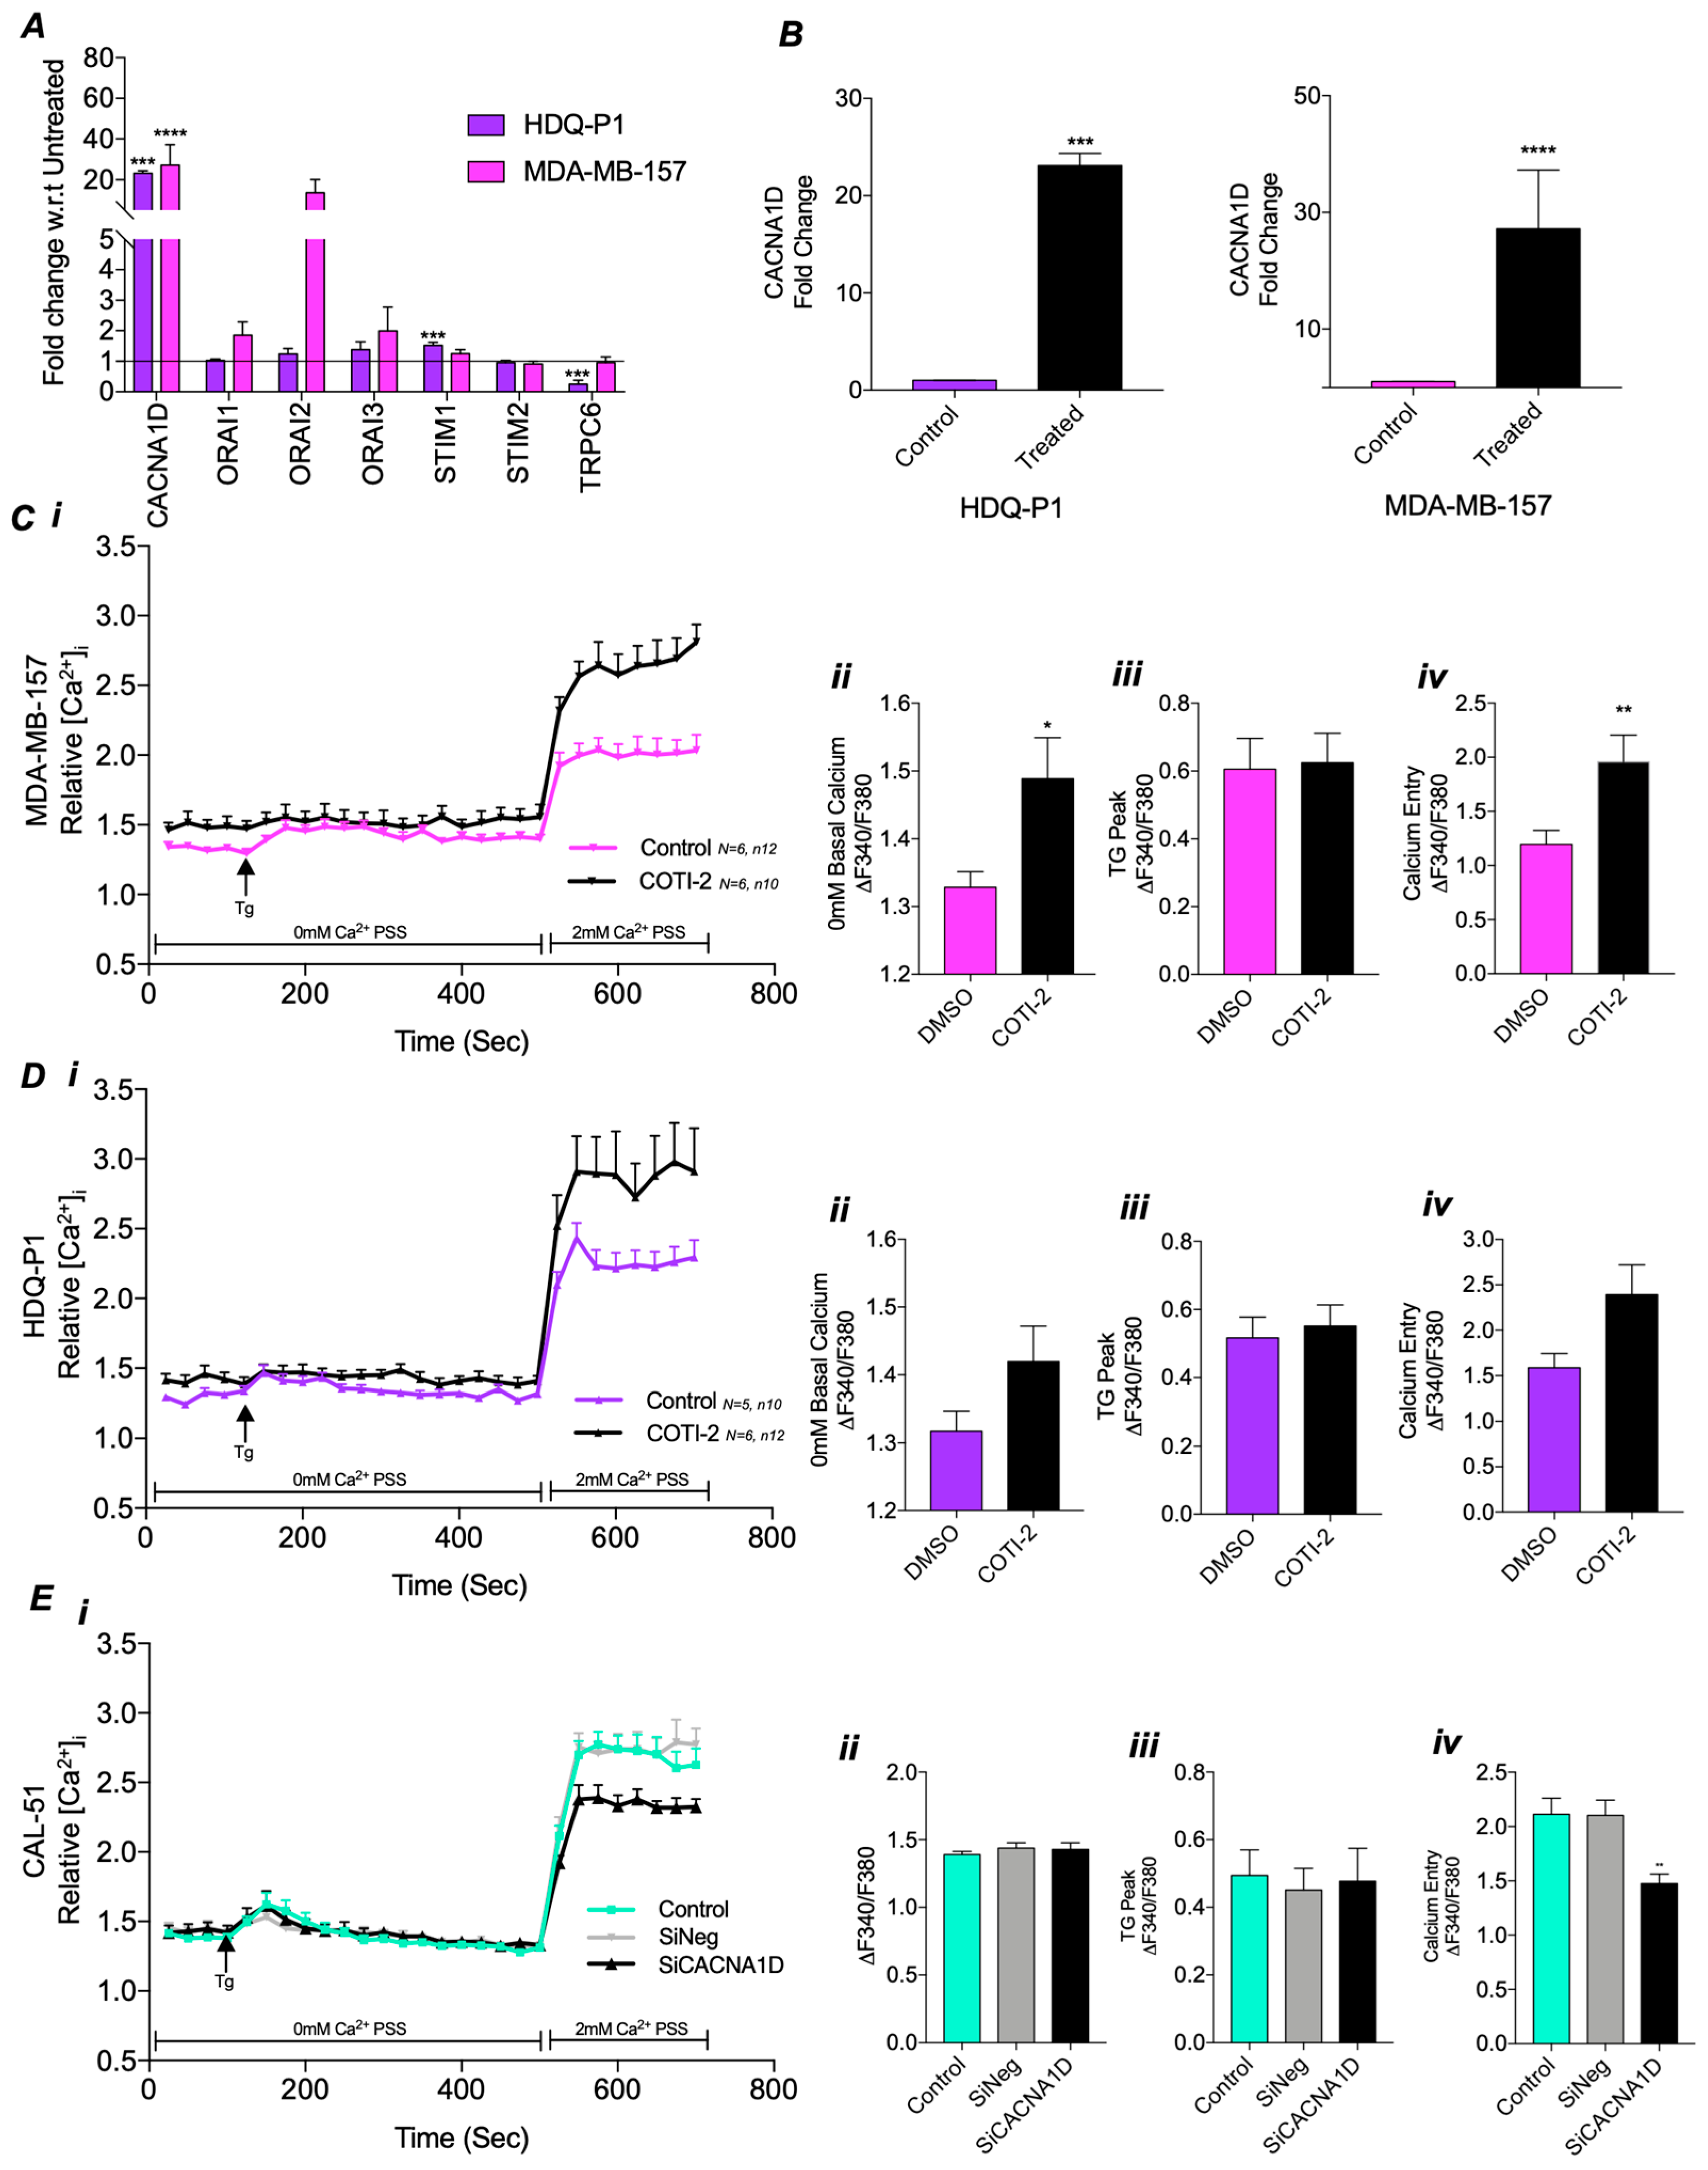
3.3. Mutant TP53 Modulates SOCE Through CACNA1D

To investigate if altered Ca2+ channel expression or SOCE dysregulation is associated with mutations in TP53, COTI-2, a p53 reactivator, was used. qPCR analysis demonstrated that the expression of Ca2+ channels associated with SOC was altered following COTI-2 treatment (Figure 3A). In particular, COTI-2 significantly increased CACNA1D expression by 22-fold in HDQ-P1 (p = 0.001) and 28-fold in MDA-MB-157 (p < 0.0001) compared to the untreated DMSO control (Figure 3B). However, in missense TP53 mutant lines, MFM-223 and MDA-MB-468, COTI-2 did not affect CANCA1D or other SOC channel expression (Figure S2A).
To evaluate the functional impact of the COTI-2-induced changes on Ca2+ channel expression, we measured SOC activity Figure 3C(i). In TP53 mutant MDA-MB-157 cells, COTI-2 treatment led to a significant increase in basal cytosolic Ca2+ levels (p < 0.05, Figure 3C(ii)) and SOCE (p < 0.01, Figure 3C(iv)), restoring levels similar to those observed in CAL-51 WT cells (Figure 2A). However, COTI-2 did not affect TG-induced ER store release (Figure 3C(iii)). Repeating the experiment with HDQ-P1 cells revealed similar increases in basal cytosolic Ca2+ levels (Figure 3D(ii)) and SOCE (Figure 3D(iv)), comparable to CAL-51, although these changes were not statistically significant. COTI-2 again failed to impact ER store release (Figure 3D(iii)). In contrast, no differences in SOC were observed between COTI-2-treated and DMSO control groups in missense mutant, MFM-223 and MDA-MB-468 cells (Figure S2B,C).
These results indicate a potential link between CACNA1D expression and SOC. To confirm this relationship, we used siRNA to knock down CACNA1D in TP53 WT CAL-51 cells, which have higher levels of CACNA1D expression and SOC. Knockdown was confirmed via qPCR, showing a significant 59% reduction in CACNA1D expression (p = 0.0286, Figure S3). SOC measurements in this knockdown model revealed a significant reduction in SOCE (p < 0.001, Figure 3E(iv)) compared to the siNegative control, reaching levels similar to those in stop and FS TP53 mutant cells (Figure 2A–D). However, no differences were observed in basal cytosolic Ca2+ or ER store release (Figure 3E(ii,iii)). These findings highlight that TP53 influences SOCE by regulating CACNA1D expression, with effects dependent on TP53 status.

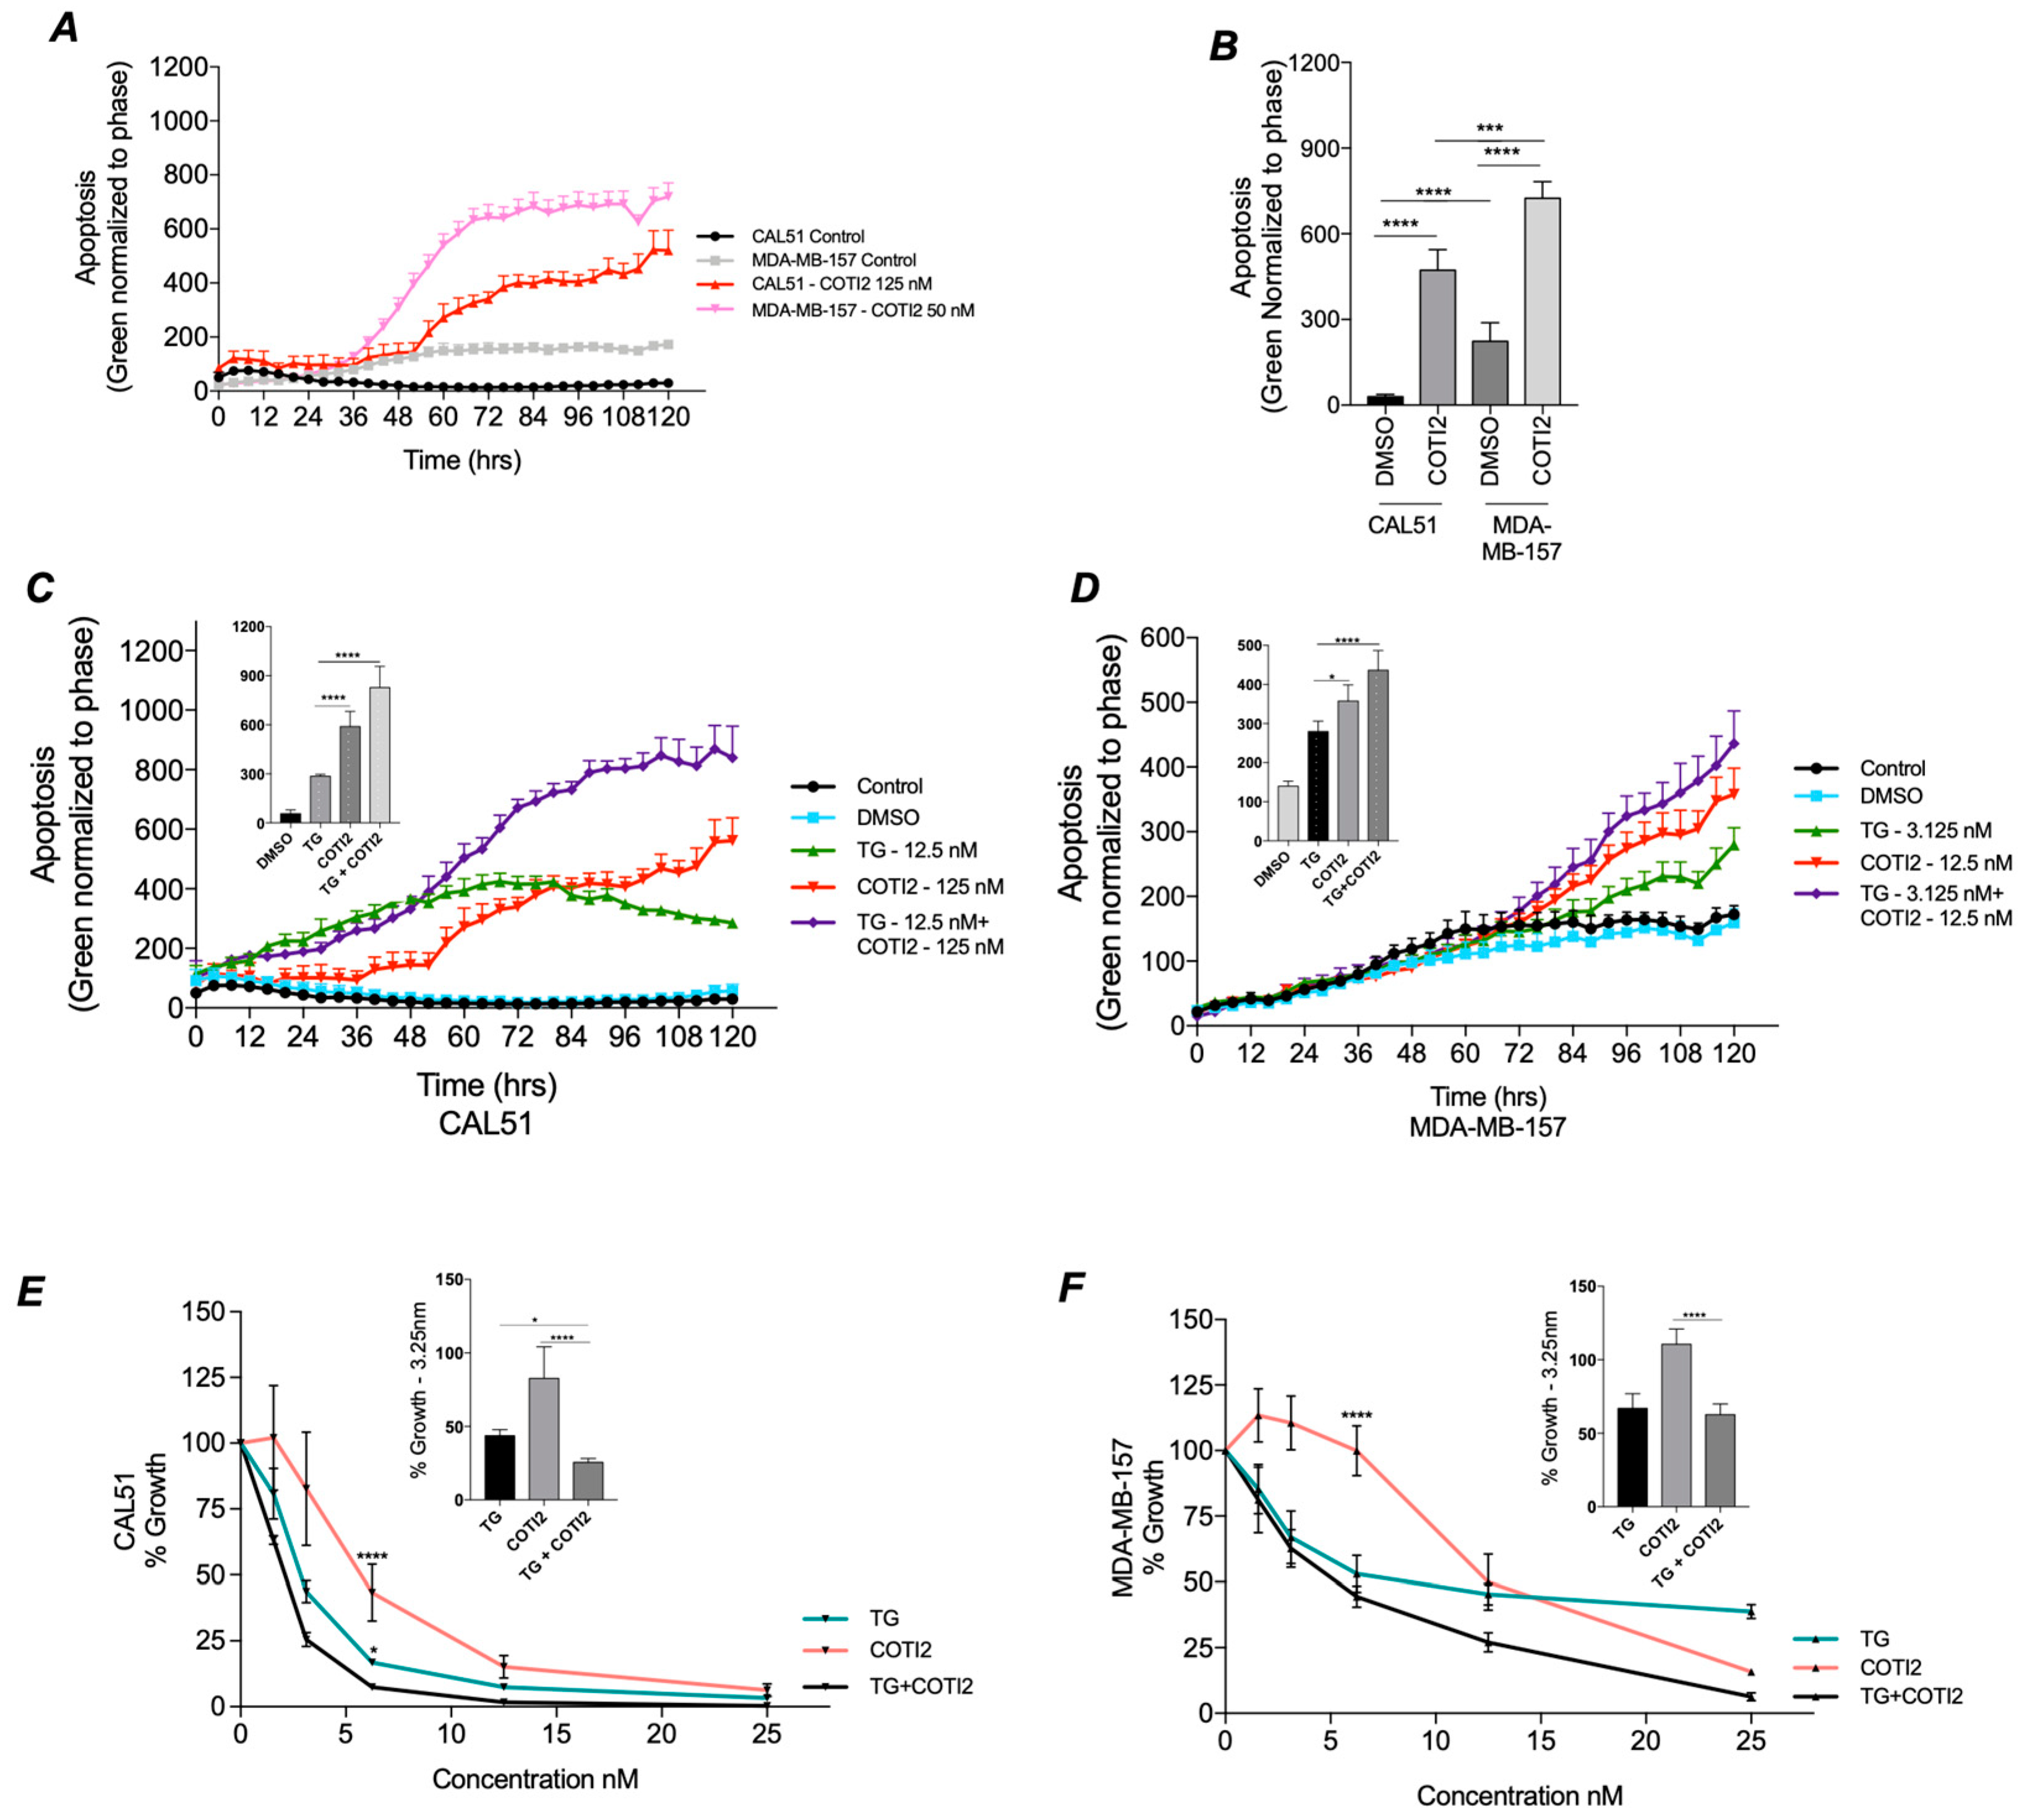
3.4. COTI-2 Increases Apoptosis and Sensitivity to Treatment in Both TP53 Wild-Type and Mutant TNBC

Our previous results demonstrated that deleterious TP53 mutants reduced SOC, leading to decreased proliferation. Since COTI-2 treatment restored CACNA1D expression and SOCE in the TP53 mutant MDA-MB-157 cell line (Figure 3), we investigated whether it could reverse apoptotic resistance. Measuring caspase 3/7 levels, it was observed that COTI-2 alone resulted in significant apoptotic induction in both CAL-51 (p < 0.0001) and MDA-MB-157 (p < 0.0001) at 120 h, with the TP53 mutant line displaying greater apoptotic sensitivity (p < 0.001, Figure 4A,B). This was corroborated by COTI-2 dose response curves, where MDA-MB-157 had a lower IC50 (16.3 nM) compared to CAL-51 (74.3 nM) (Figure S2B). Additionally, basal apoptosis levels were 7.6-fold higher in MDA-MB-157 than CAL-51 (p < 0.0001, Figure 4B). These results are potentially attributed to a greater restoration of TP53 expression/activity, which is lost in TP53 mutant cells.
Given the reduced anti-proliferative sensitivity of TP53 mutant lines to ER stressor TG (Figure 2E,F), we assessed whether combining TG with COTI-2 could restore apoptotic sensitivity (Figure 4C,D). Using TP53 WT CAL-51 as a control, TG and COTI-2 were tested at their IC50 concentrations for both cell lines (Figure S4A,B). In CAL-51 (Figure 4C), TG and COTI-2 each significantly increased apoptosis at 120 h versus DMSO control. In CAL-51 cells, the combination of TG and COTI-2, however, produced a synergistic response exceeding TG (p < 0.0001) or COTI-2 (p < 0.0001) alone. In TP53 Mutant MDA-MB-157 cells (Figure 4D), both TG and COTI-2 alone significantly increased apoptosis at 120 h versus DMSO control. Their combination again produced a synergistic increase in apoptosis compared to COTI-2 alone (p < 0.017) or TG alone (p < 0.0001). These results suggest that restoring SOC Ca2+ with COTI-2 enhances apoptosis, highlighting its potential for improving treatment sensitivity.
The combined impact of COTI-2 and TG on proliferation was also assessed. In CAL-51 combined TG and COTI-2 treatment produced a synergistic 75% reduction in proliferation (Figure 4E), exceeding the effects of TG alone (53%, p < 0.05) or COTI-2 alone (18%, p < 0.0001). In the TP53 mutant MDA-MB-157 line (Figure 4F), combined treatment with COTI-2 and TG produced an enhanced anti-proliferative effect, although this did not reach significance. These results corroborate our previous observations (Figure 2F) that MDA-MB-157 are less sensitive to TG treatment but exhibit synergistic responses when treated with TG and COTI-2.

4. Discussion

The prevalence of TP53 mutations in cancer is well established, particularly in triple-negative breast cancer (TNBC), with certain mutation types consistently associated with poorer clinical outcomes across multiple cancers. Recent research highlights that p53 plays a non-transcriptional role regulating apoptosis by modulating intracellular Ca2+ dynamics at the ER and mitochondria [18,26]. Dysregulation of this Ca2+-dependent mechanism has been linked to apoptotic resistance, a hallmark of cancer progression [27]. Despite the prevalence of TP53 mutations, their differential impact on p53-mediated Ca2+ signalling remains understudied. This study addresses this gap by investigating the effect of various TP53 mutations on Ca2+ channel gene expression, SOC, and their collective influence on TNBC apoptosis resistance. Our findings reveal that different TP53 mutations alter Ca2+ homeostasis, highlighting a critical link between TP53 status, SOCE dysregulation, and cancer progression.
Initial bioinformatic analysis identified a significant downregulation of CACNA1D in mutant TP53 samples, particularly in TNBC, which was the only Ca2+ channel gene consistently altered across both patient and cell line datasets. We also noted that reduced CACNA1D expression was associated with poorer disease-free survival in BC, a trend that was observed in TNBC but failed to reach significance, likely due to the low N numbers in this subset. Thus, this work highlights the clinical target to be of potential importance in BC and TNBC. To date, only one other study has examined the impact of TP53 status on ion channel expression in cancer [42]. Although this study was not TNBC focused, its findings align with ours, reporting downregulated CACNA1D expression in all BC TP53 mutant samples [42]. This provides further evidence that this effect is not just TNBC-specific but wider BC samples; however, this association between mutant TP53 and CACNA1D has not been observed in other cancer types, requiring further work.
It is well documented compared to WT that different TP53 mutant types are associated with varying negative impacts on patient outcomes and phenotypes in cancer, and specifically TNBC [39,40]. Consequently, we sought to investigate the impact of this on CACNA1D expression using a panel of TNBC cells harbouring various TP53 mutation types. We observed an upregulation of CACNA1D in cells harbouring missense mutations, but a downregulation in those with deleterious frameshift and stop mutations (Figure 1D). Intriguingly, CACNA1D mRNA expression also correlated with p53 protein levels, suggesting a relationship between both (Figure 1E). To our knowledge, this study is the first in cancer to propose a potential link between CACNA1D expression and p53, which is impacted by different TP53 mutations. To validate this, further work is needed to employ larger BC datasets to discern how specific TP53 mutations impact CACNA1D expression and clinical outcomes in TNBC patient samples.
Due to the altered Ca2+ channel expression in TP53 mutant TNBC cells, we sought to assess SOC in these models. Cell lines with stop and frameshift mutations showed reduced basal Ca2+ levels, ER store release, and SOCE, correlating with lower CACNA1D and p53 expression (Figure 1D,E and Figure 2A). In contrast, MDA-MB-468, harbouring a missense mutation, exhibited reduced basal Ca2+ and ER store release but increased SOCE, aligning with higher CACNA1D and TP53 expression. TNBC cells with stop and frameshift TP53 mutations had reduced proliferation rates and apoptotic sensitivity, while MDA-MB-468, which has a TP53 SNV displayed increased levels of both (Figure 2E,F).
To confirm TP53’s role in regulating SOCE through CACNA1D, we treated TP53 frameshift and stop mutated cell lines, which exhibited reduced p53 expression, with the p53 reactivator COTI-2. COTI-2 is a third-generation thiosemicarbazone that has been found to restore p53 protein expression and activity [36,43]. Upregulated CACNA1D expression in HDPQ-1 and MDA-MB-157 cells was associated with increased basal Ca2+ and SOCE, in MDA-MB-157 (Figure 3). This result aligns with previous studies demonstrating that p53 influences Ca2+ channel expression, particularly TRPC6 and TRPM4, which also impacted intracellular Ca2+ levels. Further validation using CACNA1D knockdown in TP53 WT CAL-51 cells (Figure 3E) significantly reduced SOCE, confirming its role in SOCE regulation. While no prior studies have demonstrated that TP53 modulates CACNA1D expression to regulate SOCE, earlier research has shown that CACNA1D can influence SOCE in colon and prostate cancers, despite its conventional role as a voltage-gated Ca2+ channel [37,44].
Furthermore, there are few studies examining the effects of TP53 mutations more generally on SOC in cancer. Giorgi et al. (2015) demonstrated in mouse embryonic fibroblasts that p53 knockout reduced mitochondrial Ca2+ levels, leading to apoptotic resistance to ER stressors [27]. Conversely, a study in colon cancer HCT-116 cells found no difference in SOC profiles between TP53 WT and the missense mutation R175H [45]. However, they noted in their model that TP53 overexpression significantly increased SOCE. Together, these findings, along with our study, highlight that p53 impacts SOC and that CACNA1D and TP53 expression are closely linked to SOCE, but the effect varies depending on the mutation type. These findings underscore the need for further research using controlled models to better delineate the effects of specific TP53 mutations on intracellular Ca2+ dynamics.
Previous studies have demonstrated that reduced intracellular Ca2+ levels correlate with diminished apoptotic capacity [46,47], and TP53 mutations are generally associated with chemotherapy resistance [48,49]. Our study aimed to investigate the impact of the TP53/Ca2+ axis on apoptosis resistance and whether restoring p53 function could reverse these effects. Focusing on TP53 FS mutant cells, which exhibited significantly reduced TP53, CACNA1D, and SOC activity, we compared their response to TP53 WT cells. Notably, treatment with a p53 reactivator significantly enhanced apoptosis in both TP53 mutant and WT TNBC cells (Figure 4). Importantly, the combination of COTI-2 and TG elicited a synergistic apoptotic response across both cell lines, particularly in the MDA-MB-157 TP53 mutant cell line. This demonstrates that impaired apoptotic signalling in TP53 FS mutant cells could be restored via TP53 reactivation, which enhanced both CACNA1D expression and SOCE (Figure 5). Highlight targeting the Ca2+ machinery could be beneficial in restoring apoptosis capacity and enhancing responses to existing treatments in TP53 mutant TNBC.
Our findings align with previous research demonstrating that COTI-2 exerts anti-proliferative effects in head and neck squamous cell carcinoma, ovarian and BC cell lines, including TNBC, both in vitro and in vivo [34,43,50,51]. Specifically, Synott et al. (2019) reported that COTI-2 preferentially induces apoptosis in TNBC cell lines, with lower IC50 values in p53 mutant cells compared to WT, mirroring our IC50 results (Figure S4B) [36]. While prior studies have highlighted COTI-2’s role in inducing apoptosis, to our knowledge, this is the first study to link its effects to enhanced CACNA1D-mediated SOC activity. While COTI-2 has demonstrated greater potency than other p53 reactivators such as APR-246, and superior specificity compared to broader compounds such as α-mangostin [35,36], further studies using a panel of these agents are needed to determine if they differentially affect SOC activity.

5. Conclusions

This study identifies a novel link between TP53 mutations, Ca2+ channel expression, and altered SOCE in TNBC. We demonstrated that TP53 mutation type significantly impacts Ca2+ signalling, with frameshift and stop mutations resulting in reduced expression of CACNA1D (encoding CaV1.3) and diminished SOCE. Restoration of TP53 function using COTI-2 not only reinstated CaV1.3 expression and SOCE but also sensitised TP53 mutant TNBC cells to apoptosis, highlighting the therapeutic potential of targeting dysregulated Ca2+ signalling pathways.
These findings underscore the importance of Ca2+ signalling in the context of TP53 mutations, particularly the differential effects of distinct mutation types. Further studies in controlled TNBC models could help clarify the mechanistic links between TP53 mutation subtypes, Ca2+ signalling, and therapeutic responses, while validating the combined use of TP53 reactivators and Ca2+ modulators as a potential treatment strategy.

Supplementary Materials

The following supporting information can be downloaded at: https://www.mdpi.com/article/10.3390/cancers17101614/s1. Table S1: Primer sequences used to determine gene expression using RT-qPCR. Figure S1: Impact of low or high CACNA1D expression on disease free and overall survival in BC. Figure S2: Effect of COTI-2 treatment on calcium channel expression and SOCE in missense TP53 mutant TNBC cell lines. Figure S3: CACNA1D expression after siRNA knockdown. Figure S4: IC50 analysis for TG and COTI-2 in CAL-51 and MDA-MB-157 cells.

Author Contributions

Conceptualization, P.J.B. and A.J.E.; Data curation, K.E.R., A.W. and G.C.; Formal analysis, K.E.R., G.C., A.J.E. and P.J.B.; Funding acquisition, A.J.E.; Investigation, G.C., A.W., A.M. and C.M.; Methodology, G.C., A.W., A.M. and C.M.; Project administration, P.J.B. and A.J.E.; Resources, P.J.B. and A.J.E.; Supervision, P.J.B., A.J.E., K.E.R. and A.W.; Writing—original draft, K.E.R.; Writing—review and editing, P.J.B., and A.J.E. All authors have read and agreed to the published version of the manuscript.

Funding

This work was supported by the Health Research Board Emerging Investigators Award 2019, which was granted to Dr. Alex Eustace (EAI-2019-013).

Institutional Review Board Statement

No institutional review was required for this study.

Informed Consent Statement

No informed consent was required for this study.

Data Availability Statement

The data presented in this study are available on request from the corresponding author.

Conflicts of Interest

Alex Eustace reports financial support was provided by the Health Research Board EAI-2019-013. The other authors declare that they have no known competing financial interests or personal relationships that could have appeared to influence the work reported in this paper.

Abbreviations

AC All Cancer
BC Breast cancer
CCLE Cancer Cell Line Encyclopaedia
DEADifferential expression analyses
DEGDifferentially expressed genes
DGEA Differential Gene Expression Analysis
ER Estrogen receptor
FBSFetal Bovine Serum
FSFrameshift
HER2Human epidermal growth factor receptor 2
LFCLog2 fold change
MutMutant
PMPlasma Membrane
PRProgesterone receptor
SERCASarcoendoplasmic Reticulum Calcium ATPase pump
SNVSingle Nucleotide Variant
SOCStore operated current
SOCEStore operated calcium entry
TCGAThe Cancer Genome Atlas
TGThapsigargin
TNBCTriple negative breast cancer
TP53Tumour protein 53
TRP Transient receptor potential channel
TSGTumour suppressor gene
WT Wild-type

References

  1. Bray, F.; Laversanne, M.; Sung, H.; Ferlay, J.; Siegel, R.L.; Soerjomataram, I.; Jemal, A. Global Cancer Statistics 2022: GLOBOCAN Estimates of Incidence and Mortality Worldwide for 36 Cancers in 185 Countries. CA Cancer J. Clin. 2024, 74, 229–263. [Google Scholar] [CrossRef] [PubMed]
  2. Bou Zerdan, M.; Ghorayeb, T.; Saliba, F.; Allam, S.; Bou Zerdan, M.; Yaghi, M.; Bilani, N.; Jaafar, R.; Nahleh, Z. Triple Negative Breast Cancer: Updates on Classification and Treatment in 2021. Cancers 2022, 14, 1253. [Google Scholar] [CrossRef] [PubMed]
  3. Bianchini, G.; Balko, J.M.; Mayer, I.A.; Sanders, M.E.; Gianni, L. Triple-Negative Breast Cancer: Challenges and Opportunities of a Heterogeneous Disease. Nat. Rev. Clin. Oncol. 2016, 13, 674–690. [Google Scholar] [CrossRef]
  4. Lakin, N.D.; Jackson, S.P. Regulation of P53 in Response to DNA Damage. Oncogene 1999, 18, 7644–7655. [Google Scholar] [CrossRef]
  5. Abuetabh, Y.; Wu, H.H.; Chai, C.; Al Yousef, H.; Persad, S.; Sergi, C.M.; Leng, R. DNA Damage Response Revisited: The P53 Family and Its Regulators Provide Endless Cancer Therapy Opportunities. Exp. Mol. Med. 2022, 54, 1658–1669. [Google Scholar] [CrossRef] [PubMed]
  6. Duffy, M.J.; Synnott, N.C.; Crown, J. Mutant P53 as a Target for Cancer Treatment. Eur. J. Cancer 2017, 83, 258–265. [Google Scholar] [CrossRef]
  7. Tate, J.G.; Bamford, S.; Jubb, H.C.; Sondka, Z.; Beare, D.M.; Bindal, N.; Boutselakis, H.; Cole, C.G.; Creatore, C.; Dawson, E.; et al. COSMIC: The Catalogue Of Somatic Mutations In Cancer. Nucleic Acids Res. 2019, 47, D941–D947. [Google Scholar] [CrossRef]
  8. Hu, J.; Cao, J.; Topatana, W.; Juengpanich, S.; Li, S.; Zhang, B.; Shen, J.; Cai, L.; Cai, X.; Chen, M. Targeting Mutant P53 for Cancer Therapy: Direct and Indirect Strategies. J. Hematol. Oncol. 2021, 14, 157. [Google Scholar] [CrossRef]
  9. Muller, P.A.J.; Vousden, K.H. P53 Mutations in Cancer. Nat. Cell Biol. 2013, 15, 2–8. [Google Scholar] [CrossRef]
  10. Mantovani, F.; Collavin, L.; Del Sal, G. Mutant P53 as a Guardian of the Cancer Cell. Cell Death Differ. 2019, 26, 199–212. [Google Scholar] [CrossRef]
  11. Duffy, M.J.; Crown, J. Drugging “Undruggable” Genes for Cancer Treatment: Are We Making Progress? Int. J. Cancer 2021, 148, 8–17. [Google Scholar] [CrossRef]
  12. Duffy, M.J.; Synnott, N.C.; O’Grady, S.; Crown, J. Targeting P53 for the Treatment of Cancer. Semin. Cancer Biol. 2022, 79, 58–67. [Google Scholar] [CrossRef] [PubMed]
  13. Synnott, N.C.; Bauer, M.R.; Madden, S.; Murray, A.; Klinger, R.; O’Donovan, N.; O’Connor, D.; Gallagher, W.M.; Crown, J.; Fersht, A.R.; et al. Mutant P53 as a Therapeutic Target for the Treatment of Triple-Negative Breast Cancer: Preclinical Investigation with the Anti-P53 Drug, PK11007. Cancer Lett. 2018, 414, 99–106. [Google Scholar] [CrossRef] [PubMed]
  14. Peng, J.; Yang, M.; Bi, R.; Wang, Y.; Wang, C.; Wei, X.; Zhang, Z.; Xie, X.; Wei, W. Targeting Mutated P53 Dependency in Triple-Negative Breast Cancer Cells Through CDK7 Inhibition. Front. Oncol. 2021, 11, 664848. [Google Scholar] [CrossRef] [PubMed]
  15. Garcia-Manero, G.; Goldberg, A.D.; Winer, E.S.; Altman, J.K.; Fathi, A.T.; Odenike, O.; Roboz, G.J.; Sweet, K.; Miller, C.; Wennborg, A.; et al. Eprenetapopt Combined with Venetoclax and Azacitidine in TP53-Mutated Acute Myeloid Leukaemia: A Phase 1, Dose-Finding and Expansion Study. Lancet Haematol. 2023, 10, e272–e283. [Google Scholar] [CrossRef]
  16. Riley, T.; Sontag, E.; Chen, P.; Levine, A. Transcriptional Control of Human P53-Regulated Genes. Nat. Rev. Mol. Cell Biol. 2008, 9, 402–412. [Google Scholar] [CrossRef]
  17. Wolter, K.G.; Hsu, Y.-T.; Smith, C.L.; Nechushtan, A.; Xi, X.-G.; Youle, R.J. Movement of Bax from the Cytosol to Mitochondria during Apoptosis. J. Cell Biol. 1997, 139, 1281–1292. [Google Scholar] [CrossRef]
  18. Eustace, A.J.; Lee, M.J.; Colley, G.; Roban, J.; Downing, T.; Buchanan, P.J. Aberrant Calcium Signalling Downstream of Mutations in TP53 and the PI3K/AKT Pathway Genes Promotes Disease Progression and Therapy Resistance in Triple Negative Breast Cancer. Cancer Drug Resist. 2022, 5, 560–576. [Google Scholar] [CrossRef]
  19. Prakriya, M.; Lewis, R.S. Store-Operated Calcium Channels. Physiol. Rev. 2015, 95, 1383–1436. [Google Scholar] [CrossRef]
  20. So, C.L.; Saunus, J.M.; Roberts-Thomson, S.J.; Monteith, G.R. Calcium Signalling and Breast Cancer. Semin. Cell Dev. Biol. 2019, 94, 74–83. [Google Scholar] [CrossRef]
  21. Bantsimba-Malanda, C.; Ahidouch, A.; Rodat-Despoix, L.; Ouadid-Ahidouch, H. Calcium Signal Modulation in Breast Cancer Aggressiveness. Cell Calcium 2023, 113, 102760. [Google Scholar] [CrossRef]
  22. Pratt, S.J.P.; Hernández-Ochoa, E.; Martin, S.S. Calcium Signaling: Breast Cancer’s Approach to Manipulation of Cellular Circuitry. Biophys. Rev. 2020, 12, 1343–1359. [Google Scholar] [CrossRef] [PubMed]
  23. Monteith, G.R.; Prevarskaya, N.; Roberts-Thomson, S.J. The Calcium–Cancer Signalling Nexus. Nat. Rev. Cancer 2017, 17, 367–380. [Google Scholar] [CrossRef]
  24. Romito, O.; Guéguinou, M.; Raoul, W.; Champion, O.; Robert, A.; Trebak, M.; Goupille, C.; Potier-Cartereau, M. Calcium Signaling: A Therapeutic Target to Overcome Resistance to Therapies in Cancer. Cell Calcium 2022, 108, 102673. [Google Scholar] [CrossRef] [PubMed]
  25. Kumari, N.; Pullaguri, N.; Rath, S.N.; Bajaj, A.; Sahu, V.; Ealla, K.K.R. Dysregulation of Calcium Homeostasis in Cancer and Its Role in Chemoresistance. Cancer Drug Resist 2024, 7, 11. [Google Scholar] [CrossRef]
  26. Bittremieux, M.; Bultynck, G. P53 and Ca2+ Signaling from the Endoplasmic Reticulum: Partners in Anti-Cancer Therapies. Oncoscience 2015, 2, 233–238. [Google Scholar] [CrossRef] [PubMed]
  27. Giorgi, C.; Bonora, M.; Sorrentino, G.; Missiroli, S.; Poletti, F.; Suski, J.M.; Galindo Ramirez, F.; Rizzuto, R.; Di Virgilio, F.; Zito, E.; et al. P53 at the Endoplasmic Reticulum Regulates Apoptosis in a Ca2+-Dependent Manner. Proc. Natl. Acad. Sci. USA 2015, 112, 1779–1784. [Google Scholar] [CrossRef]
  28. Madan, E.; Gogna, R.; Keppler, B.; Pati, U. P53 Increases Intra-Cellular Calcium Release by Transcriptional Regulation of Calcium Channel TRPC6 in GaQ3-Treated Cancer Cells. PLoS ONE 2013, 8, e71016. [Google Scholar] [CrossRef]
  29. Giorgi, C.; Bonora, M.; Missiroli, S.; Poletti, F.; Ramirez, F.G.; Morciano, G.; Morganti, C.; Pandolfi, P.P.; Mammano, F.; Pinton, P. Intravital Imaging Reveals P53-Dependent Cancer Cell Death Induced by Phototherapy via Calcium Signaling. Oncotarget 2014, 6, 1435–1445. [Google Scholar] [CrossRef]
  30. Wang, C.S.; Goulet, F.; Lavoie, J.; Drouin, R.; Auger, F.; Champetier, S.; Germain, L.; Têtu, B. Establishment and Characterization of a New Cell Line Derived from a Human Primary Breast Carcinoma. Cancer Genet. Cytogenet. 2000, 120, 58–72. [Google Scholar] [CrossRef]
  31. Lacroix, M.; Toillon, R.-A.; Leclercq, G. P53 and Breast Cancer, an Update. Endocr.-Relat. Cancer 2006, 13, 293–325. [Google Scholar] [CrossRef] [PubMed]
  32. Lehmann, B.D.; Bauer, J.A.; Chen, X.; Sanders, M.E.; Chakravarthy, A.B.; Shyr, Y.; Pietenpol, J.A. Identification of Human Triple-Negative Breast Cancer Subtypes and Preclinical Models for Selection of Targeted Therapies. J. Clin. Investig. 2011, 121, 2750–2767. [Google Scholar] [CrossRef]
  33. Maleki Vareki, S.; Salim, K.Y.; Danter, W.R.; Koropatnick, J. Novel Anti-Cancer Drug COTI-2 Synergizes with Therapeutic Agents and Does Not Induce Resistance or Exhibit Cross-Resistance in Human Cancer Cell Lines. PLoS ONE 2018, 13, e0191766. [Google Scholar] [CrossRef] [PubMed]
  34. Salim, K.Y.; Vareki, S.M.; Danter, W.R.; San-Marina, S.; Koropatnick, J. Correction: COTI-2, a Novel Small Molecule That Is Active against Multiple Human Cancer Cell Lines in Vitro and in Vivo. Oncotarget 2017, 8, 60724. [Google Scholar] [CrossRef]
  35. Alam, M.; Rashid, S.; Fatima, K.; Adnan, M.; Shafie, A.; Akhtar, M.S.; Ganie, A.H.; Eldin, S.M.; Islam, A.; Khan, I.; et al. Biochemical Features and Therapeutic Potential of α-Mangostin: Mechanism of Action, Medicinal Values, and Health Benefits. Biomed. Pharmacother. 2023, 163, 114710. [Google Scholar] [CrossRef] [PubMed]
  36. Synnott, N.C.; O’Connell, D.; Crown, J.; Duffy, M.J. COTI-2 Reactivates Mutant P53 and Inhibits Growth of Triple-Negative Breast Cancer Cells. Breast Cancer Res Treat 2020, 179, 47–56. [Google Scholar] [CrossRef]
  37. O’Reilly, D.; Downing, T.; Kouba, S.; Potier-Cartereau, M.; McKenna, D.J.; Vandier, C.; Buchanan, P.J. CaV1.3 Enhanced Store Operated Calcium Promotes Resistance to Androgen Deprivation in Prostate Cancer. Cell Calcium 2022, 103, 102554. [Google Scholar] [CrossRef]
  38. Martin, A.; Clynes, M. Acid Phosphatase: Endpoint for in Vitro Toxicity Tests. Vitr. Cell. Dev. Biol.-Anim. 1991, 27, 183–184. [Google Scholar] [CrossRef]
  39. Chen, X.; Zhang, T.; Su, W.; Dou, Z.; Zhao, D.; Jin, X.; Lei, H.; Wang, J.; Xie, X.; Cheng, B.; et al. Mutant P53 in Cancer: From Molecular Mechanism to Therapeutic Modulation. Cell Death Dis. 2022, 13, 974. [Google Scholar] [CrossRef]
  40. Pal, A.; Gonzalez-Malerva, L.; Eaton, S.; Xu, C.; Zhang, Y.; Grief, D.; Sakala, L.; Nwekwo, L.; Zeng, J.; Christensen, G.; et al. Multidimensional Quantitative Phenotypic and Molecular Analysis Reveals Neomorphic Behaviors of P53 Missense Mutants. npj Breast Cancer 2023, 9, 78. [Google Scholar] [CrossRef]
  41. Patergnani, S.; Danese, A.; Bouhamida, E.; Aguiari, G.; Previati, M.; Pinton, P.; Giorgi, C. Various Aspects of Calcium Signaling in the Regulation of Apoptosis, Autophagy, Cell Proliferation, and Cancer. Int. J. Mol. Sci. 2020, 21, 8323. [Google Scholar] [CrossRef] [PubMed]
  42. Ko, J.-H.; Ko, E.A.; Gu, W.; Lim, I.; Bang, H.; Zhou, T. Expression Profiling of Ion Channel Genes Predicts Clinical Outcome in Breast Cancer. Mol. Cancer 2013, 12, 106. [Google Scholar] [CrossRef]
  43. Lindemann, A.; Patel, A.A.; Silver, N.L.; Tang, L.; Liu, Z.; Wang, L.; Tanaka, N.; Rao, X.; Takahashi, H.; Maduka, N.K.; et al. COTI-2, A Novel Thiosemicarbazone Derivative, Exhibits Antitumor Activity in HNSCC through P53-Dependent and -Independent Mechanisms. Clin. Cancer Res. 2019, 25, 5650–5662. [Google Scholar] [CrossRef]
  44. Fourbon, Y.; Guéguinou, M.; Félix, R.; Constantin, B.; Uguen, A.; Fromont, G.; Lajoie, L.; Magaud, C.; Lecomte, T.; Chamorey, E.; et al. Ca2+ Protein Alpha 1D of CaV1.3 Regulates Intracellular Calcium Concentration and Migration of Colon Cancer Cells through a Non-Canonical Activity. Sci. Rep. 2017, 7, 14199. [Google Scholar] [CrossRef]
  45. Kappel, S.; Ross-Kaschitza, D.; Hauert, B.; Rother, K.; Peinelt, C. P53 Alters Intracellular Ca2+ Signaling through Regulation of TRPM4. Cell Calcium 2022, 104, 102591. [Google Scholar] [CrossRef] [PubMed]
  46. Dubois, C.; Vanden Abeele, F.; Prevarskaya, N. Targeting Apoptosis by the Remodelling of Calcium-Transporting Proteins in Cancerogenesis. FEBS J. 2013, 280, 5500–5510. [Google Scholar] [CrossRef]
  47. Moon, D.-O. Calcium’s Role in Orchestrating Cancer Apoptosis: Mitochondrial-Centric Perspective. Int. J. Mol. Sci. 2023, 24, 8982. [Google Scholar] [CrossRef] [PubMed]
  48. Zhu, G.; Pan, C.; Bei, J.-X.; Li, B.; Liang, C.; Xu, Y.; Fu, X. Mutant P53 in Cancer Progression and Targeted Therapies. Front. Oncol. 2020, 10, 595187. [Google Scholar] [CrossRef]
  49. Zhou, X.; Hao, Q.; Lu, H. Mutant P53 in Cancer Therapy-The Barrier or the Path. J. Mol. Cell Biol. 2019, 11, 293–305. [Google Scholar] [CrossRef]
  50. Mihara, M.; Erster, S.; Zaika, A.; Petrenko, O.; Chittenden, T.; Pancoska, P.; Moll, U.M. P53 Has a Direct Apoptogenic Role at the Mitochondria. Mol. Cell 2003, 11, 577–590. [Google Scholar] [CrossRef]
  51. Guo, Y.; Zhu, X.; Sun, X. COTI-2 Induces Cell Apoptosis in Pediatric Acute Lymphoblastic Leukemia via Upregulation of miR-203. Bioengineered 2020, 11, 201–208. [Google Scholar] [CrossRef] [PubMed]
Figure 1. Differential calcium channel gene expression in TNBC TP53 mutant patient samples and cell line versus TP53 wildtype. (A) Differential expression analyses (DEAs) carried out using CCLE breast cancer cell line microarray data and TCGA patient sample RNA-sequencing data. (i) The CCLE volcano plot illustrates the DEGs (Dots) when comparing TNBC TP53 MUT (n = 20) vs. all BC subtype WT (n = 13) with 372 significantly upregulated (lfc ≥ 2, BH-adj. p-value ≤ 0.01) and 168 significantly downregulated (lfc ≤ −2, BH-adj. p-value ≤ 0.01) genes. and (ii) the TCGA volcano plot illustrates the DEGs when comparing TNBC TP53 MUT (n = 142) vs. all BC subtypes WT (n = 658) samples with 2282 significantly upregulated and 1389 significantly downregulated genes. (B) (i) Differentially expressed genes from the CCLE BC and TCGA BC analyses were cross-analysed using a Venn diagram to identify overlapping targets between datasets. (ii) Calcium channel genes were searched for in the overlapping targets, with only CACNA1D identified as significantly differentially expressed, with details displayed in a table with relevant lfc, p-value, and p-adj (BH-adjusted). (C) Bar graph displaying relative fold change of calcium channel gene expression in TP53 mutant TNBC cell lines HDQ-P1 (red) and MDA-MB-157 (blue) with respect to (w.r.t.) to TP53 wild-type TNBC cell line CAL-51 using qRT-PCR. (D) shows the gene expression of CACNA1D in expanded panel of TNBC cell lines include missense mutants, MFM223 and MDA-MB-468 (n = 4). Kruskal-Wallis with Dunn’s multiple comparisons was used to determine significance. (E) Table outlining the cell lines used in this study, including their corresponding TP53 mutation status and type, as well as associated p53 protein expression levels retrieved from the CCLE.
Cancers 17 01614 g001
Figure 2. SOC and tumour biology is altered in TP53 mutant TNBC cell lines compared to WT. (A) Traces of SOC were measured in TNBC cell lines, either TP53 WT CAL-51 (black, n = 7) or mutant HDQ-P1 (red, n = 8), MDA-MB-157 (blue, n = 7), MFM-223 (Purple, n = 4) and MDA-MB-468 (Cyan, n = 4). ER Store release was induced by 4 μM TG and SOCE by the addition of 2 mM Ca2+. Trace analysis measured (B) basal calcium in 0 mM Ca2+, (C) TG peak and (D) SOCE peak between cell lines. (E) Presents the rate of proliferation read-out from the acid-phosphatase assay in TP53 mutant TNBC cell lines compared to the TP53 wild-type TNBC cell line (n16, n = 4). (F) Displays percentage growth inhibition after treatment with ER stressor thapsigargin (100nM, TG) for 5 days compared to DMSO control as measured by acid-phosphatase assay. For all above Kruskal-Wallis with Dunn’s multiple comparisons was used to determine the significance.
Cancers 17 01614 g002
Figure 3. Impact of CACNA1D manipulation through COTI-2 treatment or siRNA on calcium channel expression and SOC in TP53 mutant TNBC cell lines. (A) Effect of COTI-2 treatment on relative fold change gene expression of calcium channels using qRT-PCR in HDQ-P1 cells (purple) and MDA-MB-157 cells (pink) compared to untreated control. (B) Individual graphs of CANCA1D relative fold change gene expression in COTI-2 treated TP53 mutant cells vs untreated. SOC measured by Fura-2AM ratiometeric in (C) HDQ-P1 or (D) MDA-MB-157 as displayed as a trace over time(s) (i) compared to DMSO control, with individual analysis displaying (ii) average baseline 0 mM calcium, (iii) max TG peak and (iv) SOCE. Mann-Whitney was used for all above comparing two groups. (E) SOC trace for CAL-51 following (Ei) CACNA1D siRNA compared to siNegative or untreated control with individual analysis displaying (ii) average baseline 0 mM calcium, (iii) max TG peak and (iv) SOCE. Kruskal-Wallis with Dunn’s multiple comparisons was used for analysis in (E).
Cancers 17 01614 g003
Figure 4. Impact of COTI-2 and TG treatment on Apoptosis. TP53 wildtype CAL-51 and TP53 mutant MDA-MB-157 cells were analyzed for apoptosis following TG and COTI-2 treatment along with DMSO and untreated controls in duplicates. Using the caspase 3/7 dye, apoptosis was recorded every 4 h over a period of 5 days. (A) Shows a trace of apoptotic induction in CAL-51 and MDA-MB-157 in the presence and absence of COTI-2. (B). Responses to (An) at 120 h where graphed and analysed by Mann-Whitney. Apoptosis traces in CAL51 (C) and MDA-MB-157 (D) cells under control (black), DMSO (blue), thapsigargin (TG; green), COTI-2 (red), and combined TG+COTI-2 (purple) treatments are shown. Analysed by Two-way ANOVA Post hoc Tukey. Cell proliferation rates after treatment with TG (green), COTI-2 (red) and TG+COTI-2 (black) measured by acid phosphatase in (E) TP53 WT CAL-51 and (F) T53 mutant MDA-MB-157, with bar graph analysis at 3.125nm. Analysed by One-way ANOVA with post hoc.
Cancers 17 01614 g004
Figure 5. Schematic representation of TP53 mutation-dependent regulation of Ca2+ homeostasis and apoptosis via CACNA1D/Cav1.3 modulation in TNBC. Left (TP53 WT): In wild-type TP53 cells, cellular stress (e.g., chemotherapy, hypoxia) activates p53, which upregulates CACNA1D (CaV1.3), leading to increased basal Ca2+ levels. Functional SERCA pumps and IP3Rs ensure proper ER Ca2+ handling and mitochondrial Ca2+ transfer, resulting in mitochondrial Ca2+ overload and apoptosis. Middle (TP53 mutant): In TP53 mutant cells (frameshift/stop), impaired p53 function leads to downregulation of Cav1.3 and SERCA activity, reducing basal and ER Ca2+ levels and limiting mitochondrial Ca2+ uptake. This dampens Ca2+-dependent apoptotic signaling, promoting apoptotic resistance. Right (TP53 mutant + COTI-2): Treatment with the p53 reactivator COTI-2 restores p53 activity in TP53 mutant cells, increasing Cav1.3 expression and basal Ca2+ levels. Enhanced Ca2+ transfer to mitochondria reinstates mitochondrial Ca2+ overload and apoptotic signaling, reversing apoptosis resistance.
Cancers 17 01614 g005
Disclaimer/Publisher’s Note: The statements, opinions and data contained in all publications are solely those of the individual author(s) and contributor(s) and not of MDPI and/or the editor(s). MDPI and/or the editor(s) disclaim responsibility for any injury to people or property resulting from any ideas, methods, instructions or products referred to in the content.

