
Impact of Early Nutritional Intervention During Cancer Treatment on Dietary Intakes and Cardiometabolic Health in Children and Adolescents

 , , and
Simple Summary
Abstract
1. Introduction
2. Materials and Methods
2.1. Study Design and Ethics
2.2. Recruitment of Participants
2.2.1. Intervention Group
2.2.2. Control Group
2.3. Components of the VIE Intervention
2.3.1. Nutritional Intervention
2.3.2. Physical Activity Intervention
2.3.3. Psychosocial Intervention
2.4. Data Collection
2.4.1. Demographic, Diagnostic, and Treatment-Related Data
2.4.2. Nutritional Data
2.4.3. Anthropometric Data
2.4.4. Biochemical Assessment and Cardiometabolic Risk Factors
2.5. Data Analysis
3. Results
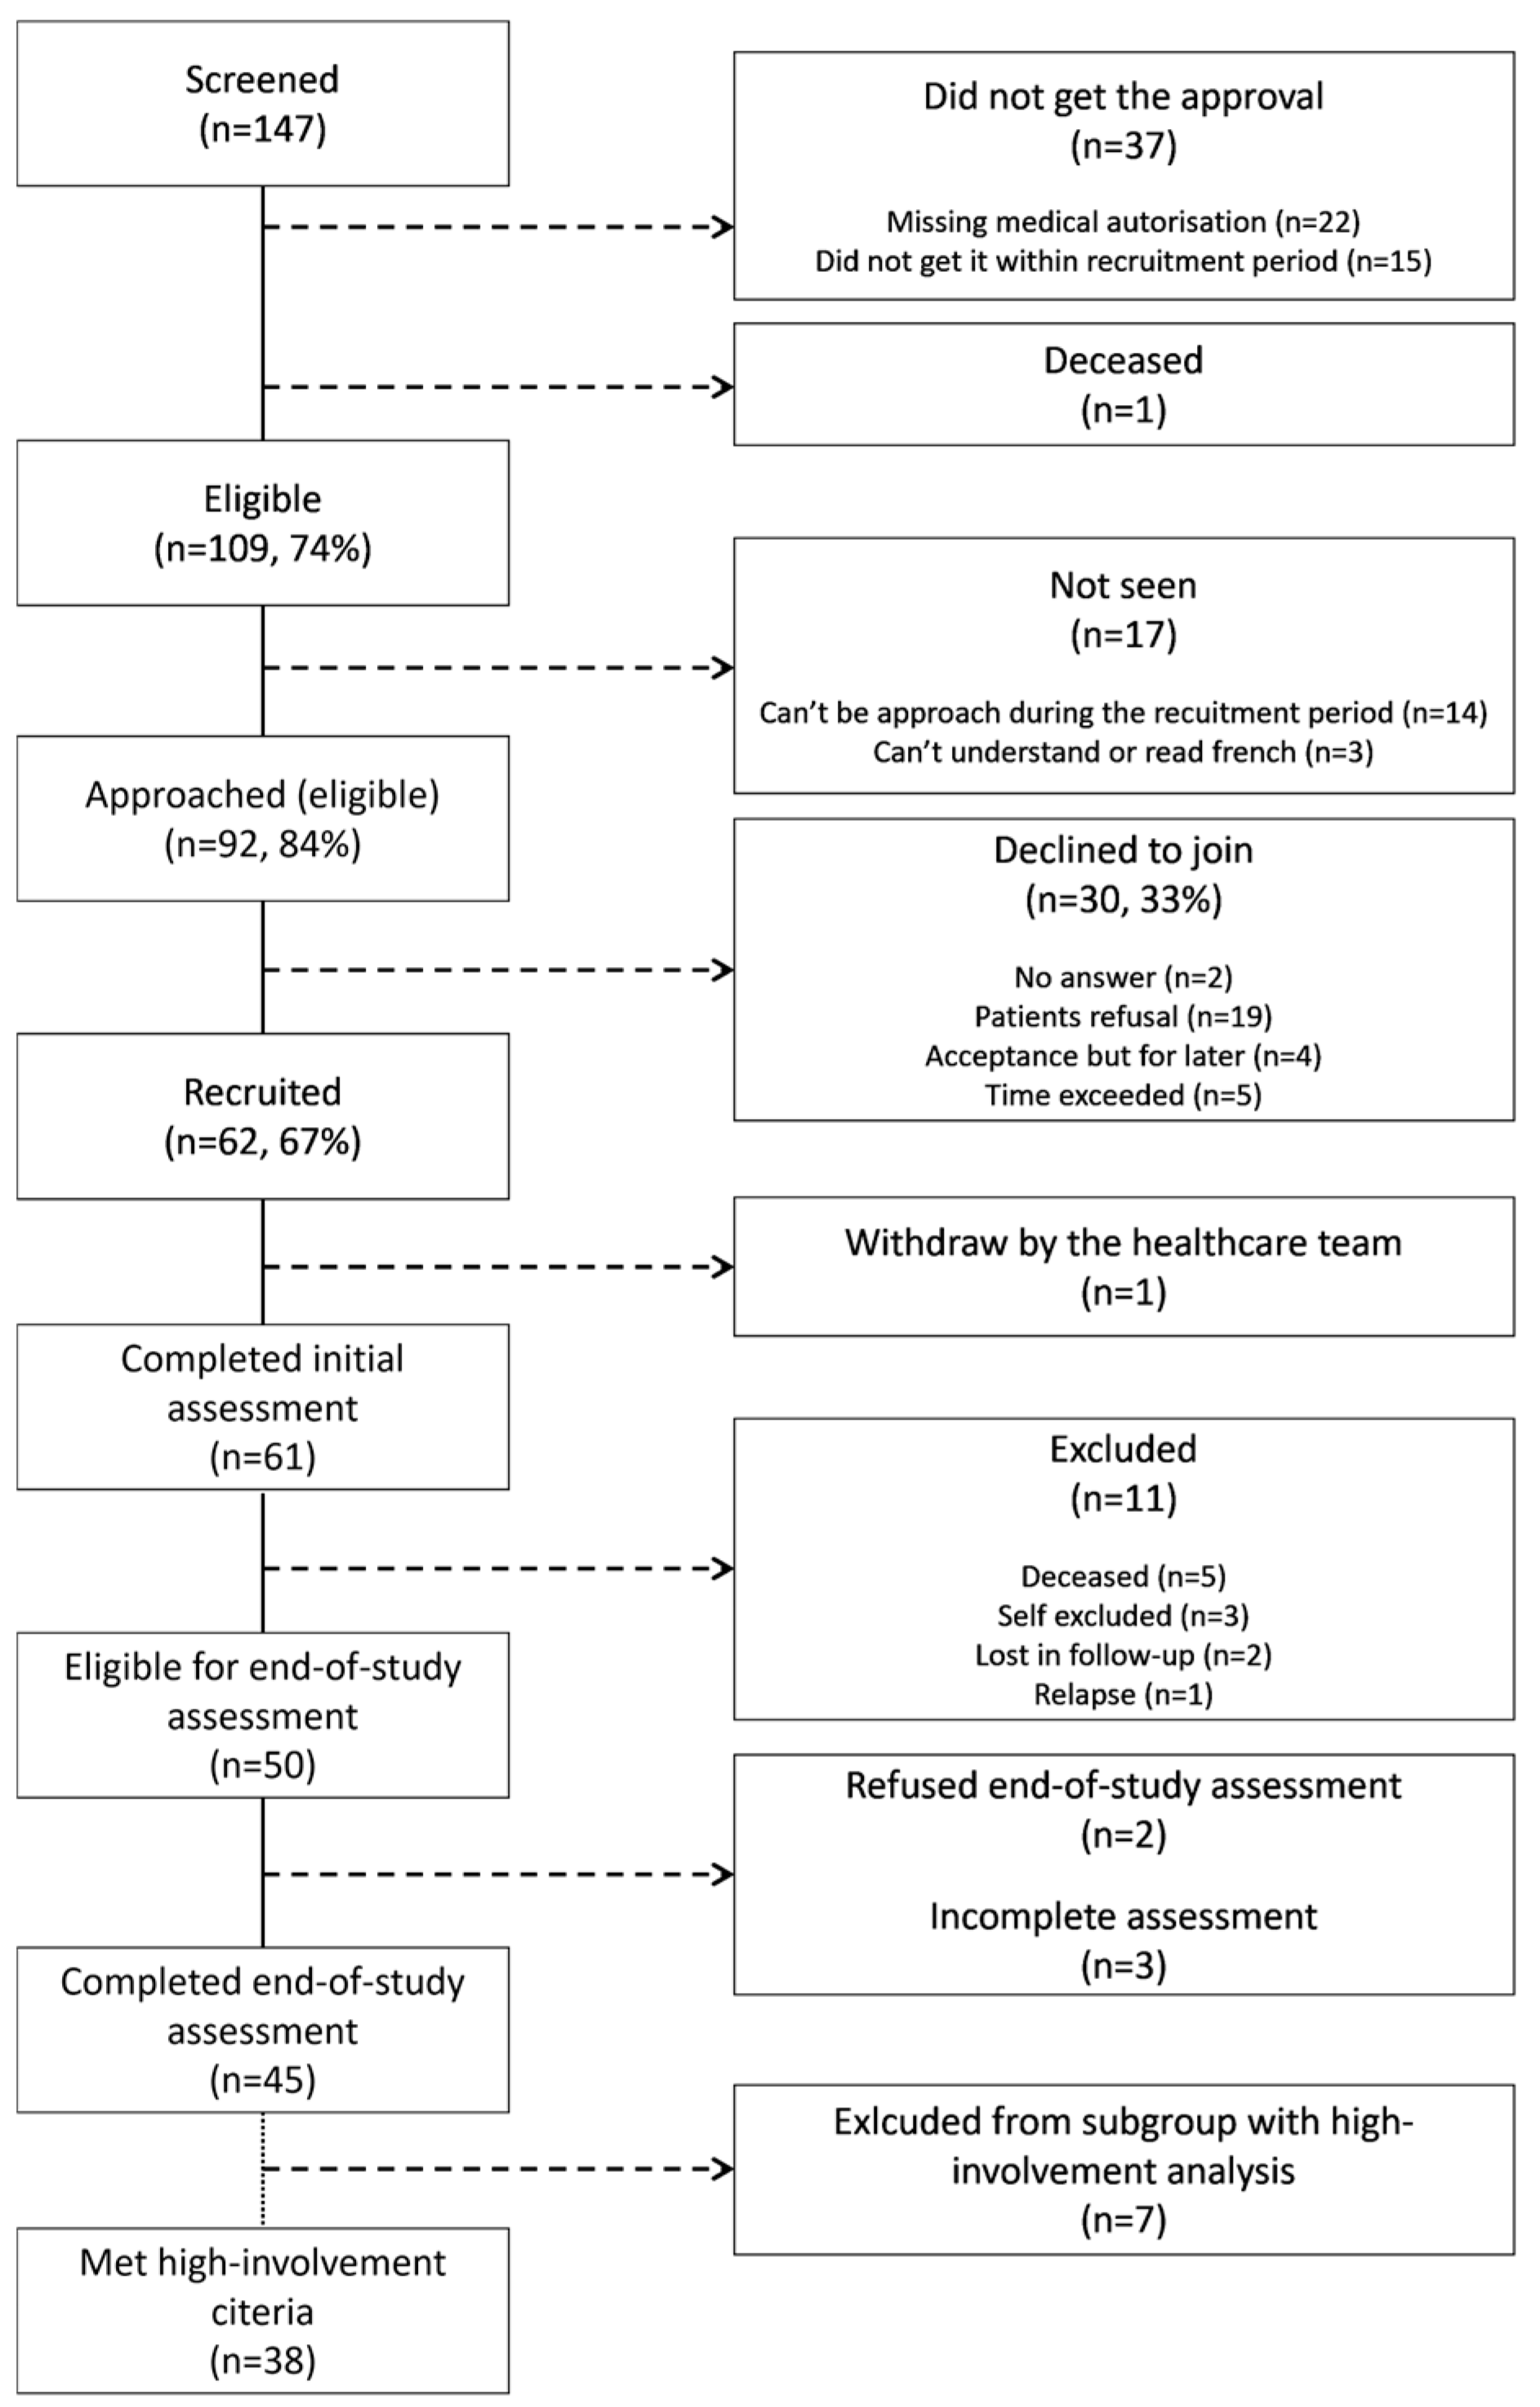
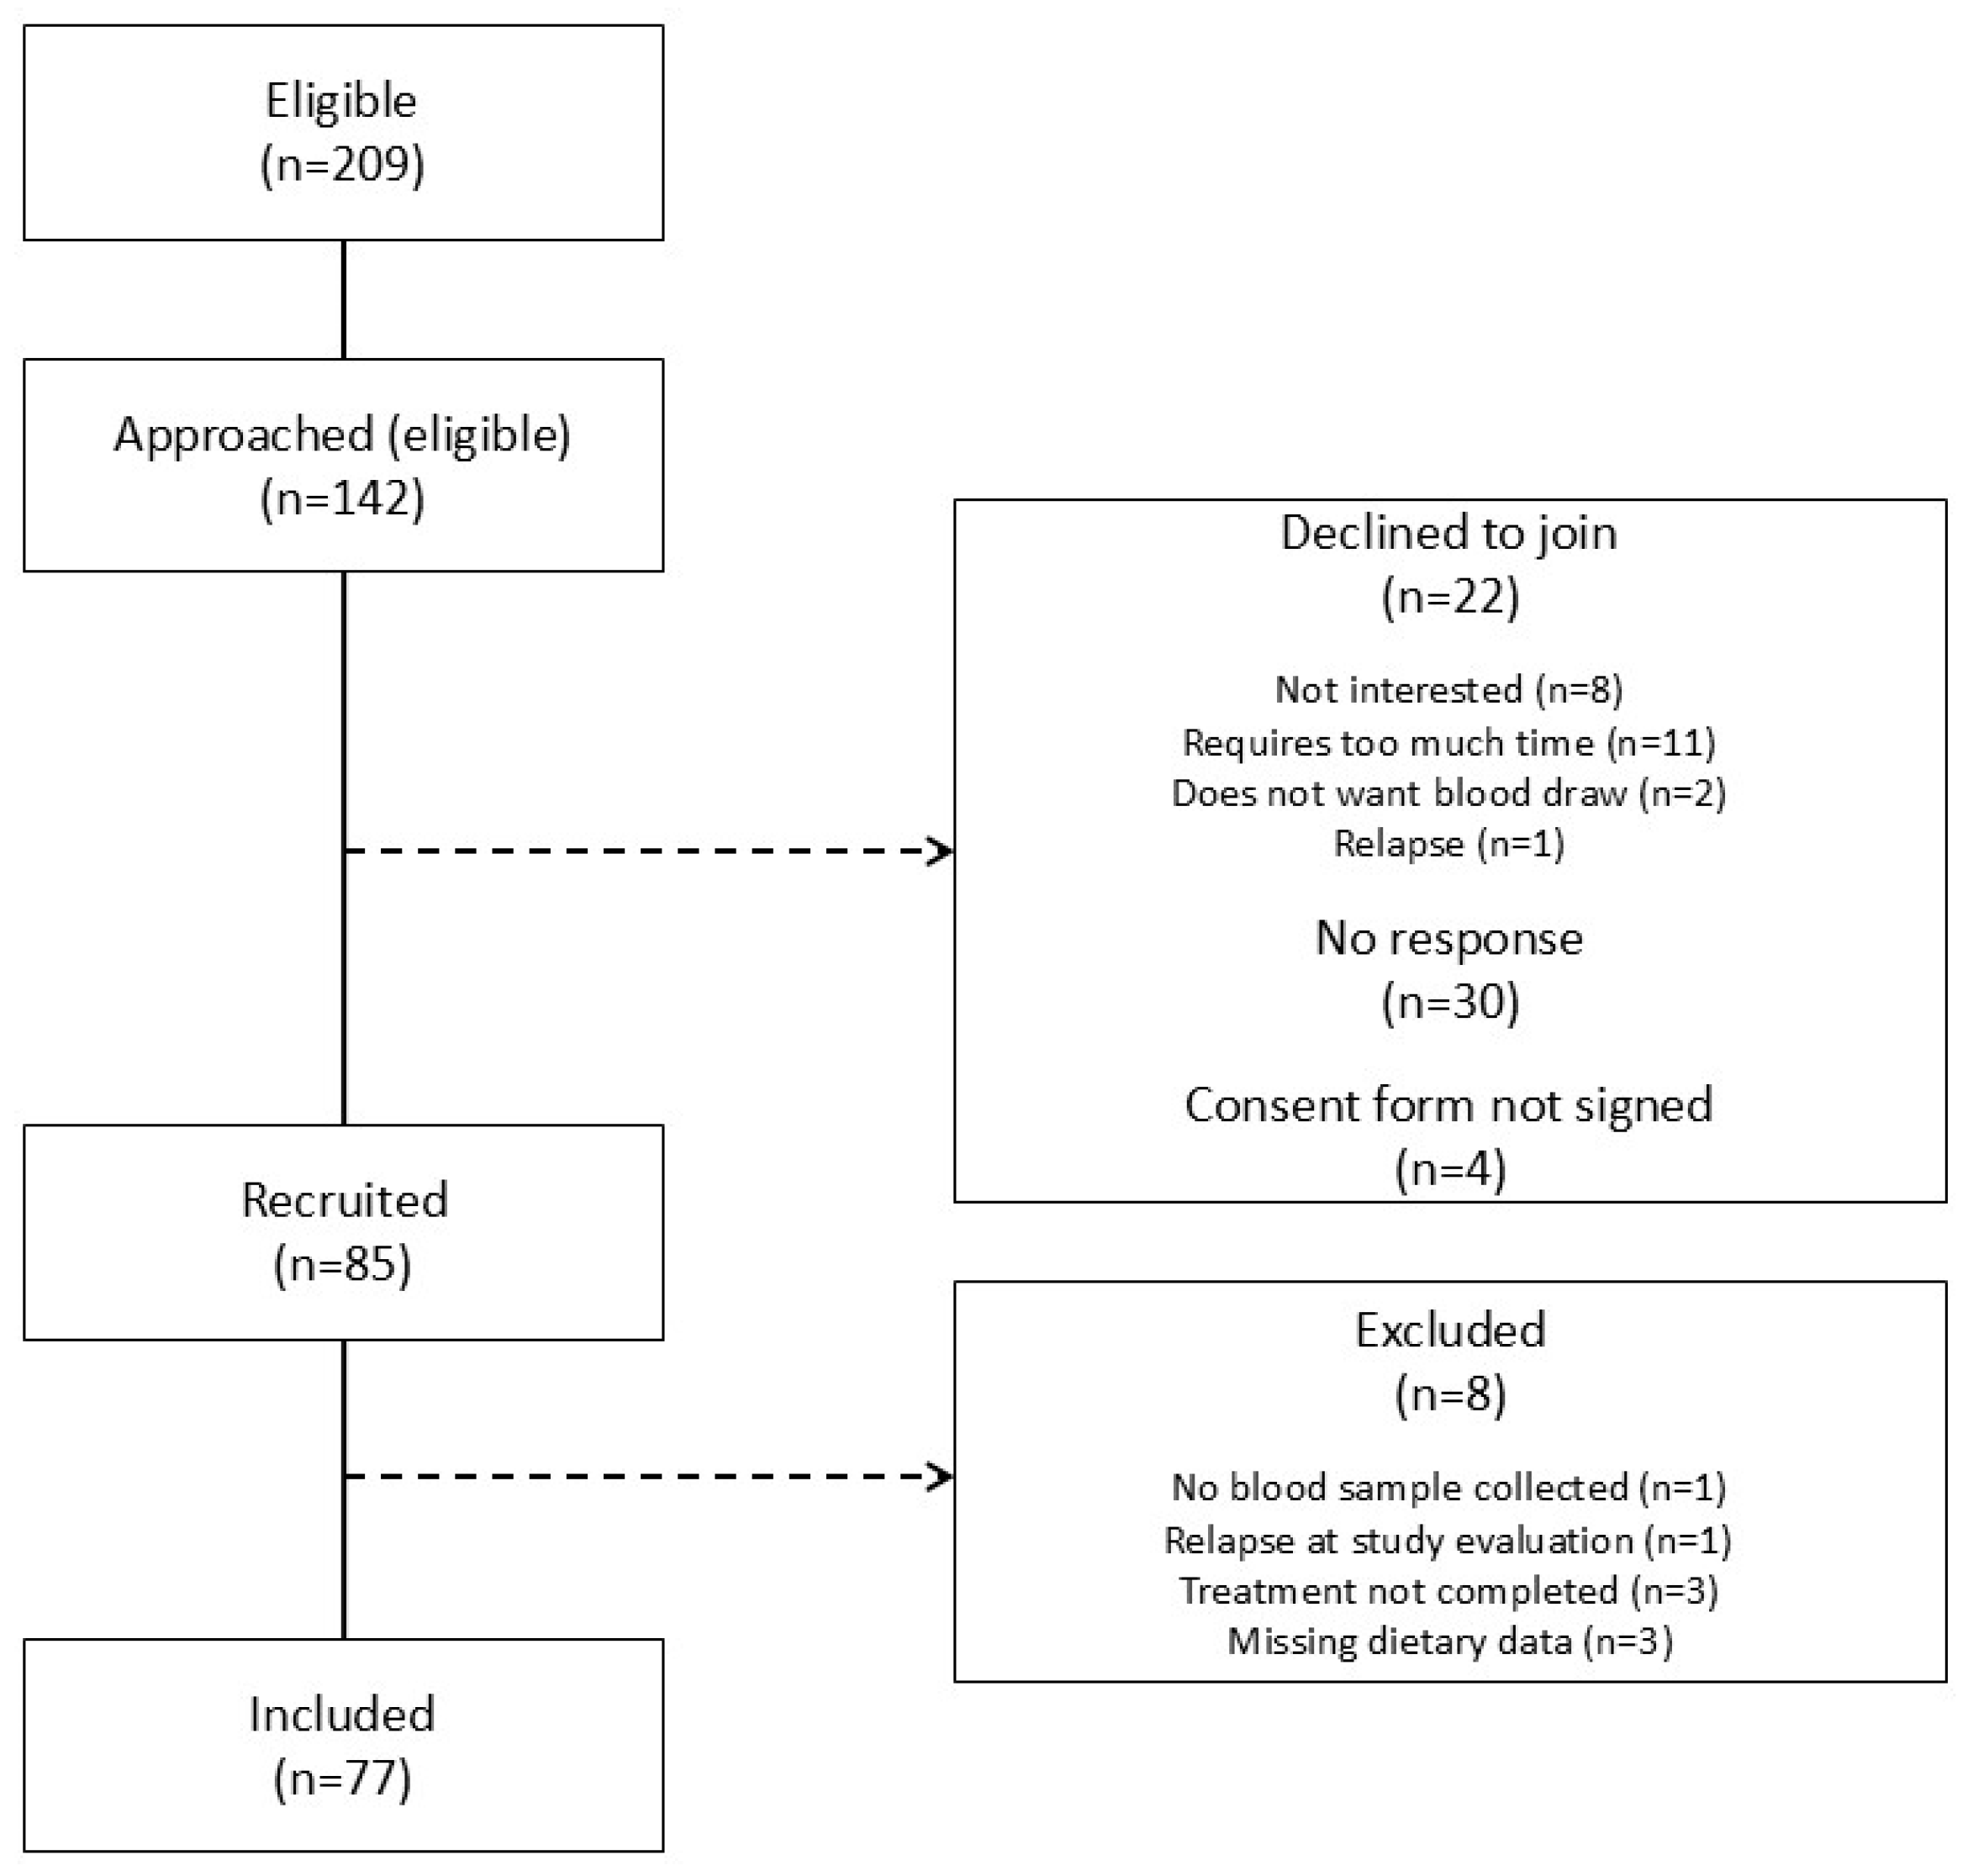
3.1. Participants
3.2. Comparison of Dietary Intakes
3.3. Anthropometric Measures
3.4. Blood Pressure, Biochemical Parameters, and Cardiometabolic Risk Factors
4. Discussion
Strengths and Limitations
5. Conclusions
Supplementary Materials
Author Contributions
Funding
Institutional Review Board Statement
Informed Consent Statement
Data Availability Statement
Acknowledgments
Conflicts of Interest
References
- Société Canadienne Du Cancer. Vue D’ensemble Des Statistiques Sur Le Cancer. 2022. Available online: https://cancer.ca/fr/research/cancer-statistics/cancer-statistics-at-a-glance (accessed on 4 August 2022).
- Gouvernement du Canada. Incidence Du Cancer Chez Les Enfants Au Canada. 2022. Available online: https://www.canada.ca/fr/sante-publique/services/publications/maladies-et-affections/incidence-cancer-enfants-canada.html (accessed on 4 August 2022).
- Ellison, L.F.; Xie, L.; Sung, L. Trends in pediatric cancer survival in Canada, 1992 to 2017. Health Rep. 2021, 32, 3–15. [Google Scholar] [CrossRef]
- Arpaci, T.; Toruner, E.K.; Altay, N. Assessment of nutritional problems in pediatric patients with cancer and the information needs of their parents: A parental perspective. Asia Pac. J. Oncol. Nurs. 2018, 5, 231–236. [Google Scholar] [CrossRef] [PubMed]
- Beaulieu-Gagnon, S.; Belanger, V.; Marcil, V. Food habits during treatment of childhood cancer: A critical review. Nutr. Res. Rev. 2019, 32, 265–281. [Google Scholar] [CrossRef]
- Cohen, J.; Goddard, E.; Brierley, M.-E.; Bramley, L.; Beck, E. Poor diet quality in children with cancer during treatment. J. Pediatr. Oncol. Nurs. 2021, 38, 313–321. [Google Scholar] [CrossRef]
- Murphy, A.J.; White, M.; Elliott, S.A.; Lockwood, L.; Hallahan, A.; Davies, P.S. Body composition of children with cancer during treatment and in survivorship. Am. J. Clin. Nutr. 2015, 102, 891–896. [Google Scholar] [CrossRef]
- Shams-White, M.; Kelly, M.J.; Gilhooly, C.; Liu, S.; Must, A.; Parsons, S.K.; Saltzman, E.; Zhang, F.F. Food craving and obesity in survivors of pediatric ALL and lymphoma. Appetite 2016, 96, 1–6. [Google Scholar] [CrossRef] [PubMed]
- Brinksma, A.; Roodbol, P.F.; Sulkers, E.; de Bont, E.S.J.M.; Burgerhof, J.G.M.; Tamminga, R.Y.J.; Jager-Wittenaar, H.; Tissing, W.J.E. Finding the right balance: An evaluation of the adequacy of energy and protein intake in childhood cancer patients. Clin. Nutr. 2015, 34, 284–290. [Google Scholar] [CrossRef] [PubMed]
- Robinson, D.L.; Loman, D.G.; Balakas, K.; Flowers, M. Nutritional screening and early intervention in children, adolescents, and young adults with cancer. J. Pediatr. Oncol. Nurs. 2012, 29, 346–355. [Google Scholar] [CrossRef]
- Sacks, N.; Wallace, E.; Desai, S.; Prasad, V.K.; Henry, D.; Guzikowski, V.; Carney, L.N.; Wright, B.B.; Rheingold, S. Oncology, Hematopoietic Transplant, and Survivorship. In The A.S.P.E.N. Pediatric Nutrition Support Core Curriculum, 2nd ed.; Corkins, M.R., Ed.; ASPEN: Silver Spring, MD, USA, 2010; pp. 349–377. [Google Scholar]
- Esbenshade, A.J.; Simmons, J.H.; Koyama, T.; Koehler, E.; Whitlock, J.A.; Friedman, D.L. Body mass index and blood pressure changes over the course of treatment of pediatric acute lymphoblastic leukemia. Pediatr. Blood Cancer 2011, 56, 372–378. [Google Scholar] [CrossRef] [PubMed]
- Bakk, I.; Koch, T.; Stanek, J.; O’Brien, S.H.; Reed, S. Steroid-induced Hypertension During Induction Chemotherapy for Acute Lymphoblastic Leukemia in US Children’s Hospitals. J. Pediatr. Hematol. Oncol. 2018, 40, 27–30. [Google Scholar] [CrossRef]
- McCormick, M.C.; Sharp, E.; Kalpatthi, R.; Zullo, J.; Gurtunca, N.; Zhang, J.; Krafty, R.; Raman, S. Hyperglycemia requiring insulin during acute lymphoblastic leukemia induction chemotherapy is associated with increased adverse outcomes and healthcare costs. Pediatr. Blood Cancer 2020, 67, e28475. [Google Scholar] [CrossRef] [PubMed]
- Zhang, F.F.; Kelly, M.J.; Must, A.; Saltzman, E.; Parsons, S.K. Obesity is an important health problem in survivors of pediatric acute lymphoblastic leukemia. Pediatr. Blood Cancer 2015, 62, 2058–2059. [Google Scholar] [CrossRef] [PubMed]
- Revuelta Iniesta, R.; Paciarotti, I.; Davidson, I.; McKenzie, J.M.; Brougham, M.F.H.; Wilson, D.C. Nutritional status of children and adolescents with cancer in Scotland: A prospective cohort study. Clin. Nutr. ESPEN 2019, 32, 96–106. [Google Scholar] [CrossRef]
- Lindemulder, S.J.; Stork, L.C.; Bostrom, B.; Lu, X.; Devidas, M.; Hunger, S.; Neglia, J.P.; Kadan-Lottick, N.S. Survivors of standard risk acute lymphoblastic leukemia do not have increased risk for overweight and obesity compared to non-cancer peers: A report from the Children’s Oncology Group. Pediatr. Blood Cancer 2015, 62, 1035–1041. [Google Scholar] [CrossRef] [PubMed]
- Egnell, C.; Ranta, S.; Banerjee, J.; Merker, A.; Niinimäki, R.; Lund, B.; Mogensen, P.R.; Jonsson, Ó.G.; Vaitkeviciene, G.; Lepik, K.; et al. Impact of body mass index on relapse in children with acute lymphoblastic leukemia treated according to Nordic treatment protocols. Eur. J. Haematol. 2020, 105, 797–807. [Google Scholar] [CrossRef] [PubMed]
- Faber, J.; Wingerter, A.; Neu, M.A.; Henninger, N.; Eckerle, S.; Münzel, T.; Lackner, K.J.; Beutel, M.E.; Blettner, M.; Rathmann, W.; et al. Burden of cardiovascular risk factors and cardiovascular disease in childhood cancer survivors: Data from the German CVSS-study. Eur. Heart J. 2018, 39, 1555–1562. [Google Scholar] [CrossRef] [PubMed]
- Armstrong, G.T.; Kawashima, T.; Leisenring, W.; Stratton, K.; Stovall, M.; Hudson, M.M.; Sklar, C.A.; Robison, L.L.; Oeffinger, K.C. Aging and risk of severe, disabling, life-threatening, and fatal events in the childhood cancer survivor study. J. Clin. Oncol. 2014, 32, 1218–1227. [Google Scholar] [CrossRef] [PubMed]
- Caru, M.; Samoilenko, M.; Drouin, S.; Lemay, V.; Kern, L.; Romo, L.; Bertout, L.; Lefebvre, G.; Andelfinger, G.; Krajinovic, M.; et al. Childhood acute lymphoblastic leukemia survivors have a substantially lower cardiorespiratory fitness level than healthy canadians despite a clinically equivalent level of physical activity. J. Adolesc. Young Adult Oncol. 2019, 8, 674–683. [Google Scholar] [CrossRef] [PubMed]
- Hoffman, K.E.; Derdak, J.; Bernstein, J.D.; Reynolds, J.C.; Avila, N.A.; Gerber, L.; Steinberg, S.M.; Chrousos, G.; Mackall, C.L.; Mansky, P.J. Metabolic syndrome traits in long-term survivors of pediatric sarcoma. Pediatr. Blood Cancer 2008, 50, 341–346. [Google Scholar] [CrossRef]
- Levy, E.; Samoilenko, M.; Morel, S.; England, J.; Amre, D.; Bertout, L.; Drouin, S.; Laverdière, C.; Krajinovic, M.; Sinnett, D.; et al. Cardiometabolic Risk Factors in Childhood, Adolescent and Young Adult Survivors of Acute Lymphoblastic Leukemia—A Petale Cohort. Sci. Rep. 2017, 7, 17684. [Google Scholar] [CrossRef] [PubMed]
- Oeffinger, K.C.; Mertens, A.C.; Sklar, C.A.; Kawashima, T.; Hudson, M.M.; Meadows, A.T.; Friedman, D.L.; Marina, N.; Hobbie, W.; Kadan-Lottick, N.S.; et al. Chronic health conditions in adult survivors of childhood cancer. N. Engl. J. Med. 2006, 355, 1572–1582. [Google Scholar] [CrossRef] [PubMed]
- Belanger, V.; Napartuk, M.; Bouchard, I.; Meloche, C.; Curnier, D.; Sultan, S.; Laverdière, C.; Sinnett, D.; Marcil, V. Cardiometabolic health after pediatric cancer treatment: Adolescents are more affected than children. Nutr. Cancer 2022, 74, 3236–3252. [Google Scholar] [CrossRef]
- Morel, S.; Leahy, J.; Fournier, M.; Lamarche, B.; Garofalo, C.; Grimard, G.; Poulain, F.; Delvin, E.; Laverdière, C.; Krajinovic, M.; et al. Lipid and lipoprotein abnormalities in acute lymphoblastic leukemia survivors. J. Lipid Res. 2017, 58, 982–993. [Google Scholar] [CrossRef] [PubMed]
- Chow, E.J.; Pihoker, C.; Hunt, K.; Wilkinson, K.; Friedman, D.L. Obesity and hypertension among children after treatment for acute lymphoblastic leukemia. Cancer 2007, 110, 2313–2320. [Google Scholar] [CrossRef] [PubMed]
- Haddy, T.B.; Mosher, R.B.; Reaman, G.H. Hypertension and prehypertension in long-term survivors of childhood and adolescent cancer. Pediatr. Blood Cancer 2007, 49, 79–83. [Google Scholar] [CrossRef]
- Nottage, K.A.; Ness, K.K.; Li, C.; Srivastava, D.; Robison, L.L.; Hudsonet, M.M. Metabolic syndrome and cardiovascular risk among long-term survivors of acute lymphoblastic leukaemia—From the St. Jude Lifetime Cohort. Br. J. Haematol. 2014, 165, 364–374. [Google Scholar] [CrossRef] [PubMed]
- Cohen, J.; Collins, L.; Gregerson, L.; Chandra, J.; Cohn, R.J. Nutritional concerns of survivors of childhood cancer: A “First World” perspective. Pediatr. Blood Cancer 2020, 67, e28193. [Google Scholar] [CrossRef]
- Cohen, J.; Wakefield, C.E.; Fleming, C.A.K.; Gawthorne, R.; Tapsell, L.C.; Cohn, R.J. Dietary intake after treatment in child cancer survivors. Pediatr. Blood Cance 2012, 58, 752–757. [Google Scholar] [CrossRef]
- Demark-Wahnefried, W.; Werner, C.; Clipp, E.C.; Guill, A.B.; Bonner, M.; Jones, L.W.; Rosoff, P.M. Survivors of childhood cancer and their guardians. Cancer 2005, 103, 2171–2180. [Google Scholar] [CrossRef] [PubMed]
- Tylavsky, F.A.; Smith, K.; Surprise, H.; Garland, S.; Yan, X.; McCammon, E.; Hudson, M.M.; Pui, C.-H.; Kaste, S.C. Nutritional intake of long-term survivors of childhood acute lymphoblastic leukemia: Evidence for bone health interventional opportunities. Pediatr. Blood Cancer 2010, 55, 1362–1369. [Google Scholar] [CrossRef] [PubMed]
- Zhang, F.F.; Saltzman, E.; Kelly, M.J.; Liu, S.; Must, A.; Parsons, S.K.; Roberts, S.B. Comparison of childhood cancer survivors’ nutritional intake with US dietary guidelines. Pediatr. Blood Cancer 2015, 62, 1461–1467. [Google Scholar] [CrossRef]
- Gomez-Delgado, F.; Katsiki, N.; Lopez-Miranda, J.; Perez-Martinez, P. Dietary habits, lipoprotein metabolism and cardiovascular disease: From individual foods to dietary patterns. Crit. Rev. Food Sci. Nutr. 2021, 61, 1651–1669. [Google Scholar] [CrossRef]
- O’Keefe, J.H.; Gheewala, N.M.; O’Keefe, J.O. Dietary strategies for improving post-prandial glucose, lipids, inflammation, and cardiovascular health. J. Am. Coll. Cardiol. 2008, 51, 249–255. [Google Scholar] [CrossRef]
- Seo, Y.-G.; Lim, H.; Kim, Y.; Ju, Y.-S.; Lee, H.-J.; Jang, H.B.; Park, S.I.; Park, K.H. The Effect of a Multidisciplinary Lifestyle Intervention on Obesity Status, Body Composition, Physical Fitness, and Cardiometabolic Risk Markers in Children and Adolescents with Obesity. Nutrients 2019, 11, 137. [Google Scholar] [CrossRef] [PubMed]
- Cao, Y.; Zhu, L.; Chen, Z.; Zhanquan, L.; Xie, W.; Liang, M. The effect of different intensity physical activity on cardiovascular metabolic health in obese children and adolescents: An isotemporal substitution model. Front. Physiol. 2023, 14, 1041622. [Google Scholar] [CrossRef]
- Atkins, J.L.; Whincup, P.H.; Morris, R.W.; Lennon, L.T.; Papacosta, O.; Wannamethee, S.G. High diet quality is associated with a lower risk of cardiovascular disease and all-cause mortality in older men. J. Nutr. 2014, 144, 673–680. [Google Scholar] [CrossRef] [PubMed]
- Mozaffarian, D.; Benjamin, E.J.; Go, A.S.; Arnett, D.K.; Blaha, M.J.; Cushman, M.; de Ferranti, S.; Després, J.-P.; Fullerton, H.J.; Howard, V.J.; et al. Heart disease and stroke statistics--2015 update: A report from the American Heart Association. Circulation 2015, 131, e29–e322. [Google Scholar] [CrossRef]
- Li, R.; Donnella, H.; Knouse, P.; Raber, M.; Crawford, K.; Swartz, M.C.; Wu, J.; Liu, D.; Chandra, J. A randomized nutrition counseling intervention in pediatric leukemia patients receiving steroids results in reduced caloric intake. Pediatr. Blood Cancer 2017, 64, 374–380. [Google Scholar] [CrossRef] [PubMed]
- Moyer-Mileur, L.J.; Ransdell, L.; Bruggers, C.S. Fitness of children with standard-risk acute lymphoblastic leukemia during maintenance therapy: Response to a home-based exercise and nutrition program. J. Pediatr. Hematol. Oncol. 2009, 31, 259–266. [Google Scholar] [CrossRef] [PubMed]
- Wright, M.J.; Collins, L.; Christie, A.; Birken, K.; Dettmer, E.; Nathan, P.C. A Comprehensive Healthy Lifestyle Program for Children Receiving Treatment for Acute Lymphoblastic Leukemia: Feasibility and Preliminary Efficacy Data. Rehabil. Oncol. 2013, 31, 6–13. [Google Scholar] [CrossRef]
- Zhang, F.F.; Kelly, M.; Du, M.; Welch, J.G.; Santacruz, N.; Rhoades, J.; Kamins, C.L.; Dreyer, Z.; Scheurer, M.E. Early Lifestyle Intervention for Obesity Prevention in Pediatric Survivors of Acute Lymphoblastic Leukemia. Nutrients 2019, 11, 2631. [Google Scholar] [CrossRef]
- Stern, M.; Lamanna, J.; Russell, C.; Ewing, L.; Thompson, A.; Trapp, S.; Bitsko, M.; Mazzeo, S. Adaptation of an obesity intervention program for pediatric cancer survivors (NOURISH-T). Clin. Pract. Pediatr. Psychol. 2013, 1, 264–275. [Google Scholar] [CrossRef]
- Hill, R.; Hamby, T.; Bashore, L.; Rapisand, S.; Galipp, K.; Heym, K.; Bowman, W.P. Early Nutrition Intervention Attenuates Weight Gain for Pediatric Acute Lymphoblastic Leukemia Patients in Maintenance Therapy. J. Pediatr. Hematol. Oncol. 2018, 40, 104–110. [Google Scholar] [CrossRef] [PubMed]
- Belanger, V.; Delorme, J.; Napartuk, M.; Bouchard, I.; Meloche, C.; Curnier, D.; Sultan, S.; Laverdière, C.; Sinnett, D.; Marcil, V. Early Nutritional Intervention to Promote Healthy Eating Habits in Pediatric Oncology: A Feasibility Study. Nutrients 2022, 14, 1024. [Google Scholar] [CrossRef] [PubMed]
- Caru, M.; Duhamel, G.; Marcil, V.; Sultan, S.; Meloche, C.; Bouchard, I.; Drouin, S.; Bertout, L.; Laverdiere, C.; Sinnett, D.; et al. The VIE study: Feasibility of a physical activity intervention in a multidisciplinary program in children with cancer. Support Care Cancer 2020, 28, 2627–2636. [Google Scholar] [CrossRef]
- Napartuk, M.; Bélanger, V.; Bouchard, I.; Meloche, C.; Curnier, D.; Sultan, S.; Laverdière, C.; Sinnett, D.; Marcil, V. Improvement of Diet after an Early Nutritional Intervention in Pediatric Oncology. Children 2023, 10, 667. [Google Scholar] [CrossRef]
- Levesque, A.; Béliveau, J.; Ogez, D.; Marcil, V.; Curnier, D.; Laverdière, C.; Sinnett, D.; Péloquin, K.; Sultan, S. Do problem-solving skills help mitigate emotional distress through perceived control and self-efficacy in parents of children with cancer? Psychooncology 2023, 32, 247–255. [Google Scholar] [CrossRef] [PubMed]
- Levesque, A.; Levesque, A.; Ogez, D.; Gravel, V.; Marcil, V.; Curnier, D.; Rondeau, É.; Sinnett, D.; Péloquin, K.; Sultan, S. Feasibility Study of Taking Back Control Together, an Intervention to Support Parents of Children with Cancer. J. Clin. Psychol. Med. Settings 2024, 31, 444–454. [Google Scholar] [CrossRef] [PubMed]
- Ogez, D.; Bourque, C.-J.; Péloquin, K.; Ribeiro, R.; Bertout, L.; Curnier, D.; Drouin, S.; Laverdière, C.; Marcil, V.; Rondeau, É.; et al. Definition and improvement of the concept and tools of a psychosocial intervention program for parents in pediatric oncology: A mixed-methods feasibility study conducted with parents and healthcare professionals. Pilot Feasibility Stud. 2019, 5, 20. [Google Scholar] [CrossRef]
- Université Laval Nutrific. Available online: https://nutrific.fsaa.ulaval.ca (accessed on 16 December 2024).
- Health Canada Canadian Nutrient File (CNF)—Search by Food. Available online: https://food-nutrition.canada.ca/cnf-fce/index-eng.jsp (accessed on 16 December 2024).
- National Research Council Subcommittee. Energy. In Recommended Dietary Allowances, 10th ed.; National Academies Press: Washington, DC, USA, 1989; pp. 24–38. [Google Scholar]
- Faizan, U.; Rouster, A.S. Nutrition and Hydration Requirements in Children and Adults. Available online: https://www.ncbi.nlm.nih.gov/books/NBK562207/ (accessed on 27 November 2024).
- Kim, S.; Haines, P.S.; Siega-Riz, A.M.; Popkin, B.M. The Diet Quality Index-International (DQI-I) provides an effective tool for cross-national comparison of diet quality as illustrated by China and the United States. J. Nutr. 2003, 133, 3476–3484. [Google Scholar] [CrossRef] [PubMed]
- Kanauchi, M.; Kanauchi, K. The World Health Organization’s Healthy Diet Indicator and its associated factors: A cross-sectional study in central Kinki, Japan. Prev. Med. Rep. 2018, 12, 198–202. [Google Scholar] [CrossRef] [PubMed]
- World Health Organisation. Healthy Diet. Available online: https://www.who.int/news-room/fact-sheets/detail/healthy-diet (accessed on 29 November 2024).
- Huijbregts, P.; Feskens, E.; Räsänen, L.; Fidanza, F.; Nissinen, A.; Menotti, A.; Kromhout, D. Dietary pattern and 20 year mortality in elderly men in Finland, Italy, and The Netherlands: Longitudinal cohort study. BMJ 1997, 315, 13–17. [Google Scholar] [CrossRef]
- Rodd, C.; Metzger, D.L.; Sharma, A.; Canadian Pediatric Endocrine Group (CPEG) Working Committee for National Growth Charts. Extending World Health Organization weight-for-age reference curves to older children. BMC Pediatr. 2014, 14, 32. [Google Scholar] [CrossRef] [PubMed]
- Sharma, A.K.; Metzger, D.L.; Daymont, C.; Hadjiyannakis, S.; Rodd, C.J. LMS tables for waist-circumference and waist-height ratio Z-scores in children aged 5–19 y in NHANES III: Association with cardio-metabolic risks. Pediatr. Res. 2015, 78, 723–729. [Google Scholar] [CrossRef] [PubMed]
- Mramba, L.; Ngari, M.; Mwangome, M.; Muchai, L.; Bauni, E.; Walker, A.S.; Gibb, D.M.; Fegan, G.; Berkleyet, J.A. A growth reference for mid upper arm circumference for age among school age children and adolescents, and validation for mortality: Growth curve construction and longitudinal cohort study. BMJ 2017, 358, j3423. [Google Scholar] [CrossRef]
- Kuhle, S.; Ashley-Martin, J.; Maguire, B.; Hamilton, D.C. Percentile curves for skinfold thickness for Canadian children and youth. PeerJ 2016, 4, e2247. [Google Scholar] [CrossRef]
- Flynn, J.T.; Kaelber, D.C.; Baker-Smith, C.M.; Blowey, D.; Carroll, A.E.; Daniels, S.R.; de Ferranti, S.D.; Dionne, J.M.; Falkner, B.; Flinn, S.K.; et al. Clinical Practice Guideline for Screening and Management of High Blood Pressure in Children and Adolescents. Pediatrics 2017, 140, e20171904. [Google Scholar] [CrossRef]
- American Diabetes Association; Classification and Diagnosis of Diabetes: Standards of Medical Care in Diabetes-2019. Diabetes Care 2019, 42, S13–S28. [CrossRef]
- de Ferranti, S.D.; Steinberger, J.; Ameduri, R.; Baker, A.; Gooding, H.; Kelly, A.S.; Mietus-Snyder, M.; Mitsnefes, M.M.; Peterson, A.L.; St-Pierre, J.; et al. Cardiovascular Risk Reduction in High-Risk Pediatric Patients: A Scientific Statement From the American Heart Association. Circulation 2019, 139, e603–e634. [Google Scholar] [CrossRef]
- Dietitians of Canada; Canadian Paediatric Society; College of Family Physicians of Canada; Community Health Nurses of Canada; Secker, D. Promoting optimal monitoring of child growth in Canada: Using the new WHO growth charts. Can. J. Diet Pract. Res. 2010, 71, e1–e3. [Google Scholar] [CrossRef] [PubMed]
- Expert panel on integrated guidelines for cardiovascular health and risk reduction in children and adolescents: Summary report. Pediatrics 2011, 128, S213–S256. [CrossRef]
- Whelton, P.K.; Carey, R.M.; Aronow, W.S.; Casey, D.E., Jr.; Collins, K.J.; Dennison Himmelfarb, C.; DePalma, S.M.; Gidding, S.; Jamerson, K.A.; Jones, D.W.; et al. 2017 ACC/AHA/AAPA/ABC/ACPM/AGS/APhA/ASH/ASPC/NMA/PCNA Guideline for the Prevention, Detection, Evaluation, and Management of High Blood Pressure in Adults: A Report of the American College of Cardiology/American Heart Association Task Force on Clinical Practice Guidelines. Circulation 2018, 138, e484–e594. [Google Scholar] [CrossRef]
- Munns, C.F.; Munns, C.F.; Shaw, N.; Kiely, M.; Specker, B.L.; Thacher, T.D.; Ozono, K.; Michigami, T.; Tiosano, D.; Mughal, M.Z.; et al. Global Consensus Recommendations on Prevention and Management of Nutritional Rickets. J. Clin. Endocrinol. Metab. 2016, 101, 394–415. [Google Scholar] [CrossRef] [PubMed]
- R Core Team. R: A Language and Environment for Statistical Computing; R Foundation for Statistical Computing: Vienna, Austria, 2024; Available online: https://www.R-project.org/ (accessed on 17 October 2024).
- Janz, T.; Pearson, C. Vitamin D Blood Levels of Canadians 2013. Catalogue no. 82–624-X. Available online: https://www150.statcan.gc.ca/n1/pub/82-624-x/2013001/article/11727-eng.htm (accessed on 7 December 2023).
- Ross, A.C.; Manson, J.E.; Abrams, S.A.; Aloia, J.F.; Brannon, P.M.; Clinton, S.K.; Durazo-Arvizu, R.A.; Gallagher, J.C.; Gallo, R.L.; Jones, G.; et al. The 2011 Report on Dietary Reference Intakes for Calcium and Vitamin D from the Institute of Medicine: What Clinicians Need to Know. J. Clin. Endocrinol. Metab. 2011, 96, 53–58. [Google Scholar] [CrossRef] [PubMed]
- Withycombe, J.S.; Smith, L.M.; Meza, J.L.; Merkle, C.; Faulkner, M.S.; Ritter, L.; Seibel, N.L.; Moore, K. Weight change during childhood acute lymphoblastic leukemia induction therapy predicts obesity: A report from the Children’s Oncology Group. Pediatr. Blood Cancer 2015, 62, 434–439. [Google Scholar] [CrossRef]
- Belle, F.N.; Wenke-Zobler, J.; Cignacco, E.; Spycher, B.D.; Ammann, R.A.; Kuehni, C.E.; Zimmermann, K. Overweight in childhood cancer patients at diagnosis and throughout therapy: A multicentre cohort study. Clin. Nutr. 2019, 38, 835–841. [Google Scholar] [CrossRef]
- Walters, M.; Mowbray, C.; Jubelirer, T.; Jacobs, S.; Kelly, K.M.; Smith, K.; Yao, Y.; Jin, Z.; Ladas, E.J. A bilingual dietary intervention early in treatment is feasible and prevents weight gain in childhood acute lymphoblastic leukemia. Pediatr. Blood Cancer 2021, 68, e28910. [Google Scholar] [CrossRef]
- Iaccarino Idelson, P.; Scalfi, L.; Valerio, G. Adherence to the Mediterranean Diet in children and adolescents: A systematic review. Nutr. Metab. Cardiovasc. Dis. 2017, 27, 283–299. [Google Scholar] [CrossRef] [PubMed]
- Kondryn, H.J.; Edmondson, C.L.; Hill, J.; Eden, T.O.B. Treatment non-adherence in teenage and young adult patients with cancer. Lancet Oncol. 2011, 12, 100–108. [Google Scholar] [CrossRef] [PubMed]
- Kerba, J.; Demers, C.; Bélanger, V.; Napartuk, M.; Bouchard, I.; Meloche, C.; Morel, S.; Prud, N.; Gélinas, I.; Higgins, J.; et al. Needs, Barriers and Facilitators of Adolescents Participating in a Lifestyle Promotion Program in Oncology: Stakeholders, Adolescents and Parents’ Perspective. Children 2022, 9, 1340. [Google Scholar] [CrossRef]
- Hingorani, P.; Seidel, K.; Krailo, M.; Mascarenhas, L.; Meyers, P.; Marina, N.; Conrad, E.U.; Hawkin, D.S. Body mass index (BMI) at diagnosis is associated with surgical wound complications in patients with localized osteosarcoma: A report from the Children’s Oncology Group. Pediatr. Blood Cancer 2011, 57, 939–942. [Google Scholar] [CrossRef] [PubMed]
- Murphy, B.R.; Raber, M.P.; Crawford, K.D.; Grasse, L.; Wartenberg, L.; Wu, J.; Dibaj, S.S.; Chandra, J. High Rates of Obesity at Presentation Persist into Survivorship across Childhood Cancer Types. Child. Obes. 2020, 16, 250–257. [Google Scholar] [CrossRef] [PubMed]
- Huang, J.S.; Dillon, L.; Terrones, L.; Schubert, L.; Roberts, W.; Finklestein, J.; Swartz, M.C.; Norman, G.J.; Patrick, K. Fit4Life: A weight loss intervention for children who have survived childhood leukemia. Pediatr. Blood Cancer 2014, 61, 894–900. [Google Scholar] [CrossRef] [PubMed]
- Blair, C.K.; Madan-Swain, A.; Locher, J.L.; Desmond, R.A.; de Los Santos, J.; Affuso, O.; Glover, T.; Smith, K.; Carley, J.; Lipsitz, M.; et al. Harvest for health gardening intervention feasibility study in cancer survivors. Acta Oncol. 2013, 52, 1110–1118. [Google Scholar] [CrossRef] [PubMed]
- Esbenshade, A.J.; Simmons, J.H.; Koyama, T.; Lindell, R.B.; Friedman, D.L. Obesity and insulin resistance in pediatric acute lymphoblastic leukemia worsens during maintenance therapy. Pediatr. Blood Cancer 2013, 60, 1287–1291. [Google Scholar] [CrossRef]
- Morrell, M.B.G.; Baker, R.; Johnson, A.; Santizo, R.; Liu, D.; Moody, K. Dietary intake and micronutrient deficiency in children with cancer. Pediatr. Blood Cancer 2019, 66, e27895. [Google Scholar] [CrossRef] [PubMed]
- Barbosa-Cortés, L.; López-Alarcón, M.; Mejía-Aranguré, J.M.; Klünder-Klünder, M.; Del Carmen Rodríguez-Zepeda, M.; Rivera-Márquez, H.; de la Vega-Martínez, A.; Martin-Trejo, J.; Shum-Luis, J.; Solis-Labastida, K.; et al. Adipokines, insulin resistance, and adiposity as a predictors of metabolic syndrome in child survivors of lymphoma and acute lymphoblastic leukemia of a developing country. BMC Cancer 2017, 17, 125. [Google Scholar] [CrossRef]
- Sohn, Y.B.; Kim, S.J.; Park, S.W.; Kim, S.-H.; Cho, S.-Y.; Lee, S.H.; Yoo, K.H.; Sung, K.W.; Chung, J.H.; Koo, H.H.; et al. The metabolic syndrome and body composition in childhood cancer survivors. Korean J. Pediatr. 2011, 54, 253–259. [Google Scholar] [CrossRef]
- AbdelHameid, D.; Mills, A.; Dean, J.; Piguet, N.; Shankar, S. Long term effects of therapy among childhood cancer survivors treated in the last two decades. Pediatr. Hematol. Oncol. J. 2019, 4, 12–16. [Google Scholar] [CrossRef]
- Bayram, C.; Yaralı, N.; Fettah, A.; Demirel, F.; Tavil, B.; Kara, A.; Tunç, B. Evaluation of Endocrine Late Complications in Childhood Acute Lymphoblastic Leukemia Survivors: A Report of a Single-Center Experience and Review of the Literature. Turk. J. Haematol. 2017, 34, 40–45. [Google Scholar] [CrossRef] [PubMed]
- Meacham, L.R.; Chow, E.J.; Ness, K.K.; Kamdar, K.Y.; Chen, Y.; Yasui, Y.; Oeffinger, K.C.; Sklar, C.A.; Robison, L.L.; Mertens, A.C. Cardiovascular risk factors in adult survivors of pediatric cancer--A report from the childhood cancer survivor study. Cancer Epidemiol. Biomark. Prev. 2010, 19, 170–181. [Google Scholar] [CrossRef] [PubMed]
- Neri, L.C.L.; Guglielmetti, M.; Fiorini, S.; Quintiero, F.; Tagliabue, A.; Ferraris, C. Nutritional counseling in childhood and adolescence: A systematic review. Front. Nutr. 2024, 11, 1270048. [Google Scholar] [CrossRef] [PubMed]
- Bleyer, A.; Barr, R.; Hayes-Lattin, B.; Thomas, D.; Ellis, C.; Anderson, B. on behalf of the Biology and Clinical Trials Subgroups of the US National Cancer Institute Progress Review Group in Adolescent and Young Adult Oncology. The distinctive biology of cancer in adolescents and young adults. Nat. Rev. Cancer 2008, 8, 288–298. [Google Scholar] [CrossRef]
- Health Canada. Sodium Intake of Canadians in 2017. Available online: https://www.canada.ca/en/health-canada/services/publications/food-nutrition/sodium-intake-canadians-2017.html (accessed on 30 November 2024).
- Cox, C.L.; McLaughlin, R.A.; Rai, S.N.; Steen, B.D.; Hudson, M.M. Adolescent survivors: A secondary analysis of a clinical trial targeting behavior change. Pediatr. Blood Cancer 2005, 45, 144–154. [Google Scholar] [CrossRef] [PubMed]
- Mays, D.; Black, J.D.; Mosher, R.B.; Heinly, A.; Shad, A.T.; Tercyak, K.P. Efficacy of the Survivor Health and Resilience Education (SHARE) program to improve bone health behaviors among adolescent survivors of childhood cancer. Ann. Behav. Med. 2011, 42, 91–98. [Google Scholar] [CrossRef] [PubMed]
- Crawford, P.B.; Obarzanek, E.; Morrison, J.; Sabry, Z.I. Comparative advantage of 3-day food records over 24-hour recall and 5-day food frequency validated by observation of 9- and 10-year-old girls. J. Am. Diet. Assoc. 1994, 94, 626–630. [Google Scholar] [CrossRef]
- Resnicow, K.; Odom, E.; Wang, T.; Dudley, W.N.; Mitchell, D.; Vaughan, R.; Jackson, A.; Baranowski, T. Validation of three food frequency questionnaires and 24-hour recalls with serum carotenoid levels in a sample of African-American adults. Am. J. Epidemiol. 2000, 152, 1072–1080. [Google Scholar] [CrossRef]


| Control Group n = 77 | Intervention Group n = 45 | p-Value 1 | Intervention Subgroup 2 n = 38 | p-Value 3 | |
|---|---|---|---|---|---|
| Sex, n (%) | |||||
| Male | 34 (44.2) | 23 (51.1) | 0.573 | 21 (55.3) | 0.356 |
| Female | 43 (55.8) | 22 (48.9) | 17 (44.7) | ||
| Age at diagnosis (y) | |||||
| Mean ± SD | 9.1 ± 5.6 | 7.5 ± 4.7 | 0.106 | 7.8 ± 4.8 | 0.205 |
| Median (min–max) | 7.4 (1.1–17.9) | 5.7 (1.3–16.1) | 5.8 (1.3–16.1) | ||
| Age at EOT (y) | |||||
| Mean ± SD | 10.6 ± 5.5 | 8.9 ± 4.5 | 0.077 | 9.2 ± 4.7 | 0.162 |
| Median (min–max) | 7.9 (2.8–19.7) | 7.0 (1.9–18.1) | 7.1 (1.9–18.1) | ||
| Age at EOS (y) | |||||
| Mean ± SD | 12.0 ± 5.6 | 10.2 ± 4.5 | 0.064 | 10.4 ± 4.7 | 0.134 |
| Median (min–max) | 9.9 (4.5–21.0) | 8.3 (3.2–18.9) | 8.6 (3.2–18.9) | ||
| Age categories at EOS, n (%) | |||||
| Children (<10 y) | 44 (57.1) | 30 (66.7) | 0.340 | 24 (63.2) | 0.678 |
| Adolescents (≥10 y) | 33 (42.9) | 15 (33.3) | 14 (36.8) | ||
| Time between EOT and EOS (y) | |||||
| Mean ± SD | 1.4 ± 0.8 | 1.3 ± 0.8 | 0.465 | 1.3 ± 0.8 | 0.422 |
| Median (min–max) | 1.4 (0.0–3.5) | 1.3 (0.1–2.7) | 1.2 (0.1–2.7) | ||
| Cancer diagnosis, n (%) | |||||
| Leukemia 4 | 33 (42.9) | 25 (55.6) | 0.507 | 22 (57.9) | 0.340 |
| Lymphoma 5 | 19 (24.7) | 7 (15.6) | 6 (15.8) | ||
| Sarcoma 6 | 8 (10.4) | 5 (11.1) | 5 (13.2) | ||
| Other 7 | 17 (22.1) | 8 (17.8) | 5 (13.2) | ||
| Treatment duration (y) | |||||
| Mean ± SD | 1.5 ± 0.8 | 1.4 ± 0.8 | 0.461 | 1.4 ± 0.8 | 0.534 |
| Median (min–max) | 2.1 (0.2–3.2) | 1.4 (0.2–2.4) | 1.5 (0.2–2.4) |
| Control Group n = 77 | Intervention Group n = 45 | p-Value 1 | Intervention Subgroup 2 n = 38 | p-Value 3 | |
|---|---|---|---|---|---|
| Energy | |||||
| kcal | |||||
| Mean ± SD | 1997 ± 669 | 1759 ± 513 | 0.042 | 1803 ± 526 | 0.121 |
| Median (min–max) | 1854 (810–4370) | 1695 (1007–3351) | 1720 (1074–3351) | ||
| kcal/kg | |||||
| Mean ± SD | 58.0 ± 31.4 | 57.4 ± 28.9 | 0.917 | 56.9 ± 28.9 | 0.861 |
| Median (min–max) | 51.7 (15.3–160.7) | 54.6 (14.2–116.5) | 53.0 (14.2–116.5) | ||
| % of EER | |||||
| Mean ± SD | 99.4 ± 26 | 94.8 ± 25.7 | 0.342 | 95.2 ± 25.7 | 0.417 |
| Median (min–max) | 100.4 (49.0–164.5) | 94.8 (41.0–141.6) | 95.0 (41.0–141.6) | ||
| Fat | |||||
| g/kg | |||||
| Mean ± SD | 2.1 ± 1.3 | 2.3 ± 1.3 | 0.578 | 2.3 ± 1.3 | 0.609 |
| Median (min–max) | 1.7 (0.3–5.8) | 2.0 (0.4–5.5) | 2.0 (0.4–5.5) | ||
| %Energy | |||||
| Mean ± SD | 32.6 ± 7.7 | 35.4 ± 7.8 | 0.055 | 35.3 ± 8.1 | 0.082 |
| Median (min–max) | 31.8 (18.5–49.4) | 35.2 (14.9–52.2) | 35.3 (14.9–52.2) | ||
| n (%) | |||||
| >AMDR | 26 (33.8) | 23 (51.1) | 0.057 | 20 (52.6) | 0.083 |
| =AMDR | 38 (49.4) | 20 (44.4) | 16 (42.1) | ||
| <AMDR | 13 (16.9) | 2 (4.4) | 2 (5.3) | ||
| Carbohydrates | |||||
| g/kg | |||||
| Mean ± SD | 7.6 ± 4.5 | 7.1 ± 3.7 | 0.521 | 6.9 ± 3.6 | 0.417 |
| Median (min–max) | 6.7 (1.9–25.1) | 7.3 (1.5–15.8) | 6.7 (1.5–15.8) | ||
| %Energy | |||||
| Mean ± SD | 52.5 ± 9.7 | 49.4 ± 9.4 | 0.089 | 48.9 ± 9.9 | 0.064 |
| Median (min–max) | 53.3 (22.0–72.9) | 49.0 (27.1–70.5) | 48.7 (27.1–70.5) | ||
| n (%) | |||||
| >AMDR | 7 (9.1) | 2 (4.4) | 0.320 | 2 (4.4) | 0.171 |
| =AMDR | 54 (70.1) | 29 (64.4) | 22 (64.4) | ||
| <AMDR | 16 (20.8) | 14 (31.1) | 14 (31.1) | ||
| Proteins | |||||
| g/kg | |||||
| Mean ± SD | 2.2 ± 1.1 | 2.4 ± 1.4 | 0.370 | 2.4 ± 1.4 | 0.286 |
| Median (min–max) | 2.1 (0.4–4.8) | 1.9 (0.4–6.0) | 2.1 (0.4–6.0) | ||
| %Energy | |||||
| Mean ± SD | 15.3 ± 4.1 | 16.6 ± 4.7 | 0.121 | 17.2 ± 4.6 | 0.029 |
| Median (min–max) | 14.9 (8.7–32.6) | 16.2 (8.8–27.0) | 17.1 (10.1–27.0) | ||
| %RDA | |||||
| Mean ± SD | 236.4 ± 116.3 | 251.2 ± 144.1 | 0.535 | 257.0 ± 143.6 | 0.411 |
| Median (min–max) | 228.7 (48.9–506.6) | 208.5 (52.0–607.2) | 217.6 (52.0–607.2) | ||
| n (%) | |||||
| >RDA | 71 (92.2) | 41 (91.1) | 0.541 | 36 (94.7) | 0.616 |
| <RDA | 6 (7.8) | 4 (8.9) | 2 (5.3) | ||
| Dietary fiber | |||||
| g/1000 kcal | |||||
| Mean ± SD | 8.4 ± 2.8 | 9.2 ± 3.4 | 0.188 | 9.0 ± 3.1 | 0.322 |
| Median (min–max) | 8.3 (3.9–19.5) | 8.9 (3.7–19.3) | 8.6 (3.7–15.6) | ||
| %AI | |||||
| Mean ± SD | 58.1 ± 22.7 | 60.6 ± 27.8 | 0.586 | 60.5 ± 27.6 | 0.618 |
| Median (min–max) | 56.0 (18.8–127.5) | 57.9 (17.2–112.6) | 56.6 (17.2–112.6) | ||
| n (%) | |||||
| >AI | 5 (6.5) | 2 (4.4) | 0.713 | 2 (5.3) | 0.795 |
| <AI | 72 (93.5) | 43 (95.6) | 36 (94.7) | ||
| Sodium | |||||
| mg/1000 kcal | |||||
| Mean ± SD | 1358.2 ± 546.5 | 1414.5 ± 397.4 | 0.548 | 1438.9 ± 404.9 | 0.421 |
| Median (min–max) | 1312.9 (446.9–2920.5) | 1412.8 (595.3–2330.4) | 1407.2 (653.4–2330.4) | ||
| %UL | |||||
| Mean ± SD | 128.6 ± 68.8 | 122.6 ± 48.6 | 0.610 | 126.8 ± 48.9 | 0.883 |
| Median (min–max) | 105.0 (34.8–311.1) | 108.5 (26.1–237.3) | 110.9 (59.6–237.3) | ||
| n (%) | |||||
| >UL | 43 (55.8) | 29 (64.4) | 0.446 | 26 (68.4) | 0.228 |
| <UL | 34 (44.2) | 16 (35.6) | 12 (31.6) | ||
| Calcium | |||||
| mg/1000 kcal | |||||
| Mean ± SD | 432.3 ± 197.1 | 547.5 ± 240.0 | 0.005 | 569.6 ± 240.3 | 0.001 |
| Median (min–max) | 390.3 (127.4–1218.9) | 523.3 (124.0–1206.6) | 536.8 (194.0–1206.6) | ||
| %RDA | |||||
| Mean ± SD | 81.3 ± 49.1 | 89.1 ± 48.3 | 0.393 | 94.0 ± 48.7 | 0.195 |
| Median (min–max) | 70.9 (13.4–260.6) | 86.6 (9.6–209.8) | 92.1 (26.5–209.8) | ||
| n (%) | |||||
| >RDA | 28 (36.4) | 20 (43.5) | 0.451 | 18 (47.4) | 0.313 |
| <RDA | 49 (63.6) | 26 (56.5) | 20 (52.6) | ||
| Vitamin C | |||||
| mg/1000 kcal | |||||
| Mean ± SD | 59.6 ± 44.1 | 59.9 ± 47.0 | 0.975 | 55.2 ± 42.9 | 0.610 |
| Median (min–max) | 52.5 (0.8–183.0) | 46.4 (1.8–191.0) | 46.4 (1.8–141.1) | ||
| %RDA | |||||
| Mean ± SD | 295.9 ± 250.3 | 338.6 ± 330.5 | 0.421 | 322.7 ± 327.5 | 0.627 |
| Median (min–max) | 235.1 (1.9–1123.5) | 206.1 (7.6–1156.2) | 184.3 (7.6–1156.2) | ||
| n (%) | |||||
| >RDA | 58 (75.3) | 32 (71.1) | 0.672 | 26 (68.4) | 0.504 |
| <RDA | 19 (24.7) | 13 (28.9) | 12 (31.6) | ||
| Vitamin D | |||||
| µg/1000 kcal | |||||
| Mean ± SD | 2.2 ± 2.0 | 2.6 ± 2.0 | 0.311 | 2.9 ± 2.1 | 0.095 |
| Median (min–max) | 1.9 (0.0–9.9) | 2.2 (0.1–9.3) | 2.6 (0.1–9.3) | ||
| %RDA | |||||
| Mean ± SD | 29.6 ± 24.8 | 31.8 ± 27.8 | 0.646 | 35.7 ± 28.3 | 0.235 |
| Median (min–max) | 26.6 (0.2–101.3) | 25.2 (1.3–119.8) | 34.2 (1.3–119.8) | ||
| n (%) | |||||
| >RDA | 1 (1.3) | 2 (4.4) | 0.554 | 2 (5.3) | 0.253 |
| <RDA | 76 (98.7) | 43 (95.6) | 36 (94.7) |
| Control Group n = 77 | Intervention Group n = 45 | p-Value 1 | Intervention Subgroup 2 n = 38 | p-Value 3 | |
|---|---|---|---|---|---|
| Diet Quality Index (DQI) 4 | |||||
| Mean ± SD | 52.8 ± 12.9 | 51.8 ± 11.6 | 0.694 | 52.3 ± 11.3 | 0.845 |
| Median (min–max) | 53.5 (27.0–74.0) | 54.5 (30.5–77.5) | 55.2 (32.5–77.5) | ||
| Healthy Diet Indicator (HDI) 5 | |||||
| Mean ± SD | 3.0 ± 1.4 | 2.6 ± 1.2 | 0.159 | 2.8 ± 1.1 | 0.463 |
| Median (min–max) | 3.0 (0–7) | 2.0 (0–6) | 3.0 (1–6) | ||
| Level of adherence, n (%) | |||||
| Low | 51 (66.2) | 35 (77.8) | 0.350 | 29 (76.3) | 0.452 |
| Medium | 24 (31.2) | 10 (22.2) | 9 (23.7) | ||
| High | 2 (2.6) | 0 (0) | 0 (0) |
| Control Group | Intervention Group | p-Value 1 | Intervention Subgroup 2 | p-Value 3 | |
|---|---|---|---|---|---|
| Weight, z-score | n = 77 | n = 45 | n = 38 | ||
| Mean ± SD | 0.28 ± 1.17 | 0.45 ± 1.48 | 0.482 | 0.51 ± 1.55 | 0.358 |
| Median (min–max) | 0.18 (−1.78–3.59) | 0.16 (−1.98–6.18) | 0.18 (−1.98–6.18) | ||
| Height, z-score | n = 76 | n = 45 | n = 38 | ||
| Mean ± SD | −0.08 ± 0.94 | −0.25 ± 0.94 | 0.353 | −0.19 ± 0.96 | 0.569 |
| Median (min–max) | −0.09 (−2.40–2.78) | −0.09 (−3.26–2.17) | −0.07 (−3.26–2.17) | ||
| BMI, z-score | n = 76 | n = 45 | n = 38 | ||
| Mean ± SD | 0.38 ± 1.20 | 0.71 ± 1.36 | 0.167 | 0.74 ± 1.38 | 0.149 |
| Median (min–max) | 0.27 (−2.09–3.43) | 0.48 (−1.68–5.62) | 0.56 (−1.68–5.62) | ||
| WC, z-score | n = 69 | n = 39 | n = 32 | ||
| Mean ± SD | 0.73 ± 0.69 | 0.64 ± 0.97 | 0.584 | 0.65 ± 0.98 | 0.632 |
| Median (min–max) | 0.74 (−1.19–2.22) | 0.71 (−1.79–2.15) | 0.74 (−1.79–2.15) | ||
| MUAC, z-score | n = 75 | n = 42 | n = 35 | ||
| Mean ± SD | 0.80 ± 0.91 | 0.49 ± 1.35 | 0.151 | 0.48 ± 1.42 | 0.159 |
| Median (min–max) | 0.75 (−1.12–3.05) | 0.53 (−4.95–2.61) | 0.53 (−4.95–2.61) | ||
| TSFT, z-score | n = 71 | n = 41 | n = 34 | ||
| Mean ± SD | 0.35 ± 1.36 | 0.39 ± 0.90 | 0.863 | 0.42 ± 0.92 | 0.768 |
| Median (min–max) | 0.43 (−2.66–3.47) | 0.45 (−1.73–2.23) | 0.56 (−1.73–2.23) | ||
| SSFT, z-score | n = 68 | n = 39 | n = 33 | ||
| Mean ± SD | 0.12 ± 1.14 | 0.18 ± 1.11 | 0.806 | 0.17 ± 1.20 | 0.854 |
| Median (min–max) | −0.02 (−2.79–2.70) | 0.17 (−2.64–2.30) | 0.15 (−2.64–2.30) |
| Control Group | Intervention Group | p-Value 1 | Intervention Subgroup 2 | p-Value 3 | |
|---|---|---|---|---|---|
| Blood pressure | |||||
| Systolic, mmHg | n = 76 | n = 42 | n = 35 | ||
| Mean ± SD | 104 ± 14 | 103 ± 10 | 0.845 | 104 ± 10 | 0.899 |
| Median (min–max) | 101 (73–136) | 101 (88–134) | 101 (88–134) | ||
| Systolic, z-score | n = 76 | n = 39 | n = 32 | ||
| Mean ± SD | 0.01 ± 1.00 | 0.01 ± 0.79 | 0.992 | 0.04 ± 0.831 | 0.976 |
| Median (min–max) | 0.07 (−2.33–2.33) | −0.09 (−1.41–1.69) | −0.10 (−1.41–1.69) | ||
| Diastolic, mmHg | n = 76 | n = 42 | n = 35 | ||
| Mean ± SD | 61 ± 8 | 61 ± 10 | 0.983 | 60 ± 8 | 0.737 |
| Median (min–max) | 60 (42–84) | 59 (45–98) | 59 (45–75) | ||
| Diastolic, z-score | n = 76 | n = 39 | n = 32 | ||
| Mean ± SD | −0.07 ± 0.64 | 0.05 ± 1.01 | 0.419 | −0.03 ± 0.852 | 0.791 |
| Median (min–max) | −0.08 (−1.75–1.75) | −0.08 (−2.24–3.92) | −0.13 (−2.24–1.84) | ||
| Blood lipids | |||||
| TC, mmol/L | n = 77 | n = 42 | n = 35 | ||
| Mean ± SD | 4.15 ± 0.82 | 4.21 ± 1.14 | 0.720 | 4.26 ± 1.24 | 0.566 |
| Median (min–max) | 4.05 (2.27–6.79) | 4.01 (2.29–8.53) | 3.99 (2.29–8.53) | ||
| TC classification, n (%) | n = 77 | n = 42 | n = 35 | ||
| Normal value | 68 (88.3) | 37 (88.1) | 1.000 | 30 (85.7) | 0.939 |
| High value | 9 (11.7) | 5 (11.9) | 5 (14.3) | ||
| LDL-C, mmol/L | n = 77 | n = 41 | n = 34 | ||
| Mean ± SD | 2.46 ± 0.74 | 2.43 ± 1.13 | 0.862 | 2.50 ± 1.22 | 0.837 |
| Median (min–max) | 2.39 (0.60–5.04) | 2.24 (0.84–6.80) | 2.26 (0.84–6.80) | ||
| LDL-C classification, n (%) | n = 77 | n = 41 | n = 34 | ||
| Normal value | 68 (88.3) | 37 (90.2) | 0.773 | 30 (88.2) | 1.000 |
| High value | 9 (11.7) | 4 (9.8) | 4 (11.8) | ||
| HDL-C, mmol/L | n = 77 | n = 41 | n = 34 | ||
| Mean ± SD | 1.30 ± 0.28 | 1.31 ± 0.31 | 0.908 | 1.28 ± 0.30 | 0.785 |
| Median (min–max) | 1.31 (0.68–2.01) | 1.28 (0.74–1.85) | 1.27 (0.77–1.85) | ||
| HDL-C classification, n (%) | n = 77 | n = 41 | n = 34 | ||
| Normal value | 62 (80.5) | 33 (80.5) | 1.000 | 27 (79.4) | 1.000 |
| Low value | 15 (19.5) | 8 (19.5) | 7 (20.6) | ||
| Glucose metabolism | |||||
| HbA1c (%) | n = 71 | n = 33 | n = 27 | ||
| Mean ± SD | 5.15 ± 0.29 | 5.12 ± 0.36 | 0.705 | 5.06 ± 0.33 | 0.230 |
| Median (min–max) | 5.10 (4.30–6.00) | 5.20 (4.40–5.80) | 5.20 (4.40–5.70) | ||
| Micronutrient status | |||||
| Vitamin D (nmol/L) | n = 74 | n = 35 | n = 30 | ||
| Mean ± SD | 70.2 ± 23.5 | 65.4 ± 29.3 | 0.360 | 69.1 ± 29.0 | 0.845 |
| Median (min–max) | 69.5 (15.0–132.8) | 61.3 (14.5–151.3) | 63.3 (14.5–151.3) | ||
| Vitamin D classification, n (%) | n = 74 | n = 35 | n = 30 | ||
| Sufficiency | 59 (79.7) | 23 (65.7) | 0.276 | 22 (73.3) | 0.773 |
| Insufficiency | 11 (14.9) | 8 (22.9) | 6 (20.0) | ||
| Deficiency | 4 (5.4) | 4 (11.4) | 2 (6.7) |
| Control Group | Intervention Group | p-Value 1 | Intervention Subgroup 2 | p-Value 3 | |
|---|---|---|---|---|---|
| High blood pressure, n (%) | |||||
| All participants | n = 76 | n = 42 | n = 35 | ||
| 20 (26.3) | 9 (21.4) | 0.658 | 8 (22.9) | 0.877 | |
| Children 4 | n = 44 | n = 28 | n = 22 | ||
| 7 (15.9) | 6 (21.4) | 0.754 | 5 (22.7) | 0.735 | |
| Adolescents 5 | n = 32 | n = 14 | n = 13 | ||
| 13 (40.6) | 3 (21.4) | 0.316 | 3 (23.1) | 0.441 | |
| High HbA1c, n (%) | |||||
| All participants | n = 72 | n = 33 | n = 27 | ||
| 5 (6.9) | 2 (6.1) | 1.000 | 1 (3.7) | 0.897 | |
| Children 4 | n = 40 | n = 22 | n = 17 | ||
| 2 (5.0) | 2 (9.1) | 0.610 | 1 (5.9) | 1.000 | |
| Adolescents 5 | n = 32 | n = 11 | n = 10 | ||
| 3 (9.4) | 0 (0.0) | 0.558 | 0 (0.0) | 0.763 | |
| Blood lipid abnormalities, n (%) | |||||
| All participants | n = 77 | n = 42 | n = 35 | ||
| 25 (32.5) | 13 (31.0) | 1.000 | 12 (34.3) | 1.000 | |
| Children 4 | n = 44 | n = 28 | n = 22 | ||
| 6 (13.6) | 6 (21.4) | 0.519 | 5 (22.7) | 0.559 | |
| Adolescents 5 | n = 33 | n = 14 | n = 13 | ||
| 19 (57.6) | 7 (50.0) | 0.752 | 7 (53.8) | 1.000 | |
| Obesity, n (%) | |||||
| All participants | n = 76 | n = 42 | n = 35 | ||
| 9 (11.8) | 6 (14.3) | 0.776 | 6 (17.1) | 0.645 | |
| Children 4 | n = 43 | n = 28 | n = 22 | ||
| 3 (7.0) | 2 (7.1) | 1.000 | 2 (9.1) | 1.000 | |
| Adolescents 5 | n = 33 | n = 14 | n = 13 | ||
| 6 (18.2) | 4 (28.6) | 0.456 | 4 (30.8) | 0.593 | |
| ≥2 risk factors, n (%) | |||||
| All participants | n = 77 | n = 42 | n = 35 | ||
| 14 (18.2) | 8 (19.0) | 1.000 | 7 (20.0) | 0.894 | |
| Children 4 | n = 44 | n = 28 | n = 22 | ||
| 1 (2.3) | 3 (10.7) | 0.292 | 3 (13.6) | 0.060 | |
| Adolescents 5 | n = 33 | n = 14 | n = 13 | ||
| 13 (39.4) | 5 (35.7) | 1.000 | 4 (30.8) | 0.836 |
Disclaimer/Publisher’s Note: The statements, opinions and data contained in all publications are solely those of the individual author(s) and contributor(s) and not of MDPI and/or the editor(s). MDPI and/or the editor(s) disclaim responsibility for any injury to people or property resulting from any ideas, methods, instructions or products referred to in the content. |
© 2025 by the authors. Licensee MDPI, Basel, Switzerland. This article is an open access article distributed under the terms and conditions of the Creative Commons Attribution (CC BY) license (https://creativecommons.org/licenses/by/4.0/).
Share and Cite
Delorme, J.; Dima, A.; Bélanger, V.; Napartuk, M.; Bouchard, I.; Meloche, C.; Curnier, D.; Sultan, S.; Laverdière, C.; Sinnett, D.; et al. Impact of Early Nutritional Intervention During Cancer Treatment on Dietary Intakes and Cardiometabolic Health in Children and Adolescents. Cancers 2025, 17, 157. https://doi.org/10.3390/cancers17010157
Delorme J, Dima A, Bélanger V, Napartuk M, Bouchard I, Meloche C, Curnier D, Sultan S, Laverdière C, Sinnett D, et al. Impact of Early Nutritional Intervention During Cancer Treatment on Dietary Intakes and Cardiometabolic Health in Children and Adolescents. Cancers. 2025; 17(1):157. https://doi.org/10.3390/cancers17010157
Chicago/Turabian StyleDelorme, Josianne, Andra Dima, Véronique Bélanger, Mélanie Napartuk, Isabelle Bouchard, Caroline Meloche, Daniel Curnier, Serge Sultan, Caroline Laverdière, Daniel Sinnett, and et al. 2025. "Impact of Early Nutritional Intervention During Cancer Treatment on Dietary Intakes and Cardiometabolic Health in Children and Adolescents" Cancers 17, no. 1: 157. https://doi.org/10.3390/cancers17010157
APA StyleDelorme, J., Dima, A., Bélanger, V., Napartuk, M., Bouchard, I., Meloche, C., Curnier, D., Sultan, S., Laverdière, C., Sinnett, D., & Marcil, V. (2025). Impact of Early Nutritional Intervention During Cancer Treatment on Dietary Intakes and Cardiometabolic Health in Children and Adolescents. Cancers, 17(1), 157. https://doi.org/10.3390/cancers17010157