Quantitative Optical Redox Imaging of Melanoma Xenografts with Different Metastatic Potentials
Abstract
Simple Summary
Abstract
1. Introduction
2. Materials and Methods
2.1. Mouse Xenograft Models and Sample Preparation
2.2. Redox Scanning
2.3. Data Analysis
2.4. H&E Staining and Cell Counting
2.5. Statistical Analysis
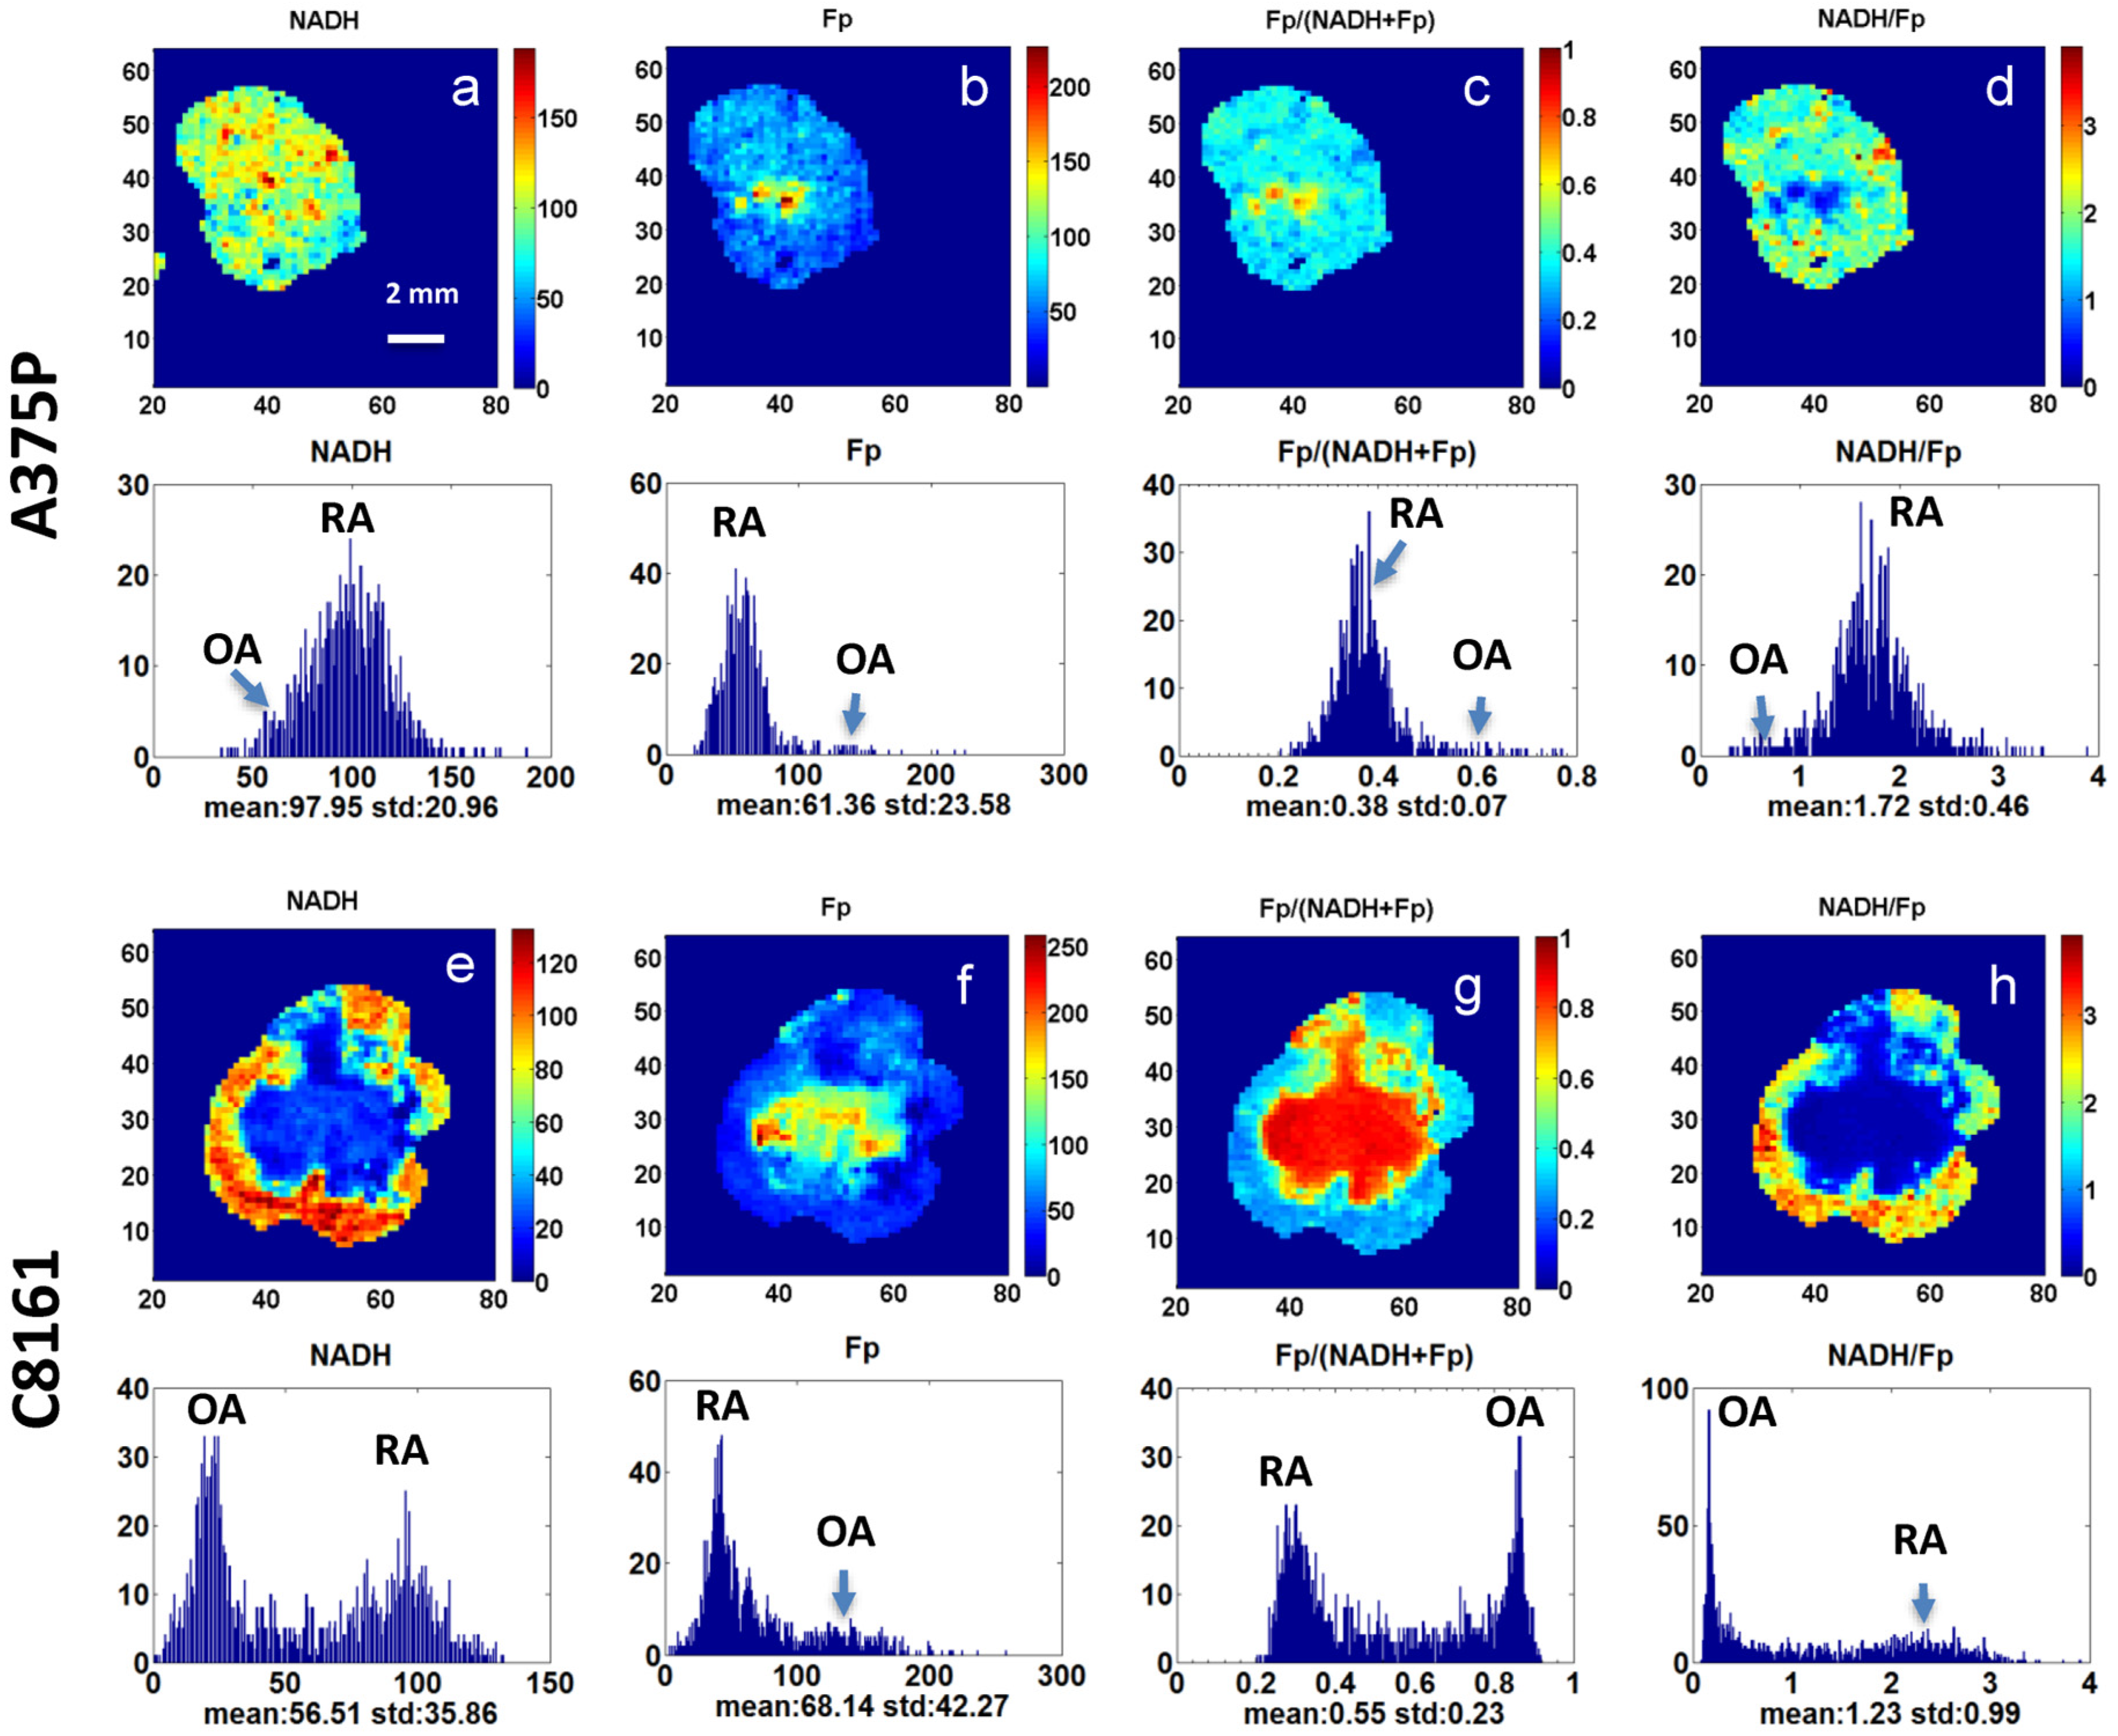
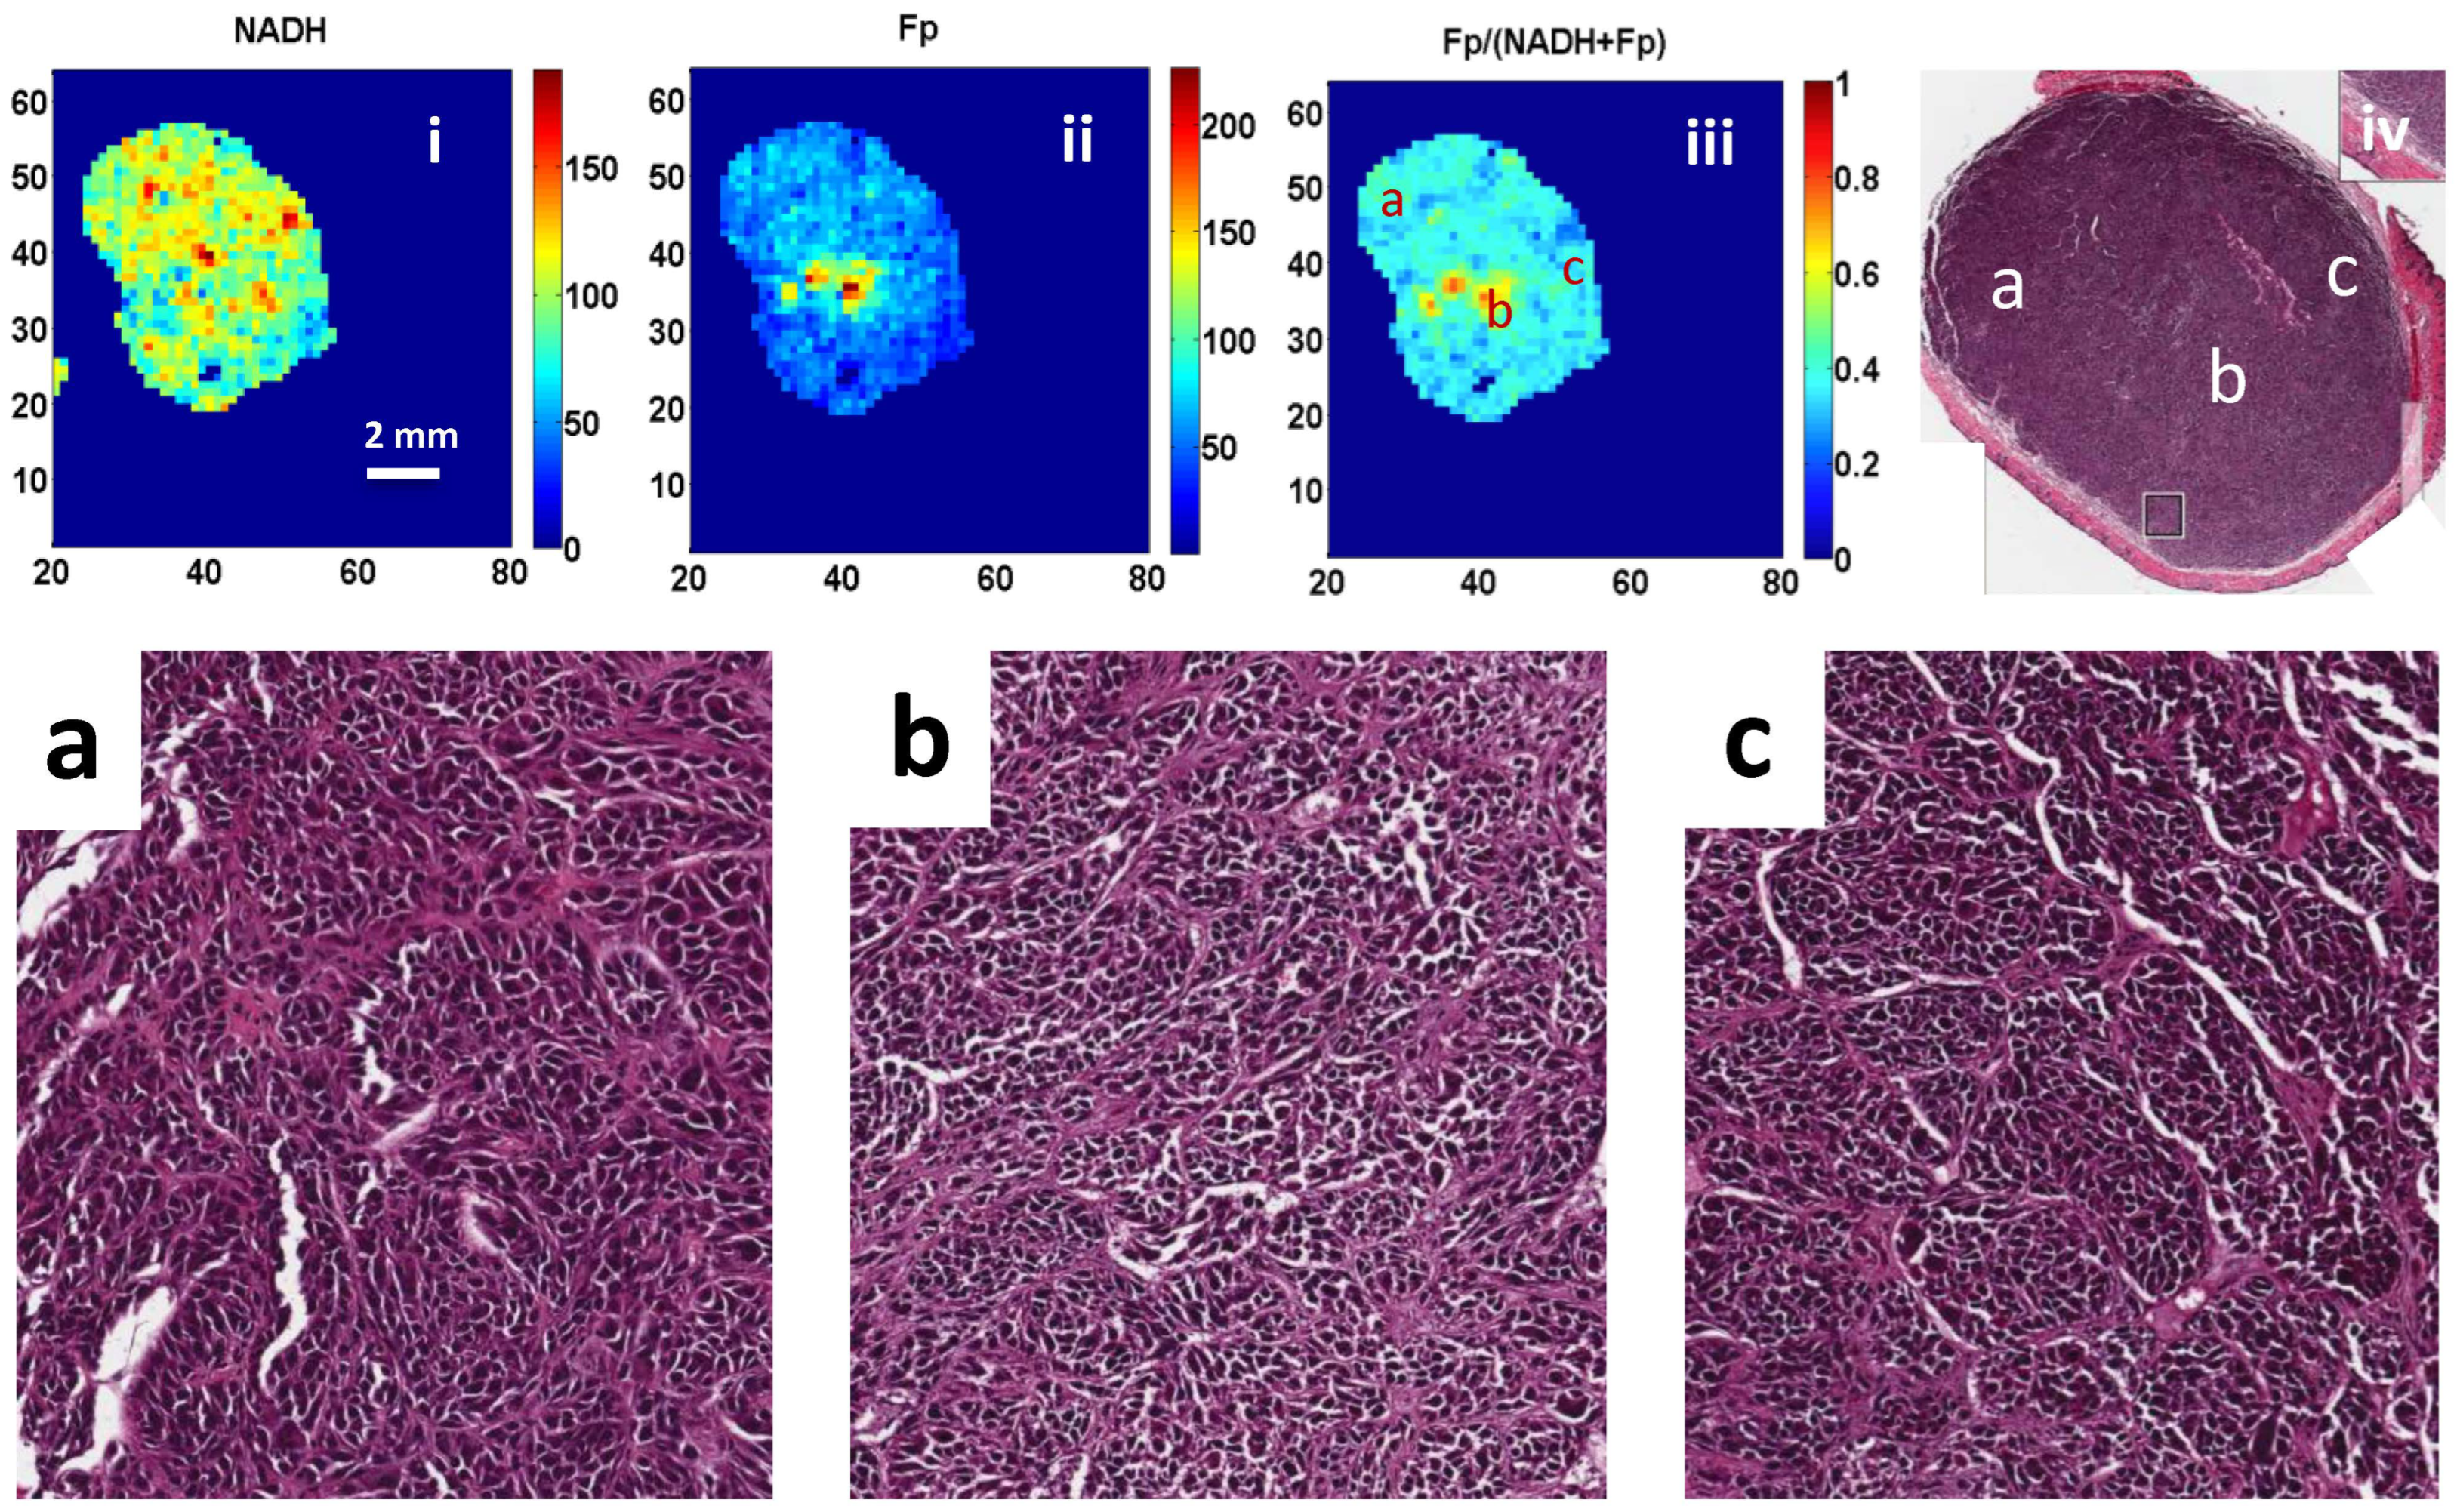
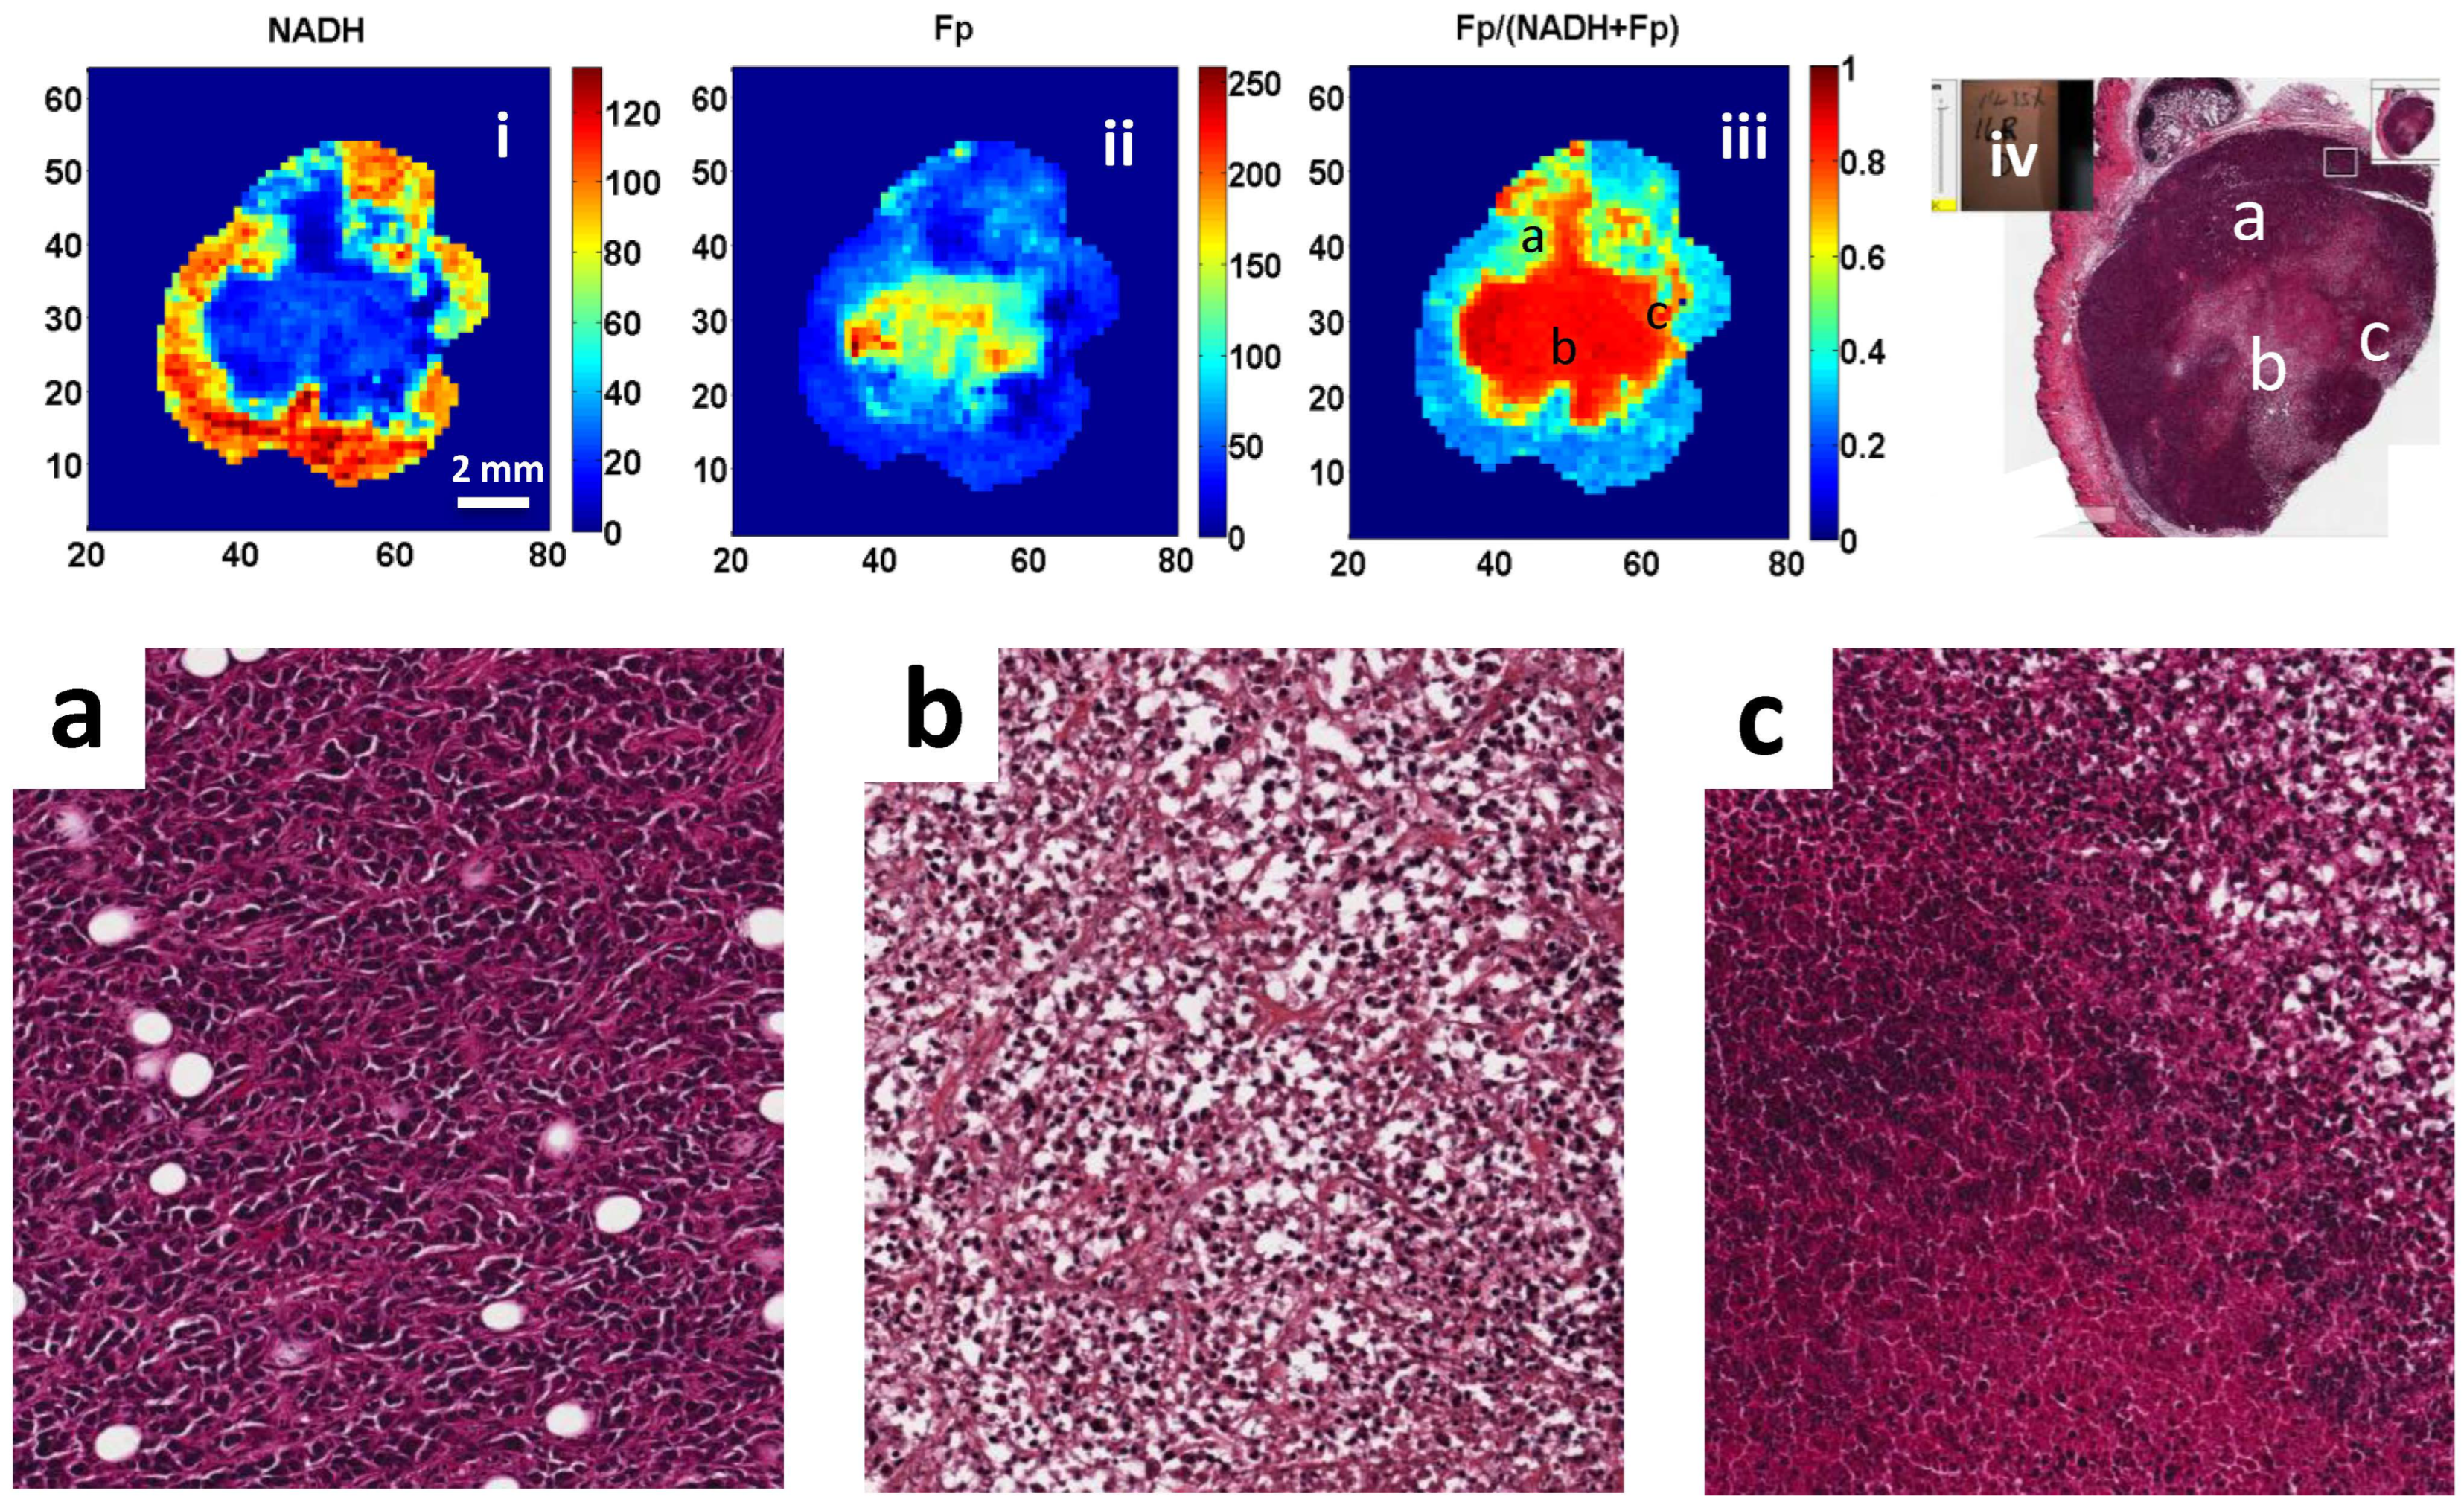
3. Results
4. Discussion
5. Conclusions
Author Contributions
Funding
Institutional Review Board Statement
Informed Consent Statement
Data Availability Statement
Acknowledgments
Conflicts of Interest
Appendix A. Gaussian Fitting of Fp/(Fp + NADH) Histograms and Comparison to Visual Resulting Analysis

| Methods | A375P OA | C8161 OA | A375P RA | C8161 RA |
|---|---|---|---|---|
| OA/RA visual reading | 0.635 ± 0.042 | 0.782 ± 0.031 | 0.403 ± 0.118 | 0.398 ± 0.101 |
| Gaussian curve fitting | 0.546 ± 0.184 | 0.788 ± 0.035 | 0.394 ± 0.129 | 0.447 ± 0.152 |
| p # | 0.25 | 0.67 | 0.41 | 0.20 |
Appendix B. Validation of Cell Counting on H&E Slides Using ImageJ Software

| Average ImageJ Cell Count (n = 10) | Average Visual Cell Count (n = 10) | p-Value |
|---|---|---|
| 106 ± 17.3 | 108 ± 16.3 | 0.76 |
References
- Li, L.Z.; Xu, H.N.; Ranji, M.; Nioka, S.; Chance, B. Mitochondrial redox imaging for cancer diagnostic and therapeutic studies. J. Innov. Opt. Health Sci. 2009, 2, 325–341. [Google Scholar] [CrossRef] [PubMed]
- Quistorff, B.; Haselgrove, J.C.; Chance, B. High spatial resolution readout of 3-D metabolic organ structure: An automated, low-temperature redox ratio-scanning instrument. Anal. Biochem. 1985, 148, 389–400. [Google Scholar] [CrossRef] [PubMed]
- Gu, Y.; Qian, Z.; Chen, J.; Blessington, D.; Ramanujam, N.; Chance, B. High-resolution three-dimensional scanning optical image system for intrinsic and extrinsic contrast agents in tissue. Rev. Sci. Instrum. 2002, 73, 172–178. [Google Scholar] [CrossRef]
- Chance, B.; Schoener, B.; Oshino, R.; Itshak, F.; Nakase, Y. Oxidation-reduction ratio studies of mitochondria in freeze-trapped samples. NADH and flavoprotein fluorescence signals. J. Biol. Chem. 1979, 254, 4764–4771. [Google Scholar] [CrossRef] [PubMed]
- Walsh, A.J.; Cook, R.S.; Manning, H.C.; Hicks, D.J.; Lafontant, A.; Arteaga, C.L.; Skala, M.C. Optical metabolic imaging identifies glycolytic levels, subtypes, and early-treatment response in breast cancer. Cancer Res. 2013, 73, 6164–6174. [Google Scholar] [CrossRef] [PubMed]
- Georgakoudi, I.; Quinn, K.P. Optical imaging using endogenous contrast to assess metabolic state. Annu. Rev. Biomed. Eng. 2012, 14, 351–367. [Google Scholar] [CrossRef] [PubMed]
- Quinn, K.P.; Sridharan, G.V.; Hayden, R.S.; Kaplan, D.L.; Lee, K.; Georgakoudi, I. Quantitative metabolic imaging using endogenous fluorescence to detect stem cell differentiation. Sci. Rep. 2013, 3, 3432. [Google Scholar] [CrossRef] [PubMed]
- Hou, J.; Wright, H.J.; Chan, N.; Tran, R.; Razorenova, O.V.; Potma, E.O.; Tromberg, B.J. Correlating two-photon excited fluorescence imaging of breast cancer cellular redox state with seahorse flux analysis of normalized cellular oxygen consumption. J. Biomed. Opt. 2016, 21, 060503. [Google Scholar] [CrossRef] [PubMed]
- Podsednik, A.; Jacob, A.; Li, L.Z.; Xu, H.N. Relationship between optical redox status and reactive oxygen species in cancer cells. React. Oxyg. Species 2020, 9, 95–108. [Google Scholar] [CrossRef]
- Alam, S.R.; Wallrabe, H.; Svindrych, Z.; Chaudhary, A.K.; Christopher, K.G.; Chandra, D.; Periasamy, A. Investigation of mitochondrial metabolic response to doxorubicin in prostate cancer cells: An NADH, FAD and tryptophan FLIM assay. Sci. Rep. 2017, 7, 10451. [Google Scholar] [CrossRef] [PubMed]
- Chance, B.; Cohen, P.; Jobsis, F.; Schoener, B. Intracellular oxidation-reduction states in vivo. Science 1962, 137, 499–508. [Google Scholar] [CrossRef] [PubMed]
- Alhallak, K.; Rebello, L.G.; Muldoon, T.J.; Quinn, K.P.; Rajaram, N. Optical redox ratio identifies metastatic potential-dependent changes in breast cancer cell metabolism. Biomed. Opt. Express 2016, 7, 4364–4374. [Google Scholar] [CrossRef] [PubMed]
- Hassinen, I.; Chance, B. Oxidation-reduction properties of the mitochondrial flavoprotein chain. Biochem. Biophys. Res. Commun. 1968, 31, 895–900. [Google Scholar] [CrossRef] [PubMed]
- Shah, A.T.; Demory Beckler, M.; Walsh, A.J.; Jones, W.P.; Pohlmann, P.R.; Skala, M.C. Optical metabolic imaging of treatment response in human head and neck squamous cell carcinoma. PLoS ONE 2014, 9, e90746. [Google Scholar] [CrossRef]
- Fang, N.; Wu, Z.; Wang, X.; Lin, Y.; Li, L.; Huang, Z.; Chen, Y.; Zheng, X.; Cai, S.; Tu, H.; et al. Quantitative assessment of microenvironment characteristics and metabolic activity in glioma via multiphoton microscopy. J. Biophotonics 2019, 12, e201900136. [Google Scholar] [CrossRef] [PubMed]
- Xu, H.N.; Tchou, J.; Chance, B.; Li, L.Z. Imaging the redox states of human breast cancer core biopsies. Adv. Exp. Med. Biol. 2013, 765, 343–349. [Google Scholar] [CrossRef] [PubMed]
- Xu, H.N.; Tchou, J.; Li, L.Z. Redox imaging of human breast cancer core biopsies: A preliminary investigation. Acad. Radiol. 2013, 20, 764–768. [Google Scholar] [CrossRef] [PubMed]
- Xu, H.N.; Tchou, J.; Feng, M.; Zhao, H.; Li, L.Z. Optical redox imaging indices discriminate human breast cancer from normal tissues. J. Biomed. Opt. 2016, 21, 114003. [Google Scholar] [CrossRef] [PubMed]
- Li, L.Z.J.; Zhou, R.; Zhong, T.; Moon, L.; Kim, E.J.; Qiao, H.; Pickup, S.; Hendrix, M.J.; Leeper, D.; Chance, B.; et al. Predicting melanoma metastatic potential by optical and magnetic resonance imaging. Adv. Exp. Med. Biol. 2007, 599, 67–78. [Google Scholar] [PubMed]
- Li, L.Z.; Zhou, R.; Xu, H.N.; Moon, L.; Zhong, T.; Kim, E.J.; Qiao, H.; Reddy, R.; Leeper, D.; Chance, B.; et al. Quantitative magnetic resonance and optical imaging biomarkers of melanoma metastatic potential. Proc. Natl. Acad. Sci. USA 2009, 106, 6608–6613. [Google Scholar] [CrossRef] [PubMed]
- Xu, H.N.; Nioka, S.; Glickson, J.D.; Chance, B.; Li, L.Z. Quantitative mitochondrial redox imaging of breast cancer metastatic potential. J. Biomed. Opt. 2010, 15, 036010. [Google Scholar] [CrossRef] [PubMed]
- Li, L.Z. Imaging mitochondrial redox potential and its possible link to tumor metastatic potential. J. Bioenerg. Biomembr. 2012, 44, 645–653. [Google Scholar] [CrossRef] [PubMed][Green Version]
- Xu, H.N.; Nioka, S.; Chance, B.; Li, L.Z. Heterogeneity of mitochondrial redox state in premalignant pancreas in a PTEN null transgenic mouse model. Adv. Exp. Med. Biol. 2011, 701, 207–213. [Google Scholar] [CrossRef] [PubMed]
- Xu, H.N.; Nioka, S.; Chance, B.; Li, L.Z. Imaging heterogeneity in the mitochondrial redox state of premalignant pancreas in the pancreas-specific PTEN-null transgenic mouse model. Biomark. Res. 2013, 1, 6. [Google Scholar] [CrossRef] [PubMed]
- Xu, H.N.; Wu, B.; Nioka, S.; Chance, B.; Li, L.Z. Calibration of redox scanning for tissue samples. In Optical Tomography and Spectroscopy of Tissue VIII; SPIE: San Jose, CA, USA, 2009; Volume 7174, pp. 71742F-1–71742F-8. [Google Scholar]
- Xu, H.N.; Feng, M.; Moon, L.; Dolloff, N.; El-Deiry, W.; Li, L.Z. Redox imaging of the p53-dependent mitochondrial redox state in colon cancer ex vivo. J. Innov. Opt. Health Sci. 2013, 6, 1350016. [Google Scholar] [CrossRef] [PubMed]
- Xu, H.N.; Mir, T.; Lee, S.-C.; Feng, M.; Farhad, N.; Choe, R.; Glickson, J.D.; Li, L.Z. Mapping the Redox State of CHOP-Treated Non-Hodgkin’s Lymphoma Xenografts in Mice. Adv. Exp. Med. Biol. 2013, 789, 243–249. [Google Scholar] [CrossRef] [PubMed]
- Xu, H.N.; Zhao, H.; Mir, T.A.; Lee, S.C.; Feng, M.; Choe, R.; Glickson, J.D.; Li, L.Z. CHOP therapy induced mitochondrial redox state alteration in non-Hodgkin’s lymphoma xenografts. J. Innov. Opt. Health Sci. 2013, 6, 1350011. [Google Scholar] [CrossRef]
- Xu, H.N.; Feng, M.; Nath, K.; Nelson, D.; Roman, J.; Zhao, H.; Lin, Z.; Glickson, J.; Li, L.Z. Optical redox imaging of lonidamine treatment response of melanoma cells and xenografts. Mol. Imaging Biol. 2019, 21, 426–435. [Google Scholar] [CrossRef]
- Welch, D.R.; Bisi, J.E.; Miller, B.E.; Conaway, D.; Seftor, E.A.; Yohem, K.H.; Gilmore, L.B.; Seftor, R.E.; Nakajima, M.; Hendrix, M.J. Characterization of a highly invasive and spontaneously metastatic human malignant melanoma cell line. Int. J. Cancer 1991, 47, 227–237. [Google Scholar] [CrossRef] [PubMed]
- ATCC. A-375 [A375]. Available online: https://www.atcc.org/products/crl-1619 (accessed on 17 April 2024).
- Hendrix, M.J.; Seftor, E.A.; Chu, Y.W.; Seftor, R.E.; Nagle, R.B.; McDaniel, K.M.; Leong, S.P.; Yohem, K.H.; Leibovitz, A.M.; Meyskens, F.L., Jr.; et al. Coexpression of vimentin and keratins by human melanoma tumor cells: Correlation with invasive and metastatic potential. J. Natl. Cancer Inst. 1992, 84, 165–174. [Google Scholar] [CrossRef]
- Kozlowski, J.M.; Hart, I.R.; Fidler, I.J.; Hanna, N. A human melanoma line heterogeneous with respect to metastatic capacity in athymic nude mice. J. Natl. Cancer Inst. 1984, 72, 913–917. [Google Scholar] [PubMed]
- Xu, H.N.; Wu, B.; Nioka, S.; Chance, B.; Li, L.Z. Quantitative redox scanning of tissue samples using a calibration procedure. J. Innov. Opt. Health Sci. 2009, 2, 375–385. [Google Scholar] [CrossRef] [PubMed]
- Xu, H.N.; Zhou, R.; Nioka, S.; Chance, B.; Glickson, J.D.; Li, L.Z. Histological basis of MR/optical imaging of human melanoma mouse xenografts spanning a range of metastatic potentials. Adv. Exp. Med. Biol. 2009, 645, 247–253. [Google Scholar] [PubMed]
- Halpern, A.C.; Lieb, J.A. Early melanoma diagnosis: A success story that leaves room for improvement. Curr. Opin. Oncol. 2007, 19, 109–115. [Google Scholar] [CrossRef] [PubMed]
- Zhuo, S.; Chen, J.; Jiang, X.; Cheng, X.; Xie, S. Visualizing extracellular matrix and sensing fibroblasts metabolism in human dermis by nonlinear spectral imaging. Skin Res. Technol. 2007, 13, 406–411. [Google Scholar] [CrossRef] [PubMed]
- Hu, L.; Wang, N.; Cardona, E.; Walsh, A.J. Fluorescence intensity and lifetime redox ratios detect metabolic perturbations in T cells. Biomed. Opt. Express 2020, 11, 5674–5688. [Google Scholar] [CrossRef] [PubMed]
- Heaster, T.M.; Humayun, M.; Yu, J.; Beebe, D.J.; Skala, M.C. Autofluorescence Imaging of 3D Tumor-Macrophage Microscale Cultures Resolves Spatial and Temporal Dynamics of Macrophage Metabolism. Cancer Res. 2020, 80, 5408–5423. [Google Scholar] [CrossRef] [PubMed]
- Xu, H.N.; Lin, Z.; Gandhi, C.K.; Amatya, S.; Wang, Y.; Li, L.Z.; Floros, J. Sex and SP-A2 dependent NAD(H) redox alterations in mouse alveolar macrophages in response to ozone exposure: Potential implications for COVID-19. Antioxidants 2020, 9, 915. [Google Scholar] [CrossRef] [PubMed]
- Xu, H.N.; Floros, J.; Li, L.Z.; Amatya, S. Imaging NAD(H) redox alterations in cryopreserved alveolar macrophages from ozone-exposed mice and the impact of nutrient starvation during long lag times. Antioxidants 2021, 10, 767. [Google Scholar] [CrossRef] [PubMed]
- Walsh, A.J.; Mueller, K.P.; Tweed, K.; Jones, I.; Walsh, C.M.; Piscopo, N.J.; Niemi, N.M.; Pagliarini, D.J.; Saha, K.; Skala, M.C. Classification of T-cell activation via autofluorescence lifetime imaging. Nat. Biomed. Eng. 2021, 5, 77–88. [Google Scholar] [CrossRef] [PubMed]


| Redox Indices | Percent Difference of A375P # (%) | p * | Percent Difference of C8161 (%) | p |
|---|---|---|---|---|
| NADH (µM) | −42.0 | 0.012 | −67.4 | 0.008 |
| Fp (µM) | 94.9 | 0.011 | 65.1 | 0.154 |
| Fp/(Fp + NADH) | 57.8 | 0.005 | 96.4 | 0.001 |
| NADH/FP | −46.1 | 0.066 | −84.8 | 0.046 |
| Redox Indices | C8161 Whole vs. A375P Whole | C8161 OA vs. A375P OA | C8161 OA vs. A375P Whole | |||
|---|---|---|---|---|---|---|
| p # | d * | p | d | p | d | |
| NADH (µM) | 0.008 | −2.30 | 0.039 | −1.87 | 0.003 | −3.95 |
| Fp/(Fp + NADH) | 0.004 | 2.58 | 0.0003 | 3.96 | 0.0002 | 6.15 |
| NADH/FP | 0.040 | −1.55 | 0.029 | −1.95 | 0.003 | −3.70 |
| Tumor Cell Density | OA | RA | p # |
|---|---|---|---|
| A375P (ROI n = 15) | 2221 ± 126 | 2152 ± 48.7 | 0.66 |
| C8161 (ROI n = 15) | 2294 ± 358 | 2376 ± 169 | 0.74 |
| p * | 0.77 | 0.20 |
Disclaimer/Publisher’s Note: The statements, opinions and data contained in all publications are solely those of the individual author(s) and contributor(s) and not of MDPI and/or the editor(s). MDPI and/or the editor(s) disclaim responsibility for any injury to people or property resulting from any ideas, methods, instructions or products referred to in the content. |
© 2024 by the authors. Licensee MDPI, Basel, Switzerland. This article is an open access article distributed under the terms and conditions of the Creative Commons Attribution (CC BY) license (https://creativecommons.org/licenses/by/4.0/).
Share and Cite
Peng, A.; Xu, H.N.; Moon, L.; Zhang, P.; Li, L.Z. Quantitative Optical Redox Imaging of Melanoma Xenografts with Different Metastatic Potentials. Cancers 2024, 16, 1669. https://doi.org/10.3390/cancers16091669
Peng A, Xu HN, Moon L, Zhang P, Li LZ. Quantitative Optical Redox Imaging of Melanoma Xenografts with Different Metastatic Potentials. Cancers. 2024; 16(9):1669. https://doi.org/10.3390/cancers16091669
Chicago/Turabian StylePeng, April, He N. Xu, Lily Moon, Paul Zhang, and Lin Z. Li. 2024. "Quantitative Optical Redox Imaging of Melanoma Xenografts with Different Metastatic Potentials" Cancers 16, no. 9: 1669. https://doi.org/10.3390/cancers16091669
APA StylePeng, A., Xu, H. N., Moon, L., Zhang, P., & Li, L. Z. (2024). Quantitative Optical Redox Imaging of Melanoma Xenografts with Different Metastatic Potentials. Cancers, 16(9), 1669. https://doi.org/10.3390/cancers16091669


