Impact of RRP1B Variants on the Phenotype, Progression, and Metastasis of Cervical Cancer
Abstract
Simple Summary
Abstract
1. Introduction
2. Materials and Methods
2.1. Study Subjects
2.2. SNP Selection
2.3. Methods
2.4. Statistical Analysis
3. Results
3.1. Clinical Characteristics
3.2. SNP Frequencies
3.3. Linkage Disequilibrium and Haplotypes Distribution
3.4. Association Analysis
3.4.1. Rs2838342
3.4.2. Rs7276633
3.4.3. Rs2051407
3.4.4. Rs9306160
3.4.5. Rs762400
3.4.6. Haplotypes
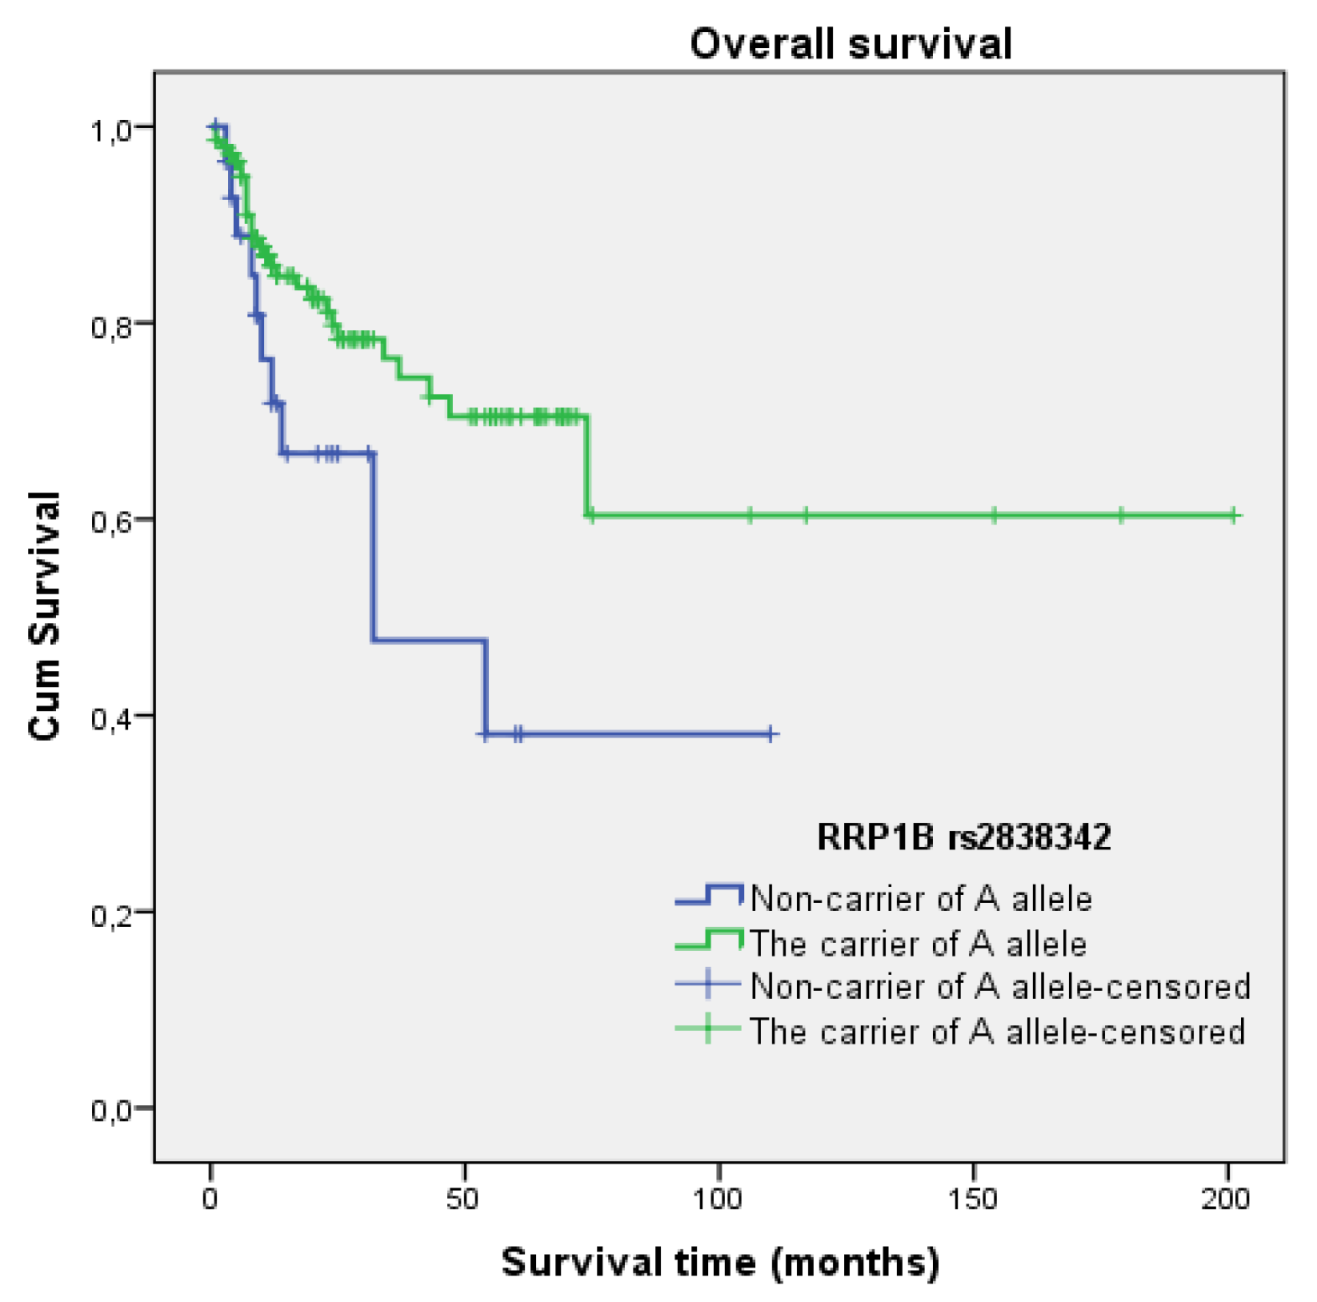
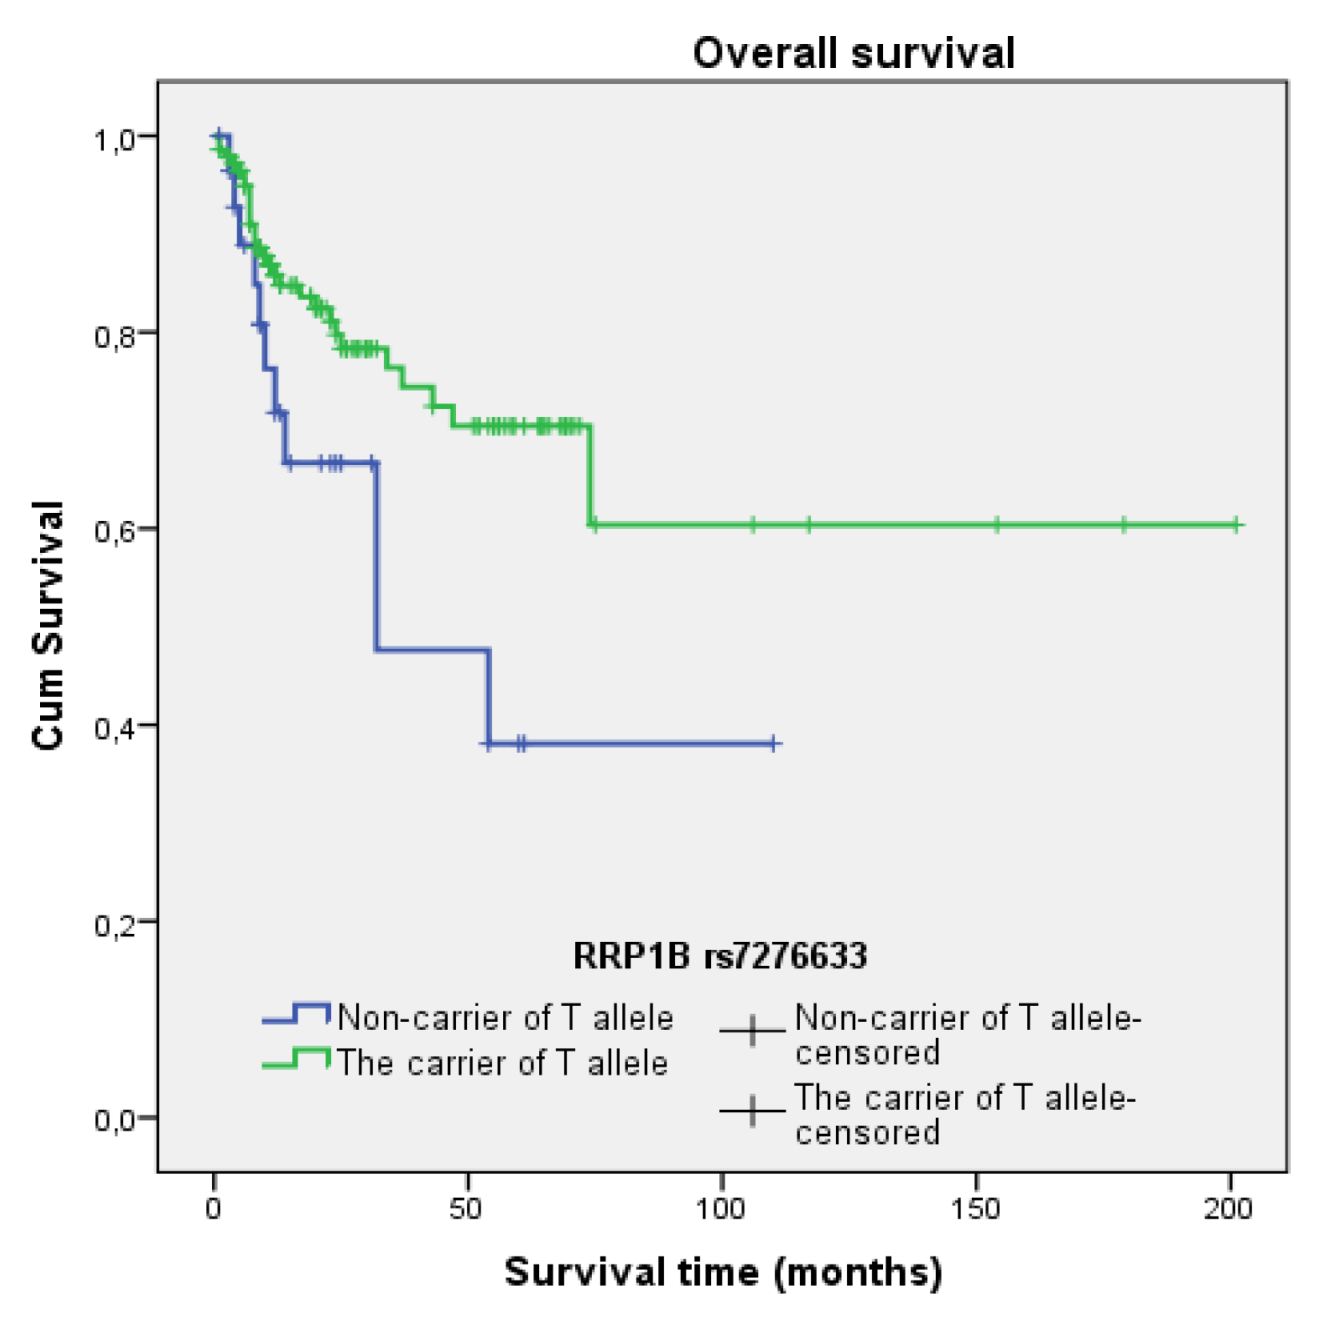
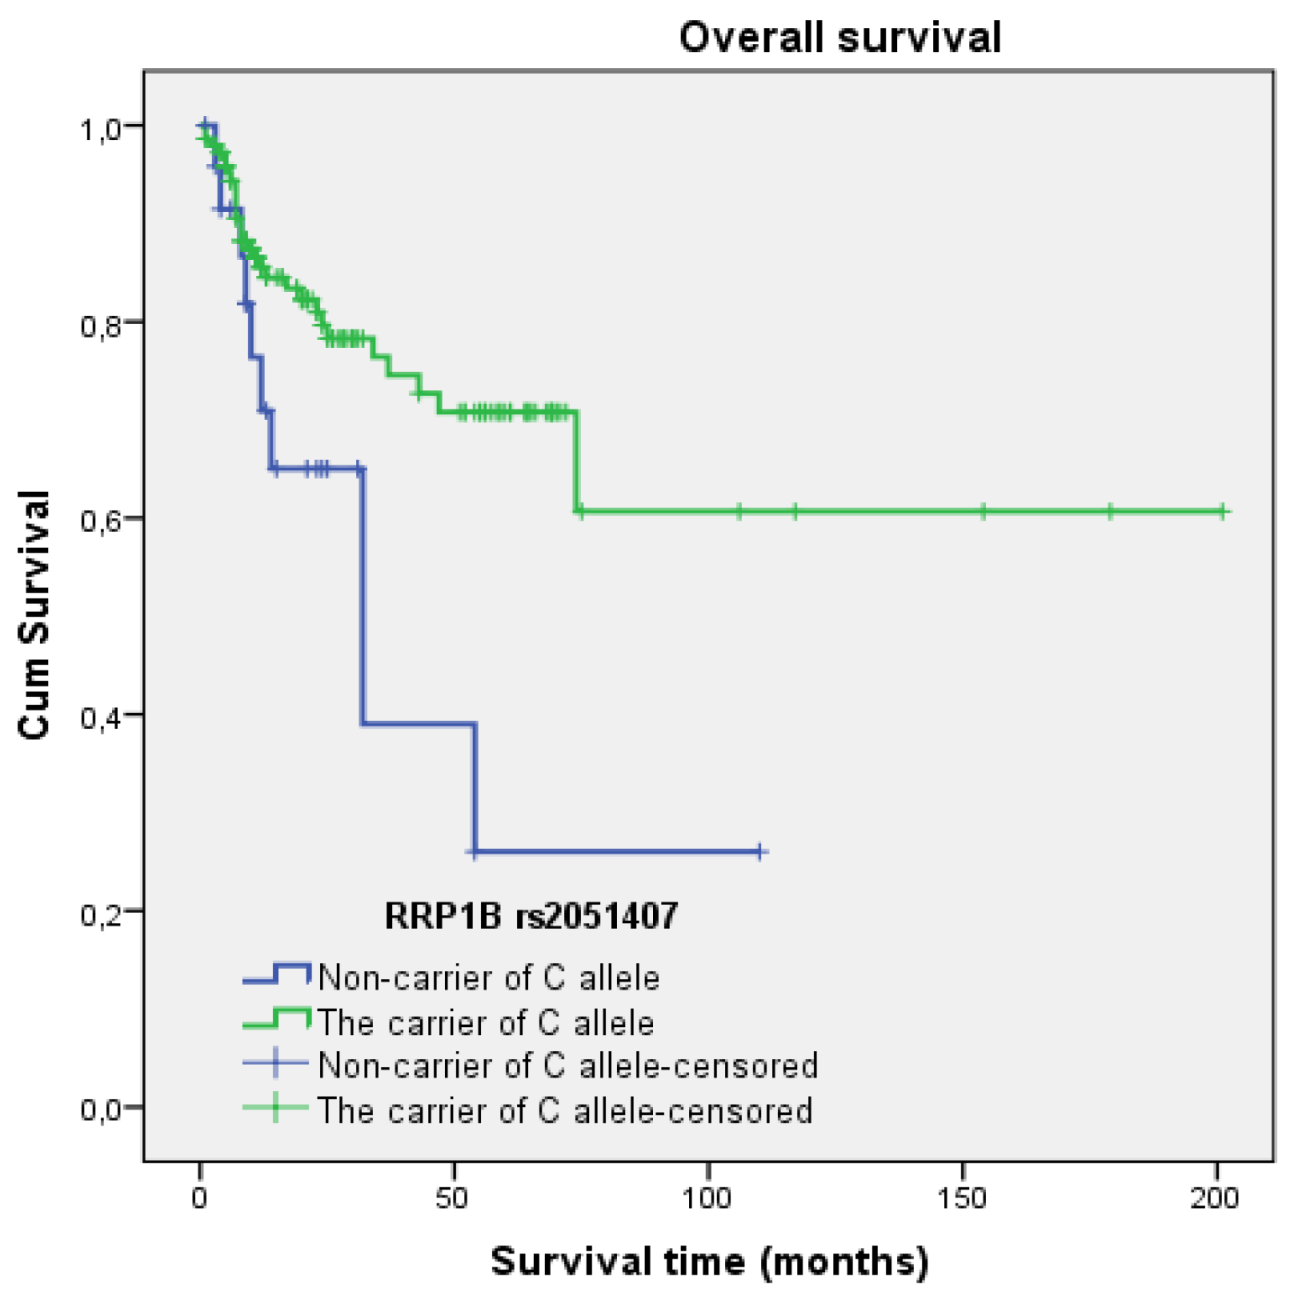
3.5. Survival Analysis
4. Discussion
5. Conclusions
Author Contributions
Funding
Institutional Review Board Statement
Informed Consent Statement
Data Availability Statement
Acknowledgments
Conflicts of Interest
References
- Lifsted, T.; Voyer, T.L.; Williams, M.; Muller, W.J.; Klein-Szanto, A.J.; Buetow, K.H.; Hunter, K.W. Identification of inbred mouse strains harboring genetic modifiers of mammary tumor age of onset and metastatic progression. Int. J. Cancer 1998, 77, 640–644. [Google Scholar] [CrossRef]
- Hunter, K.W.; Welch, D.R.; Liu, E.T. Genetic background is an important determinant of metastatic potential. Nat. Genet. 2003, 34, 23–24. [Google Scholar] [CrossRef]
- Steeg, P.S. Metastasis suppressors alter the signal transduction of cancer cells. Nat. Rev. Cancer 2003, 3, 55–63. [Google Scholar] [CrossRef] [PubMed]
- Hunter, K.W. Allelic diversity in the host genetic background may be an important determinant in tumor metastatic dissemination. Cancer Lett. 2003, 200, 97–105. [Google Scholar] [CrossRef] [PubMed]
- Schadt, E.E.; Monks, S.A.; Drake, T.A.; Lusis, A.J.; Che, N.; Colinayo, V.; Ruff, T.G.; Milligan, S.B.; Lamb, J.; Cavet, G.; et al. Genetics of gene expression surveyed in maize, mouse and man. Nature 2003, 422, 297–302. [Google Scholar] [CrossRef]
- Yang, H.; Crawford, N.P.; Lukes, L.; Finney, R.; Lancaster, M.; Hunter, K.W. Metastasis predictive signature profiles pre-exist in normal tissues. Clin. Exp. Metastasis 2005, 22, 593–603. [Google Scholar] [CrossRef]
- Lancaster, M.; Rouse, J.; Hunter, K.W. Modifiers of mammary tumor progression and metastasis on mouse Chromosomes 7, 9, and 17. Mamm. Genome 2005, 16, 120–126. [Google Scholar] [CrossRef]
- Crawford, N.P.; Qian, X.; Ziogas, A.; Papageorge, A.G.; Boersma, B.J.; Walker, R.C.; Lukes, L.; Rowe, W.; Zhang, J.; Ambs, S.; et al. RRP1B, a new candidate susceptibility gene for breast cancer progression and metastasis. PLOS Genet. 2007, 3, e214. [Google Scholar] [CrossRef]
- Crawford, N.P.; Walker, R.C.; Lukes, L.; Officewala, J.S.; Williams, R.W.; Hunter, K.W. The Diasporin Pathway: A tumor progression-related transcriptional network that predicts breast cancer survival. Clin. Exp. Metastasis 2008, 25, 357–369. [Google Scholar] [CrossRef]
- Park, Y.; Zhao, X.; Lesueur, F.; Lowy, D.R.; Lancaster, M.; Pharoah, P.D.; Qian, X.; Hunter, K.W. Sipa1 is a candidate for underlying the metastasis efficiency modifier locus Mtes1. Nat. Genet. 2005, 37, 1055–1062. [Google Scholar] [CrossRef]
- Crawford, N.P.; Ziogas, A.; Peel, D.; Hess, J.; Anton-Culver, H.; Hunter, K.W. Germline polymorphisms in SIPA1 are associated with metastasis and other indicators of poor prognosis in breast cancer. Breast Cancer Res. 2006, 8, R16. [Google Scholar] [CrossRef] [PubMed]
- Crawford, N.P.; Yang, H.; Mattaini, K.; Hunter, K.W. The metastasis efficiency modifier ribosomal RNA processing 1 Homolog B (RRP1B) is a chromatin-associated factor. J. Biol. Chem. 2009, 284, 28660–28673. [Google Scholar] [CrossRef] [PubMed]
- Lee, M.; Dworkin, A.M.; Lichtenberg, J.; Patel, S.J.; Trivedi, N.; Gildea, D.; Bodine, D.M.; Crawford, N.P. Metastasis-Associated Protein Ribosomal RNA Processing 1 Homolog B (RRP1B) Modulates Metastasis through Regulation of Histone Methylation. Mol. Cancer Res. 2014, 12, 1818–1828. [Google Scholar] [CrossRef] [PubMed][Green Version]
- Lee, M.; Dworkin, A.M.; Gildea, D.; Trivedi, N.; Moorhead, G.B.G.; Crawford, N.P. RRP1B is a metastasis modifier that regulates the expression of alternative mRNA isoforms through interactions with SRSF1. Oncogene 2013, 33, 1818–1827. [Google Scholar] [CrossRef][Green Version]
- Felgueiras, J.; Jerónimo, C.; Fardilha, M. Protein phosphatase 1 in tumorigenesis: Is it worth a closer look? Biochim. Biophys. Acta (BBA)-Rev. Cancer 2020, 1874, 188433. [Google Scholar] [CrossRef] [PubMed]
- Srivastava, G.; Bajaj, R.; Kumar, G.S.; Gaudreau-Lapierre, A.; Nicolas, H.; Chamousset, D.; Kreitler, D.; Peti, W.; Trinkle-Mulcahy, L.; Page, R. The ribosomal RNA processing 1B:protein phosphatase 1 holoenzyme reveals non-canonical PP1 interaction motifs. Cell Rep. 2022, 41, 111726. [Google Scholar] [CrossRef]
- Chamousset, D.; De Wever, V.; Moorhead, G.B.G.; Chen, Y.; Boisvert, F.; Lamond, A.I.; Trinkle-Mulcahy, L. RRP1B Targets PP1 to Mammalian Cell Nucleoli and Is Associated with Pre-60S Ribosomal Subunits. Mol. Biol. Cell 2010, 21, 4212–4226. [Google Scholar] [CrossRef]
- Paik, J.C.; Wang, B.; Liu, K.; Lue, J.K.; Lin, W. Regulation of E2F1-induced apoptosis by the nucleolar protein RRP1B. J. Biol. Chem. 2010, 285, 6348–6363. [Google Scholar] [CrossRef]
- Grisendi, S.; Mecucci, C.; Falini, B.; Pandolfi, P.P. Nucleophosmin and cancer. Nat. Rev. Cancer 2006, 6, 493–505. [Google Scholar] [CrossRef]
- Okuwaki, M.; Saito, S.; Hirawake-Mogi, H.; Nagata, K. The interaction between nucleophosmin/NPM1 and the large ribosomal subunit precursors contribute to maintaining the nucleolar structure. Biochim. Biophys. Acta (BBA)-Mol. Cell Res. 2021, 1868, 118879. [Google Scholar] [CrossRef]
- Crawford, N.P.; Alsarraj, J.; Lukes, L.; Walker, R.C.; Officewala, J.S.; Yang, H.H.; Lee, M.P.; Ozato, K.; Hunter, K.W. Bromodomain 4 activation predicts breast cancer survival. Proc. Natl. Acad. Sci. USA 2008, 105, 6380–6385. [Google Scholar] [CrossRef]
- Alsarraj, J.; Faraji, F.; Geiger, T.; Mattaini, K.; Williams, M.; Wu, J.J.; Ha, N.; Merlino, T.; Walker, R.C.; Bosley, A.D.; et al. BRD4 Short Isoform Interacts with RRP1B, SIPA1 and Components of the LINC Complex at the Inner Face of the Nuclear Membrane. PLoS ONE 2013, 8, e80746. [Google Scholar] [CrossRef]
- Donati, B.; Lorenzini, E.; Ciarrocchi, A. BRD4 and Cancer: Going beyond transcriptional regulation. Mol. Cancer 2018, 17, 164. [Google Scholar] [CrossRef]
- Chiang, S.K.; Chang, W.C.; Chen, S.; Chang, L. DOCK1 Regulates Growth and Motility through the RRP1B-Claudin-1 Pathway in Claudin-Low Breast Cancer Cells. Cancers 2019, 11, 1762. [Google Scholar] [CrossRef]
- Chang, J.; Wang, F.; Chapin, W.; Huang, R.S. Identification of MicroRNAs as Breast Cancer Prognosis Markers through the Cancer Genome Atlas. PLoS ONE 2016, 11, e0168284. [Google Scholar] [CrossRef]
- World Health Organization (WHO). Cervical Cancer. 2023. Available online: https://www.who.int/news-room/fact-sheets/detail/cervical-cancer (accessed on 7 January 2024).
- Arbyn, M.; Weiderpass, E.; Bruni, L.; de Sanjosé, S.; Saraiya, M.; Ferlay, J.; Bray, F. Estimates of incidence and mortality of cervical cancer in 2018: A worldwide analysis. Lancet Glob. Health 2020, 8, e191–e203. [Google Scholar] [CrossRef]
- Pappa, K.; Kontostathi, G.; Lygirou, V.; Zoidakis, J.; Anagnou, N. Novel structural approaches concerning HPV proteins: Insight into targeted therapies for cervical cancer (Review). Oncol. Rep. 2018, 39, 1547–1554. [Google Scholar] [CrossRef]
- De Sanjosé, S.; Brotons, M.; Pavón, M.Á. The natural history of human papillomavirus infection. Best Pract. Res. Clin. Obstet. Gynaecol. 2018, 47, 2–13. [Google Scholar] [CrossRef]
- Drolet, M.; Bénard, É.; Pérez, N.; Brisson, M.; Ali, H.; Boily, M.; Baldo, V.; Brassard, P.; Brotherton, J.; Callander, D.; et al. Population-level impact and herd effects following the introduction of human papillomavirus vaccination programmes: Updated systematic review and meta-analysis. Lancet 2019, 394, 497–509. [Google Scholar] [CrossRef] [PubMed]
- Small, W.; Bacon, M.; Bajaj, A.; Chuang, L.; Fisher, B.J.; Harkenrider, M.M.; Jhingran, A.; Kitchener, H.C.; Mileshkin, L.; Viswanathan, A.N.; et al. Cervical cancer: A global health crisis. Cancer 2017, 123, 2404–2412. [Google Scholar] [CrossRef]
- European Centre for Disease Prevention and Control (ECDC). Cervical Cancer Screening in the EU/EEA: Quality Assurance and Organization. 2021. Available online: https://www.ecdc.europa.eu/en/publications-data/cervical-cancer-screening-eueea-quality-assurance-and-organization (accessed on 8 January 2024).
- Gültekin, M.; Ramírez, P.T.; Broutet, N.; Hutubessy, R. World Health Organization call for action to eliminate cervical cancer globally. Int. J. Gynecol. Cancer 2020, 30, 426–427. [Google Scholar] [CrossRef]
- Aziz, S.Q.; Aziz, M. Cervical cancer metastasis. In Introduction to Cancer Metastasis; Elsevier: Amsterdam, The Netherlands, 2017; pp. 77–94. [Google Scholar] [CrossRef]
- Lu, Q.; Takata, Y.; Ou, X.; Cao, D.; Xie, T.; Chen, X. Potential lncRNA diagnostic biomarkers for early gastric cancer. Mol. Med. Rep. 2017, 16, 9545–9552. [Google Scholar] [CrossRef]
- Chen, H.; Yuan, X.; Zhou, L.; Huang, J.; Tao, L.; Cheng, L.; Tian, J. Cisplatin and paclitaxel target significant long noncoding RNAs in laryngeal squamous cell carcinoma. Med. Oncol. 2014, 31, 246. [Google Scholar] [CrossRef]
- Saito, Y.; Kasamatsu, A.; Yamamoto, A.; Shimizu, T.; Yokoe, H.; Sakamoto, Y.; Ogawara, K.; Shiiba, M.; Tanzawa, H.; Uzawa, K. ALY as a potential contributor to metastasis in human oral squamous cell carcinoma. J. Cancer Res. Clin. Oncol. 2012, 139, 585–594. [Google Scholar] [CrossRef]
- Florentin, J.; Zhao, J.; Tai, Y.; Sun, W.; Ohayon, L.; O’Neil, S.; Arunkumar, A.; Zhang, X.; Zhu, J.; Aaraj, Y.A.; et al. Loss of Amphiregulin drives inflammation and endothelial apoptosis in pulmonary hypertension. Life Sci. Alliance 2022, 5, e202101264. [Google Scholar] [CrossRef]
- Li, H.; Yang, L. Identification of novel immune infiltration-related biomarkers of sepsis based on bioinformatics analysis. Cell. Mol. Biol. 2023, 69, 205–209. [Google Scholar] [CrossRef]
- Wain, L.V.; Vaez, A.; Jansen, R.C.; Joehanes, R.; Van Der Most, P.J.; Erzurumluoglu, A.M.; O’Reilly, P.F.; Cabrera, C.; Warren, H.R.; Rose, L.M.; et al. Novel blood pressure locus and gene discovery using Genome-Wide association study and expression data sets from blood and the kidney. Hypertension 2017, 70, e4–e19. [Google Scholar] [CrossRef]
- Iniesta, R.; Campbell, D.; Venturini, C.; Faconti, L.; Singh, S.; Irvin, M.R.; Cooper-DeHoff, R.M.; Johnson, J.A.; Turner, S.T.; Arnett, D.K.; et al. Gene variants at LOCI related to blood pressure account for variation in response to antihypertensive drugs between black and white individuals. Hypertension 2019, 74, 614–622. [Google Scholar] [CrossRef] [PubMed]
- Salemi, M.; Barone, C.; Romano, C.; Zolezzi, F.; Romano, C.; Scavuzzo, C.; Salluzzo, R.; Scillato, F.; Signorelli, M.; Kapetis, D.; et al. Gene expression profiling and qRT-PCR expression of RRP1B, PCNT, KIF21A and ADRB2 in leucocytes of Down’s syndrome subjects. J. Genet. 2012, 93 (Suppl. S1), 18–23. [Google Scholar] [CrossRef]
- Hsieh, S.; Look, M.P.; Sieuwerts, A.M.; Foekens, J.A.; Hunter, K.W. Distinct inherited metastasis susceptibility exists for different breast cancer subtypes: A prognosis study. Breast Cancer Res. 2009, 11. [Google Scholar] [CrossRef] [PubMed]
- Nanchari, S.R.; Cingeetham, A.; Meka, P.; Surekha, D.; Tipirisetti, N.; Padala, C.; Annamaneni, S.; Hanumanth, S.R.; Digumarthi, R.R.; Satti, V. Rrp1B gene polymorphism (1307T>C) in metastatic progression of breast cancer. Tumor Biol. 2014, 36, 615–621. [Google Scholar] [CrossRef] [PubMed]
- Ugenskienė, R.; Myrzaliyeva, D.; Jankauskaitė, R.; Gedminaitė, J.; Jančiauskienė, R.; Šepetauskienė, E.; Juozaitytė, E. The contribution of SIPA1 and RRP1B germline polymorphisms to breast cancer phenotype, lymph node status and survival in a group of Lithuanian young breast cancer patients. Biomarkers 2016, 21, 363–370. [Google Scholar] [CrossRef]
- Al-Husseini RM, A.; Hussain, R.A.; Abed, A.M. Assess the contribution of ribosomal RNA processing 1B gene polymorphisms in breast cancer in Iraqi patients. Ann. Biol. 2020, 36, 26–33. [Google Scholar]

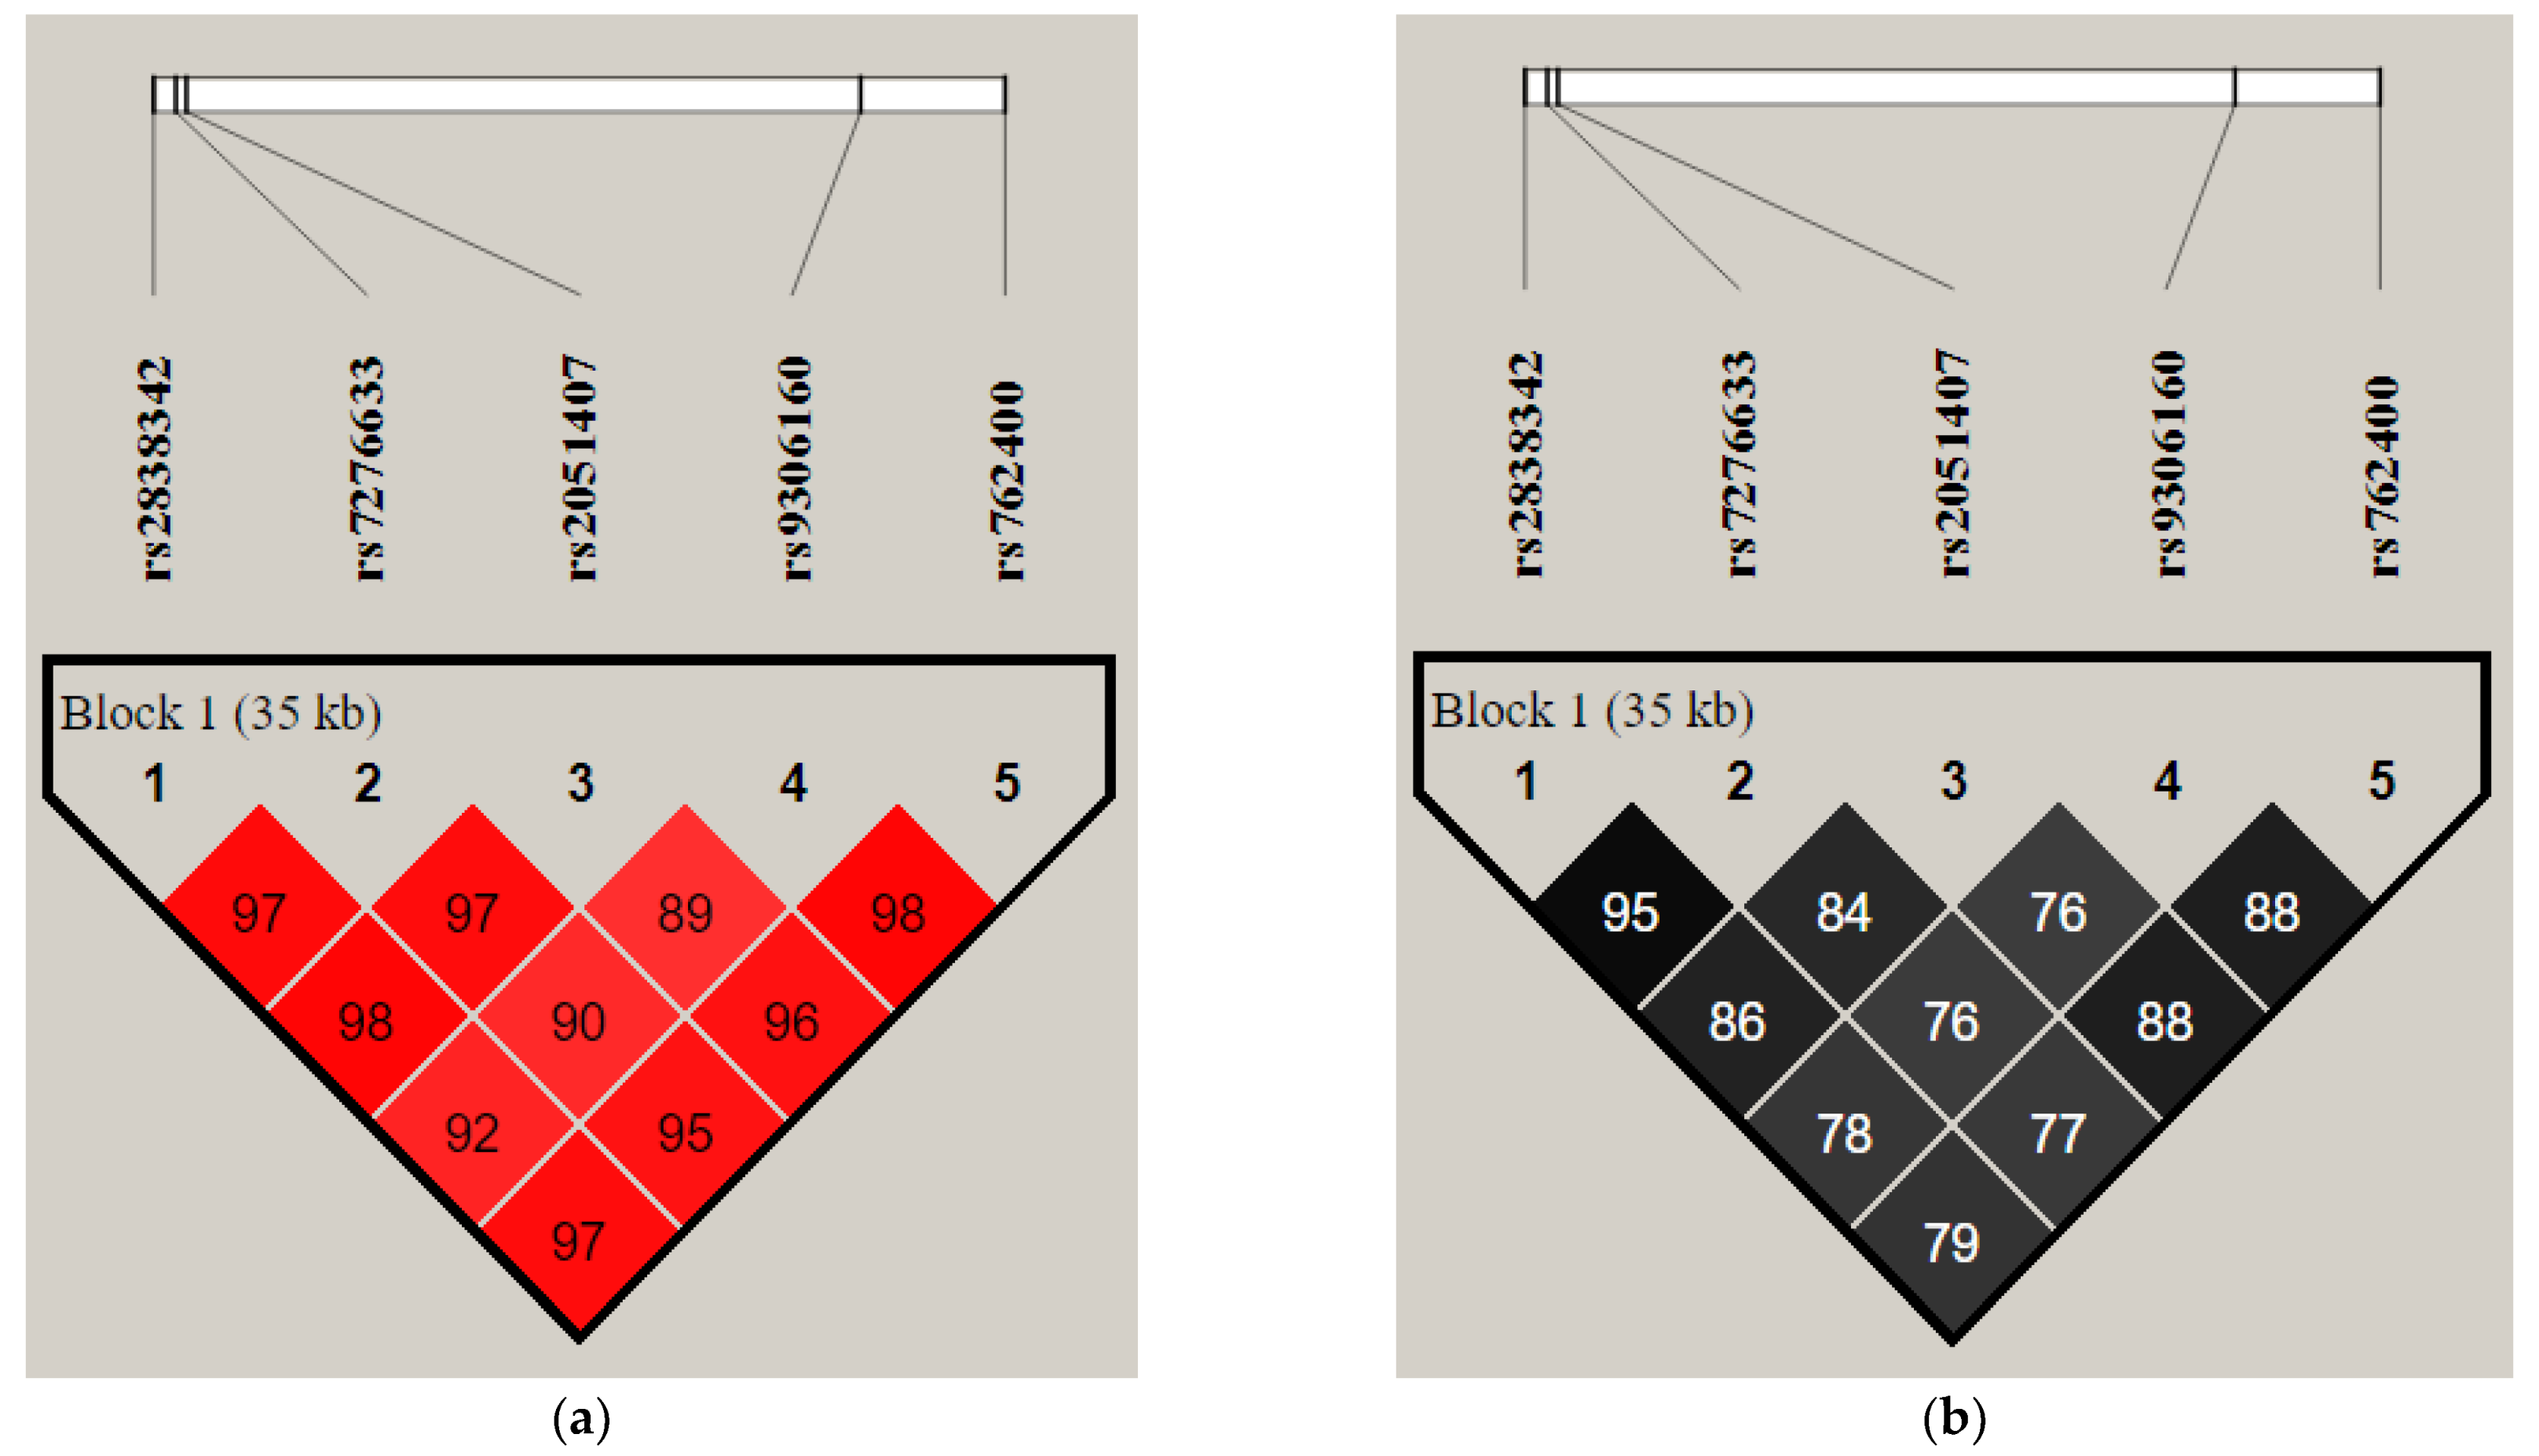
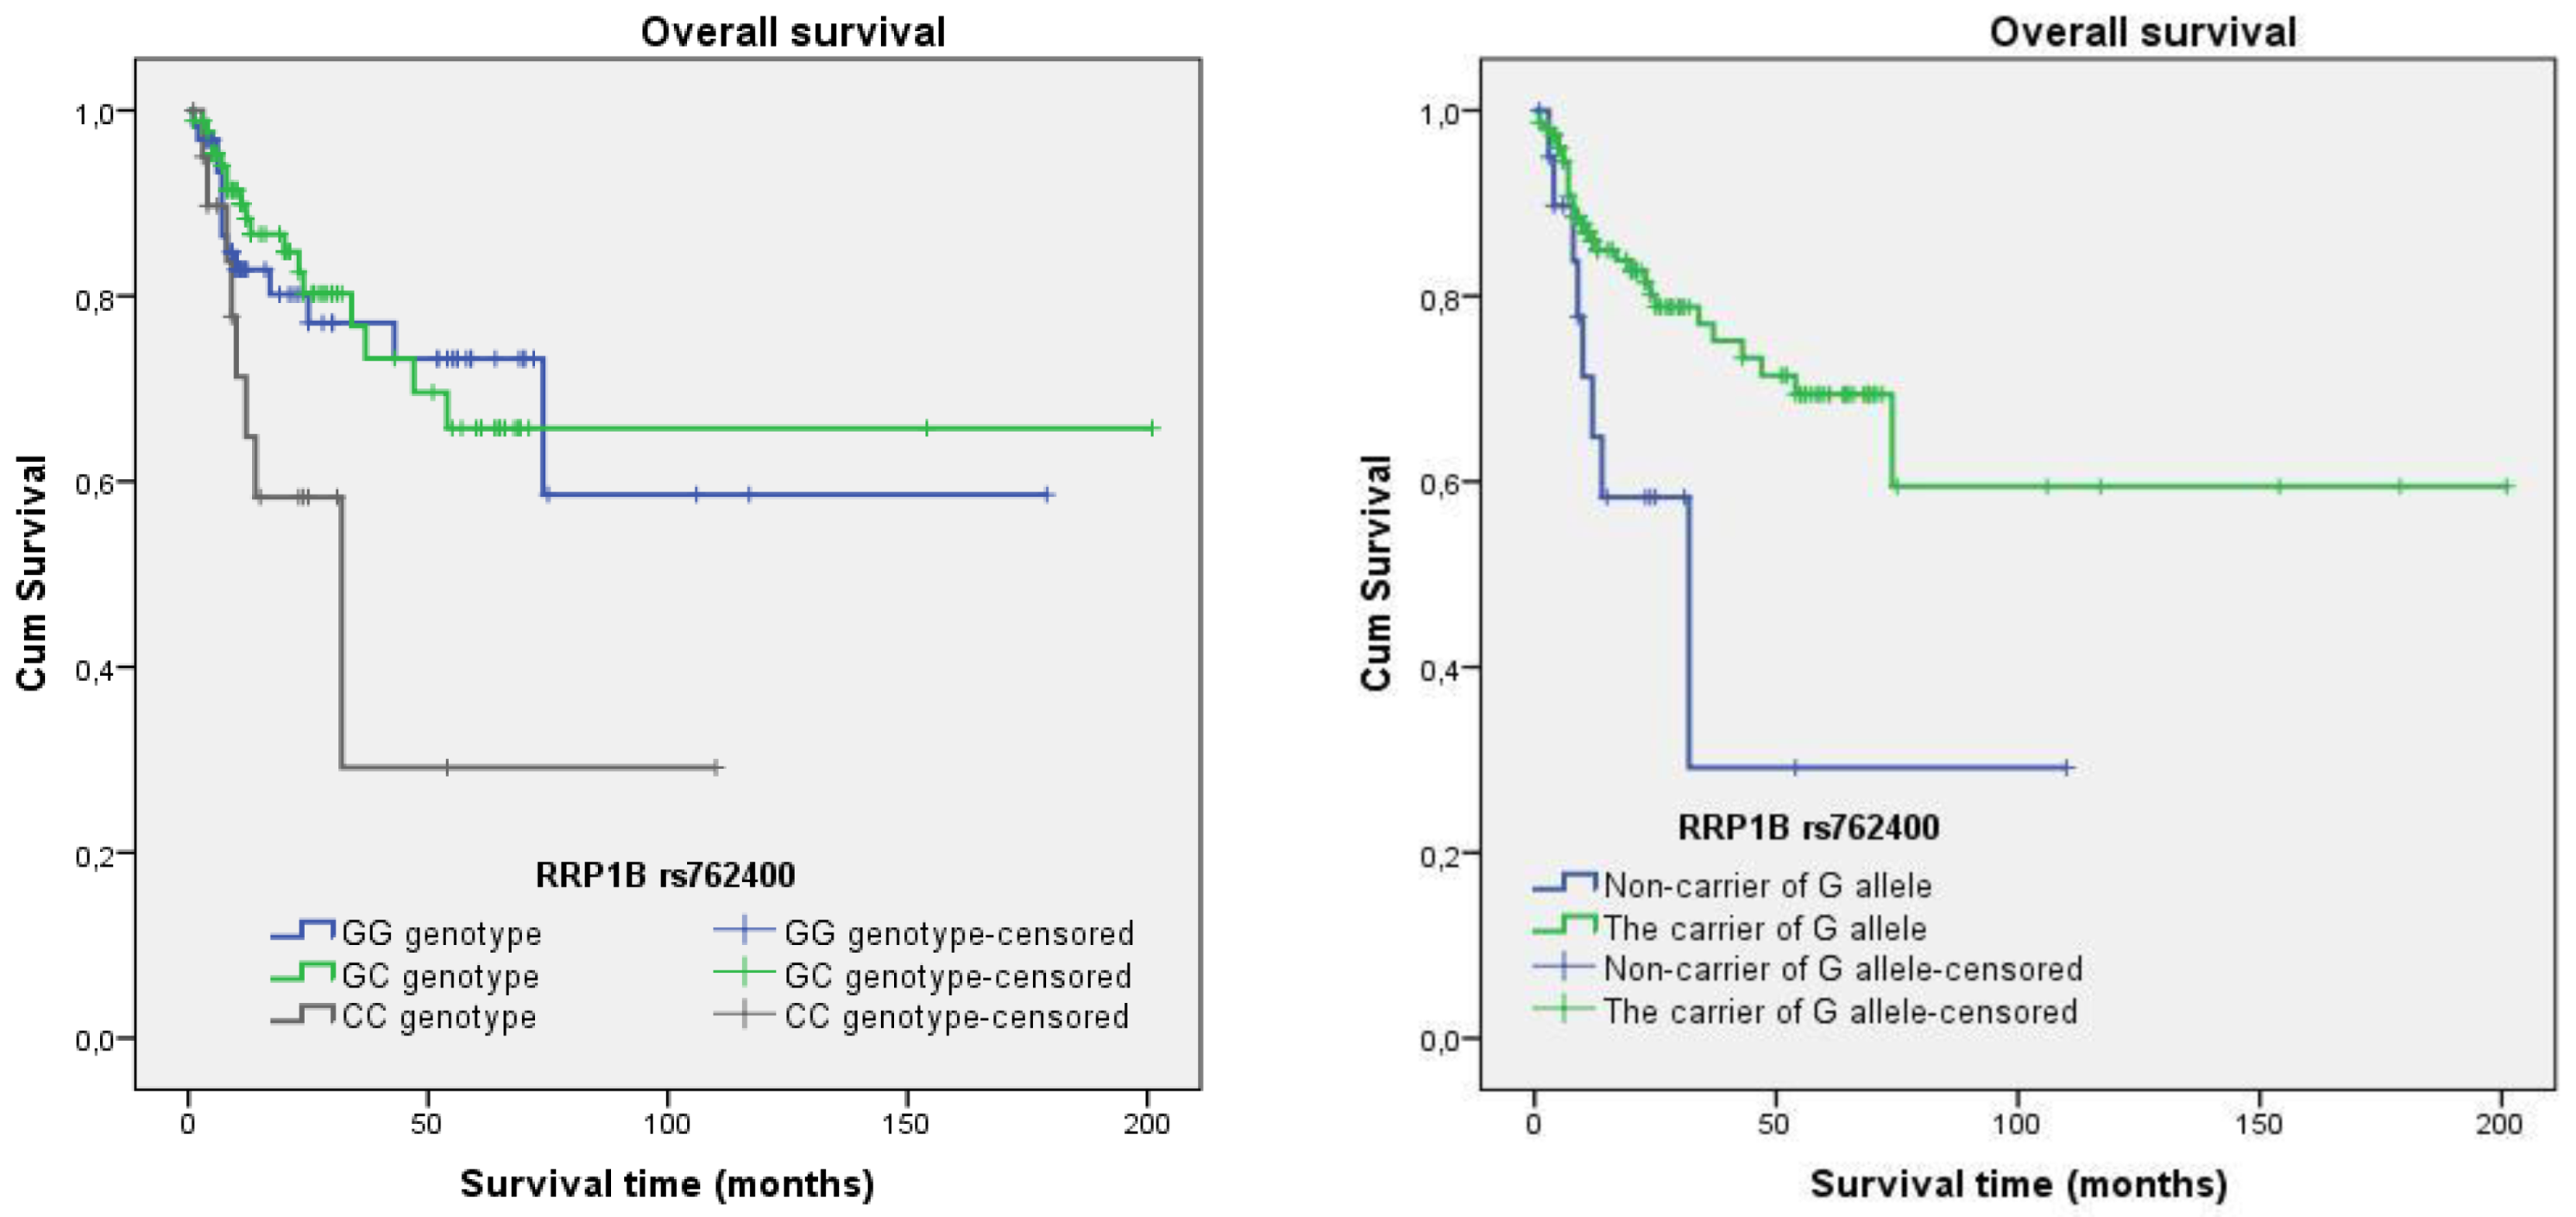
| Chromosome/Gene | SNP | Genomic Position in Chromosome | Region/Location | Minor Allele Frequency (MAF) (1000 Genomes) | Highest Population MAF |
|---|---|---|---|---|---|
| Chr21/ RRP1B Alias symbols: KIAA0179, Nnp1 RRP1 PPP1R136 | rs2838342 | 43657984 (GRCh38) 45077865 (GRCh37) | Upstream transcript variant, intron variant | 0.42/(G) | 0.50 |
| rs7276633 | 43658919 (GRCh38) 45078800 (GRCh37) | Upstream variant | 0.42/(C) | 0.49 | |
| rs2051407 | 43659364 (GRCh38) 45079245 (GRCh37) | Upstream variant | 0.37/(T) | 0.42 | |
| rs9306160 | 43687681 (GRCh38) 45107562 (GRCh37) | Missense variant | 0.38/(T) | 0.44 | |
| rs762400 | 43693748 (GRCh38) 45113629 (GRCh37) | 3′-UTR variant | 0.37/(C) | 0.50 |
| SNP | Sample Size N (Study Cohort) | Genotypes | Genotypes Frequencies | Alleles | Alleles Frequencies (Study Cohort) | Sample Size N (1000 Genomes) | Alleles Frequencies (1000 Genomes) | MAF p Value a | |
|---|---|---|---|---|---|---|---|---|---|
| rs2838342 A>G | 172 | AA AG GG | 58/33.7% 85/49.4% 29/16.9% | 0.337 0.494 0.169 | A G | 0.584 0.416 | 1006 | 0.589 0.420 | 0.791 |
| rs7276633 T>C | 172 | TT TC CC | 59/34.3% 84/48.8% 29/16.9% | 0.343 0.488 0.169 | T C | 0.587 0.413 | 1006 | 0.581 0.420 | 0.676 |
| rs2051407 C>T | 172 | CC CT TT | 63/36.6% 84/48.8% 25/14.5% | 0.366 0.489 0.145 | C T | 0.610 0.390 | 1006 | 0.634 0.366 | 0.282 |
| rs9306160 * C>T | 169 | CC CT TT | 55/32.5% 92/54.4% 22/13.0% | 0.325 0.545 0.130 | C T | 0.598 0.402 | 1006 | 0.617 0.383 | 0.450 |
| rs762400 G>C | 172 | GG GC CC | 63/26.6% 88/51.2% 21/12.2% | 0.366 0.512 0.122 | G C | 0.622 0.378 | 1006 | 0.626 0.374 | 0.804 |
| Haplotype Number | rs2838342 rs7276633 rs2051407 rs9306160 rs762400 Haplotypes | Chromosomes (Counts) | Frequencies (%) |
|---|---|---|---|
| 1 | ATCCG | 190 | 55.23 |
| 2 | ATCTG | 5 | 1.45 |
| 3 | ATCTC | 2 | 0.58 |
| 4 | ATTCG | 1 | 0.29 |
| 5 | ACCCG | 2 | 0.58 |
| 6 | GTCCG | 1 | 0.29 |
| 7 | GTTTC | 1 | 0.29 |
| 8 | GCCCG | 4 | 1.16 |
| 9 | GCCTG | 5 | 1.45 |
| 10 | GCCTC | 1 | 0.29 |
| 11 | GCTCG | 6 | 1.74 |
| 12 | GCTCC | 2 | 0.58 |
| 13 | GCTTC | 124 | 36.05 |
| Univariate | Multivariate | ||||||||||||||||
|---|---|---|---|---|---|---|---|---|---|---|---|---|---|---|---|---|---|
| SNP | Dependent | Covariates | Model No. 1 | Model No. 2 | Model No. 3 | Model No. 4 | |||||||||||
| Odds | 95% CI | p | Odds | 95% CI | p | Odds | 95% CI | p | Odds | 95% CI | p | Odds | 95% CI | p | |||
| rs2838342 | Positive T3-T4 | A allele + vs. A − | 0.281 | 0.122–0.643 | 0.002 | 0.280 | 0.122–0.643 | 0.003 | 0.299 | 0.129–0.692 | 0.005 | 0.244 | 0.096–0.619 | 0.003 | 0.266 | 0.102–0.691 | 0.007 |
| Age (years) | 1.001 | 0.978–1.025 | 0.909 | 1.002 | 0.979–1.027 | 0.842 | 1.028 | 1.000–1.057 | 0.054 | 1.027 | 0.999–1.056 | 0.059 | |||||
| Positive G3 vs. G1 + G2 | 1.991 | 0.978–4.051 | 0.058 | 1.798 | 0.826–3.914 | 0.140 | 1.687 | 0.762–3.732 | 0.197 | ||||||||
| Positive N1 vs. N0 | 7.367 | 3.347–16.217 | <0.001 | 6.161 | 2.756–13.771 | <0.001 | |||||||||||
| Positive M1 vs. M0 | 5.977 | 0.690–51.748 | 0.105 | ||||||||||||||
| rs2838342 | Positive M | A allele + vs. A − | 0.274 | 0.072–1.040 | 0.044 | 0.272 | 0.071–1.140 | 0.057 | 0.291 | 0.075–1.127 | 0.074 | 0.267 | 0.063–1.136 | 0.074 | 0.521 | 0.124–2.190 | 0.374 |
| Age (years) | 0.979 | 0.932–1.028 | 0.395 | 0.980 | 0.933–1.029 | 0.417 | 1.009 | 0.960–1.061 | 0.714 | 0.978 | 0.927–1.031 | 0.401 | |||||
| Positive G3 vs. G1 + G2 | 1.603 | 0.416–6.170 | 0.493 | 1.293 | 0.315–5.308 | 0.721 | 1.130 | 0.276–4.633 | 0.865 | ||||||||
| Positive N1 vs. N0 | 0.000 | 0.000 | 0.996 | 0.000 | 0.000 | 0.996 | |||||||||||
| Positive T3–T4 | 15.623 | 1.853–131.722 | 0.012 | ||||||||||||||
| Age (Groups): ≤50 vs. >50 | Positive Stage III–IV vs. Stage I–II | Positive Worse Prognosis: T3–T4 + G3 vs. T1–T2 + G1–G2 | ||||||||
|---|---|---|---|---|---|---|---|---|---|---|
| SNP | Genotype, Alleles | OR | 95% CI | p-Value | OR | 95% CI | p-Value | OR | 95% CI | p-Value |
| rs2838342 | AG vs. AA | 0.471 | 0.226–0.983 | 0.045 | ||||||
| GG vs. AA | ||||||||||
| A allele + vs. A − | 0.341 | 0.137–0.849 | 0.017 | 0.182 | 0.061–0.538 | 0.002 | ||||
| G allele + vs. G − | ||||||||||
| rs7276633 | TC vs. TT | |||||||||
| CC vs. TT | ||||||||||
| T allele + vs. T − | 0.341 | 0.137–0.849 | 0.021 | 0.182 | 0.061–0.538 | 0.002 | ||||
| C allele + vs. C − | 2.138 | 1.080–4.230 | 0.029 | |||||||
| rs2051407 | CT vs. CC | |||||||||
| TT vs. CC | ||||||||||
| C allele + vs. C − | 0.267 | 0.087–0.823 | 0.021 | |||||||
| T allele + vs. T − | ||||||||||
| Univariate | Multivariate | ||||||||||||||||
|---|---|---|---|---|---|---|---|---|---|---|---|---|---|---|---|---|---|
| SNP | Dependent | Covariates | Model No. 1 | Model No. 2 | Model No. 3 | Model No. 4 | |||||||||||
| Odds | 95% CI | p | Odds | 95% CI | p | Odds | 95% CI | p | Odds | 95% CI | p | Odds | 95% CI | p | |||
| rs7276633 | Positive T3–T4 | T allele + vs. T − | 0.281 | 0.122–0.643 | 0.003 | 0.280 | 0.122–0.643 | 0.003 | 0.299 | 0.129–0.692 | 0.005 | 0.277 | 0.125–0.708 | 0.003 | 0.264 | 0.147–0.893 | 0.007 |
| Age (years) | 1.001 | 0.978–1.025 | 0.909 | 1.002 | 0.979–1.027 | 0.842 | 1.028 | 1.000–1.057 | 0.054 | 1.027 | 0.999–1.056 | 0.059 | |||||
| Positive G3 vs. G1 + G2 | 1.991 | 0.978–4.051 | 0.058 | 1.798 | 0.826–3.914 | 0.140 | 1.687 | 0.762–3.732 | 0.197 | ||||||||
| Positive N1 vs. N0 | 7.367 | 3.347–16.217 | <0.001 | 6.161 | 2.756–13.771 | <0.001 | |||||||||||
| Positive M1 vs. M0 | 5.977 | 0.690–51.748 | 0.105 | ||||||||||||||
| Univariate | Multivariate | ||||||||||||||||
|---|---|---|---|---|---|---|---|---|---|---|---|---|---|---|---|---|---|
| SNP | Dependent | Covariates | Model No. 1 | Model No. 2 | Model No. 3 | Model No. 4 | |||||||||||
| Odds | 95% CI | p | Odds | 95% CI | p | Odds | 95% CI | p | Odds | 95% CI | p | Odds | 95% CI | p | |||
| rs2051407 | Positive T3–T4 | C allele + vs. C − | 0.393 | 0.166–0.929 | 0.033 | 0.392 | 0.166–0.928 | 0.033 | 0.414 | 0.173–0.992 | 0.048 | 0.354 | 0.134–0.930 | 0.035 | 0.409 | 0.149–1.123 | 0.083 |
| Age (years) | 1.002 | 0.978–1.025 | 0.890 | 1.003 | 0.979–1.027 | 0.820 | 1.028 | 1.000–1.057 | 0.052 | 1.027 | 0.000–1.055 | 0.060 | |||||
| Positive G3 vs. G1 + G2 | 2.067 | 1.027–4.161 | 0.042 | 1.885 | 0.877–4.050 | 0.104 | 1.803 | 0.827–3.928 | 0.138 | ||||||||
| Positive N1 vs. N0 | 6.993 | 3.233–15.125 | <0.001 | 5.795 | 2.639–12.726 | <0.001 | |||||||||||
| Positive M1 vs. M0 | 6.116 | 0.713–52.493 | 0.099 | ||||||||||||||
| rs2051407 | Positive M | C allele + vs. C − | 0.223 | 0.058–0.858 | 0.019 | 0.223 | 0.058–0.863 | 0.030 | 0.236 | 0.060–0.920 | 0.038 | 0.209 | 0.048–0.913 | 0.037 | 0.355 | 0.083–1.510 | 0.355 |
| Age (years) | 0.979 | 0.931–1.029 | 0.403 | 0.980 | 0.932–1.031 | 0.432 | 1.007 | 0.957–1.059 | 0.801 | 0.979 | 0.926–1.034 | 0.443 | |||||
| Positive G3 vs. G1 + G2 | 1.627 | 0.421–6.285 | 0.480 | 1.307 | 0.315–5.429 | 0.712 | 1.088 | 0.262–4.514 | 0.908 | ||||||||
| Positive N1 vs. N0 | 0.000 | 0.000 | 0.996 | 0.000 | 0.000 | 0.996 | |||||||||||
| Positive T3–T4 | 15.475 | 1.852–129.314 | 0.011 | ||||||||||||||
| Univariate | Multivariate | ||||||||||||||||
|---|---|---|---|---|---|---|---|---|---|---|---|---|---|---|---|---|---|
| SNP | Dependent | Covariates | Model No. 1 | Model No. 2 | Model No. 3 | Model No. 4 | |||||||||||
| Odds | 95% CI | p | Odds | 95% CI | p | Odds | 95% CI | p | Odds | 95% CI | p | Odds | 95% CI | p | |||
| rs9306160 | Positive M | C allele + vs. C − | 0.179 | 0.044–0.721 | 0.008 | 0.187 | 0.046–0.760 | 0.019 | 0.166 | 0.039–0.702 | 0.015 | 0.151 | 0.032–0.717 | 0.017 | 0.262 | 0.059–1.170 | 0.079 |
| Age (years) | 0.979 | 0.929–1.032 | 0.430 | 0.981 | 0.931–1.034 | 0.479 | 1.002 | 0.949–1.059 | 0.932 | 0.977 | 0.921–1.036 | 0.437 | |||||
| Positive G3 vs. G1 + G2 | 2.623 | 0.629–10.932 | 0.186 | 2.193 | 0.482–9.992 | 0.310 | 1.581 | 0.363–6.897 | 0.542 | ||||||||
| Positive N1 vs. N0 | 0.000 | 0.000 | 0.996 | 0.000 | 0.000 | 0.996 | |||||||||||
| Positive T3–T4 | 12.411 | 1.442–106.842 | 0.002 | ||||||||||||||
| Univariate | Multivariate | ||||||||||||||||
|---|---|---|---|---|---|---|---|---|---|---|---|---|---|---|---|---|---|
| SNP | Dependent | Covariates | Model No. 1 | Model No. 2 | Model No. 3 | Model No. 4 | |||||||||||
| Odds | 95% CI | p | Odds | 95% CI | p | Odds | 95% CI | p | Odds | 95% CI | p | Odds | 95% CI | p | |||
| rs762400 | Positive T3–T4 | G allele + vs. G − | 0.383 | 0.151–0.967 | 0.037 | 0.383 | 0.151–0.968 | 0.042 | 0.378 | 0.148–0.970 | 0.043 | 0.330 | 0.115–0.946 | 0.039 | 0.401 | 0.132–1.216 | 0.106 |
| Age (years) | 1.001 | 0.977–1.024 | 0.963 | 1.002 | 0.978–1.026 | 0.884 | 1.026 | 0.998–1.055 | 0.064 | 1.025 | 0.998–1.054 | 0.072 | |||||
| Positive G3 vs. G1 + G2 | 2.173 | 1.080–4.372 | 0.029 | 2.008 | 0.933–4.320 | 0.074 | 1.906 | 0.877–4.143 | 0.103 | ||||||||
| Positive N1 vs. N0 | 6.875 | 3.190–14.820 | <0.001 | 5.717 | 2.612–12.511 | <0.001 | |||||||||||
| Positive M1 vs. M0 | 5.895 | 0.682–50.958 | 0.107 | ||||||||||||||
| rs762400 | Positive M | G allele + vs. G − | 0.176 | 0.045–0.686 | 0.006 | 0.165 | 0.042–0.659 | 0.011 | 0.168 | 0.042–0.673 | 0.012 | 0.149 | 0.032–0.703 | 0.016 | 0.265 | 0.062–1.135 | 0.074 |
| Age (years) | 0.974 | 0.924–1.027 | 0.327 | 0.976 | 0.926–1.029 | 0.370 | 0.999 | 0.946–1.054 | 0.957 | 0.977 | 0.924–1.034 | ||||||
| Positive G3 vs. G1 + G2 | 1.796 | 0.460–7.017 | 0.400 | 1.332 | 0.314–5.647 | 0.697 | 1.196 | 0.289–4.951 | 0.805 | ||||||||
| Positive N1 vs. N0 | 0.000 | 0.000 | 0.996 | 0.000 | 0.000 | 0.996 | |||||||||||
| Positive T3–T4 | 14.735 | 1.757–123.541 | 0.013 | ||||||||||||||
| Diplotypes | |||||||||||||||
|---|---|---|---|---|---|---|---|---|---|---|---|---|---|---|---|
| Cinical Characteristics | Heterozygous Diplotype (ATCCG/Alternative Hap) vs. Homozygous Diplotype (ATCCG/ATCCG) | ATCCG Haplotype Non-Carriers vs. Homozygous Diplotype (ATCCG/ATCCG) | Heterozygous Diplotype (GCTTC/Alternative Hap) vs. Homozygous Diplotype (GCTTC/GCTTC) | GCTTC Haplotype Non-Carriers vs. Homozygous Diplotype (GCTTC/GCTTC) | Heterozygous Diplotype (ATCCG/GCTTC) Carriers vs. Non-Carriers | ||||||||||
| OR | 95% CI | p-Value | OR | 95% CI | p-Value | OR | 95% CI | p-Value | OR | 95% CI | p-Value | OR | 95% CI | p-Value | |
| Positive T3–T4 vs. T1–T2 | 0.383 | 0.183–0.800 | 0.077 | 1.773 | 0.703–4.471 | 0.225 | 0.506 | 0.185–1.387 | 0.186 | 0.367 | 0.136–0.992 | 0.038 | 0.424 | 0.220–0.817 | 0.090 |
| Positive N1 vs. N0 | * | * | * | * | * | * | 0.831 | 0.311–2.221 | 0.712 | 1.222 | 0.449–3.326 | 0.694 | 0.671 | 0.364–1.238 | 0.202 |
| Positive M1 vs. M0 | 1.022 | 0.180–5.790 | 0.980 | 3.538 | 0.606–20.653 | 0.160 | 0.250 | 0.056–1.110 | 0.068 | 0.098 | 0.016–0.578 | 0.010 | 0.313 | 0.064–1.517 | 0.149 |
| Positive G3 vs. G1 + G2 | 0.699 | 0.317–1.538 | 0.373 | 1.406 | 0.534–3.705 | 0.491 | 1.271 | 0.417–3.876 | 0.673 | 0.923 | 0.290–2.935 | 0.892 | 0.908 | 0.458–1.801 | 0.783 |
| Age (groups): ≤50 vs. >50 | 2.278 | 1.070–4.846 | 0.073 | 1.529 | 0.578–4.040 | 0.392 | 0.750 | 0.225–2.495 | 0.639 | 0.458 | 0.138–1.527 | 0.204 | 1.840 | 0.919–3.684 | 0.085 |
| Positive stage III–IV vs. stage I–II | 1.002 | 0.169–1.733 | 0.091 | 1.250 | 0.454–3.444 | 0.032 | 0.429 | 0.150–1.222 | 0.113 | 0.612 | 0.210–1.787 | 0.369 | 0.494 | 0.267–0.912 | 0.084 |
| Positive worse prognosis: T3–T4 + G3 vs. T1–T2 + G1–G2 | 0.212 | 0.064–0.707 | 0.162 | 2.100 | 0.638–6.916 | 0.048 | 0.465 | 0.117–1.855 | 0.278 | 0.354 | 0.126–2.098 | 0.354 | 0.305 | 0.104–0.895 | 0.101 |
| Multivariate | ||||||||||||||
|---|---|---|---|---|---|---|---|---|---|---|---|---|---|---|
| SNPs | Dependent | Covariates | Model No. 1 | Model No. 2 | Model No. 3 | Model No. 4 | ||||||||
| Odds | 95% CI | p | Odds | 95% CI | p | Odds | 95% CI | p | Odds | 95% CI | p | |||
| rs2838342 rs7276633 rs2051407 rs9306160 rs762400 | Positive T3–T4 | |||||||||||||
| GCTTC haplotype non-carriers vs. homozygous diplotype (GCTTC/GCTTC) | 0.393 | 0.188–0.822 | 0.039 | 0.392 | 0.185–0.827 | 0.041 | 0.391 | 0.173–0.884 | 0.041 | 0.380 | 0.166–0.869 | 0.046 | ||
| Age (years) | 1.004 | 0.981–1.032 | 0.614 | 1.006 | 0.983–1.034 | 0.567 | 1.031 | 1.002–1.063 | 0.131 | 1.032 | 1.002–1.064 | 0.132 | ||
| Positive G3 vs. G1 + G2 | 2.007 | 0.971–4.147 | 0.061 | 1.842 | 0.831–4.067 | 0.131 | 0.579 | 0.257–1.299 | 0.185 | |||||
| Positive N1 vs. N0 | 0.000 | 0.000 | 0.996 | 0.000 | 0.000 | 0.996 | ||||||||
| Positive M1 vs. M0 | 6.508 | 0.719–58.708 | 0.096 | |||||||||||
| rs2838342 rs7276633 rs2051407 rs9306160 rs762400 | Positive M | GCTTC haplotype non-carriers vs. homozygous diplotype (GCTTC/GCTTC) | 0.101 | 0.017–0.598 | 0.012 | 0.095 | 0.016–0.577 | 0.011 | 0.075 | 0.011–0.534 | 0.010 | 0.150 | 0.023–0.965 | 0.048 |
| Age (years) | 0.980 | 0.927–1.035 | 0.462 | 0.983 | 0.931–1.039 | 0.544 | 1.005 | 0.952–1.062 | 0.850 | 0.982 | 0.926–1.041 | 0.545 | ||
| Positive G3 vs. G1 + G2 | 2.051 | 0.515–8.170 | 0.309 | 1.657 | 0.377–7.294 | 0.504 | 1.324 | 0.312–5.579 | 0.702 | |||||
| Positive N1 vs. N0 | 0.000 | 0.000 | 0.996 | 0.000 | 0.000 | 0.996 | ||||||||
| Positive T3–T4 | 8.404 | 0.915–77.157 | 0.060 | |||||||||||
| Progression-Free Survival | Overall Survival | ||||||
|---|---|---|---|---|---|---|---|
| SNP | Genotype/Allele | HR | 95% CI | p-Value | HR | 95% CI | p-Value |
| rs2838342 | AG vs. AA | 0.560 | 0.303–1.036 | 0.065 | 0.742 | 0.358–1.539 | 0.423 |
| GG vs. AA | 1.155 | 0.545–2.447 | 0.706 | 1.824 | 0.827–4.025 | 0.137 | |
| A allele + vs. A − | 1.572 | 0.784–3.151 | 0.202 | 0.465 | 0.232–0.931 | 0.031 | |
| G allele + vs. G − | 0.682 | 0.391–1.187 | 0.176 | 0.990 | 0.516–1.899 | 0.977 | |
| rs7276633 | TC vs. TT | 0.577 | 0.312–1.066 | 0.079 | 0.763 | 0.368–1.582 | 0.467 |
| CC vs. TT | 1.176 | 0.555–2.490 | 0.673 | 1.854 | 0.840–4.090 | 0.126 | |
| T allele + vs. T − | 0.636 | 0.317–1.275 | 0.202 | 0.465 | 0.232–0.931 | 0.031 | |
| C allele + vs. C − | 0.700 | 0.402–1.219 | 0.208 | 1.015 | 0.529–1.946 | 0.964 | |
| rs2051407 | CT vs. CC | 0.556 | 0.302–1.026 | 0.060 | 0.813 | 0.397–1.667 | 0.573 |
| TT vs. CC | 1.314 | 0.604–2.842 | 0.488 | 2.144 | 0.959–4.793 | 0.063 | |
| C allele + vs. C − | 0.568 | 0.275–1.175 | 0.127 | 0.418 | 0.204–0.858 | 0.017 | |
| T allele + vs. T − | 0.689 | 0.397–1.194 | 0.184 | 1.081 | 0.568–2.056 | 0.812 | |
| rs9306160 | CT vs. CC | 0.647 | 0.352–1.187 | 0.160 | 0.856 | 0.418–1.751 | 0.669 |
| TT vs. CC | 1.357 | 0.595–3.092 | 0.468 | 2.213 | 0.943–5.193 | 0.068 | |
| C allele + vs. C − | 0.613 | 0.286–1.314 | 0.208 | 0.498 | 0.229–1.084 | 0.079 | |
| T allele + vs. T − | 0.705 | 0.399–1.245 | 0.228 | 0.915 | 0.476–1.758 | 0.789 | |
| rs762400 | GC vs. GG | 0.613 | 0.336–1.117 | 0.110 | 0.917 | 0.451–1.866 | 0.811 |
| CC vs. GG | 1.443 | 0.642–3.240 | 0.375 | 2.550 | 1.098–5.923 | 0.030 | |
| G allele + vs. G − | 0.537 | 0.251–1.147 | 0.108 | 0.374 | 0.177–0.788 | 0.010 | |
| C allele + vs. C − | 0.734 | 0.422–1.275 | 0.272 | 1.178 | 0.613–2.263 | 0.624 | |
| Variables | Overall Survival | |||
|---|---|---|---|---|
| HR | 95% CI | p-Value | ||
| rs2838342 | A allele + vs. A − | 0.462 | 0.231–0.926 | 0.030 |
| Model No. 1 | Age at diagnosis | 1.011 | 0.987–1.037 | 0.366 |
| A allele + vs. A − | 0.802 | 0.382–1.686 | 0.561 | |
| rs2838342 | Age at diagnosis | 1.020 | 0.995–1.046 | 0.110 |
| Model No. 2 | T3–T4 vs. T1–T2 | 7.463 | 3.195–17.432 | <0.001 |
| N1 vs. N0 | 1.874 | 0.907–3.872 | 0.090 | |
| G3 vs. G1–G2 | 0.710 | 0.346–1.457 | 0.350 | |
| rs7276633 | T allele + vs. T − | 0.462 | 0.231–0.926 | 0.030 |
| Model No. 1 | Age at diagnosis | 1.011 | 0.987–1.037 | 0.366 |
| rs7276633 | T allele + vs. T − | 0.802 | 0.382–1.686 | 0.561 |
| Model No. 2 | Age at diagnosis | 1.029 | 0.995–1.046 | 0.110 |
| T3–T4 vs. T1–T2 | 7.463 | 3.195–17.432 | <0.001 | |
| N1 vs. N0 | 1.874 | 0.907–3.872 | 0.090 | |
| G3 vs. G1–G2 | 0.710 | 0.346–1.457 | 0.350 | |
| rs2051407 | C allele + vs. C − | 0.404 | 0.196–0.832 | 0.014 |
| Model No. 1 | Age at diagnosis | 1.013 | 0.988–1.039 | 0.297 |
| Rs2051407 | C allele + vs. C − | 0.604 | 0.285–1.281 | 0.189 |
| Model No. 2 | Age at diagnosis | 1.022 | 0.997–1.048 | 0.082 |
| T3–T4 vs. T1–T2 | 7.484 | 3.227–17.355 | <0.001 | |
| N1 vs. N0 | 1.824 | 0.892–3.732 | 0.100 | |
| G3 vs. G1–G2 | 0.698 | 0.346–1.405 | 0.313 | |
| rs762400 | GC vs. GG | 0.858 | 0.416–1.767 | 0.677 |
| Model No. 1 | CC vs. GG | 2.476 | 1.064–5.758 | 0.035 |
| Age at diagnosis | 1.013 | 0.987–1.040 | 0.325 | |
| rs762400 | GC vs. GG | 1.083 | 0.521–2.248 | 0.831 |
| Model No. 2 | CC vs. GG | 1.865 | 0.785–4.431 | 0.158 |
| Age at diagnosis | 1.021 | 0.996–1.047 | 0.100 | |
| T3–T4 vs. T1–T2 | 7.546 | 3.250–17.520 | <0.001 | |
| N1 vs. N0 | 1.814 | 0.882–3.731 | 0.105 | |
| G3 vs. G1–G2 | 0.719 | 0.358–1.448 | 0.356 | |
| rs762400 | G allele + vs. G − | 0.370 | 0.176–0.781 | 0.009 |
| Model No. 1 | Age at diagnosis | 1.012 | 0.987–1.038 | 0.356 |
| rs762400 | G allele + vs. G − | 0.560 | 0.261–1.203 | 0.137 |
| Model No. 2 | Age at diagnosis | 1.021 | 0.996–1.047 | 0.100 |
| T3–T4 vs. T1–T2 | 7.496 | 3.235–17.373 | <0.001 | |
| N1 vs. N0 | 1.798 | 0.879–3.677 | 0.108 | |
| G3 vs. G1–G2 | 0.728 | 0.365–1.452 | 0.367 | |
| Progression-Free Survival | Overall Survival | |||||
|---|---|---|---|---|---|---|
| RRP1B Haplotypes | HR | 95% CI | p-Value | HR | 95% CI | p-Value |
| Heterozygous diplotype (ATCCG/alternative haplotype) vs. homozygous diplotype (ATCCG/ATCCG) | 0.990 | 0.523–1.873 | 0.975 | 0.843 | 0.397–1.790 | 0.656 |
| ATCCG haplotype non-carriers vs. homozygous diplotype (ATCCG/ATCCG) | 2.244 | 0.991–5.080 | 0.052 | 2.121 | 0.910–4.943 | 0.081 |
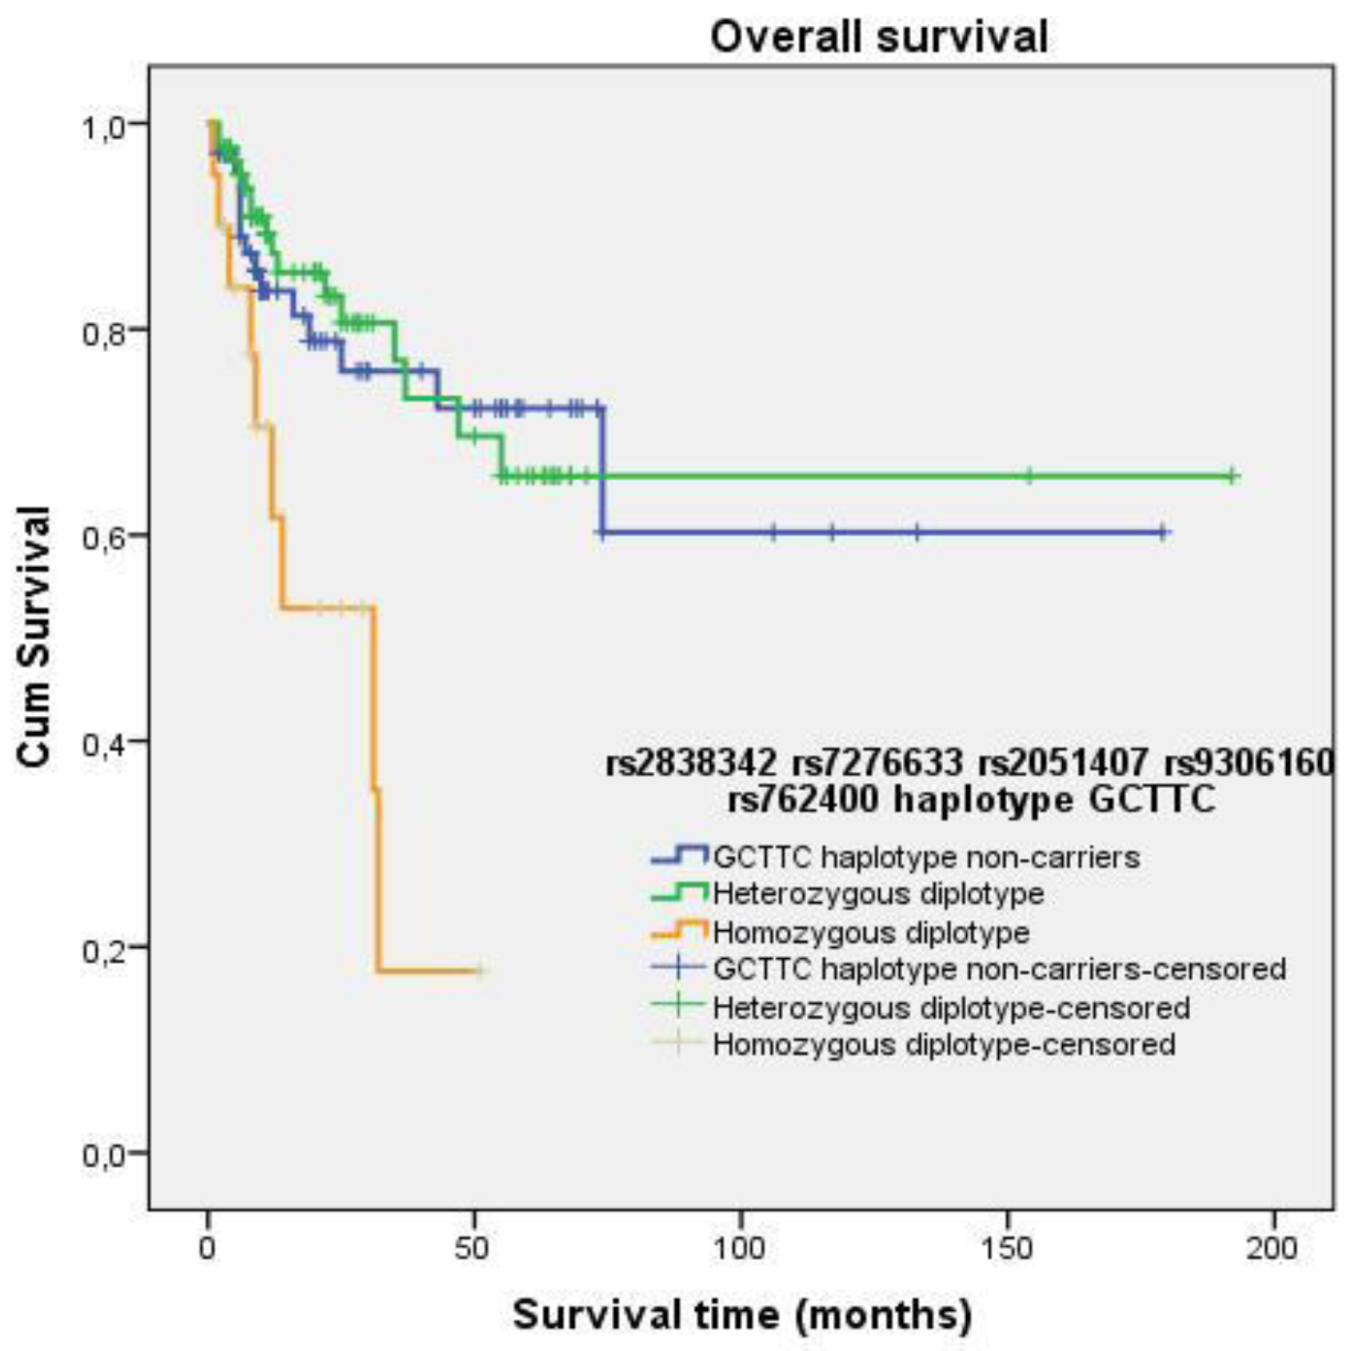
| Heterozygous diplotype (GCTTC/alternative haplotype) vs. homozygous diplotype (GCTTC/GCTTC) | 0.485 | 0.208–1.132 | 0.094 | 0.274 | 0.120–0.626 | 0.002 |
| GCTTC haplotype non-carriers vs. homozygous diplotype (GCTTC/GCTTC) | 0.434 | 0.190–0.993 | 0.051 | 0.298 | 0.128–0.695 | 0.005 |
| Heterozygous diplotype (ATCCG/GCTTC) carriers vs. non-carriers | 0.872 | 0.479–1.588 | 0.655 | 0.694 | 0.362–1.331 | 0.271 |
| SNPs | Covariates | Model No. 1 | Model No. 2 | ||||
|---|---|---|---|---|---|---|---|
| Odds | 95% CI | p | Odds | 95% CI | p | ||
| rs2838342 rs7276633 rs2051407 rs9306160 rs762400 | Heterozygous diplotype (GCTTC/alternative hap) vs. homozygous diplotype (GCTTC/GCTTC) | 0.259 | 0.113–0.597 | 0.002 | 0.372 | 0.153–0.904 | 0.029 |
| GCTTC haplotype non-carriers vs. homozygous diplotype (GCTTC/GCTTC) | 0.303 | 0.130–0.708 | 0.006 | 0.363 | 0.151–0.871 | 0.023 | |
| Age (years) | 1.013 | 0.987–1.039 | 0.334 | 1.027 | 1.000–1.054 | 0.050 | |
| G3 vs. G1–G2 | 0.760 | 0.374–1.547 | 0.449 | ||||
| N1 vs. N0 | 1.913 | 0.933–3.922 | 0.076 | ||||
| T3–T4 vs. T1–T2 | 7.412 | 3.196–17.188 | <0.001 | ||||
Disclaimer/Publisher’s Note: The statements, opinions and data contained in all publications are solely those of the individual author(s) and contributor(s) and not of MDPI and/or the editor(s). MDPI and/or the editor(s) disclaim responsibility for any injury to people or property resulting from any ideas, methods, instructions or products referred to in the content. |
© 2024 by the authors. Licensee MDPI, Basel, Switzerland. This article is an open access article distributed under the terms and conditions of the Creative Commons Attribution (CC BY) license (https://creativecommons.org/licenses/by/4.0/).
Share and Cite
Balčiūnienė, E.; Inčiūra, A.; Juozaitytė, E.; Ugenskienė, R. Impact of RRP1B Variants on the Phenotype, Progression, and Metastasis of Cervical Cancer. Cancers 2024, 16, 1250. https://doi.org/10.3390/cancers16071250
Balčiūnienė E, Inčiūra A, Juozaitytė E, Ugenskienė R. Impact of RRP1B Variants on the Phenotype, Progression, and Metastasis of Cervical Cancer. Cancers. 2024; 16(7):1250. https://doi.org/10.3390/cancers16071250
Chicago/Turabian StyleBalčiūnienė, Eglė, Arturas Inčiūra, Elona Juozaitytė, and Rasa Ugenskienė. 2024. "Impact of RRP1B Variants on the Phenotype, Progression, and Metastasis of Cervical Cancer" Cancers 16, no. 7: 1250. https://doi.org/10.3390/cancers16071250
APA StyleBalčiūnienė, E., Inčiūra, A., Juozaitytė, E., & Ugenskienė, R. (2024). Impact of RRP1B Variants on the Phenotype, Progression, and Metastasis of Cervical Cancer. Cancers, 16(7), 1250. https://doi.org/10.3390/cancers16071250


