
Machine Learning Analysis of Post-Operative Tumour Progression in Non-Functioning Pituitary Neuroendocrine Tumours: A Pilot Study

 , and
, and
Abstract
Simple Summary
Abstract
1. Introduction
2. Methods
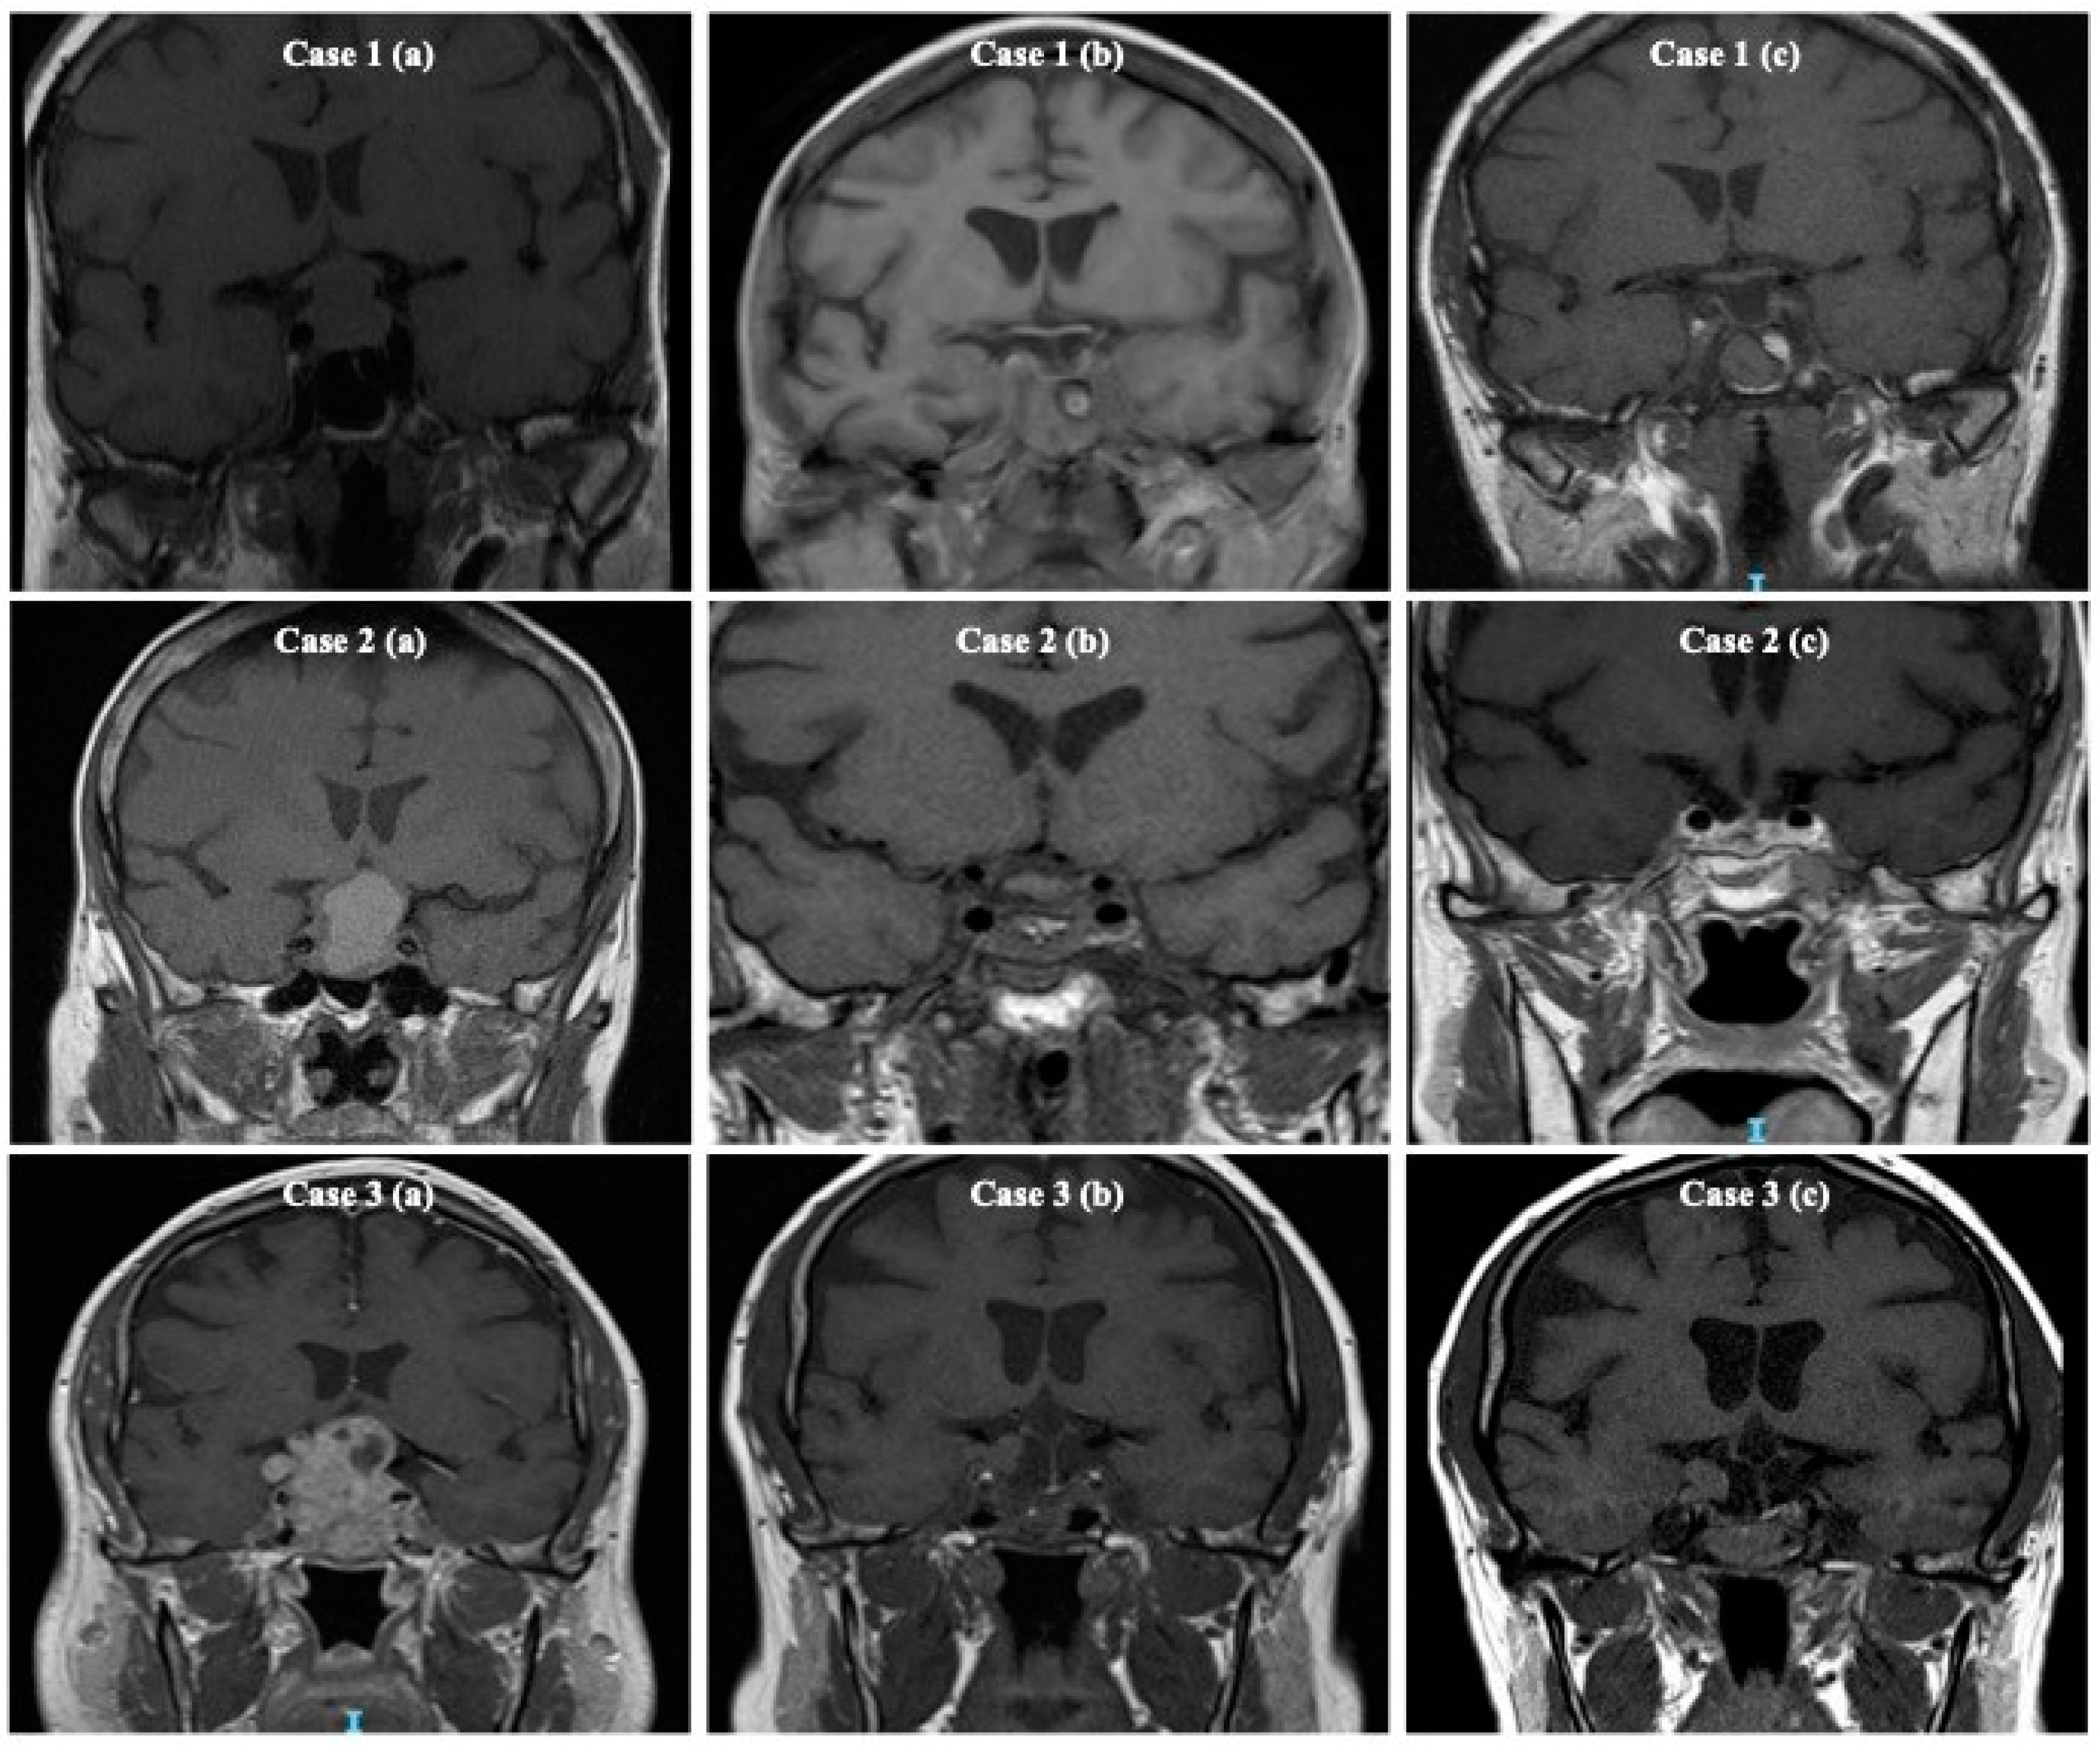
3. Results
3.1. Population Statistics
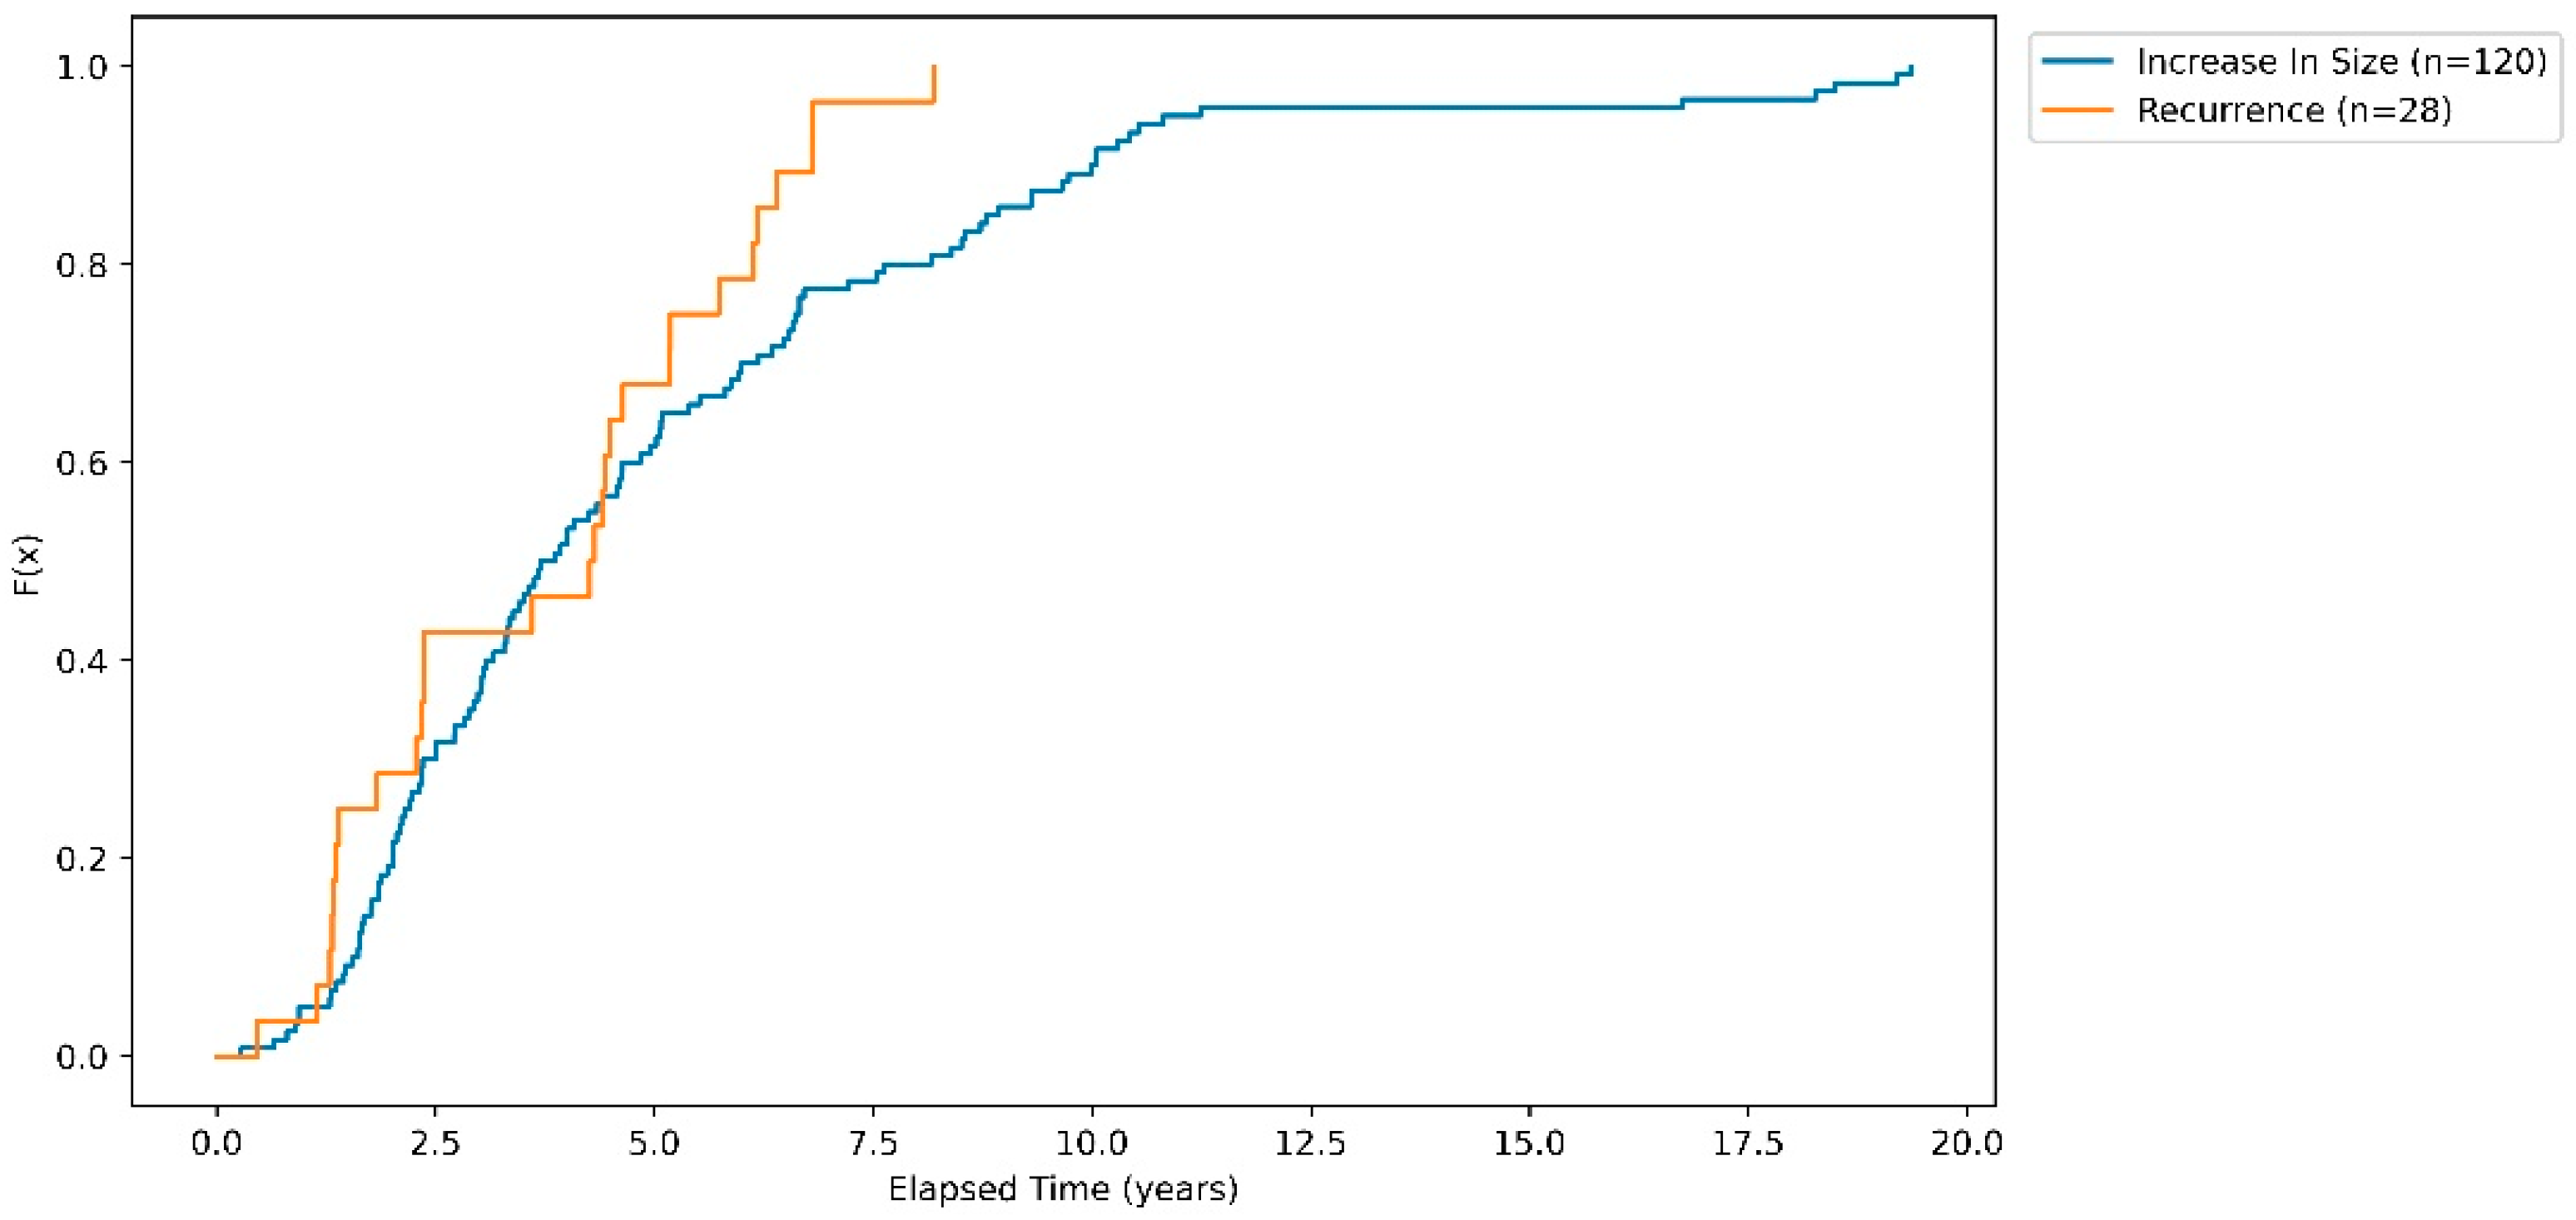
3.2. Cumulative Probability of Recurrence and Regrowth
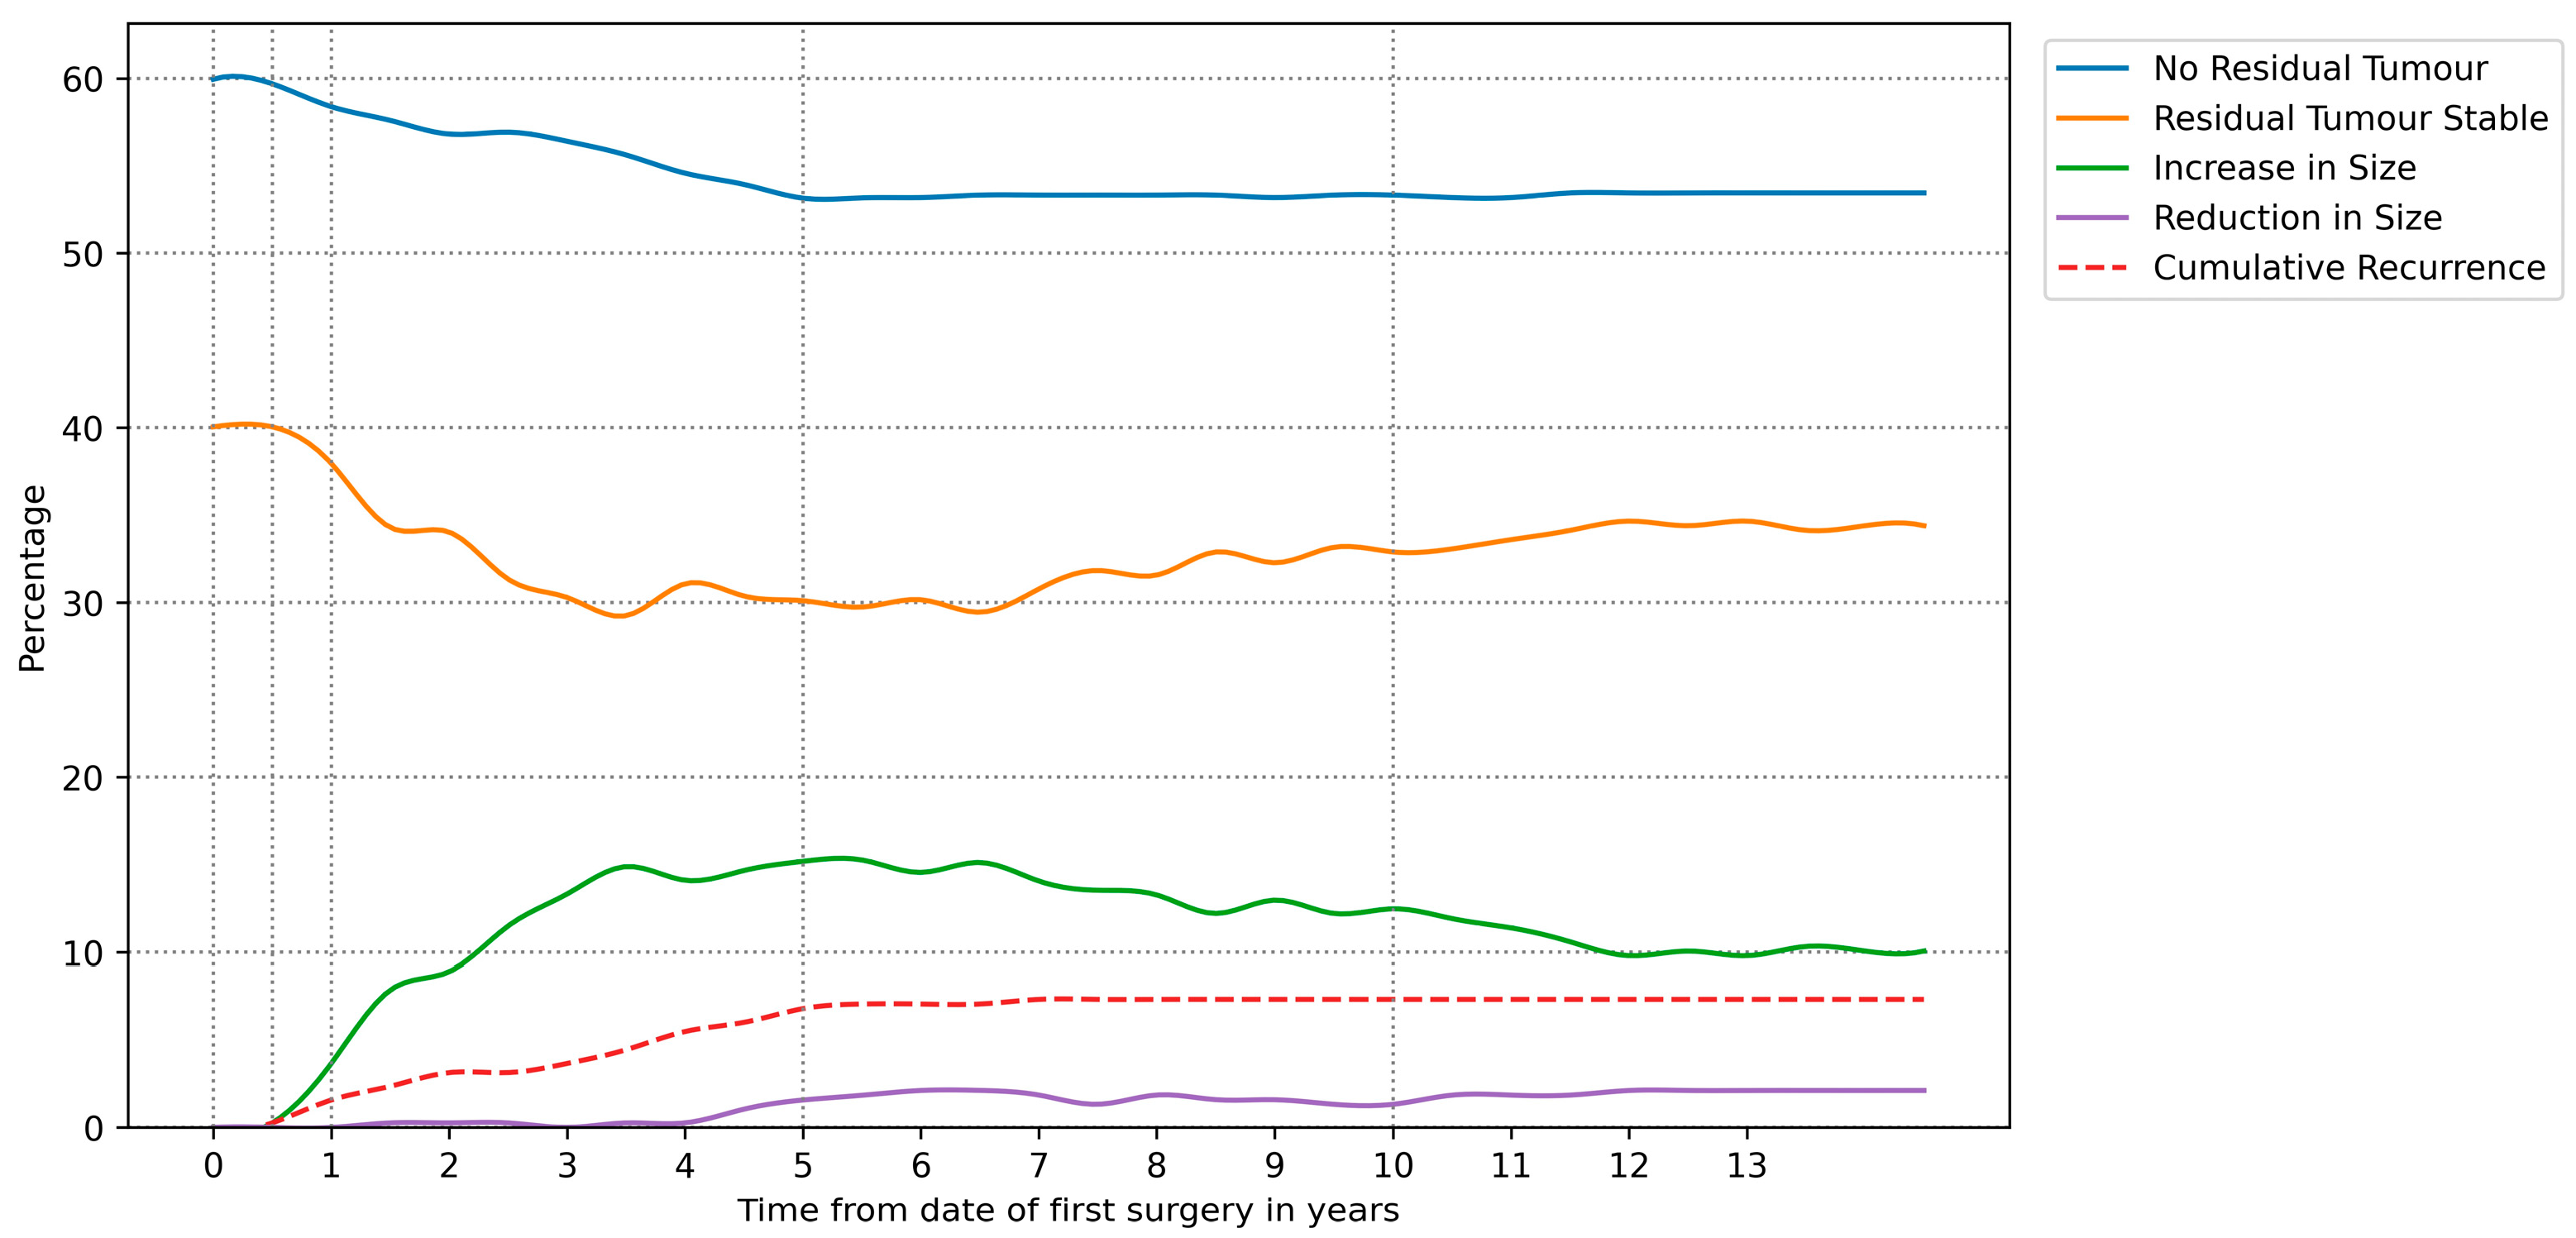
3.3. Derived Radiological Outcome Timelines
3.4. Machine Learning for Determining Post-Operative Radiological Outcome
3.4.1. Model Performance Analysis
3.4.2. Feature Importance in Determining Radiology Outcomes
3.4.3. Predicting Tumour Recurrence and Regrowth
4. Discussion
5. Conclusions
Author Contributions
Funding
Institutional Review Board Statement
Informed Consent Statement
Data Availability Statement
Conflicts of Interest
Appendix A

| Software/Library | Version |
|---|---|
| Spyder IDE | 5.1.5 |
| Python | 3.9.7 (64-bit) |
| Qt | 5.9.7 |
| PyQt | 5.9.2 |
| MS Windows | 10 |
| Pandas | 1.3.4 |
| Sklearn | 1.1.2 |
| Matplotlib | 3.4.3 |
| Seaborn | 0.11.2 |
| Time Relative to First Surgery | |||||
|---|---|---|---|---|---|
| 0–6 Months | 6–12 Months | 1–1.5 Years | 5 Years | 10 Years | |
| No Residual Tumour | 59.9% | 59.7% | 58.4% | 53.1% | 53.3% |
| Residual Tumour Stable | 40.1% | 39.8% | 36.4% | 29.3% | 32.9% |
| Increase in Size | 0.0% | 0.3% | 3.7% | 15.2% | 12.5% |
| Reduction in Size | 0.0% | 0.0% | 0.0% | 1.6% | 1.3% |
| Cumulative Recurrence | 0.0% | 0.3% | 1.6% | 6.8% | 7.3% |
References
- Asa, S.L.; Mete, O.; Perry, A.; Osamura, R.Y. Overview of the 2022 WHO Classification of Pituitary Tumors. Endocr. Pathol. 2022, 33, 6–26. [Google Scholar] [CrossRef]
- Snyder, P.J. Gonadotroph Adenomas. In The Pituitary; Elsevier: Amsterdam, The Netherlands, 2011; pp. 637–654. [Google Scholar]
- Chen, Y.; Wang, C.D.; Su, Z.P.; Chen, Y.X.; Cai, L.; Zhuge, Q.C.; Wu, Z.B. Natural History of Postoperative Nonfunctioning Pituitary Adenomas: A Systematic Review and Meta-Analysis. Neuroendocrinology 2012, 96, 333–342. [Google Scholar] [CrossRef]
- Maria Licia Calado de Aguiar Ribeiro, C.; Fernandes, J.C.; Machado, H.R.; Elias, L.L.; Moreira, A.C.; de Castro, M. Non-functioning pituitary adenomas: Clinical feature, laboratorial and imaging assessment, therapeutic management and outcome. Arq. Bras. Endocrinol. Metabol. 2009, 53, 31–39. [Google Scholar]
- Khan, D.Z.; Hanrahan, J.G.; Baldeweg, S.E.; Dorward, N.L.; Stoyanov, D.; Marcus, H.J. Current and Future Advances in Surgical Therapy for Pituitary Adenoma. Endocr. Rev. 2023, 44, 947–959. [Google Scholar] [CrossRef]
- Lyu, W.; Fei, X.; Chen, C.; Tang, Y. Nomogram predictive model of post-operative recurrence in non-functioning pituitary adenoma. Gland Surg. 2021, 10, 807. [Google Scholar] [CrossRef]
- Esposito, D.; Olsson, D.S.; Ragnarsson, O.; Buchfelder, M.; Skoglund, T.; Johannsson, G. Non-functioning pituitary adenomas: Indications for pituitary surgery and post-surgical management. Pituitary 2019, 22, 422. [Google Scholar] [CrossRef] [PubMed]
- Chanson, P.; Dormoy, A.; Dekkers, O.M. Use of radiotherapy after pituitary surgery for non-functioning pituitary adenomas. Eur. J. Endocrinol. 2019, 181, D1–D13. [Google Scholar] [CrossRef] [PubMed]
- Hussein, Z.; Grieve, J.; Dorward, N.; Miszkiel, K.; Kosmin, M.; Fersht, N.; Bouloux, P.M.; Jaunmuktane, Z.; Baldeweg, S.E.; Marcus, H.J. Non-functioning pituitary macroadenoma following surgery: Long-term outcomes and development of an optimal follow-up strategy. Front. Surg. 2023, 10, 1129387. Available online: https://www.ncbi.nlm.nih.gov/pmc/articles/PMC10369001/ (accessed on 17 September 2023). [CrossRef] [PubMed]
- Raverot, G.; Dantony, E.; Beauvy, J.; Vasiljevic, A.; Mikolasek, S.; Borson-Chazot, F.; Jouanneau, E.; Roy, P.; Trouillas, J. Risk of recurrence in pituitary neuroendocrine tumors: A prospective study using a five-tiered classification. J. Clin. Endocrinol. Metab. 2017, 102, 3368–3374. [Google Scholar] [CrossRef] [PubMed]
- Mete, O.; Ezzat, S.; Asa, S.L. Biomarkers of aggressive pituitary adenomas. J. Mol. Endocrinol. 2012, 49, R69–R78. [Google Scholar] [CrossRef] [PubMed]
- Oliveira, M.C.; Marroni, C.P.; Pizarro, C.B.; Pereira-Lima, J.F.; Barbosa-Coutinho, L.M.; Ferreira, N.P. Expression of p53 protein in pituitary adenomas. Braz. J. Med. Biol. Res. 2002, 35, 561–565. Available online: http://www.scielo.br/scielo.php?script=sci_arttext&pid=S0100-879X2002000500008&lng=en&tlng=en (accessed on 2 May 2019). [CrossRef] [PubMed]
- Landeiro, J.A.; Fonseca, E.O.; Monnerat, A.L.C.; Taboada, G.F.; Cabral, G.A.P.S.; Antunes, F. Nonfunctioning giant pituitary adenomas: Invasiveness and recurrence. Surg. Neurol. Int. 2015, 6, 179. Available online: http://www.ncbi.nlm.nih.gov/pubmed/26674325 (accessed on 2 May 2019). [CrossRef] [PubMed]
- Zhang, C.; Heng, X.; Neng, W.; Chen, H.; Sun, A.; Li, J.; Wang, M. Prediction of high infiltration levels in pituitary adenoma using MRI-based radiomics and machine learning. Chin. Neurosurg. J. 2022, 8, 221–222. [Google Scholar] [CrossRef]
- Dai, C.; Sun, B.; Wang, R.; Kang, J. The Application of Artificial Intelligence and Machine Learning in Pituitary Adenomas. Front. Oncol. 2021, 11, 784819. [Google Scholar] [CrossRef] [PubMed]
- ReRech, M.M.; de Macedo Filho, L.; White, A.J.; Perez-Vega, C.; Samson, S.L.; Chaichana, K.L.; Olomu, O.U.; Quinones-Hinojosa, A.; Almeida, J.P. Machine Learning Models to Forecast Outcomes of Pituitary Surgery: A Systematic Review in Quality of Reporting and Current Evidence. Brain Sci. 2023, 13, 495. [Google Scholar] [CrossRef]
- Hussein, Z.; Slack, R.W.; Marcus, H.J.; Mazomenos, E.B.; Baldeweg, S.E. Post-Operative Medium- and Long-Term Endocrine Outcomes in Patients with Non-Functioning Pituitary Adenomas—Machine Learning Analysis. Cancers 2023, 15, 2771. Available online: https://www.mdpi.com/2072-6694/15/10/2771 (accessed on 16 May 2023). [CrossRef] [PubMed]
- Collins, G.S.; Reitsma, J.B.; Altman, D.G.; Moons, K.G.M. Transparent reporting of a multivariable prediction model for individual prognosis or diagnosis (TRIPOD): The TRIPOD Statement. BMC Med. 2015, 13, 55–63. [Google Scholar] [CrossRef]
- Lüdecke, D.K.; Buchfelder, M.; Fahlbusch, R.; Quabbe, H.J.; Petersenn, S.; Saeger, W. Pathohistological classification of pituitary tumors: 10 years of experience with the German Pituitary Tumor Registry. Eur. J. Endocrinol. 2007, 156, 203–216. [Google Scholar]
- Trouillas, J.; Roy, P.; Sturm, N.; Dantony, E.; Cortet-Rudelli, C.; Viennet, G.; Bonneville, J.F.; Assaker, R.; Auger, C.; Brue, T.; et al. A new prognostic clinicopathological classification of pituitary adenomas: A multicentric case-control study of 410 patients with 8 years post-operative follow-up. Acta Neuropathol. 2013, 126, 123–135. [Google Scholar] [CrossRef]
- Pedregosa, F.; Varoquaux, G.; Gramfort, A.; Michel, V.; Thirion, B.; Grisel, O.; Blondel, M.; Prettenhofer, P.; Weiss, R.; Dubourg, V.; et al. Scikit-learn: Machine Learning in Python. J. Mach. Learn. Res. 2011, 12, 2825–2830. Available online: http://scikit-learn.sourceforge.net (accessed on 9 March 2023).
- Lu, L.; Wan, X.; Xu, Y.; Chen, J.; Shu, K.; Lei, T. Prognostic Factors for Recurrence in Pituitary Adenomas: Recent Progress and Future Directions. Diagnostics 2022, 12, 977. [Google Scholar] [CrossRef] [PubMed]
- Drummond, J.B.; Antônio Ribeiro-Oliveira, J.; Soares, B.S. Non-Functioning Pituitary Adenomas; National Library of Medicine: Bethesda, MD, USA, 2018. [Google Scholar]
- Maletkovic, J.; Dabbagh, A.; Zhang, D.; Zahid, A.; Bergsneider, M.; Wang, M.B.; Linetsky, M.; Salamon, N.; Yong, W.H.; Vinters, H.V.; et al. Residual Tumor Confers a 10-Fold Increased Risk of Regrowth in Clinically Nonfunctioning Pituitary Tumors. J. Endocr. Soc. 2019, 3, 1931–1941. [Google Scholar] [CrossRef] [PubMed]
- Roelfsema, F.; Biermasz, N.R.; Pereira, A.M. Clinical factors involved in the recurrence of pituitary adenomas after surgical remission: A structured review and meta-analysis. Pituitary 2012, 15, 71–83. [Google Scholar] [CrossRef] [PubMed]
- Hannan, C.J.; Daousi, C.; Radon, M.; Gilkes, C.E. 3 Tesla intra-operative MRI as an adjunct to endoscopic pituitary surgery: An early assessment of clinical utility. Br. J. Neurosurg. 2021. Available online: https://pubmed.ncbi.nlm.nih.gov/34585644/ (accessed on 15 January 2024). [CrossRef]

| Measure | Value |
|---|---|
| Total number of patients | 383 |
| Average age | 56.8 |
| Standard age (in years) | 13.5 |
| Sex ratio, expressed as the ratio of males to females. | 67:33 |
| Percentage of patients underwent one or more surgeries | 100 |
| Percentage of patients who had two or more surgeries | 22 |
| Percentage of patients who had three surgeries | 4 |
| Percentage of patients had radiotherapy | 17 |
| Mean follow-up (range in years) | 8 (0.5–23) |
| Total number of patients who had follow up between 0–5 years | 86 |
| Total number of patients who had follow up between 5–10 years | 195 |
| Total number of patients who had follow up between 10–15 years | 92 |
| Knosp Classification on Preoperative Imaging of Non-Functioning Pituitary Macroadenomas | |||
|---|---|---|---|
| Grade I | 38% | ||
| Grade II | 33% | ||
| Grade III A | 17% | ||
| Grade III B | 2% | ||
| Grade IV | 11% | ||
| Dimensions and Volume on Preoperative Imaging | |||
| Tumour recurrence/regrowth | No tumour recurrence/regrowth | p value | |
| Craniocaudal diameter (IQR) | 3.2 cm (2.4–3.9) | 2.5 cm (1.9–3.2) | 0.001 |
| Transverse diameter (IQR) | 2.7 cm (2.1–3.0) | 2.2 cm (1.8–2.7) | 0.001 |
| Anteroposterior diameter (IQR) | 2.3 cm (1.9–2.6) | 1.9 cm (1.6–2.3) | 0.001 |
| Volume (IQR) | 10.5 cm3 (5–16) | 5.8 cm3 (3–10) | 0.001 |
| Accuracy | AUC-ROC | |||
|---|---|---|---|---|
| Mean | Std | Mean | Std | |
| Logistic Regression | 0.67 | 0.06 | 0.64 | 0.08 |
| KNN | 0.74 | 0.05 | 0.62 | 0.03 |
| SVM | 0.82 | 0.04 | 0.67 | 0.02 |
| Decision Tree | 0.78 | 0.05 | 0.66 | 0.05 |
| Feature | Feature Importance (Mean ± Std) at Post-Operative Prediction Period | |||
|---|---|---|---|---|
| 6 Months | 1-Year | 5 Years | 10 Years | |
| Second Scan Complete Resection: True | 0.33 ± 0.34 | 0.31 ± 0.32 | 0.32 ± 0.27 | 0.33 ± 0.28 |
| Second Scan Complete Resection: False | 0.33 ± 0.34 | 0.31 ± 0.32 | 0.21 ± 0.27 | 0.22 ± 0.28 |
| Age | 0.10 ± 0.03 | 0.11 ± 0.03 | 0.11 ± 0.03 | 0.11 ± 0.04 |
| Tumour Volume (cc) | 0.08 ± 0.04 | 0.09 ± 0.04 | 0.09 ± 0.03 | 0.09 ± 0.03 |
| Radiotherapy Administered: True | 0.03 ± 0.02 | 0.03 ± 0.02 | ||
| Radiology Outcome | AUC-ROC (Mean ± Std) at Post-Operative Prediction Period | |||
|---|---|---|---|---|
| 6 Months | 1-Year | 5 Years | 10 Years | |
| No Residual Tumour | 0.99 ± 0.02 | 0.98 ± 0.02 | 0.91 ± 0.03 | 0.88 ± 0.05 |
| Residual Tumour Stable | 1 ± 0.01 | 0.92 ± 0.06 | 0.78 ± 0.06 | 0.78 ± 0.08 |
| Increase in Size | 0.5 ± 0 | 0.52 ± 0.07 | 0.68 ± 0.1 | 0.6 ± 0.13 |
| Recurrence | 0.5 ± 0 | 0.5 ± 0 | 0.51 ± 0.06 | 0.5 ± 0.01 |
| Reduction in Size | 0.5 ± 0 | 0.5 ± 0.01 | ||
| Radiology Outcome | ML Model | AUC-ROC (Mean ± Std) at Post-Operative Prediction Period | ||
|---|---|---|---|---|
| 2 Years | 5 Years | 10 Years | ||
| Increase in Size | SVM | 0.5 ± 0 | 0.86 ± 0.09 | 0.88 ± 0.04 |
| Decision Tree | 0.63 ± 0.13 | 0.79 ± 0.07 | 0.85 ± 0.07 | |
| Recurrence | SVM | 0.5 ± 0 | 0.5 ± 0 | 0.5 ± 0 |
| Decision Tree | 0.5 ± 0.01 | 0.49 ± 0.01 | 0.49 ± 0.03 | |
Disclaimer/Publisher’s Note: The statements, opinions and data contained in all publications are solely those of the individual author(s) and contributor(s) and not of MDPI and/or the editor(s). MDPI and/or the editor(s) disclaim responsibility for any injury to people or property resulting from any ideas, methods, instructions or products referred to in the content. |
© 2024 by the authors. Licensee MDPI, Basel, Switzerland. This article is an open access article distributed under the terms and conditions of the Creative Commons Attribution (CC BY) license (https://creativecommons.org/licenses/by/4.0/).
Share and Cite
Hussein, Z.; Slack, R.W.; Baldeweg, S.E.; Mazomenos, E.B.; Marcus, H.J. Machine Learning Analysis of Post-Operative Tumour Progression in Non-Functioning Pituitary Neuroendocrine Tumours: A Pilot Study. Cancers 2024, 16, 1199. https://doi.org/10.3390/cancers16061199
Hussein Z, Slack RW, Baldeweg SE, Mazomenos EB, Marcus HJ. Machine Learning Analysis of Post-Operative Tumour Progression in Non-Functioning Pituitary Neuroendocrine Tumours: A Pilot Study. Cancers. 2024; 16(6):1199. https://doi.org/10.3390/cancers16061199
Chicago/Turabian StyleHussein, Ziad, Robert W. Slack, Stephanie E. Baldeweg, Evangelos B. Mazomenos, and Hani J. Marcus. 2024. "Machine Learning Analysis of Post-Operative Tumour Progression in Non-Functioning Pituitary Neuroendocrine Tumours: A Pilot Study" Cancers 16, no. 6: 1199. https://doi.org/10.3390/cancers16061199
APA StyleHussein, Z., Slack, R. W., Baldeweg, S. E., Mazomenos, E. B., & Marcus, H. J. (2024). Machine Learning Analysis of Post-Operative Tumour Progression in Non-Functioning Pituitary Neuroendocrine Tumours: A Pilot Study. Cancers, 16(6), 1199. https://doi.org/10.3390/cancers16061199