

Machine Learning-Based Assessment of Survival and Risk Factors in Non-Alcoholic Fatty Liver Disease-Related Hepatocellular Carcinoma for Optimized Patient Management

 ,
,  , ,
, ,  , and
, and 
Abstract
Simple Summary
Abstract
1. Introduction
2. Materials and Methods
3. Results
4. Discussion
5. Conclusions
Author Contributions
Funding
Institutional Review Board Statement
Informed Consent Statement
Data Availability Statement
Acknowledgments
Conflicts of Interest
References
- Le, M.H.; Yeo, Y.H.; Li, X.; Li, J.; Zou, B.; Wu, Y.; Ye, Q.; Huang, D.Q.; Zhao, C.; Zhang, J. 2019 Global NAFLD prevalence: A systematic review and meta-analysis. Clin. Gastroenterol. Hepatol. 2022, 20, 2809–2817.e28. [Google Scholar] [CrossRef]
- Younossi, Z.M.; Golabi, P.; Paik, J.M.; Henry, A.; Van Dongen, C.; Henry, L. The global epidemiology of nonalcoholic fatty liver disease (NAFLD) and nonalcoholic steatohepatitis (NASH): A systematic review. Hepatology 2023, 77, 1335–1347. [Google Scholar] [CrossRef] [PubMed]
- Rinella, M.E.; Neuschwander-Tetri, B.A.; Siddiqui, M.S.; Abdelmalek, M.F.; Caldwell, S.; Barb, D.; Kleiner, D.E.; Loomba, R. AASLD practice guidance on the clinical assessment and management of nonalcoholic fatty liver disease. Hepatology 2023, 77, 1797–1835. [Google Scholar] [CrossRef]
- Lazarus, J.V.; Ekstedt, M.; Marchesini, G.; Mullen, J.; Novak, K.; Pericàs, J.M.; Roel, E.; Romero-Gómez, M.; Ratziu, V.; Tacke, F. A cross-sectional study of the public health response to non-alcoholic fatty liver disease in Europe. J. Hepatol. 2020, 72, 14–24. [Google Scholar] [CrossRef] [PubMed]
- Lazarus, J.V.; Mark, H.E.; Allen, A.M.; Arab, J.P.; Carrieri, P.; Noureddin, M.; Alazawi, W.; Alkhouri, N.; Alqahtani, S.A.; Arrese, M. A global research priority agenda to advance public health responses to fatty liver disease. J. Hepatol. 2023, 79, 618–634. [Google Scholar] [CrossRef]
- Lonardo, A.; Leoni, S.; Alswat, K.A.; Fouad, Y. History of nonalcoholic fatty liver disease. Int. J. Mol. Sci. 2020, 21, 5888. [Google Scholar] [CrossRef]
- Eslam, M.; Sanyal, A.J.; George, J.; Sanyal, A.; Neuschwander-Tetri, B.; Tiribelli, C.; Kleiner, D.E.; Brunt, E.; Bugianesi, E.; Yki-Järvinen, H. MAFLD: A consensus-driven proposed nomenclature for metabolic associated fatty liver disease. Gastroenterology 2020, 158, 1999–2014.e1991. [Google Scholar] [CrossRef]
- Staufer, K.; Stauber, R.E. Steatotic Liver Disease: Metabolic Dysfunction, Alcohol, or Both? Biomedicines 2023, 11, 2108. [Google Scholar] [CrossRef] [PubMed]
- Rinella, M.E.; Lazarus, J.V.; Ratziu, V.; Francque, S.M.; Sanyal, A.J.; Kanwal, F.; Romero, D.; Abdelmalek, M.F.; Anstee, Q.M.; Arab, J.P. A multi-society Delphi consensus statement on new fatty liver disease nomenclature. Ann. Hepatol. 2023, 29, 101133. [Google Scholar] [CrossRef]
- McPherson, S.; Hardy, T.; Henderson, E.; Burt, A.D.; Day, C.P.; Anstee, Q.M. Evidence of NAFLD progression from steatosis to fibrosing-steatohepatitis using paired biopsies: Implications for prognosis and clinical management. J. Hepatol. 2015, 62, 1148–1155. [Google Scholar] [CrossRef]
- Shaikh, A.; Pedra, G.; Ruiz-Casas, L.; Franks, B.; Dhillon, H.; Fernandes, J.D.d.R.; Mangla, K.K.; Augusto, M.; Romero-Gómez, M.; Schattenberg, J.M. Risk factors for fibrosis progression in non-alcoholic steatohepatitis: Analysis of the European cohort in the real-world GAIN study. Gastroenterol. Y Hepatol. 2023, in press. [CrossRef]
- Estes, C.; Anstee, Q.M.; Arias-Loste, M.T.; Bantel, H.; Bellentani, S.; Caballeria, J.; Colombo, M.; Craxi, A.; Crespo, J.; Day, C.P. Modeling nafld disease burden in china, france, germany, italy, japan, spain, united kingdom, and united states for the period 2016–2030. J. Hepatol. 2018, 69, 896–904. [Google Scholar] [CrossRef] [PubMed]
- Zhu, Y.; Zhang, H.; Jiang, P.; Xie, C.; Luo, Y.; Chen, J. Transcriptional and Epigenetic Alterations in the Progression of Non-Alcoholic Fatty Liver Disease and Biomarkers Helping to Diagnose Non-Alcoholic Steatohepatitis. Biomedicines 2023, 11, 970. [Google Scholar] [CrossRef] [PubMed]
- Huang, G.; Wallace, D.F.; Powell, E.E.; Rahman, T.; Clark, P.J.; Subramaniam, V.N. Gene Variants Implicated in Steatotic Liver Disease: Opportunities for Diagnostics and Therapeutics. Biomedicines 2023, 11, 2809. [Google Scholar] [CrossRef] [PubMed]
- Powell, E.E.; Wong, V.W.-S.; Rinella, M. Non-alcoholic fatty liver disease. Lancet 2021, 397, 2212–2224. [Google Scholar] [CrossRef] [PubMed]
- Sung, H.; Ferlay, J.; Siegel, R.L.; Laversanne, M.; Soerjomataram, I.; Jemal, A.; Bray, F. Global cancer statistics 2020: GLOBOCAN estimates of incidence and mortality worldwide for 36 cancers in 185 countries. CA Cancer J. Clin. 2021, 71, 209–249. [Google Scholar] [CrossRef] [PubMed]
- European Association for the Study of the Liver. EASL clinical practice guidelines: Management of hepatocellular carcinoma. J. Hepatol. 2018, 69, 182–236. [Google Scholar] [CrossRef] [PubMed]
- Heimbach, J.K.; Kulik, L.M.; Finn, R.S.; Sirlin, C.B.; Abecassis, M.M.; Roberts, L.R.; Zhu, A.X.; Murad, M.H.; Marrero, J.A. AASLD guidelines for the treatment of hepatocellular carcinoma. Hepatology 2018, 67, 358–380. [Google Scholar] [CrossRef]
- Reig, M.; Forner, A.; Ávila, M.A.; Ayuso, C.; Mínguez, B.; Varela, M.; Bilbao, I.; Bilbao, J.I.; Burrel, M.; Bustamante, J. Diagnosis and treatment of hepatocellular carcinoma. Update of the consensus document of the AEEH, AEC, SEOM, SERAM, SERVEI, and SETH. Med. Clín. Engl. Ed. 2021, 156, 463.e1–463.e31. [Google Scholar] [CrossRef]
- Beam, A.L.; Kohane, I.S. Big data and machine learning in health care. JAMA 2018, 319, 1317–1318. [Google Scholar] [CrossRef]
- Deo, R.C. Machine learning in medicine. Circulation 2015, 132, 1920–1930. [Google Scholar] [CrossRef]
- Rajkomar, A.; Dean, J.; Kohane, I. Machine learning in medicine. N. Engl. J. Med. 2019, 380, 1347–1358. [Google Scholar] [CrossRef] [PubMed]
- Zhang, D.; Gong, Y. The comparison of LightGBM and XGBoost coupling factor analysis and prediagnosis of acute liver failure. IEEE Access 2020, 8, 220990–221003. [Google Scholar] [CrossRef]
- Suárez, M.; Martínez, R.; Torres, A.M.; Torres, B.; Mateo, J. A Machine Learning Method to Identify the Risk Factors for Liver Fibrosis Progression in Nonalcoholic Steatohepatitis. Dig. Dis. Sci. 2023, 68, 3801–3809. [Google Scholar] [CrossRef] [PubMed]
- Singal, A.G.; Llovet, J.M.; Yarchoan, M.; Mehta, N.; Heimbach, J.K.; Dawson, L.A.; Jou, J.H.; Kulik, L.M.; Agopian, V.G.; Marrero, J.A. AASLD practice guidance on prevention, diagnosis, and treatment of hepatocellular carcinoma. Hepatology 2023, 78, 1922–1965. [Google Scholar] [CrossRef] [PubMed]
- Blonde, L.; Umpierrez, G.E.; Reddy, S.S.; McGill, J.B.; Berga, S.L.; Bush, M.; Chandrasekaran, S.; DeFronzo, R.A.; Einhorn, D.; Galindo, R.J. American Association of Clinical Endocrinology clinical practice guideline: Developing a diabetes mellitus comprehensive care plan—2022 update. Endocr. Pract. 2022, 28, 923–1049. [Google Scholar] [CrossRef] [PubMed]
- Jellinger, P.S.; Handelsman, Y.; Rosenblit, P.D.; Bloomgarden, Z.T.; Fonseca, V.A.; Garber, A.J.; Grunberger, G.; Guerin, C.K.; Bell, D.S.; Mechanick, J.I. American Association of Clinical Endocrinologists and American College of Endocrinology guidelines for management of dyslipidemia and prevention of cardiovascular disease. Endocr. Pract. 2017, 23, 1–87. [Google Scholar] [CrossRef] [PubMed]
- Apovian, C.M. Obesity: Definition, comorbidities, causes, and burden. Am. J. Manag. Care 2016, 22, S176–S185. [Google Scholar]
- Ginès, P.; Krag, A.; Abraldes, J.G.; Solà, E.; Fabrellas, N.; Kamath, P.S. Liver cirrhosis. Lancet 2021, 398, 1359–1376. [Google Scholar] [CrossRef]
- Kok, B.; Abraldes, J.G. Child–Pugh Classification: Time to Abandon? In Seminars in Liver Disease; Thieme Medical Publishers: Leipzig, Germany, 2019; pp. 096–103. [Google Scholar]
- Sok, M.; Zavrl, M.; Greif, B.; Srpčič, M. Objective assessment of WHO/ECOG performance status. Support. Care Cancer 2019, 27, 3793–3798. [Google Scholar] [CrossRef]
- Peng, Y.; Qi, X.; Guo, X. Child–Pugh versus MELD score for the assessment of prognosis in liver cirrhosis: A systematic review and meta-analysis of observational studies. Medicine 2016, 95, e2877. [Google Scholar] [CrossRef]
- De Franchis, R.; Bosch, J.; Garcia-Tsao, G.; Reiberger, T.; Ripoll, C.; Abraldes, J.G.; Albillos, A.; Baiges, A.; Bajaj, J.; Bañares, R. Baveno VII–renewing consensus in portal hypertension. J. Hepatol. 2022, 76, 959–974. [Google Scholar] [CrossRef]
- Vogel, A.; Cervantes, A.; Chau, I.; Daniele, B.; Llovet, J.M.; Meyer, T.; Nault, J.-C.; Neumann, U.; Ricke, J.; Sangro, B. Hepatocellular carcinoma: ESMO Clinical Practice Guidelines for diagnosis, treatment and follow-up. Ann. Oncol. 2018, 29, iv238–iv255. [Google Scholar] [CrossRef]
- Toniutto, P.; Fumolo, E.; Fornasiere, E.; Bitetto, D. Liver transplantation in patients with hepatocellular carcinoma beyond the Milan criteria: A comprehensive review. J. Clin. Med. 2021, 10, 3932. [Google Scholar] [CrossRef] [PubMed]
- Reig, M.; Forner, A.; Rimola, J.; Ferrer-Fàbrega, J.; Burrel, M.; Garcia-Criado, Á.; Kelley, R.K.; Galle, P.R.; Mazzaferro, V.; Salem, R. BCLC strategy for prognosis prediction and treatment recommendation: The 2022 update. J. Hepatol. 2022, 76, 681–693. [Google Scholar] [CrossRef] [PubMed]
- Sagi, O.; Rokach, L. Approximating XGBoost with an interpretable decision tree. Inf. Sci. 2021, 572, 522–542. [Google Scholar] [CrossRef]
- Sahmadi, B.; Boughaci, D.; Rahmani, R.; Sissani, N. A modified firefly algorithm with support vector machine for medical data classification. In Proceedings of the 6th IFIP TC 5 International Conference—Computational Intelligence and Its Applications, CIIA 2018, Oran, Algeria, 8–10 May 2018; Proceedings 6. Springer: Berlin/Heidelberg, Germany, 2018; pp. 232–243. [Google Scholar]
- Suárez, M.; Martínez, R.; Torres, A.M.; Ramón, A.; Blasco, P.; Mateo, J. Personalized Risk Assessment of Hepatic Fibrosis after Cholecystectomy in Metabolic-Associated Steatotic Liver Disease: A Machine Learning Approach. J. Clin. Med. 2023, 12, 6489. [Google Scholar] [CrossRef] [PubMed]
- Liang, J.; Qin, Z.; Xiao, S.; Ou, L.; Lin, X. Efficient and secure decision tree classification for cloud-assisted online diagnosis services. IEEE Trans. Dependable Secur. Comput. 2019, 18, 1632–1644. [Google Scholar] [CrossRef]
- Bafjaish, S.S. Comparative analysis of Naive Bayesian techniques in health-related for classification task. J. Soft Comput. Data Min. 2020, 1, 1–10. [Google Scholar]
- Xing, W.; Bei, Y. Medical health big data classification based on KNN classification algorithm. IEEE Access 2019, 8, 28808–28819. [Google Scholar] [CrossRef]
- Turner, R.; Eriksson, D.; McCourt, M.; Kiili, J.; Laaksonen, E.; Xu, Z.; Guyon, I. Bayesian optimization is superior to random search for machine learning hyperparameter tuning: Analysis of the black-box optimization challenge 2020. In Proceedings of the NeurIPS 2020 Competition and Demonstration Track, Virtual, 6–12 December 2020; pp. 3–26. [Google Scholar]
- Yang, J.; Li, Y.; Liu, Q.; Li, L.; Feng, A.; Wang, T.; Zheng, S.; Xu, A.; Lyu, J. Brief introduction of medical database and data mining technology in big data era. J. Evid.-Based Med. 2020, 13, 57–69. [Google Scholar] [CrossRef]
- Chicco, D.; Warrens, M.J.; Jurman, G. The Matthews correlation coefficient (MCC) is more informative than Cohen’s Kappa and Brier score in binary classification assessment. IEEE Access 2021, 9, 78368–78381. [Google Scholar] [CrossRef]
- Estes, C.; Razavi, H.; Loomba, R.; Younossi, Z.; Sanyal, A.J. Modeling the epidemic of nonalcoholic fatty liver disease demonstrates an exponential increase in burden of disease. Hepatology 2018, 67, 123–133. [Google Scholar] [CrossRef]
- Karlsen, T.H.; Sheron, N.; Zelber-Sagi, S.; Carrieri, P.; Dusheiko, G.; Bugianesi, E.; Pryke, R.; Hutchinson, S.J.; Sangro, B.; Martin, N.K. The EASL–Lancet Liver Commission: Protecting the next generation of Europeans against liver disease complications and premature mortality. Lancet 2022, 399, 61–116. [Google Scholar] [CrossRef] [PubMed]
- Foerster, F.; Gairing, S.J.; Müller, L.; Galle, P.R. NAFLD-driven HCC: Safety and efficacy of current and emerging treatment options. J. Hepatol. 2022, 76, 446–457. [Google Scholar] [CrossRef] [PubMed]
- Shah, P.A.; Patil, R.; Harrison, S.A. NAFLD-related hepatocellular carcinoma: The growing challenge. Hepatology 2023, 77, 323–338. [Google Scholar] [CrossRef] [PubMed]
- Taylor, R.S.; Taylor, R.J.; Bayliss, S.; Hagström, H.; Nasr, P.; Schattenberg, J.M.; Ishigami, M.; Toyoda, H.; Wong, V.W.-S.; Peleg, N. Association between fibrosis stage and outcomes of patients with nonalcoholic fatty liver disease: A systematic review and meta-analysis. Gastroenterology 2020, 158, 1611–1625.e12. [Google Scholar] [CrossRef] [PubMed]
- Kanwal, F.; Kramer, J.R.; Mapakshi, S.; Natarajan, Y.; Chayanupatkul, M.; Richardson, P.A.; Li, L.; Desiderio, R.; Thrift, A.P.; Asch, S.M. Risk of hepatocellular cancer in patients with non-alcoholic fatty liver disease. Gastroenterology 2018, 155, 1828–1837.e2. [Google Scholar] [CrossRef] [PubMed]
- Ioannou, G.N. Epidemiology and risk-stratification of NAFLD-associated HCC. J. Hepatol. 2021, 75, 1476–1484. [Google Scholar] [CrossRef] [PubMed]
- Rumgay, H.; Shield, K.; Charvat, H.; Ferrari, P.; Sornpaisarn, B.; Obot, I.; Islami, F.; Lemmens, V.E.; Rehm, J.; Soerjomataram, I. Global burden of cancer in 2020 attributable to alcohol consumption: A population-based study. Lancet Oncol. 2021, 22, 1071–1080. [Google Scholar] [CrossRef]
- Barbería-Latasa, M.; Gea, A.; Martínez-González, M.A. Alcohol, drinking pattern, and chronic disease. Nutrients 2022, 14, 1954. [Google Scholar] [CrossRef] [PubMed]
- Takahashi, Y.; Dungubat, E.; Kusano, H.; Fukusato, T. Pathology and Pathogenesis of Metabolic Dysfunction-Associated Steatotic Liver Disease-Associated Hepatic Tumors. Biomedicines 2023, 11, 2761. [Google Scholar] [CrossRef] [PubMed]
- Shen, H.; French, B.A.; Tillman, B.C.; Li, J.; French, S.W. Increased DNA methylation in the livers of patients with alcoholic hepatitis. Exp. Mol. Pathol. 2015, 99, 326–329. [Google Scholar] [CrossRef]
- Zhu, R.; Baker, S.S.; Moylan, C.A.; Abdelmalek, M.F.; Guy, C.D.; Zamboni, F.; Wu, D.; Lin, W.; Liu, W.; Baker, R.D. Systematic transcriptome analysis reveals elevated expression of alcohol-metabolizing genes in NAFLD livers. J. Pathol. 2016, 238, 531–542. [Google Scholar] [CrossRef] [PubMed]
- Motta, B.M.; Masarone, M.; Torre, P.; Persico, M. From Non-Alcoholic Steatohepatitis (NASH) to Hepatocellular Carcinoma (HCC): Epidemiology, Incidence, Predictions, Risk Factors, and Prevention. Cancers 2023, 15, 5458. [Google Scholar] [CrossRef]
- Mota, M.; Banini, B.A.; Cazanave, S.C.; Sanyal, A.J. Molecular mechanisms of lipotoxicity and glucotoxicity in nonalcoholic fatty liver disease. Metabolism 2016, 65, 1049–1061. [Google Scholar] [CrossRef]
- Bataller, R.; Cabezas, J.; Aller, R.; Ventura-Cots, M.; Abad, J.; Albillos, A.; Altamirano, J.; Arias-Loste, M.T.; Bañares, R.; Caballería, J. Enfermedad hepática por alcohol. Guías de práctica clínica. Documento de consenso auspiciado por la AEEH. Gastroenterol. Hepatol. 2019, 42, 657–676. [Google Scholar] [CrossRef]
- Xia, T.; Zhao, B.; Li, B.; Lei, Y.; Song, Y.; Wang, Y.; Tang, T.; Ju, S. MRI-Based Radiomics and Deep Learning in Biological Characteristics and Prognosis of Hepatocellular Carcinoma: Opportunities and Challenges. J. Magn. Reson. Imaging 2023, 59, 767–783. [Google Scholar] [CrossRef]
- Feng, Q.; Huang, Z.; Song, L.; Wang, L.; Lu, H.; Wu, L. Combining bulk and single-cell RNA-sequencing data to develop an NK cell-related prognostic signature for hepatocellular carcinoma based on an integrated machine learning framework. Eur. J. Med. Res. 2023, 28, 306. [Google Scholar] [CrossRef] [PubMed]
- Mateo-Sotos, J.; Torres, A.; Santos, J.; Quevedo, O.; Basar, C. A machine learning-based method to identify bipolar disorder patients. Circuits Syst. Signal Process. 2022, 41, 2244–2265. [Google Scholar] [CrossRef]
- Sammut, C.; Webb, G.I. Encyclopedia of Machine Learning and Data Mining; Springer Publishing Company, Incorporated: Berlin/Heidelberg, Germany, 2017. [Google Scholar]
- Han, J.; Pei, J.; Tong, H. Data Mining: Concepts and Techniques; Morgan Kaufmann: Burlington, MA, USA, 2022. [Google Scholar]

| Other Etiologies (%) | NAFLD | ||
|---|---|---|---|
| N | 162 | 29 | |
| Sex | Female | 18 (11%) | 7 (24.2%) |
| Male | 144 (89%) | 22 (75.8%) | |
| Alcohol | None/low risk | 62 (38.27%) | None: 15 (51.7%) Low risk: 14 (48.3%) |
| Risk | 100 (61.73%) | 0 | |
| Smoker | Never | 53 (32.71%) | 19 (65.51%) |
| Active/ex-smoker | 109 (67.28%) | 10 (34.48%) | |
| Diabetes mellitus | No | 97 (59.87%) | 13 (44.82%) |
| Yes | 65 (40.12%) | 16 (55.17%) | |
| Obesity | BMI < 30 kg/m2 | 111 (68.51%) | 20 (68.96%) |
| ≥30 kg/m2 | 51 (34.48%) | 9 (31.03%) | |
| Dyslipidemia | No | 127 (78.39%) | 18 (62.06%) |
| Yes | 35 (21.6%) | 11 (37.93%) | |
| ECOG | 0 | 124 (76.54%) | 20 (68.96%) |
| 1 | 16 (9.8 7%) | 3 (10.34%) | |
| 2 | 14 (8.64%) | 3 (10.34%) | |
| 3 | 7 (4.32%) | 1 (3.44%) | |
| 4 | 1 (0.61%) | 2 (6.89%) | |
| Diagnostic method | Biopsy | 54 (33.33%) | 16 (55.17%) |
| Imaging test | 108 (66.66%) | 13 (44.87%) | |
| Surveillance | No | 76 (46.91%) | 25 (86.2%) |
| Yes | 86 (53.08%) | 4 (13.79%) | |
| Cirrhosis | No | 11 (6.79%) | 12 (41.37%) |
| Yes | 151 (93.2%) | 17 (58.62%) | |
| Etiology | Alcohol | 62 (38.27%) | 0 |
| HCV | 56 (34.56%) | 0 | |
| NAFLD | 0 | 29 (100%) | |
| Other etiologies | 42 (25.92%) | 0 | |
| CSPH | No | 54 (33.33%) | 17 (58.62%) |
| Yes | 108 (66.66%) | 12 (41.37%) | |
| Ascites | No | 101 (62.34%) | 19 (65.51%) |
| Yes | 61 (37.65%) | 10 (34.48%) | |
| Encephalopathy | No | 142 (87.65%) | 27 (93.1%) |
| Yes | 20 (12.34%) | 2 (6.89%) | |
| Portal thrombosis | No | 130 (80.24%) | 23 (79.31%) |
| Yes | 30 (19.75%) | 6 (20.69%) | |
| Metastasis | No | 146 (90.12%) | 21 (72.41%) |
| Yes | 15 (9.87%) | 8 (27.89%) | |
| Lymphadenopathy | No | 140 (86.41%) | 22 (75.86%) |
| Yes | 21 (13.58%) | 7 (24.13%) | |
| Milan criteria | No | 100 (61.73%) | 20 (69%) |
| Yes | 62 (38.27%) | 9 (31%) | |
| BCLC | 0 | 9 (5.56%) | 1 (3.45%) |
| A | 60 (37.03%) | 11 (37.93%) | |
| B | 27 (16.67%) | 2 (6.9%) | |
| C | 48 (29.63%) | 10 (34.48%) | |
| D | 18 (11.11%) | 5 (17.24%) | |
| Mean Value ± Standard Deviation | ||
|---|---|---|
| Survival (months) | Other etiologies | 12.4 ± 23.9 |
| NAFLD | 9.65 ± 22.64 | |
| MELD | Other etiologies | 11 |
| NAFLD | 9 | |
| Albumin (g/dL) | Other etiologies | 3.70 ± 0.67 |
| NAFLD | 3.58 ± 0.75 | |
| INR | Other etiologies | 1.27 ± 0.58 |
| NAFLD | 1.20 ± 0.40 | |
| Na (mEq/L) | Other etiologies | 138.61 ± 3.42 |
| NAFLD | 139.14 ± 3.49 | |
| Lymphocytes (cells/mm3) | Other etiologies | 1436.69 ± 762.29 |
| NAFLD | 1638.21 ± 825.72 | |
| Neutrophils (cells/mm3) | Other etiologies | 3772.69 ± 1999.79 |
| NAFLD | 4663.93 ± 2233.46 | |
| Platelets (103/dL) | Other etiologies | 140.13 ± 81.60 |
| NAFLD | 178.80 ± 99.15 | |
| Creatinine (mg/dL) | Other etiologies | 1.02 ± 0.65 |
| NAFLD | 0.95 ± 0.22 | |
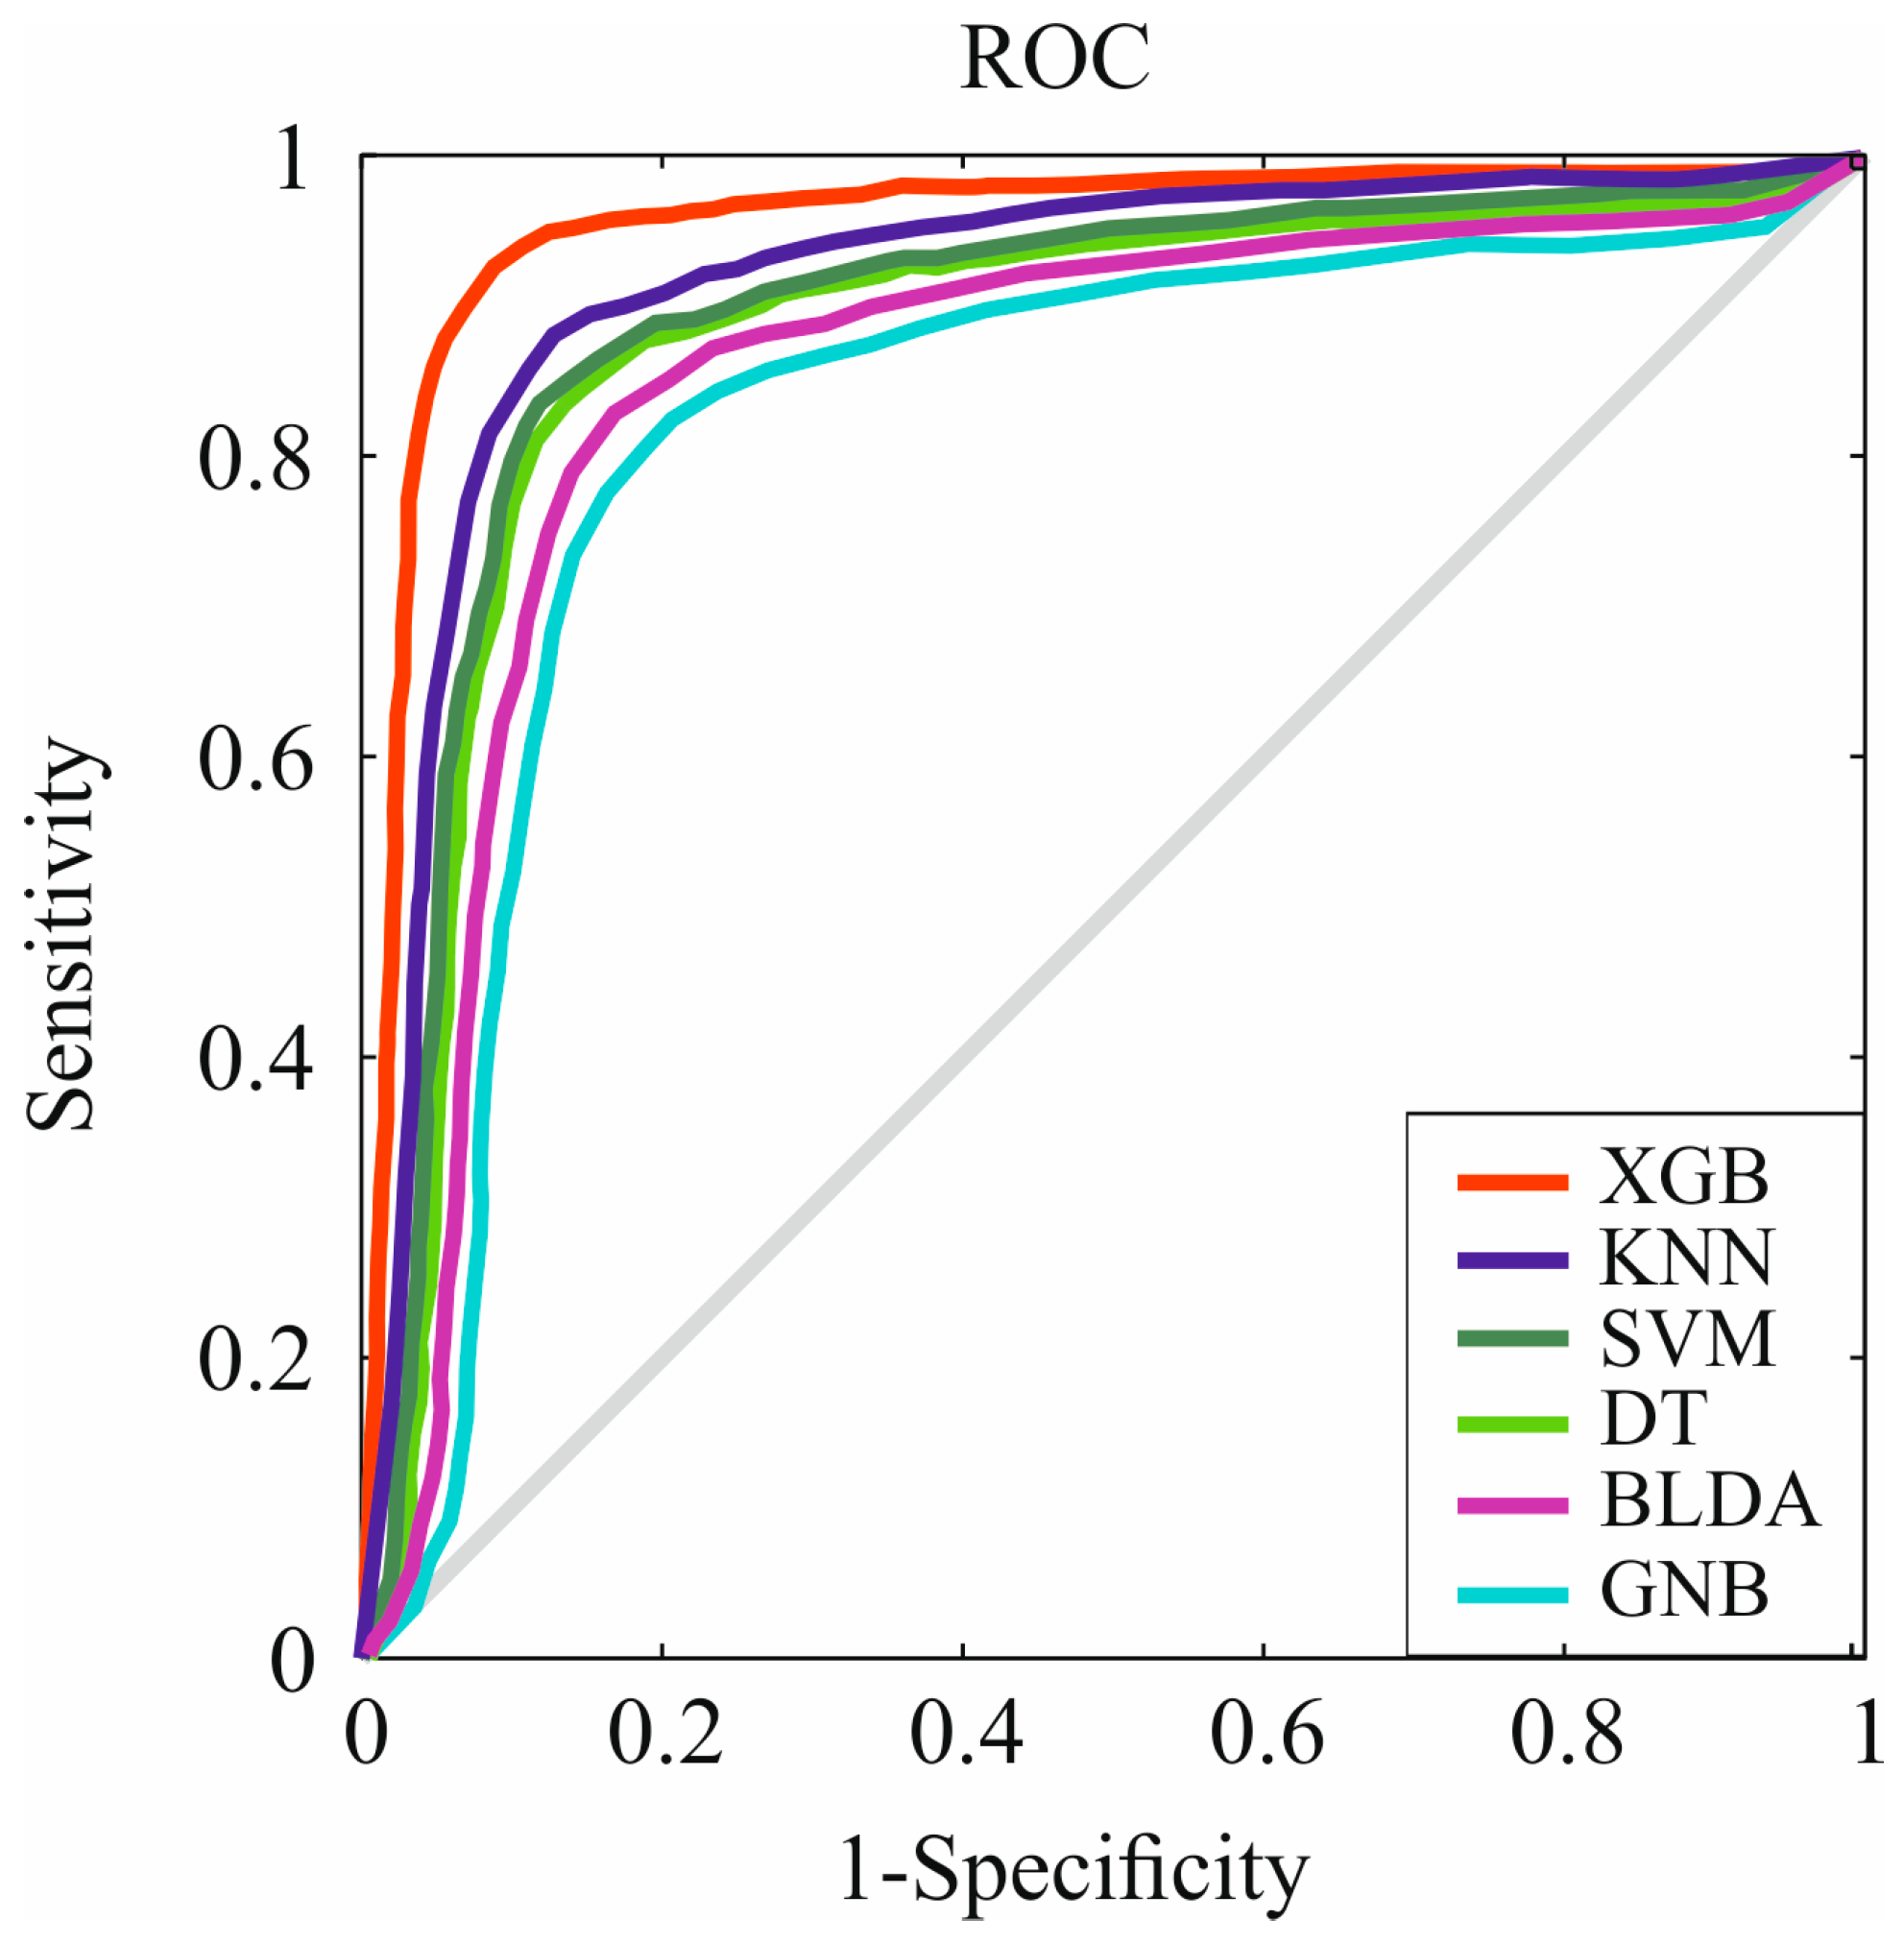
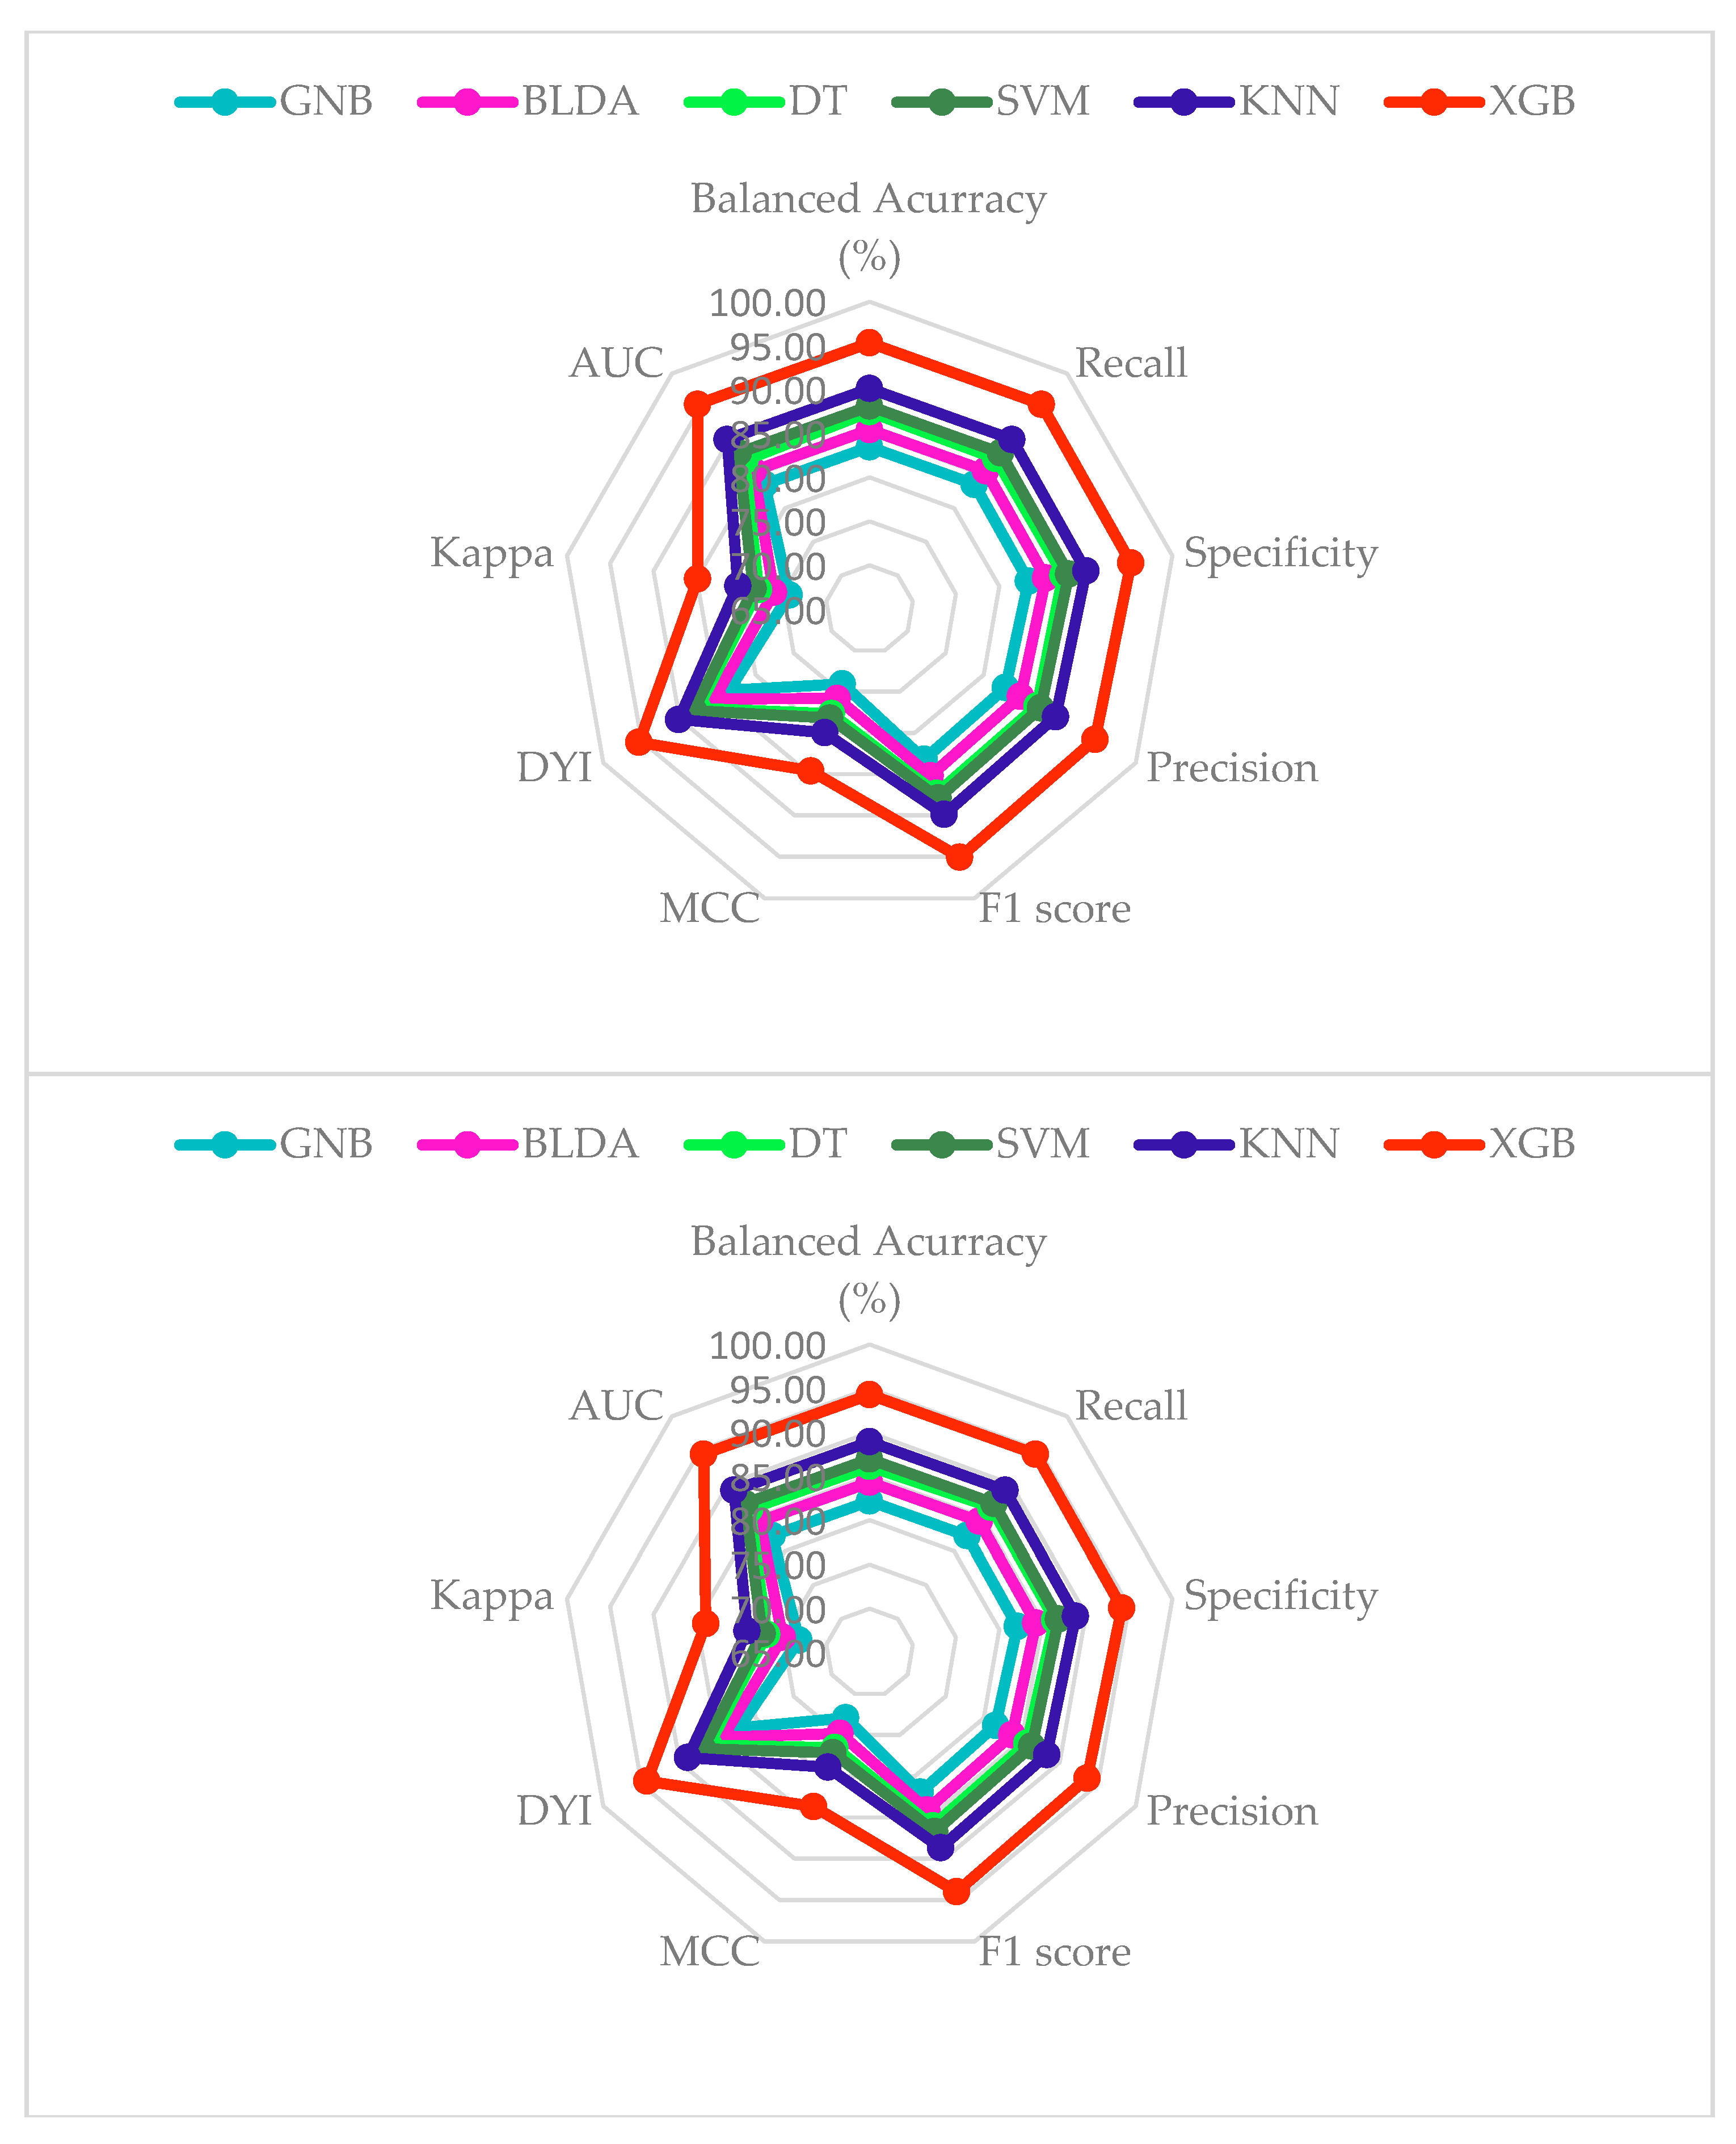
| Methods | Accuracy | Recall | Specificity | Precision | AUC |
|---|---|---|---|---|---|
| SVM | 86.96 | 87.06 | 86.85 | 86.34 | 0.87 |
| BLDA | 84.32 | 84.42 | 84.23 | 83.72 | 0.84 |
| DT | 86.11 | 86.51 | 86.41 | 85.69 | 0.86 |
| GNB | 82.18 | 82.27 | 82.08 | 81.59 | 0.82 |
| KNN | 88.93 | 89.03 | 88.82 | 88.29 | 0.89 |
| XGB | 94.29 | 94.40 | 94.18 | 93.61 | 0.94 |
| Methods | MCC | DYI | F1 Score | Kappa |
|---|---|---|---|---|
| SVM | 77.16 | 86.96 | 86.70 | 77.41 |
| BLDA | 74.82 | 84.32 | 84.07 | 75.07 |
| DT | 76.54 | 86.11 | 86.02 | 76.89 |
| GNB | 72.92 | 82.18 | 81.93 | 73.16 |
| KNN | 78.91 | 88.93 | 88.66 | 79.17 |
| XGB | 83.66 | 94.29 | 94.00 | 83.94 |
Disclaimer/Publisher’s Note: The statements, opinions and data contained in all publications are solely those of the individual author(s) and contributor(s) and not of MDPI and/or the editor(s). MDPI and/or the editor(s) disclaim responsibility for any injury to people or property resulting from any ideas, methods, instructions or products referred to in the content. |
© 2024 by the authors. Licensee MDPI, Basel, Switzerland. This article is an open access article distributed under the terms and conditions of the Creative Commons Attribution (CC BY) license (https://creativecommons.org/licenses/by/4.0/).
Share and Cite
Suárez, M.; Gil-Rojas, S.; Martínez-Blanco, P.; Torres, A.M.; Ramón, A.; Blasco-Segura, P.; Torralba, M.; Mateo, J. Machine Learning-Based Assessment of Survival and Risk Factors in Non-Alcoholic Fatty Liver Disease-Related Hepatocellular Carcinoma for Optimized Patient Management. Cancers 2024, 16, 1114. https://doi.org/10.3390/cancers16061114
Suárez M, Gil-Rojas S, Martínez-Blanco P, Torres AM, Ramón A, Blasco-Segura P, Torralba M, Mateo J. Machine Learning-Based Assessment of Survival and Risk Factors in Non-Alcoholic Fatty Liver Disease-Related Hepatocellular Carcinoma for Optimized Patient Management. Cancers. 2024; 16(6):1114. https://doi.org/10.3390/cancers16061114
Chicago/Turabian StyleSuárez, Miguel, Sergio Gil-Rojas, Pablo Martínez-Blanco, Ana M. Torres, Antonio Ramón, Pilar Blasco-Segura, Miguel Torralba, and Jorge Mateo. 2024. "Machine Learning-Based Assessment of Survival and Risk Factors in Non-Alcoholic Fatty Liver Disease-Related Hepatocellular Carcinoma for Optimized Patient Management" Cancers 16, no. 6: 1114. https://doi.org/10.3390/cancers16061114
APA StyleSuárez, M., Gil-Rojas, S., Martínez-Blanco, P., Torres, A. M., Ramón, A., Blasco-Segura, P., Torralba, M., & Mateo, J. (2024). Machine Learning-Based Assessment of Survival and Risk Factors in Non-Alcoholic Fatty Liver Disease-Related Hepatocellular Carcinoma for Optimized Patient Management. Cancers, 16(6), 1114. https://doi.org/10.3390/cancers16061114