
Predicting Immunotherapy Outcomes in Glioblastoma Patients through Machine Learning


Abstract
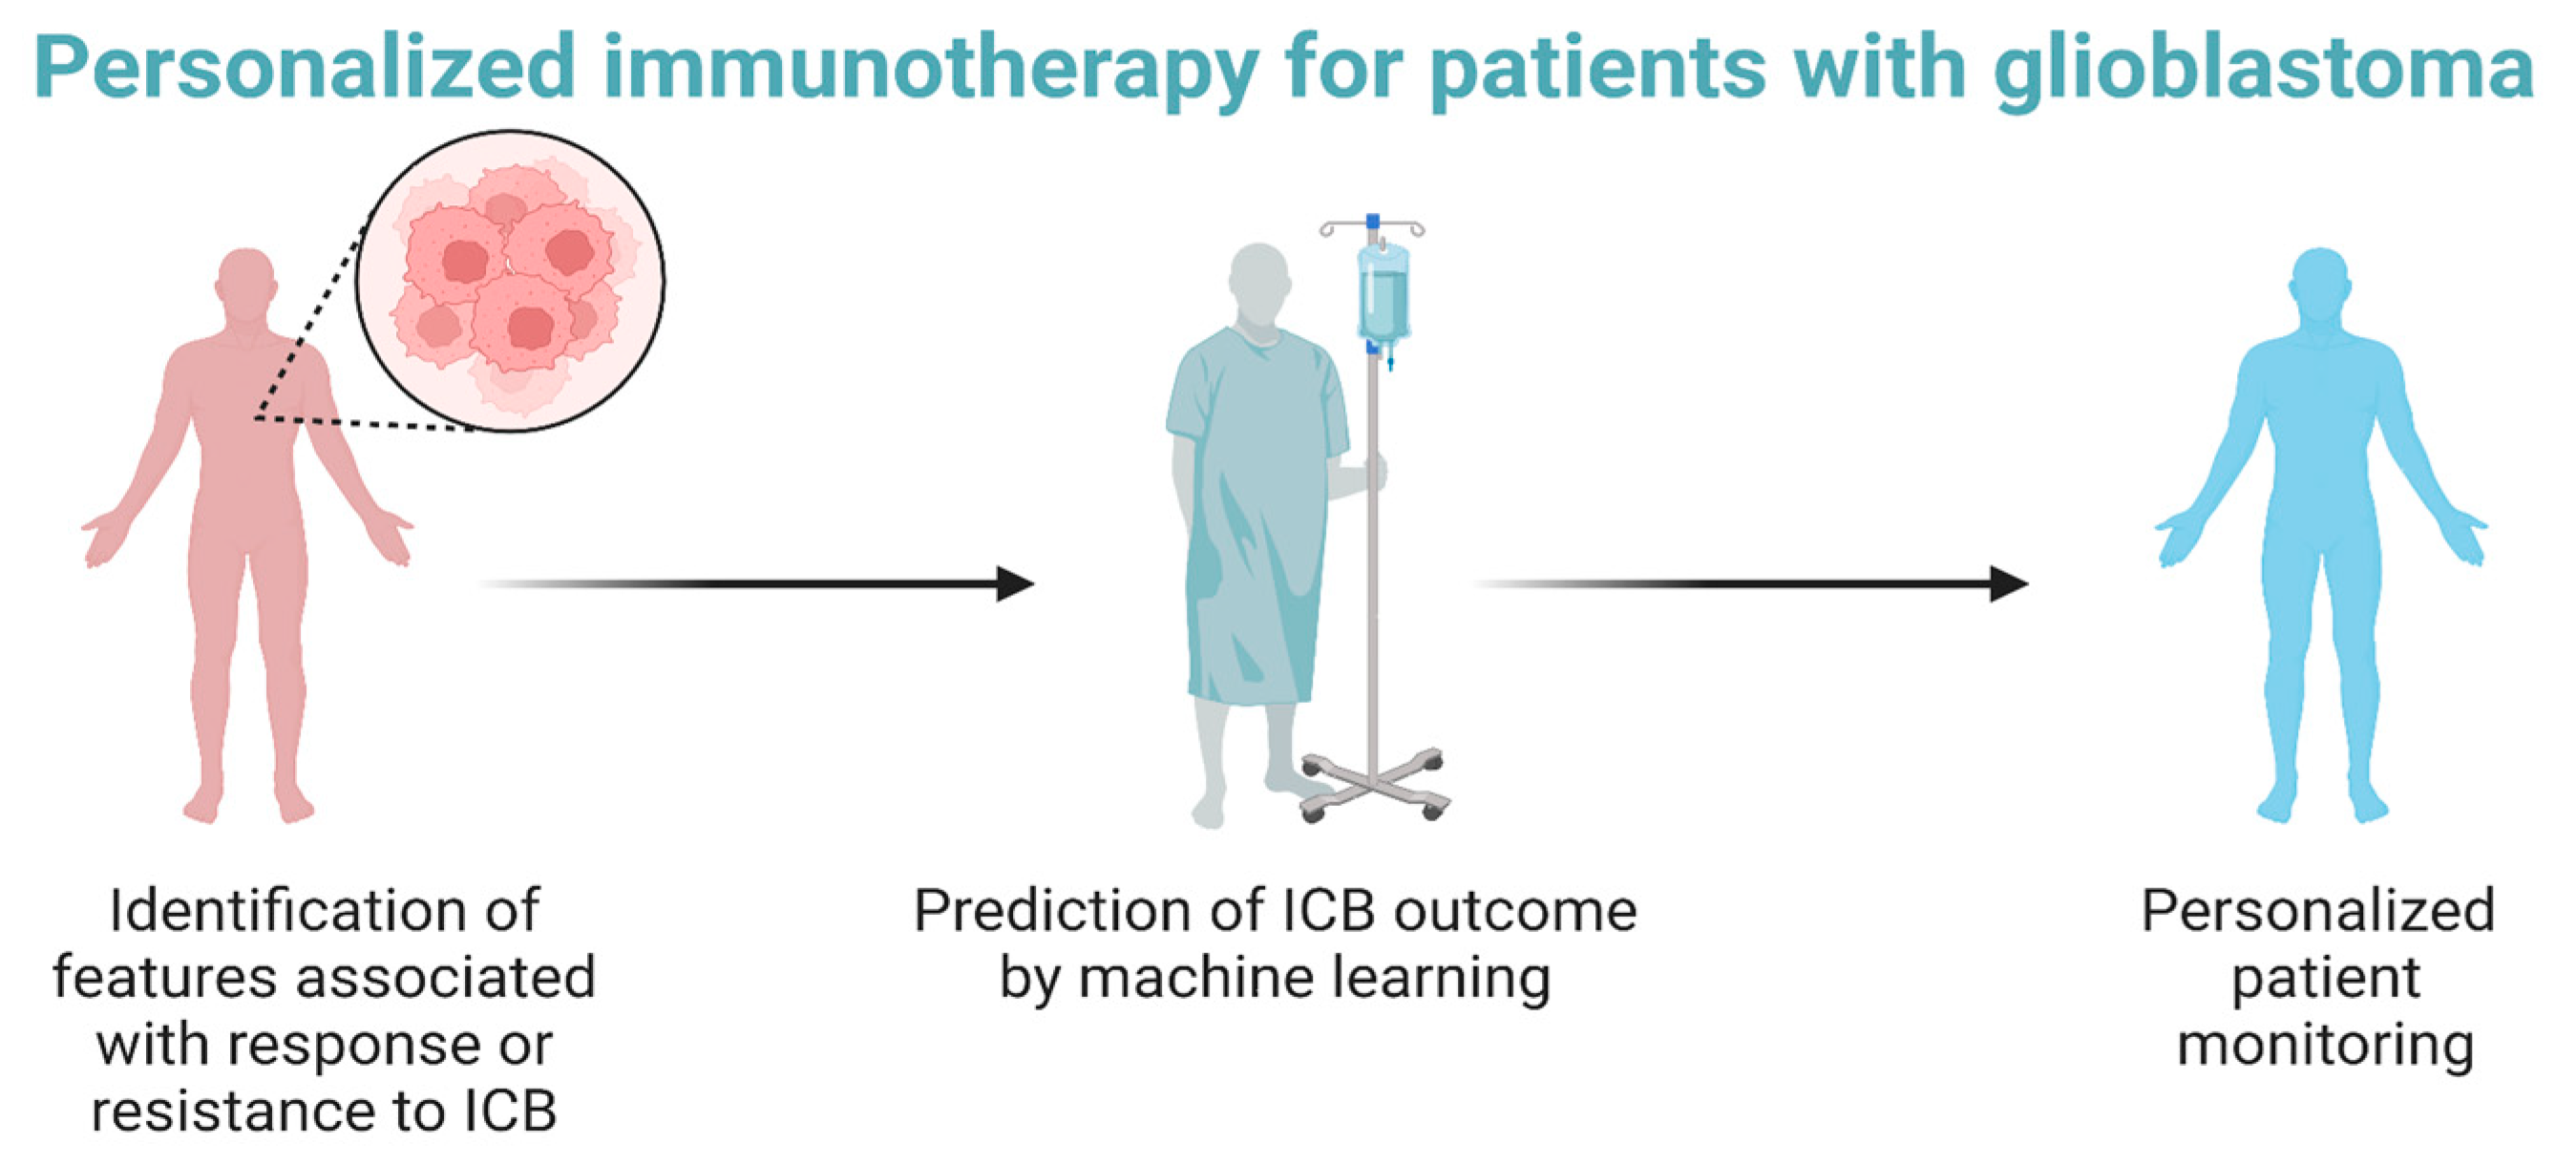
Simple Summary
Abstract
1. Introduction
2. Material and Methods
2.1. RNAseq Datasets and Selection of Cohorts
2.2. Immune Landscape of Cancer in iAtlas
2.3. Statistics
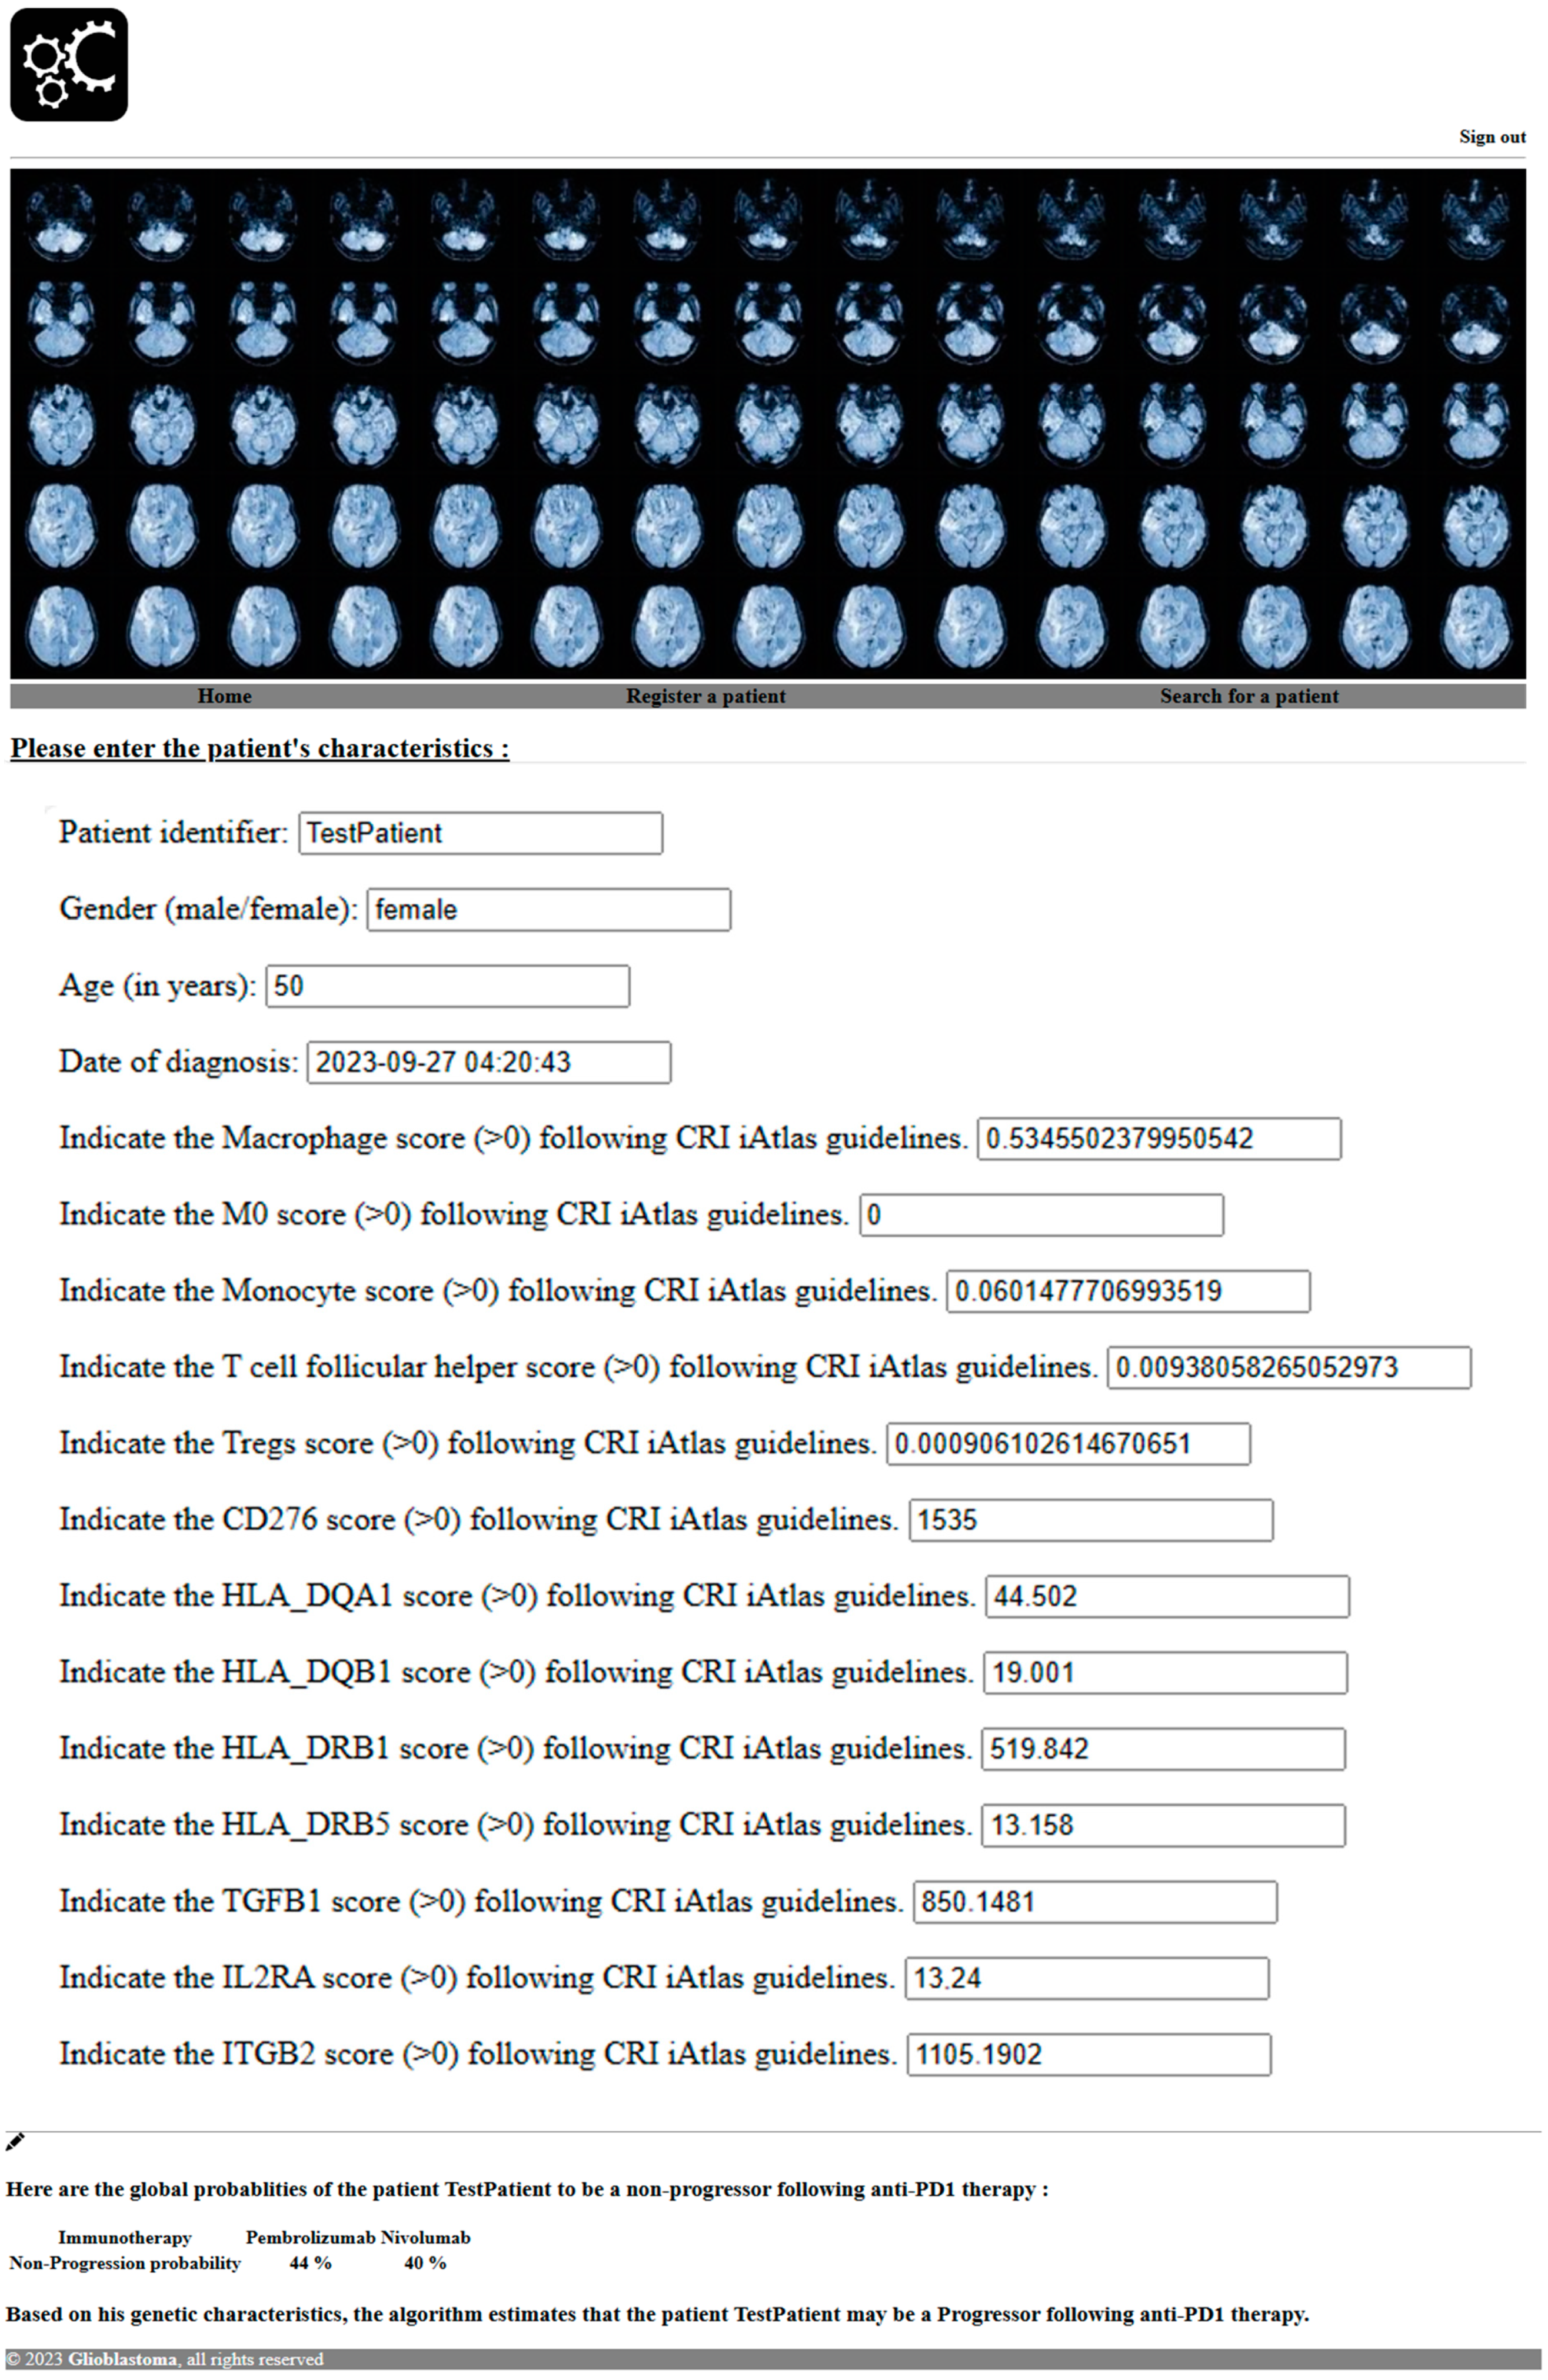
2.4. Software Development to Predict Response to PD1 Blockade
- Bootstrapped Sampling (Bagging): The algorithm begins by creating multiple subsets of the original dataset through a process called bootstrapped sampling. Each subset is essentially a random sample with a replacement from the original dataset. These subsets serve as the training data for individual decision trees.
- Decision Tree Construction: A decision tree is built using each of these bootstrapped datasets. At each node of the tree, the algorithm selects a random subset of features to consider for making a split. This randomness helps the algorithm to diversify the trees in the forest.
- Voting (Classification) or Averaging (Regression): Once all the decision trees are constructed, they “vote” on the class label in the case of classification problems or provide a numerical prediction in the case of regression problems. For classification, the class with the most votes becomes the predicted class. For regression, the average of all the predictions is taken.
- Ensemble Output: The final output of the RandomForestClassifier is determined by aggregating the individual outputs from all the decision trees. This process helps us to reduce overfitting and increase the model’s generalization ability.
- Diversity: The strength of a random forest lies in the diversity of its constituent decision trees. By introducing randomness in the feature selection and dataset creation, each tree becomes unique, contributing different perspectives to the overall prediction.
- Robustness: Random forests are robust to outliers and noise in the data. The ensemble nature of the model helps it to mitigate the impact of individual decision trees making incorrect predictions.
- Reduced Overfitting: The combination of multiple trees helps us to overcome overfitting, a common issue with individual decision trees. The ensemble approach tends to yield more stable and reliable predictions.
- Feature Importance: RandomForestClassifiers can provide information about feature importance, indicating which features are more influential in making predictions. This can be valuable for understanding the underlying dynamics of the dataset.
3. Results
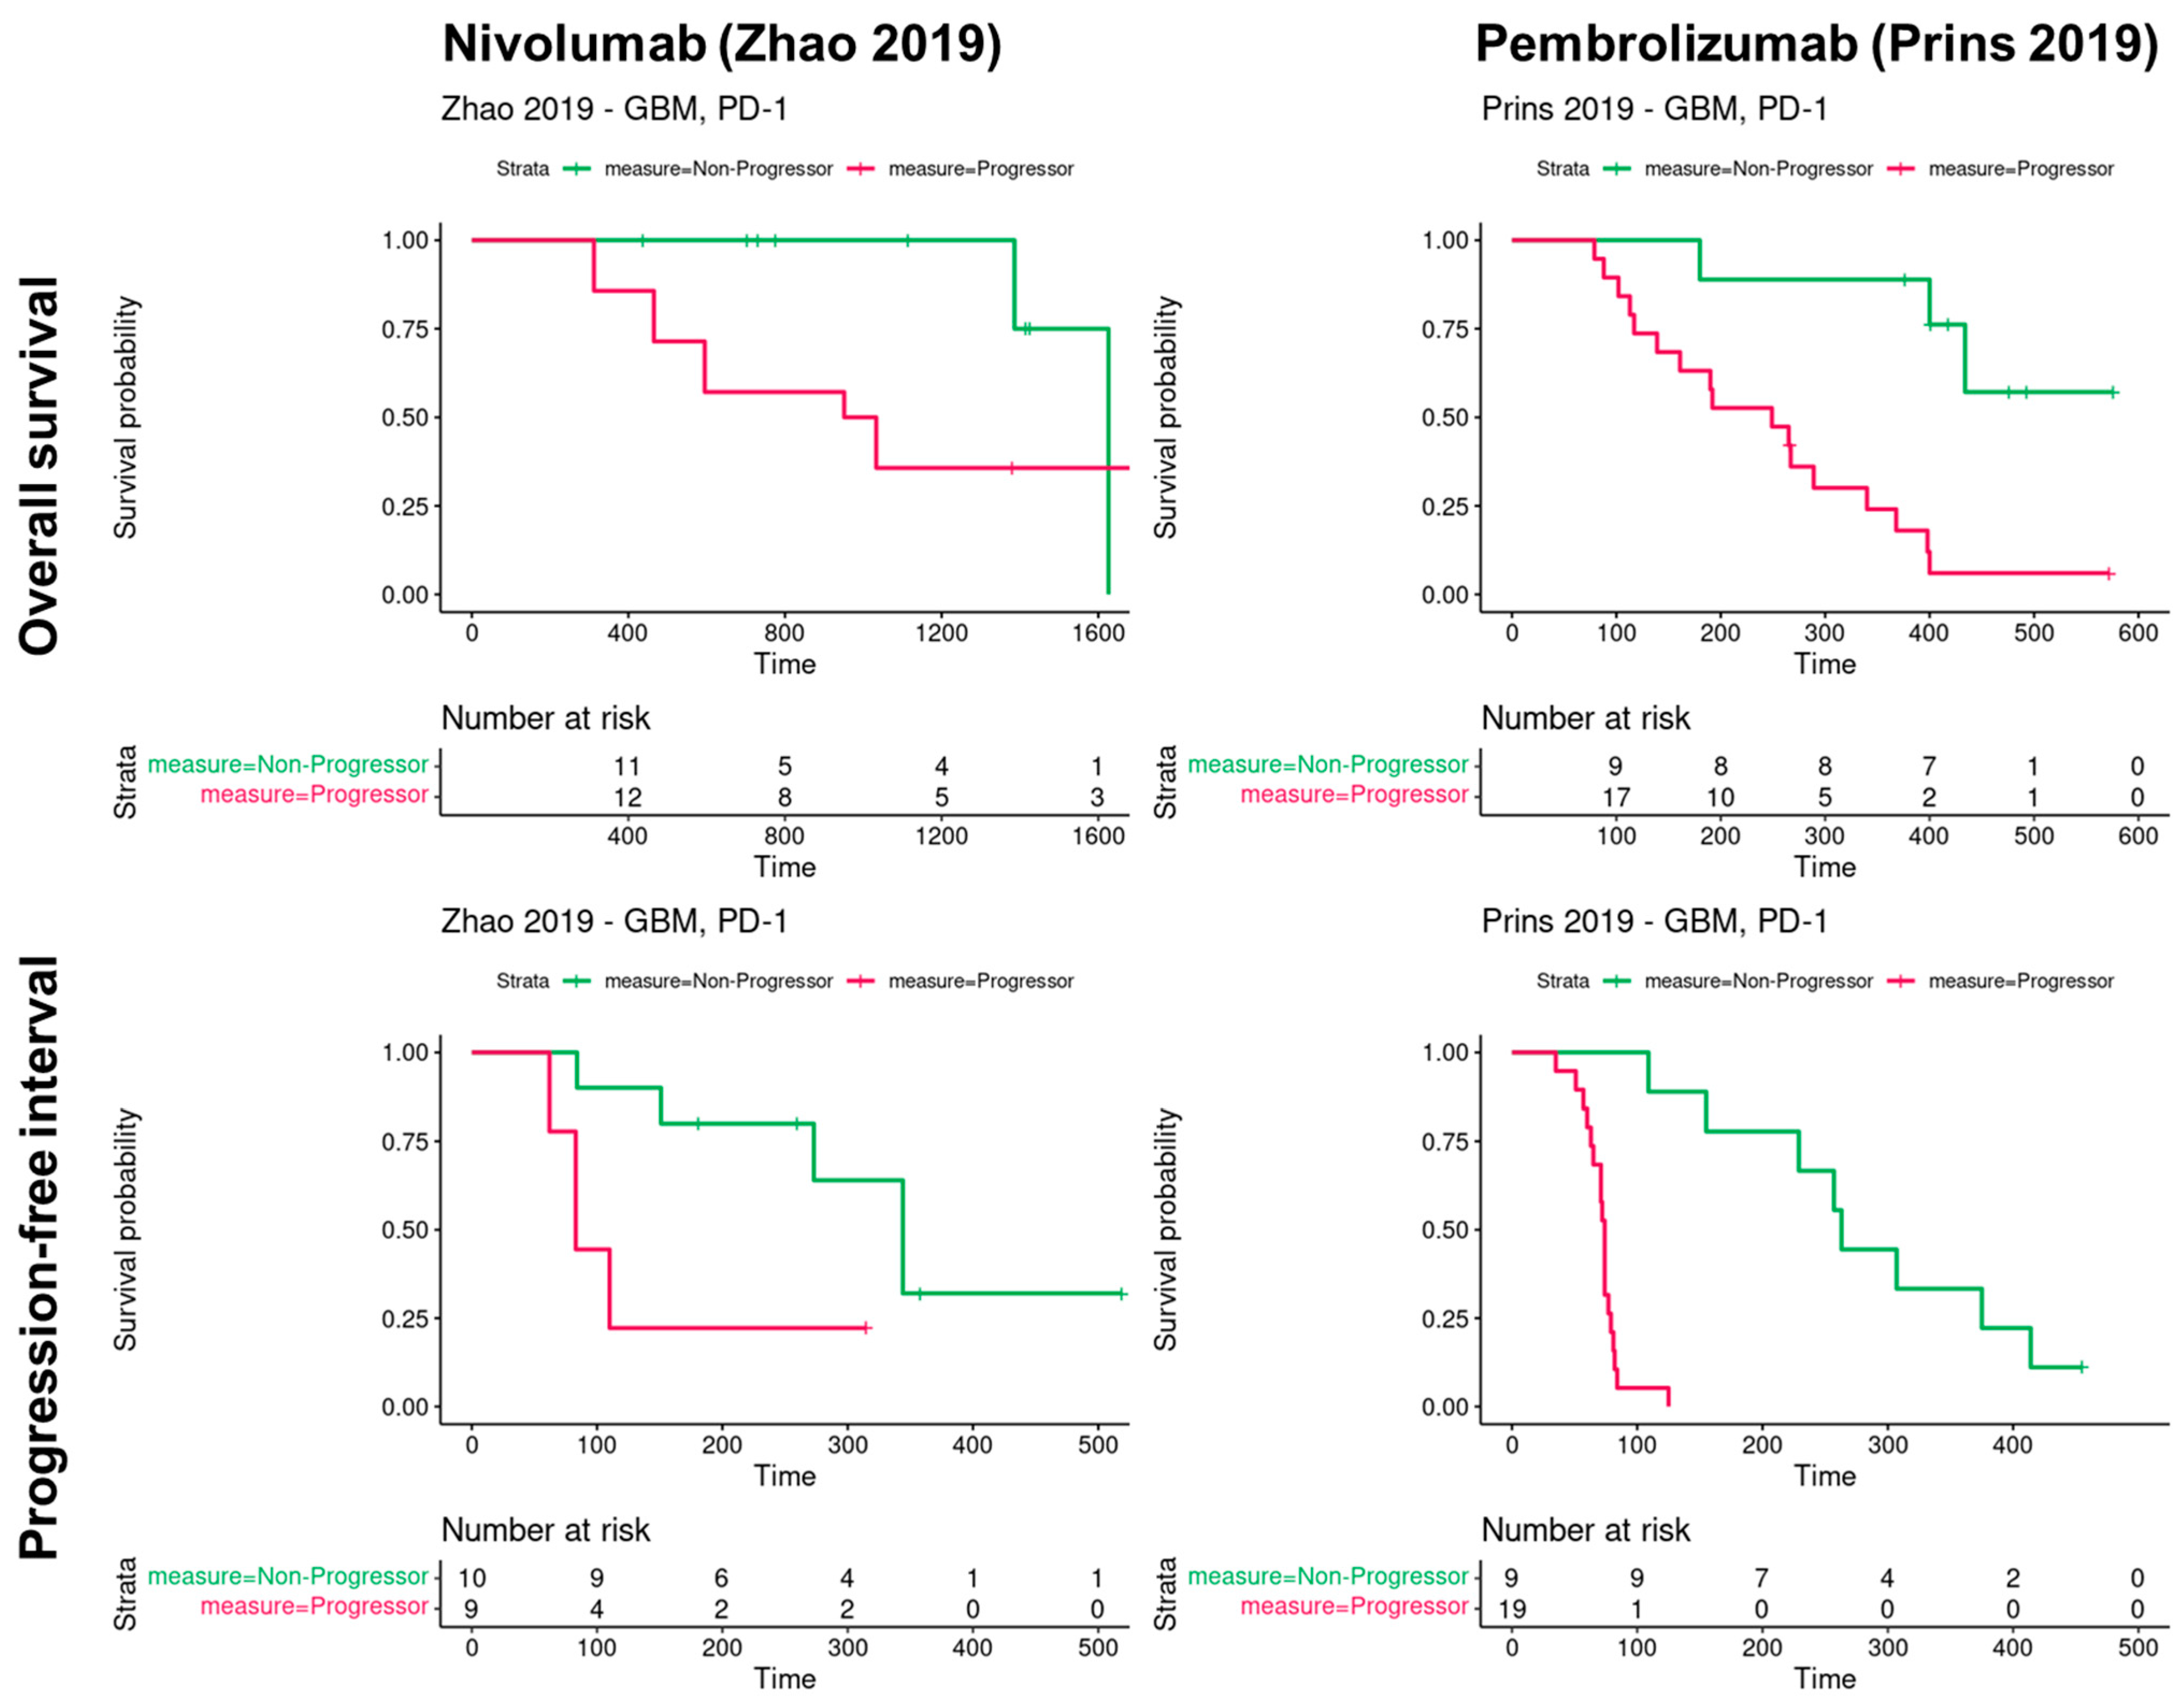
3.1. Progression and Overall Survival of Glioblastoma Patients According to PD1 Blockade in Two Cohorts
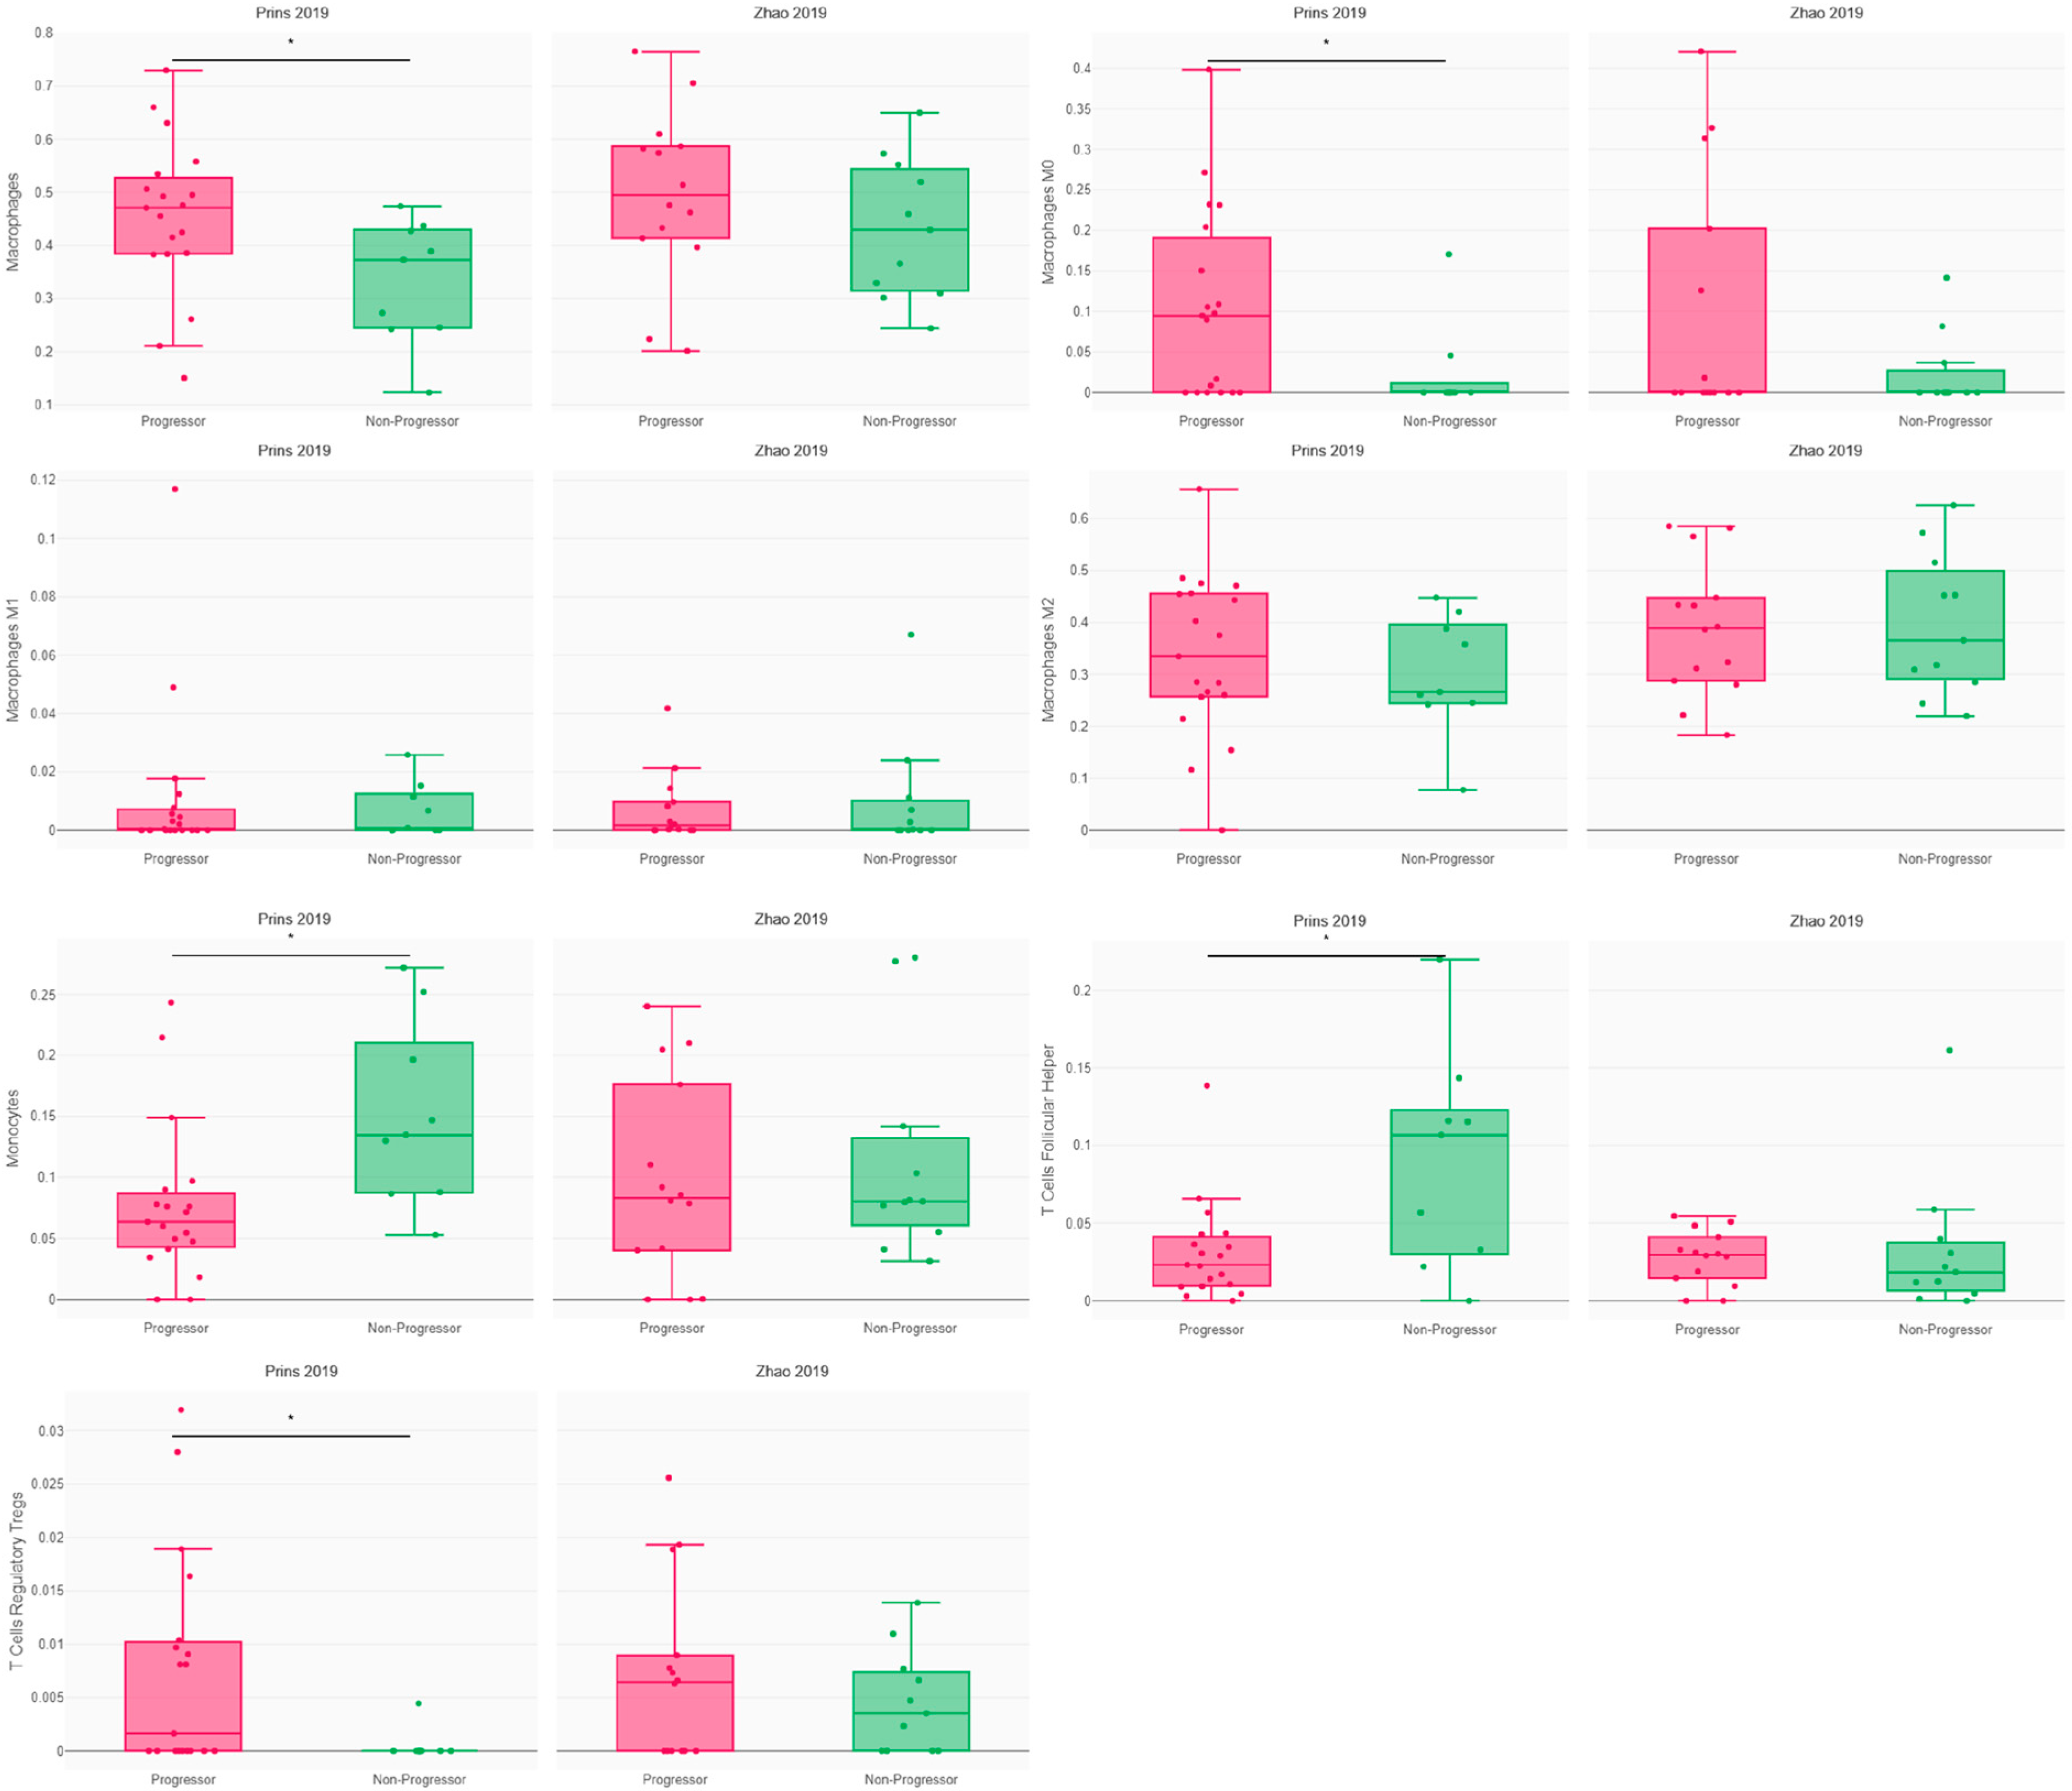
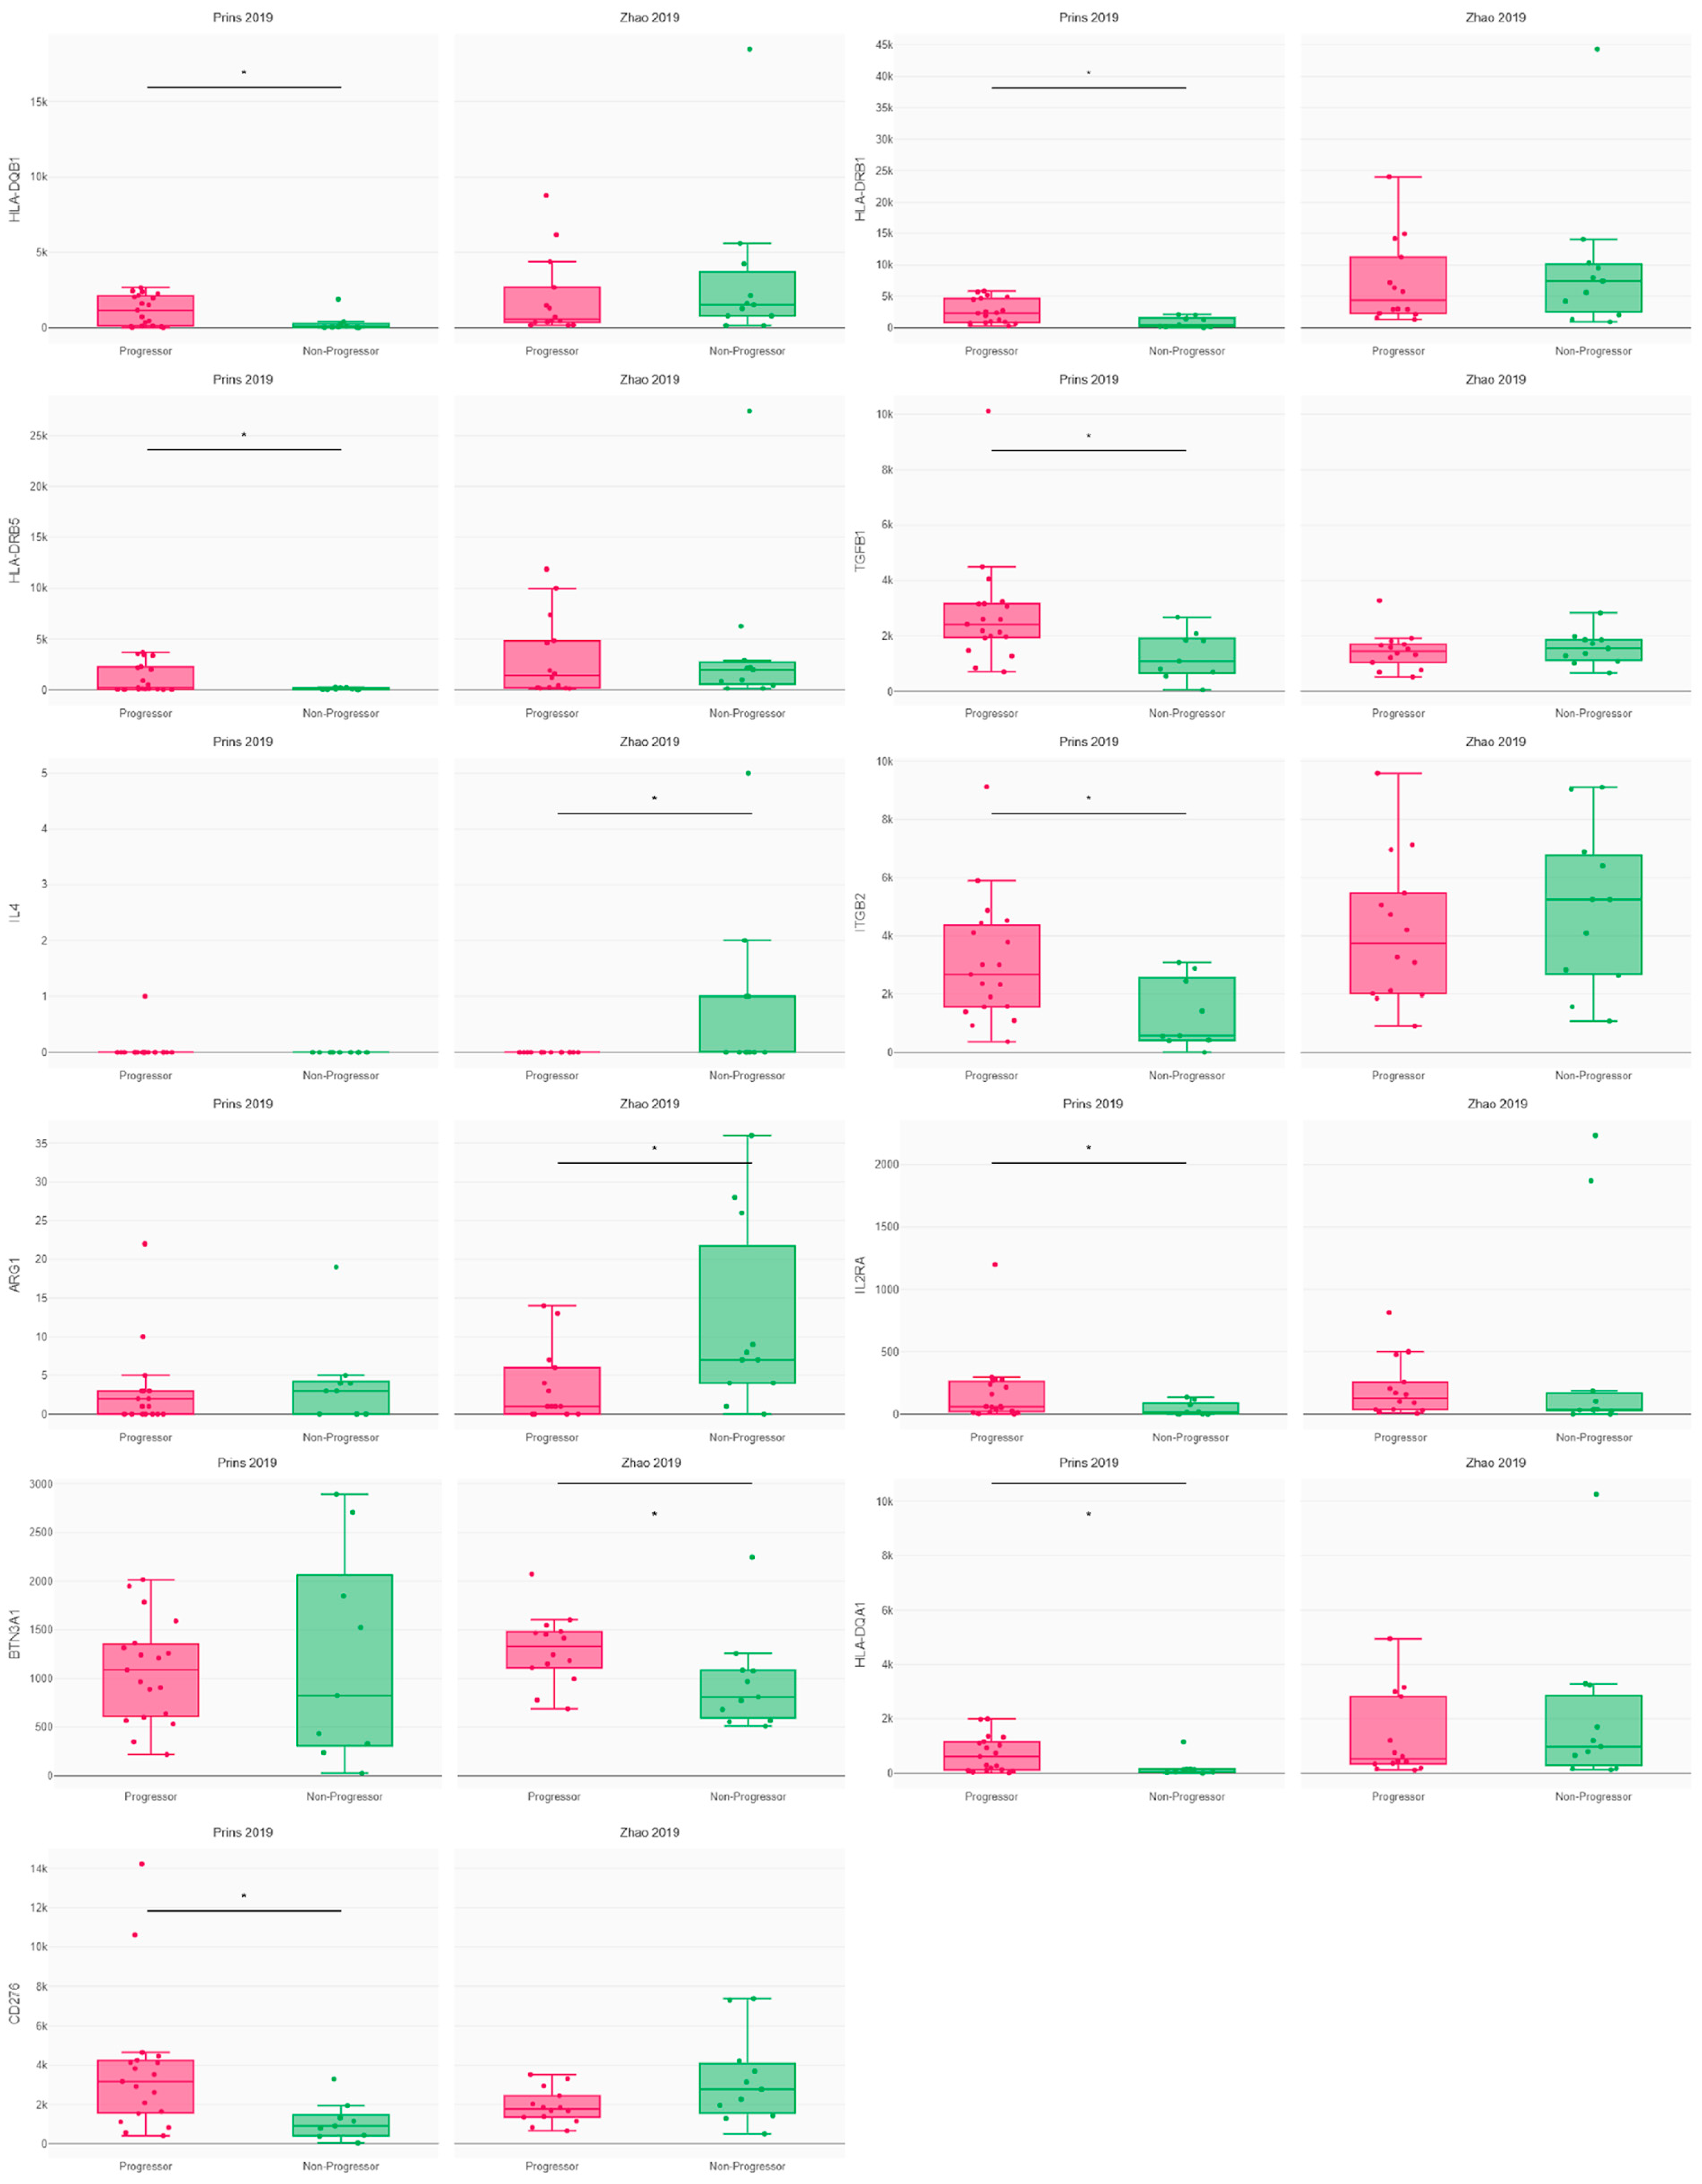
3.2. Immune Response and Resistance in Glioblastoma Patients following PD1 Blockade
3.3. Software Prediction of Glioblastoma Patients’ Response to PD1 Blockade
4. Discussion
5. Conclusions
Supplementary Materials
Funding
Institutional Review Board Statement
Informed Consent Statement
Data Availability Statement
Acknowledgments
Conflicts of Interest
References
- Tamimi, A.F.; Juweid, M. Epidemiology and Outcome of Glioblastoma. In Glioblastoma; De Vleeschouwer, S., Ed.; Codon Publications: Brisbane, Australia, 2017. Available online: http://www.ncbi.nlm.nih.gov/books/NBK470003/ (accessed on 5 October 2023).
- Cloughesy, T.F.; Mochizuki, A.Y.; Orpilla, J.R.; Hugo, W.; Lee, A.H.; Davidson, T.B.; Wang, A.C.; Ellingson, B.M.; Rytlewski, J.A.; Sanders, C.M.; et al. Neoadjuvant anti-PD-1 immunotherapy promotes a survival benefit with intratumoral and systemic immune responses in recurrent glioblastoma. Nat. Med. 2019, 25, 477–486. [Google Scholar] [CrossRef] [PubMed]
- Stupp, R.; Mason, W.P.; van den Bent, M.J.; Weller, M.; Fisher, B.; Taphoorn, M.J.B.; Belanger, K.; Brandes, A.A.; Marosi, C.; Bogdahn, U.; et al. Radiotherapy plus concomitant and adjuvant temozolomide for glioblastoma. N. Engl. J. Med. 2005, 352, 987–996. [Google Scholar] [CrossRef] [PubMed]
- Yang, T.; Kong, Z.; Ma, W. PD-1/PD-L1 immune checkpoint inhibitors in glioblastoma: Clinical studies, challenges and potential. Hum. Vaccines Immunother. 2020, 17, 546–553. [Google Scholar] [CrossRef]
- Zhao, J.; Chen, A.X.; Gartrell, R.D.; Silverman, A.M.; Aparicio, L.; Chu, T.; Bordbar, D.; Shan, D.; Samanamud, J.; Mahajan, A.; et al. Immune and genomic correlates of response to anti-PD-1 immunotherapy in glioblastoma. Nat. Med. 2019, 25, 462–469. [Google Scholar] [CrossRef] [PubMed]
- Mestrallet, G.; Brown, M.; Bozkus, C.C.; Bhardwaj, N. Immune escape and resistance to immunotherapy in mismatch repair deficient tumors. Front. Immunol. 2023, 14, 1210164. [Google Scholar] [CrossRef] [PubMed]
- Blumenthal, D.T.; Yalon, M.; Vainer, G.W.; Lossos, A.; Yust, S.; Tzach, L.; Cagnano, E.; Limon, D.; Bokstein, F. Pembrolizumab: First experience with recurrent primary central nervous system (CNS) tumors. J. Neurooncol. 2016, 129, 453–460. [Google Scholar] [CrossRef]
- Bouffet, E.; Larouche, V.; Campbell, B.B.; Merico, D.; de Borja, R.; Aronson, M.; Durno, C.; Krueger, J.; Cabric, V.; Ramaswamy, V.; et al. Immune Checkpoint Inhibition for Hypermutant Glioblastoma Multiforme Resulting From Germline Biallelic Mismatch Repair Deficiency. J. Clin. Oncol. 2016, 34, 2206–2211. [Google Scholar] [CrossRef]
- Reardon, D.A.; Omuro, A.; Brandes, A.A.; Rieger, J.; Wick, A.; Sepulveda, J.; Phuphanich, S.; de Souza, P.; Ahluwalia, M.S.; Lim, M.; et al. OS10.3 Randomized Phase 3 Study Evaluating the Efficacy and Safety of Nivolumab vs Bevacizumab in Patients with Recurrent Glioblastoma: CheckMate 143. Neuro-Oncology 2017, 19, iii21. [Google Scholar] [CrossRef]
- Johanns, T.M.; Miller, C.A.; Dorward, I.G.; Tsien, C.; Chang, E.; Perry, A.; Uppaluri, R.; Ferguson, C.; Schmidt, R.E.; Dahiya, S.; et al. Immunogenomics of Hypermutated Glioblastoma: A Patient with Germline POLE Deficiency Treated with Checkpoint Blockade Immunotherapy. Cancer Discov. 2016, 6, 1230–1236. [Google Scholar] [CrossRef]
- Sung, J.-Y.; Cheong, J.-H. Machine Learning Predictor of Immune Checkpoint Blockade Response in Gastric Cancer. Cancers 2022, 14, 3191. [Google Scholar] [CrossRef]
- Tonneau, M.; Phan, K.; Manem, V.S.K.; Low-Kam, C.; Dutil, F.; Kazandjian, S.; Vanderweyen, D.; Panasci, J.; Malo, J.; Coulombe, F.; et al. Generalization optimizing machine learning to improve CT scan radiomics and assess immune checkpoint inhibitors’ response in non-small cell lung cancer: A multicenter cohort study. Front. Oncol. 2023, 13, 1196414. [Google Scholar] [PubMed]
- Wiesweg, M.; Mairinger, F.; Reis, H.; Goetz, M.; Walter, R.F.H.; Hager, T.; Metzenmacher, M.; Eberhardt, W.E.E.; McCutcheon, A.; Köster, J.; et al. Machine learning-based predictors for immune checkpoint inhibitor therapy of non-small-cell lung cancer. Ann. Oncol. 2019, 30, 655–657. [Google Scholar] [CrossRef] [PubMed]
- Eddy, J.A.; Thorsson, V.; Lamb, A.E.; Gibbs, D.L.; Heimann, C.; Yu, J.X.; Chung, V.; Chae, Y.; Dang, K.; Vincent, B.G.; et al. CRI iAtlas: An interactive portal for immuno-oncology research. F1000Research 2020, 9, 1028. [Google Scholar] [CrossRef] [PubMed]
- Thorsson, V.; Gibbs, D.L.; Brown, S.D.; Wolf, D.; Bortone, D.S.; Yang, T.-H.O.; Porta-Pardo, E.; Gao, G.; Plaisier, C.L.; Eddy, J.A.; et al. The Immune Landscape of Cancer. Immunity 2018, 48, 812–830. [Google Scholar] [CrossRef]
- Mestrallet, G. Software development for severe burn diagnosis and autologous skin substitute production. Comput. Methods Programs Biomed. Update 2022, 2, 100069. [Google Scholar] [CrossRef]
- Mestrallet, G. Software development to estimate herd profitability according to nutrition parameters. agriRxiv 2023, 2023, 20230009899. [Google Scholar] [CrossRef]
- Breiman, L. Random Forests. Mach. Learn. 2001, 45, 5–32. [Google Scholar] [CrossRef]
- Liaw, A.; Wiener, M. Classification and Regression by randomForest. R News 2002, 2, 18–22. [Google Scholar]
- Cutler, D.R.; Edwards, T.C., Jr.; Beard, K.H.; Cutler, A.; Hess, K.T.; Gibson, J.; Lawler, J.J. Random Forests for Classification in Ecology. Ecology 2007, 88, 2783–2792. [Google Scholar] [CrossRef]
- Prasad, A.M.; Iverson, L.R.; Liaw, A. Newer Classification and Regression Tree Techniques: Bagging and Random Forests for Ecological Prediction. Ecosystems 2006, 9, 181–199. [Google Scholar] [CrossRef]
- Pal, M.; Mather, P.M. An assessment of the effectiveness of decision tree methods for land cover classification. Remote Sens. Environ. 2003, 86, 554–565. [Google Scholar] [CrossRef]
- Rodriguez-Galiano, V.F.; Ghimire, B.; Rogan, J.; Chica-Olmo, M.; Rigol-Sanchez, J.P. An assessment of the effectiveness of a random forest classifier for land-cover classification. ISPRS J. Photogramm. Remote Sens. 2012, 67, 93–104. [Google Scholar] [CrossRef]
- Ghazwani, M.; Begum, M.Y. Computational intelligence modeling of hyoscine drug solubility and solvent density in supercritical processing: Gradient boosting, extra trees, and random forest models. Sci. Rep. 2023, 13, 10046. [Google Scholar] [CrossRef]
- Šikić, M.; Tomić, S.; Vlahoviček, K. Prediction of Protein–Protein Interaction Sites in Sequences and 3D Structures by Random Forests. PLoS Comput. Biol. 2009, 5, e1000278. [Google Scholar] [CrossRef]
- Chen, C.; Hu, B.; Li, Y. Easy-to-use spatial random-forest-based downscaling-calibration method for producing precipitation data with high resolution and high accuracy. Hydrol. Earth Syst. Sci. 2021, 25, 5667–5682. [Google Scholar] [CrossRef]
- Liu, S.; Liang, J.; Liu, Z.; Zhang, C.; Wang, Y.; Watson, A.H.; Zhou, C.; Zhang, F.; Wu, K.; Zhang, F.; et al. The Role of CD276 in Cancers. Front. Oncol. 2021, 11, 654684. [Google Scholar] [CrossRef]
- Digregorio, M.; Coppieters, N.; Lombard, A.; Lumapat, P.N.; Scholtes, F.; Rogisteret, B. The expression of B7-H3 isoforms in newly diagnosed glioblastoma and recurrence and their functional role. Acta Neuropathol. Commun. 2021, 9, 59. [Google Scholar] [CrossRef]
- Fan, L.; Wang, X.; Chang, Q.; Wang, Y.; Yang, W.; Liu, L. IL2RA is a prognostic indicator and correlated with immune characteristics of pancreatic ductal adenocarcinoma. Medicine 2022, 101, e30966. [Google Scholar] [CrossRef]
- de Streel, G.; Lucas, S. Targeting immunosuppression by TGF-β1 for cancer immunotherapy. Biochem. Pharmacol. 2021, 192, 114697. [Google Scholar] [CrossRef]
- Payne, K.K.; Mine, J.A.; Biswas, S.; Chaurio, R.A.; Perales-Puchalt, A.; Anadon, C.M.; Costich, T.L.; Harro, C.M.; Walrath, J.; Ming, Q.; et al. BTN3A1 governs antitumor responses by coordinating αβ and γδ T cells. Science 2020, 369, 942–949. [Google Scholar] [CrossRef]
- Bian, S.; Ni, W.; Zhu, M.; Zhang, X.; Qiang, Y.; Zhang, J.; Ni, Z.; Shen, Y.; Qiu, S.; Song, Q.; et al. Flap endonuclease 1 Facilitated Hepatocellular Carcinoma Progression by Enhancing USP7/MDM2-mediated P53 Inactivation. Int. J. Biol. Sci. 2022, 18, 1022–1038. [Google Scholar] [CrossRef] [PubMed]
- Triozzi, P.L.; Stirling, E.R.; Song, Q.; Westwood, B.; Kooshki, M.; Forbes, M.E.; Holbrook, B.C.; Cook, K.L.; Alexander-Miller, M.A.; Miller, L.D.; et al. Circulating Immune Bioenergetic, Metabolic, and Genetic Signatures Predict Melanoma Patients’ Response to Anti-PD-1 Immune Checkpoint Blockade. Clin. Cancer Res. Off. J. Am. Assoc. Cancer Res. 2022, 28, 1192–1202. [Google Scholar] [CrossRef]


| Drug | Nivolumab | Pembrolizumab |
|---|---|---|
| Target | PD1 | PD1 |
| Non-progressors (nb) | 11 | 15 |
| Progressors (nb) | 17 | 19 |
| Non-progressors (%) | 40 | 44 |
| Progressors (%) | 60 | 56 |
Disclaimer/Publisher’s Note: The statements, opinions and data contained in all publications are solely those of the individual author(s) and contributor(s) and not of MDPI and/or the editor(s). MDPI and/or the editor(s) disclaim responsibility for any injury to people or property resulting from any ideas, methods, instructions or products referred to in the content. |
© 2024 by the author. Licensee MDPI, Basel, Switzerland. This article is an open access article distributed under the terms and conditions of the Creative Commons Attribution (CC BY) license (https://creativecommons.org/licenses/by/4.0/).
Share and Cite
Mestrallet, G. Predicting Immunotherapy Outcomes in Glioblastoma Patients through Machine Learning. Cancers 2024, 16, 408. https://doi.org/10.3390/cancers16020408
Mestrallet G. Predicting Immunotherapy Outcomes in Glioblastoma Patients through Machine Learning. Cancers. 2024; 16(2):408. https://doi.org/10.3390/cancers16020408
Chicago/Turabian StyleMestrallet, Guillaume. 2024. "Predicting Immunotherapy Outcomes in Glioblastoma Patients through Machine Learning" Cancers 16, no. 2: 408. https://doi.org/10.3390/cancers16020408
APA StyleMestrallet, G. (2024). Predicting Immunotherapy Outcomes in Glioblastoma Patients through Machine Learning. Cancers, 16(2), 408. https://doi.org/10.3390/cancers16020408