
Multi-Algorithm Analysis Reveals Pyroptosis-Linked Genes as Pancreatic Cancer Biomarkers


Abstract
Simple Summary
Abstract
1. Introduction
2. Materials and Methods
2.1. Retrieval and Downloading of Pyroptosis-Related Publications
2.2. Natural Language Processing (NLP) and Latent Dirichlet Allocation (LDA)
2.3. Patient Clinical Information, Transcriptome Data, and Immunohistochemistry Acquisition
2.4. Retrieval and Acquisition of Pyroptosis-Related Genes
2.5. Meta-Analysis of Prognostic Implications of Pyroptosis-Related Core Genes in PDAC
2.6. Identification of Differentially Expressed Pyroptosis-Related Genes
2.7. Cell Culture
2.8. mRNA Extraction and RT-qPCR
2.9. Identification of Key Prognostic Genes and Establishment of a Scoring System for Pyroptosis-Related Genes Prognostic Index
2.10. Validation of the Pyroptosis-Related Genes Prognostic Index Scoring System
2.11. Evaluation of Predictive Value and Construction of a Nomogram Prediction Model
2.12. Statistical Analysis
3. Results
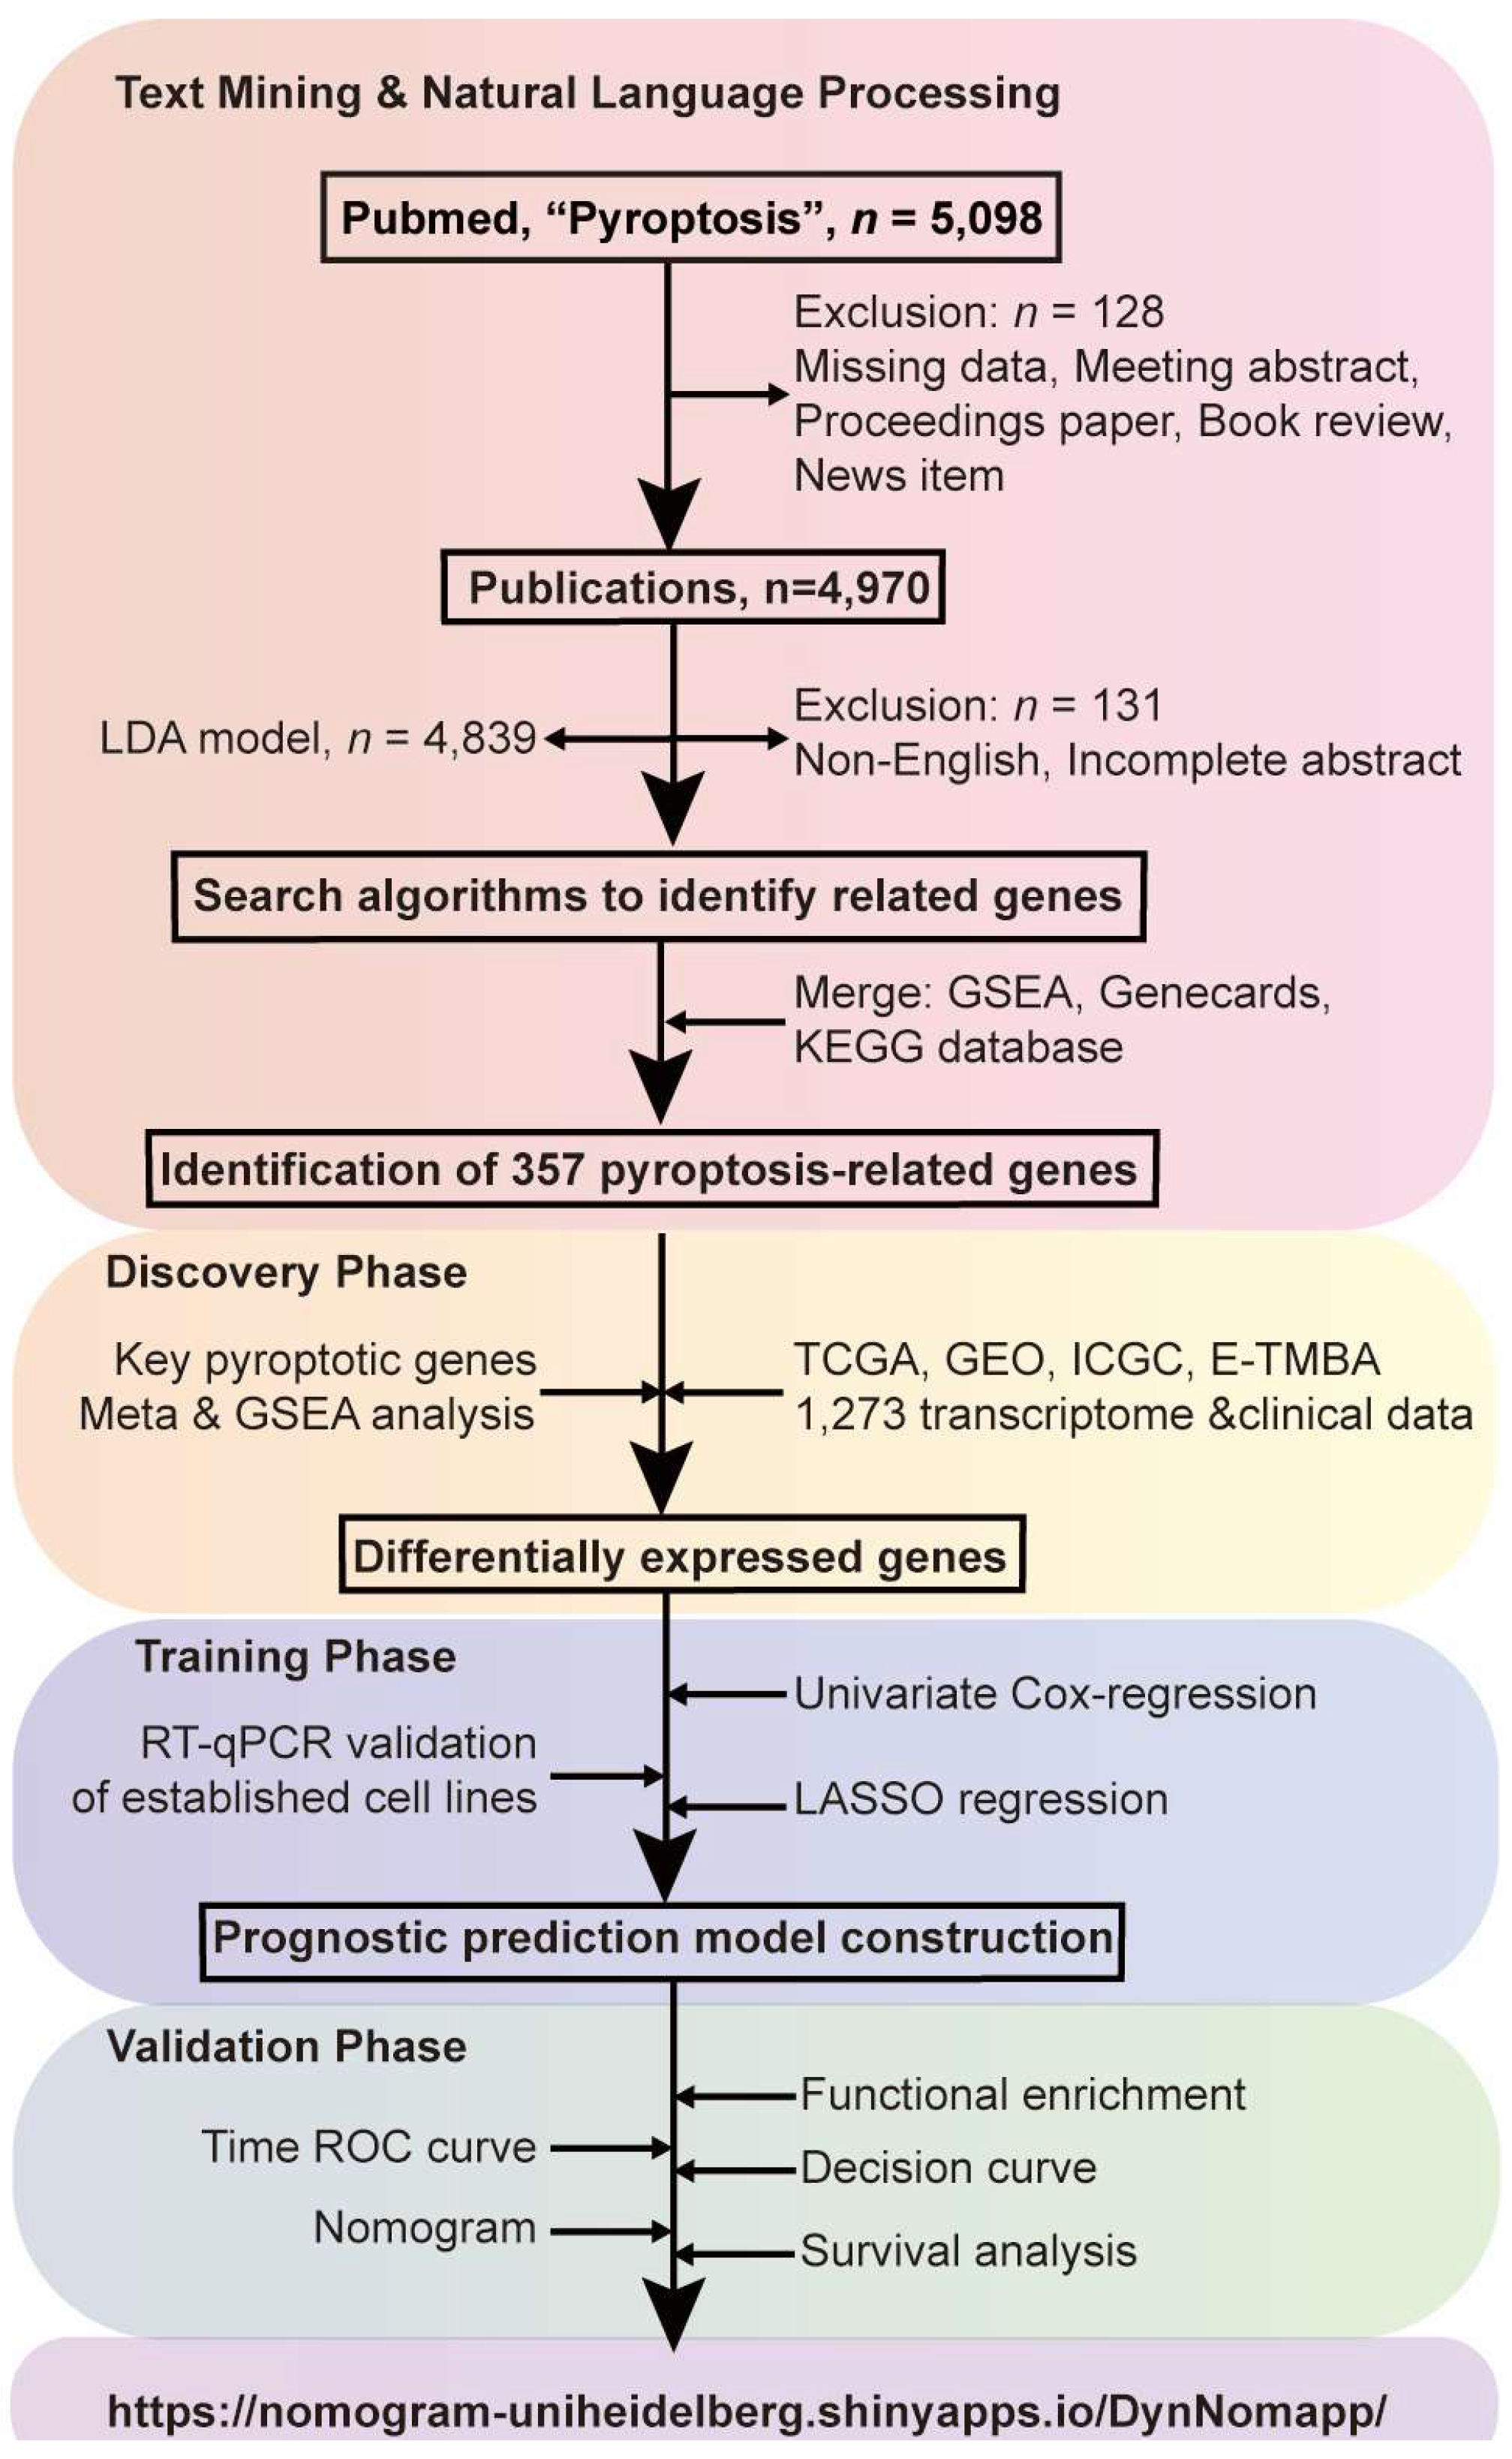
3.1. Study Design
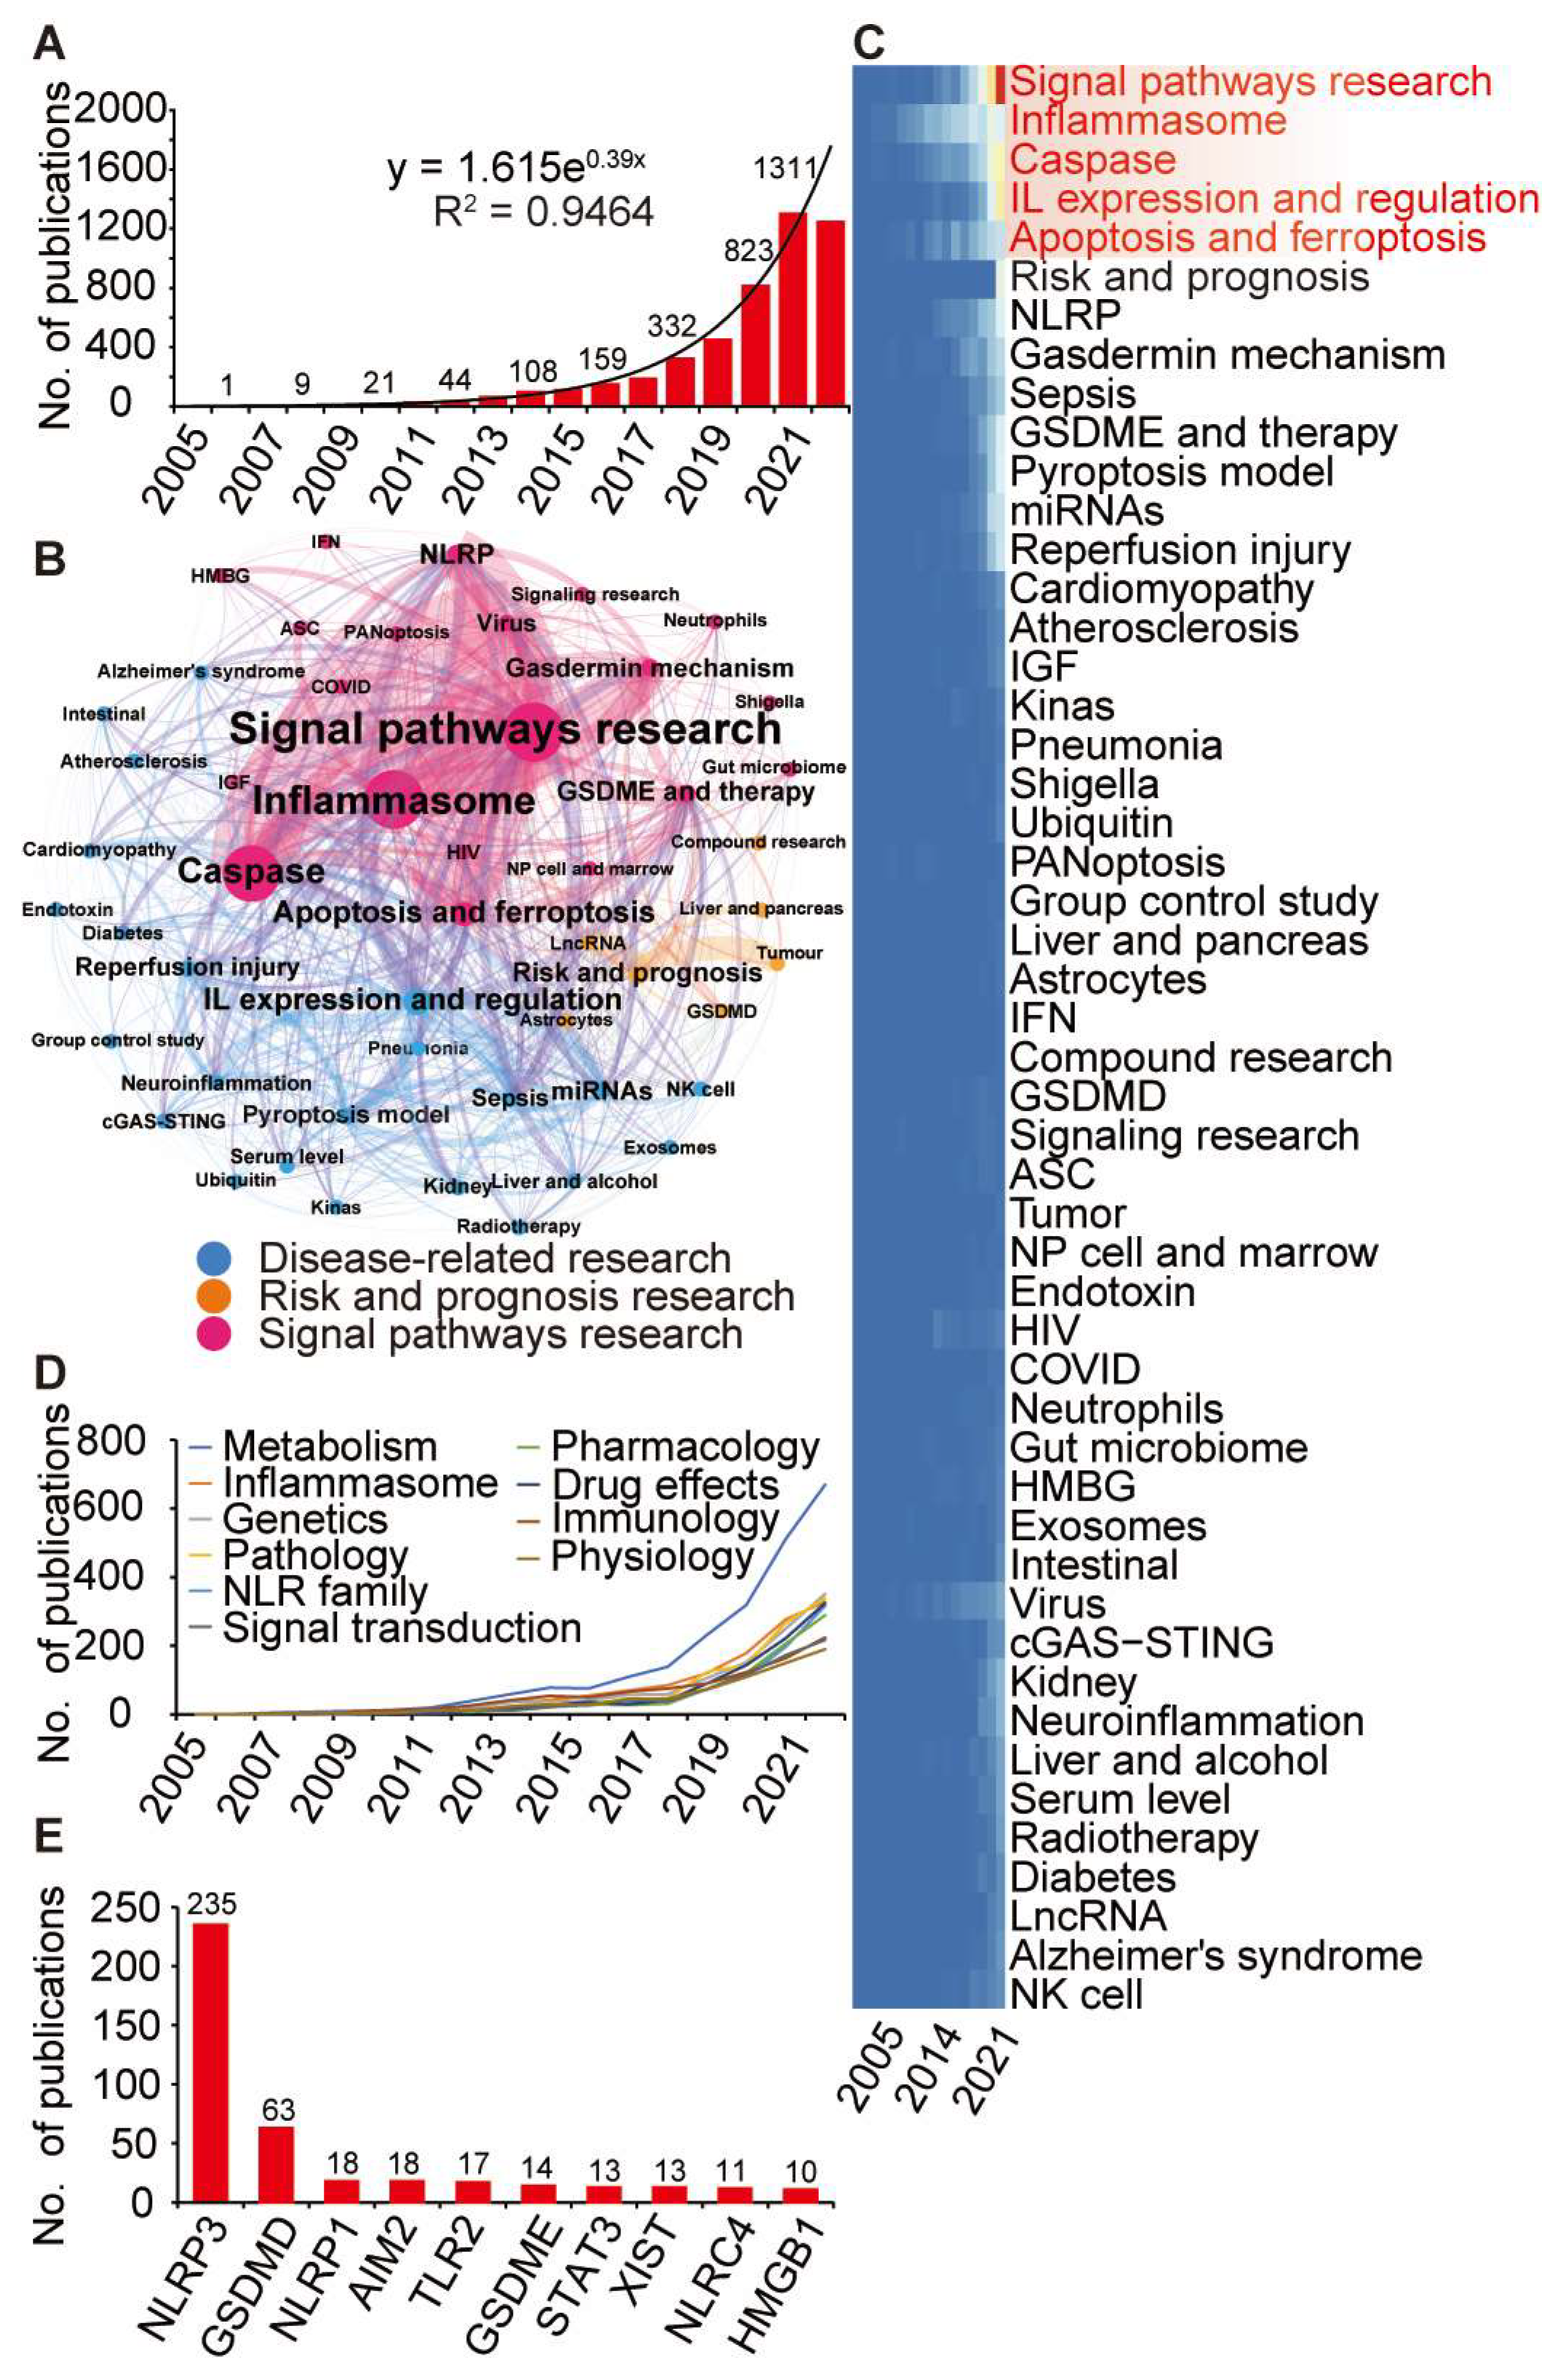
3.2. Identification of Pyroptosis-Relateted Genes through Bibliometric Analysis
3.3. Transcriptome Meta-Analysis Suggests an Essential Role of Pyroptosis Genes in PDAC Prognosis
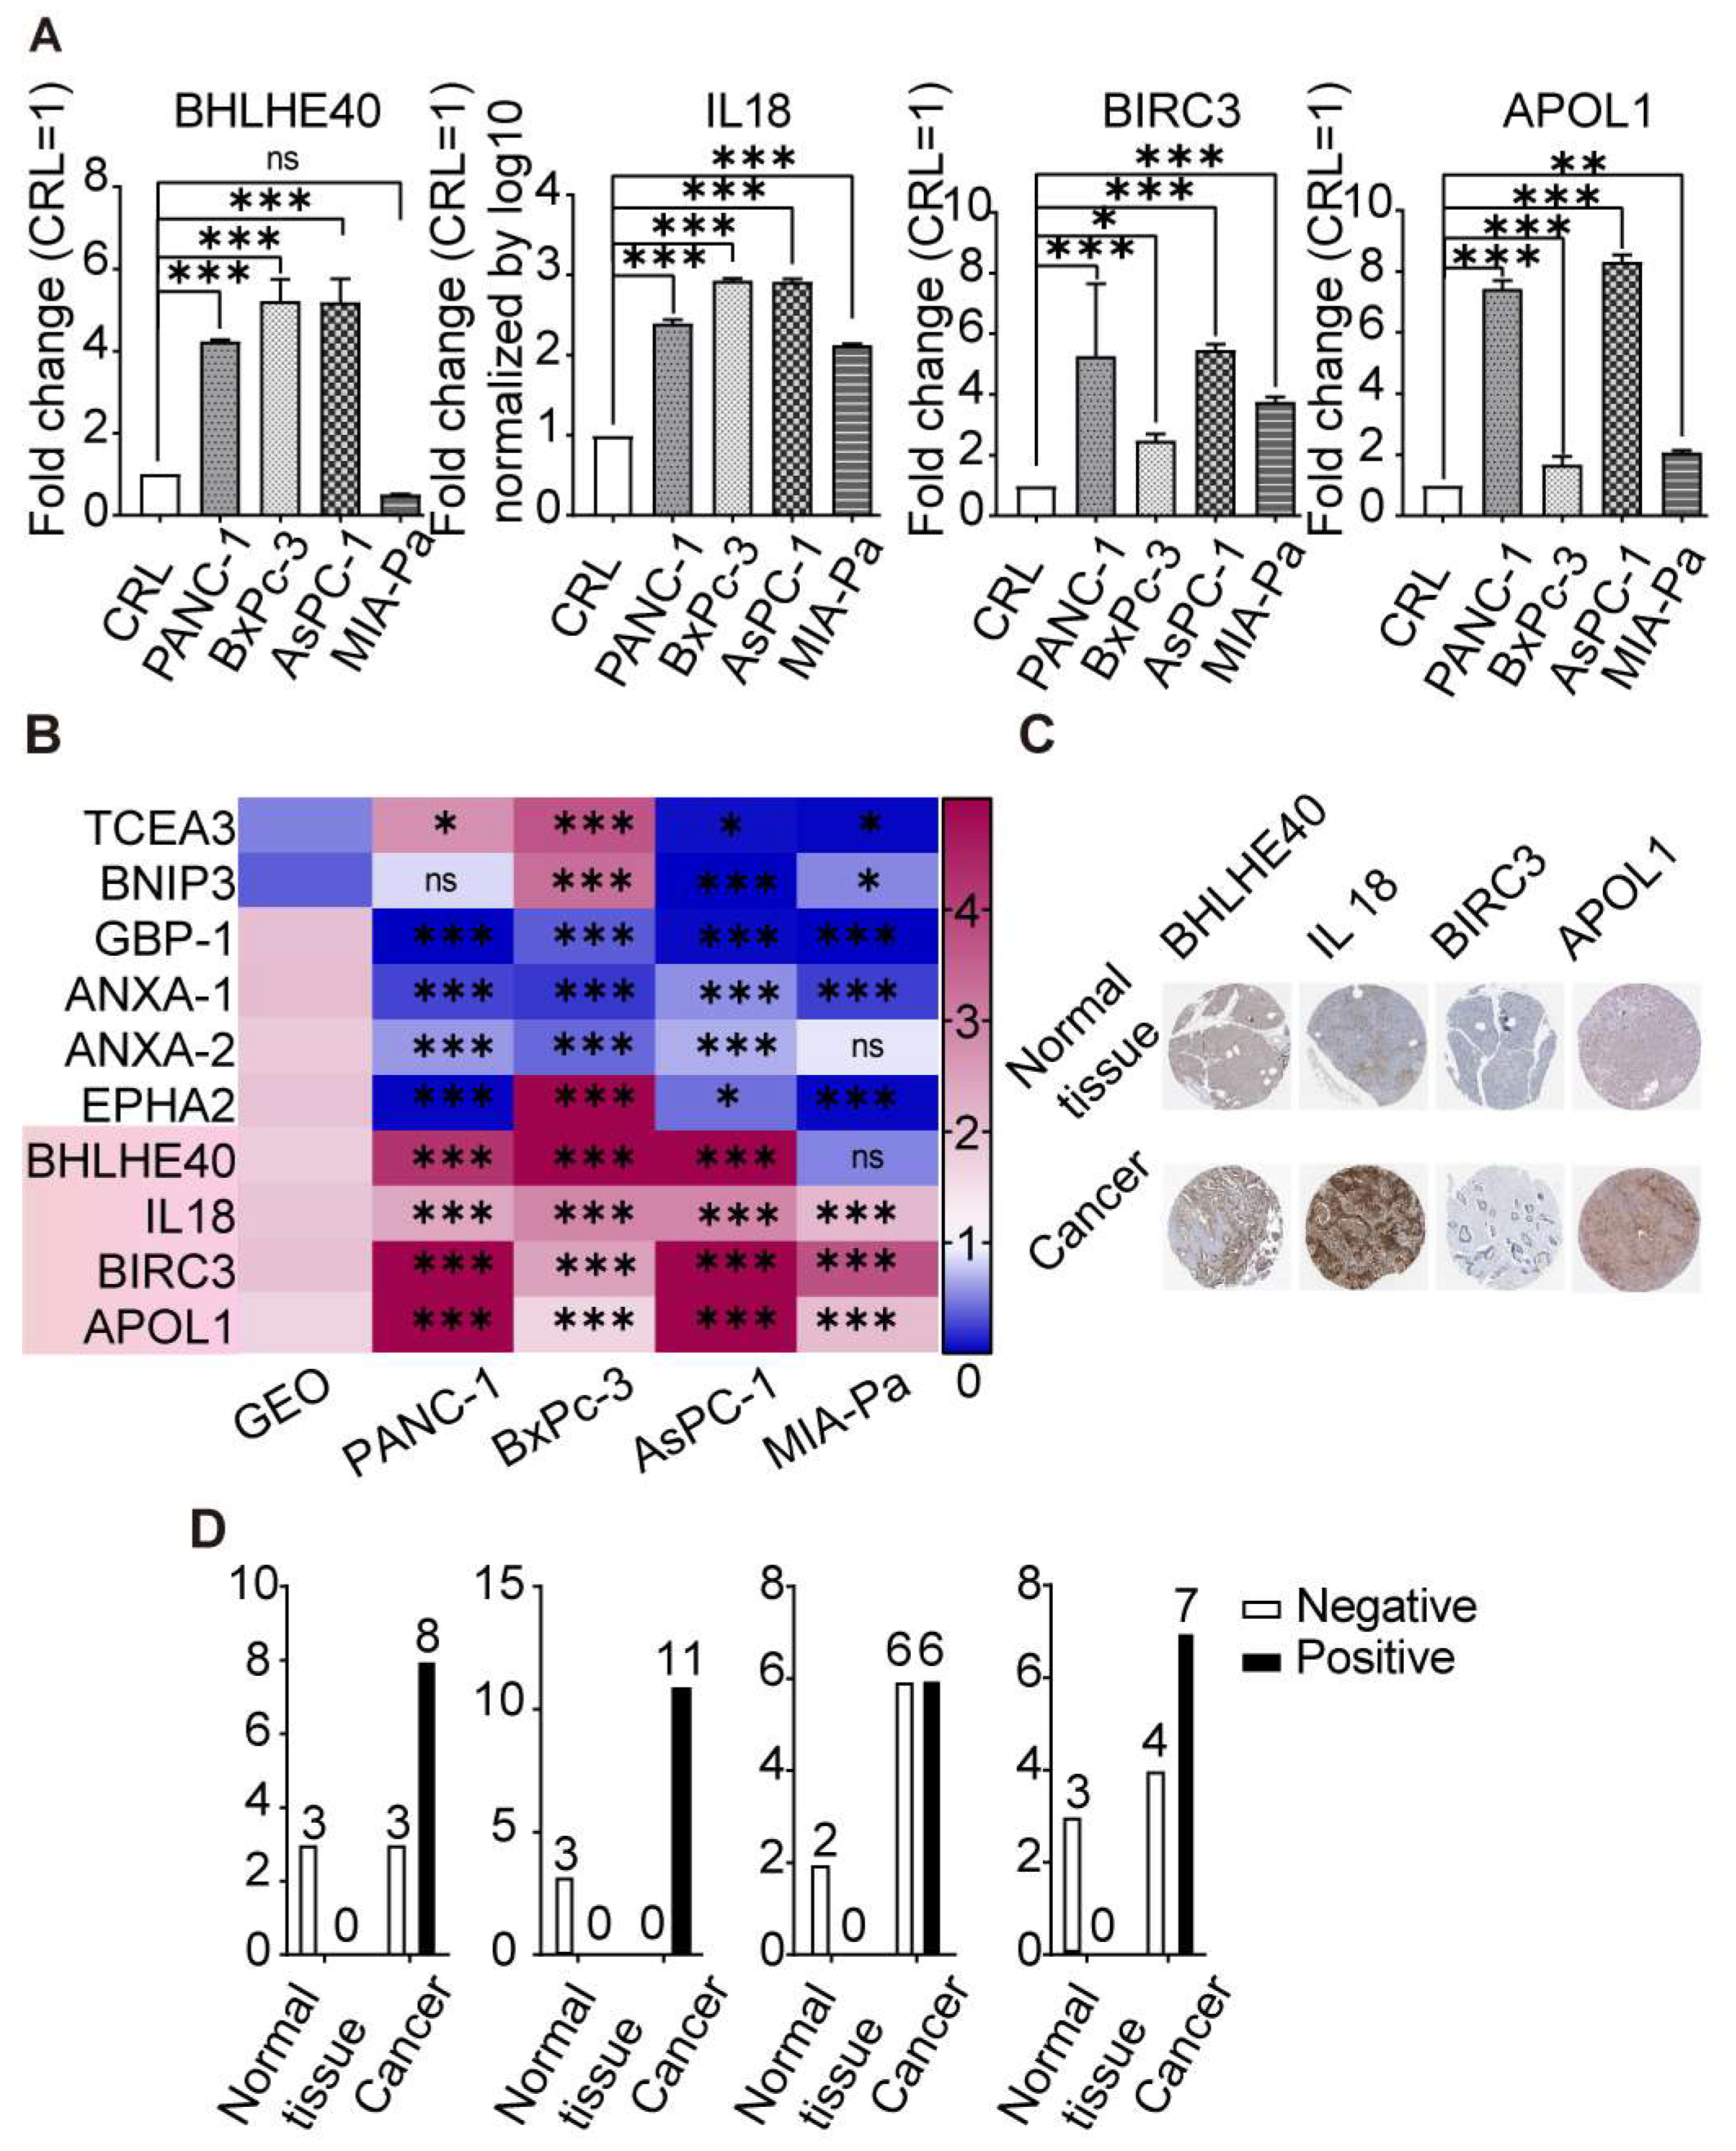
3.4. Differential Expression of Key Pyroptosis-Related Genes in PDAC
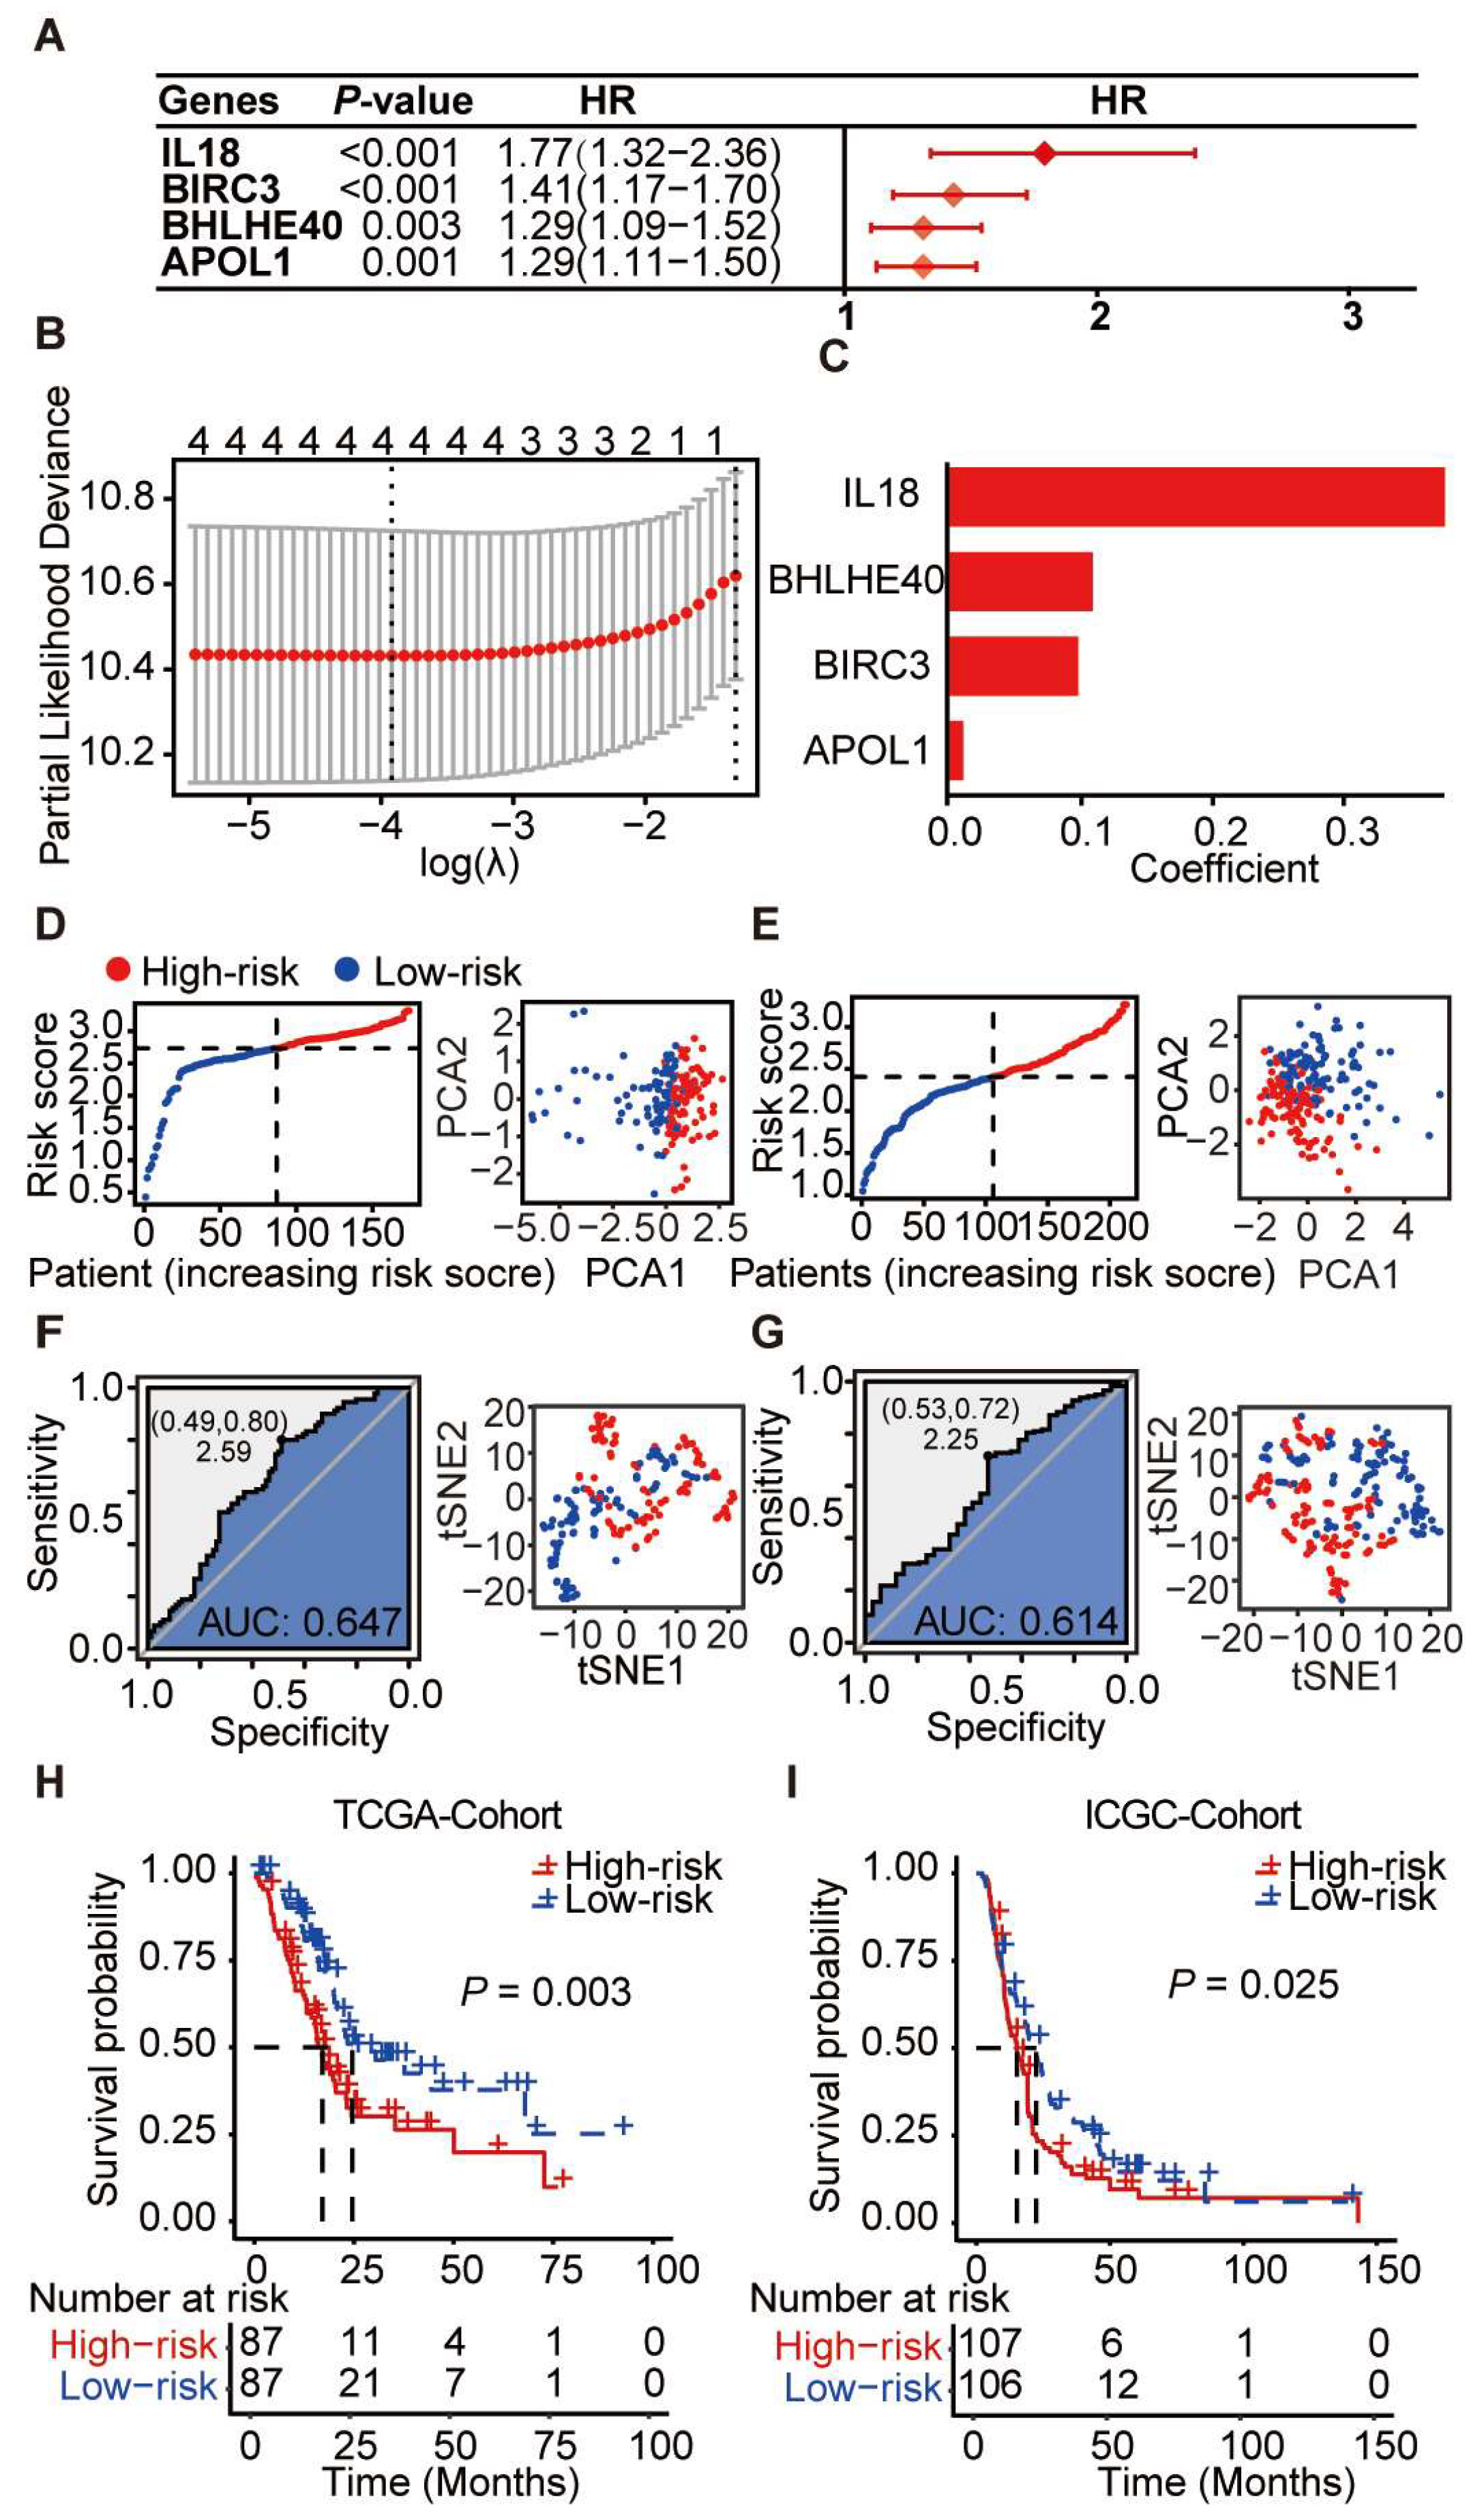
3.5. Prognostic Scoring System Based on Pyroptosis-Related Genes for PDAC
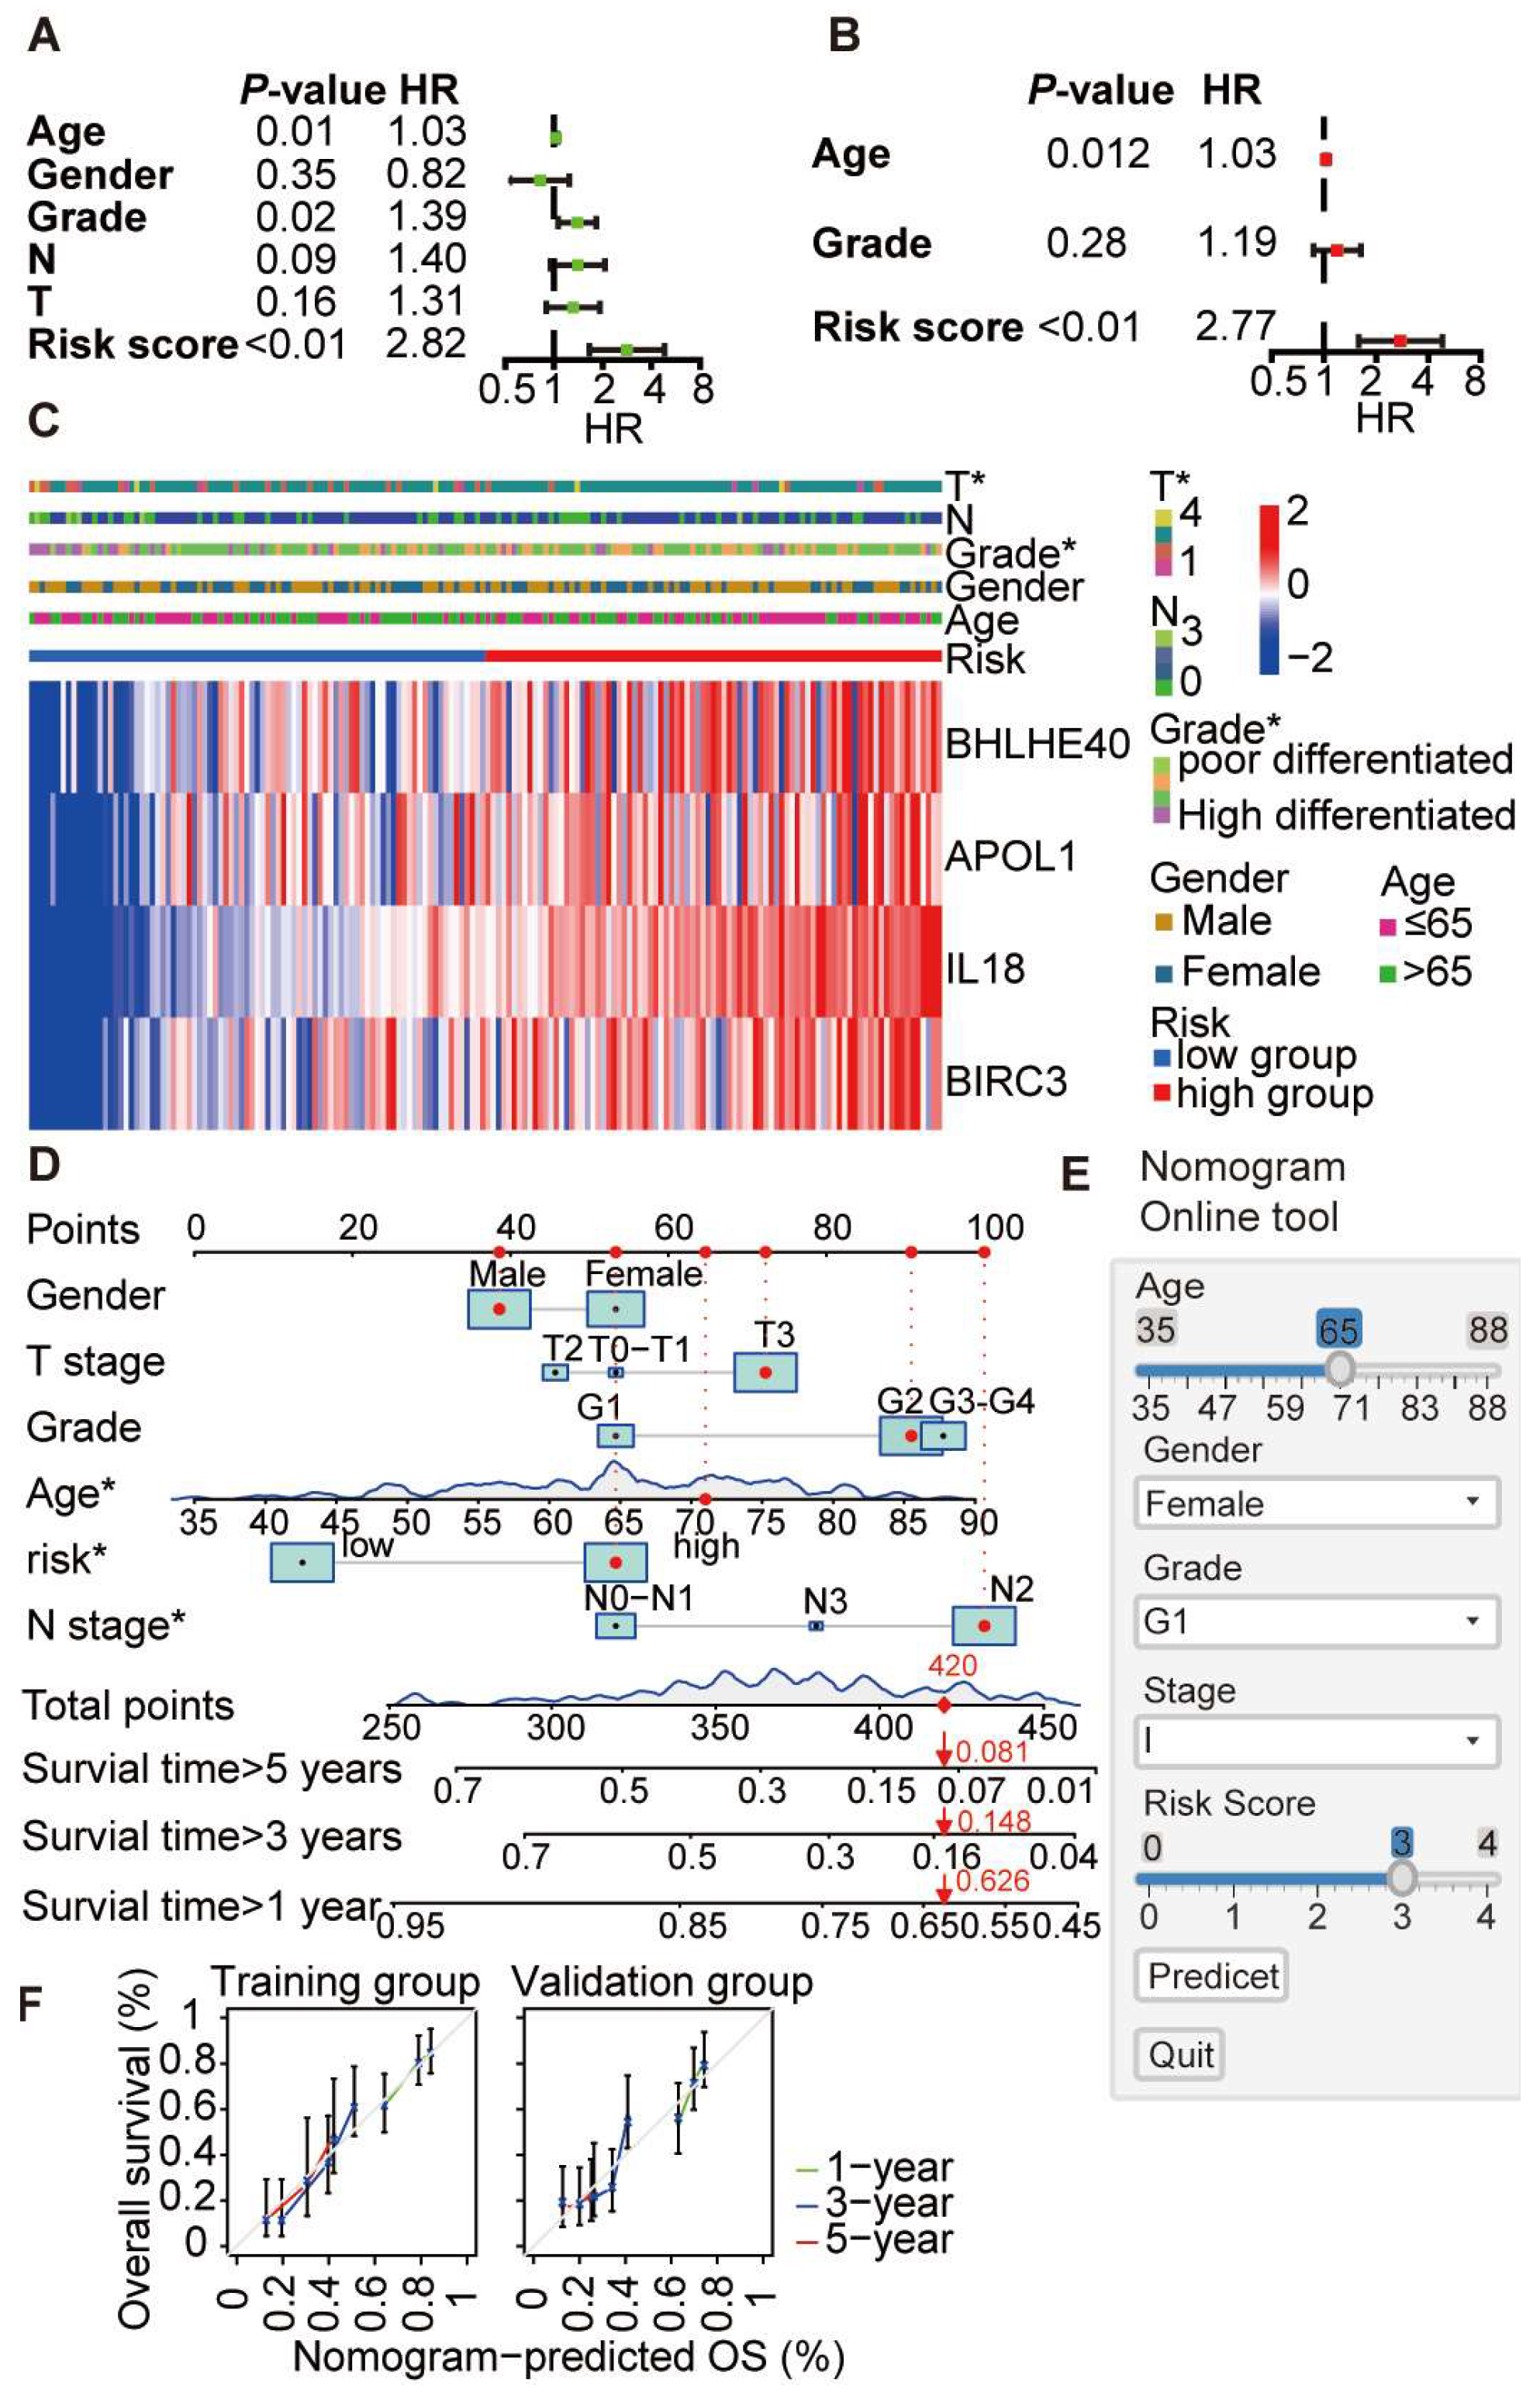
3.6. Construction and Evaluation of a Prognostic Nomogram Based on Core Pyroptosis Gene Expression
4. Discussion
5. Conclusions
Supplementary Materials
Author Contributions
Funding
Institutional Review Board Statement
Informed Consent Statement
Data Availability Statement
Acknowledgments
Conflicts of Interest
References
- Halbrook, C.J.; Lyssiotis, C.A.; Pasca di Magliano, M.; Maitra, A. Pancreatic cancer: Advances and challenges. Cell 2023, 186, 1729–1754. [Google Scholar] [CrossRef] [PubMed]
- Siegel, R.L.; Miller, K.D.; Jemal, A. Cancer statistics, 2020. Cancer J. Clin. 2020, 70, 7–30. [Google Scholar] [CrossRef] [PubMed]
- Springfeld, C.; Ferrone, C.R.; Katz, M.H.G.; Philip, P.A.; Hong, T.S.; Hackert, T.; Buchler, M.W.; Neoptolemos, J. Neoadjuvant therapy for pancreatic cancer. Nat. Rev. Clin. Oncol. 2023, 20, 318–337. [Google Scholar] [CrossRef] [PubMed]
- Wood, L.D.; Canto, M.I.; Jaffee, E.M.; Simeone, D.M. Pancreatic Cancer: Pathogenesis, Screening, Diagnosis, and Treatment. Gastroenterology 2022, 163, 386–402.e1. [Google Scholar] [CrossRef]
- Li, S.; Yue, M.; Xu, H.; Zhang, X.; Mao, T.; Quan, M.; Ma, J.; Wang, Y.; Ge, W.; Wang, Y.; et al. Chemotherapeutic drugs-induced pyroptosis mediated by gasdermin E promotes the progression and chemoresistance of pancreatic cancer. Cancer Lett. 2023, 564, 216206. [Google Scholar] [CrossRef] [PubMed]
- Huang, Q.; Peng, X.; Li, Q.; Zhu, J.; Xue, J.; Jiang, H. Construction and comprehensive analysis of a novel prognostic signature associated with pyroptosis molecular subtypes in patients with pancreatic adenocarcinoma. Front. Immunol. 2023, 14, 1111494. [Google Scholar] [CrossRef] [PubMed]
- Li, L.; Deng, Z.; Xiao, Z.; Zou, W.; Liu, R. Analysis of Pyroptosis-Related Signature for Predicting Prognosis and Tumor Immune Microenvironment in Pancreatic Cancer. Front. Oncol. 2022, 12, 770005. [Google Scholar] [CrossRef]
- Song, W.; Liu, Z.; Wang, K.; Tan, K.; Zhao, A.; Li, X.; Yuan, Y.; Yang, Z. Pyroptosis-related genes regulate proliferation and invasion of pancreatic cancer and serve as the prognostic signature for modeling patient survival. Discov. Oncol. 2022, 13, 39. [Google Scholar] [CrossRef]
- Zhu, J.; Shi, Y.; Lan, S.; Wang, J.; Jiang, F.; Tang, C.; Cai, Y.; Pan, Z.; Jian, H.; Fang, H.; et al. Dissection of pyroptosis-related prognostic signature and CASP6-mediated regulation in pancreatic adenocarcinoma: New sights to clinical decision-making. Apoptosis 2023, 28, 769–782. [Google Scholar] [CrossRef]
- Kesavardhana, S.; Malireddi, R.K.S.; Kanneganti, T.D. Caspases in Cell Death, Inflammation, and Pyroptosis. Annu. Rev. Immunol. 2020, 38, 567–595. [Google Scholar] [CrossRef]
- Broz, P.; Dixit, V.M. Inflammasomes: Mechanism of assembly, regulation and signalling. Nat. Rev. Immunol. 2016, 16, 407–420. [Google Scholar] [CrossRef] [PubMed]
- Martinon, F.; Burns, K.; Tschopp, J. The inflammasome: A molecular platform triggering activation of inflammatory caspases and processing of proIL-beta. Mol. Cell 2002, 10, 417–426. [Google Scholar] [CrossRef] [PubMed]
- Hu, H.; Tang, N.; Zhang, F.; Li, L.; Li, L. Bioinformatics and System Biology Approach to Identify the Influences of COVID-19 on Rheumatoid Arthritis. Front. Immunol. 2022, 13, 860676. [Google Scholar] [CrossRef] [PubMed]
- Yu, P.; Zhang, X.; Liu, N.; Tang, L.; Peng, C.; Chen, X. Pyroptosis: Mechanisms and diseases. Signal Transduct. Target. Ther. 2021, 6, 128. [Google Scholar] [CrossRef]
- Clark, K.M.; Kim, J.G.; Wang, Q.; Gao, H.; Presti, R.M.; Shan, L. Chemical inhibition of DPP9 sensitizes the CARD8 inflammasome in HIV-1-infected cells. Nat. Chem. Biol. 2023, 19, 431–439. [Google Scholar] [CrossRef] [PubMed]
- Yin, M.; Marrone, L.; Peace, C.G.; O’Neill, L.A.J. NLRP3, the inflammasome and COVID-19 infection. QJM 2023, 116, 502–507. [Google Scholar] [CrossRef] [PubMed]
- Zeng, S.; Chen, C.; Zhang, L.; Liu, X.; Qian, M.; Cui, H.; Wang, J.; Chen, Q.; Peng, X. Activation of pyroptosis by specific organelle-targeting photodynamic therapy to amplify immunogenic cell death for anti-tumor immunotherapy. Bioact. Mater. 2023, 25, 580–593. [Google Scholar] [CrossRef]
- Wang, K.; Feng, C.; Li, M.; Pei, Q.; Li, Y.; Zhu, H.; Song, X.; Pei, H.; Tan, F. A bibliometric analysis of 23,492 publications on rectal cancer by machine learning: Basic medical research is needed. Therap. Adv. Gastroenterol. 2020, 13, 1756284820934594. [Google Scholar] [CrossRef]
- Wang, K.; Herr, I. Machine-Learning-Based Bibliometric Analysis of Pancreatic Cancer Research Over the Past 25 Years. Front. Oncol. 2022, 12, 832385. [Google Scholar] [CrossRef]
- Uhlen, M.; Fagerberg, L.; Hallstrom, B.M.; Lindskog, C.; Oksvold, P.; Mardinoglu, A.; Sivertsson, A.; Kampf, C.; Sjostedt, E.; Asplund, A.; et al. Proteomics. Tissue-based map of the human proteome. Science 2015, 347, 1260419. [Google Scholar] [CrossRef]
- Livak, K.J.; Schmittgen, T.D. Analysis of relative gene expression data using real-time quantitative PCR and the 2(-Delta Delta C(T)) Method. Methods 2001, 25, 402–408. [Google Scholar] [CrossRef] [PubMed]
- Wang, G.; Chen, J.; Dai, S.; Zhang, J.; Gao, Y.; Yin, L.; Jiang, K.; Miao, Y.; Lu, Z. High pyroptosis activity in pancreatic adenocarcinoma: Poor prognosis and oxaliplatin resistance. Apoptosis 2023, 1–13. [Google Scholar] [CrossRef]
- Ma, Y.; Zhou, X. Spatially informed cell-type deconvolution for spatial transcriptomics. Nat. Biotechnol. 2022, 40, 1349–1359. [Google Scholar] [CrossRef]
- Xia, D.; Wang, S.; Yao, R.; Han, Y.; Zheng, L.; He, P.; Liu, Y.; Yang, L. Pyroptosis in sepsis: Comprehensive analysis of research hotspots and core genes in 2022. Front. Mol. Biosci. 2022, 9, 955991. [Google Scholar] [CrossRef] [PubMed]
- Sherman, M.H.; Beatty, G.L. Tumor Microenvironment in Pancreatic Cancer Pathogenesis and Therapeutic Resistance. Annu. Rev. Pathol. 2023, 18, 123–148. [Google Scholar] [CrossRef]
- Zhang, F.; Suzuki, M.; Kim, I.S.; Kobayashi, R.; Hamada, N.; Sato, F.; Bhawal, U.K. Transcription factor DEC1 is required for maximal experimentally induced periodontal inflammation. J. Periodontal Res. 2018, 53, 883–893. [Google Scholar] [CrossRef]
- Dvinge, H.; Ries, R.E.; Ilagan, J.O.; Stirewalt, D.L.; Meshinchi, S.; Bradley, R.K. Sample processing obscures cancer-specific alterations in leukemic transcriptomes. Proc. Natl. Acad. Sci. USA 2014, 111, 16802–16807. [Google Scholar] [CrossRef]
- Krieger, T.G.; Le Blanc, S.; Jabs, J.; Ten, F.W.; Ishaque, N.; Jechow, K.; Debnath, O.; Leonhardt, C.S.; Giri, A.; Eils, R.; et al. Single-cell analysis of patient-derived PDAC organoids reveals cell state heterogeneity and a conserved developmental hierarchy. Nat. Commun. 2021, 12, 5826. [Google Scholar] [CrossRef]
- Jia, Y.; Liu, Y.; Zhu, J.; Liu, L.; Ma, X.; Liu, D.; Han, S.; Zhang, L.; Ling, Z.Q.; Wang, Y. DEC1 promotes progression of Helicobacter pylori-positive gastric cancer by regulating Akt/NF-kappaB pathway. J. Cell. Mol. Med. 2022, 26, 1943–1954. [Google Scholar] [CrossRef]
- Oka, S.; Li, X.Y.; Zhang, F.Z.; Tewari, N.; Wang, C.; Kim, I.; Zhong, L.J.; Hamada, N.; Oi, Y.; Makishima, M.; et al. Inhibition of Dec1 provides biological insights into periodontal pyroptosis. All Life 2021, 14, 300–307. [Google Scholar] [CrossRef]
- Wang, L.; Liu, Y.; Dai, Y.; Tang, X.; Yin, T.; Wang, C.; Wang, T.; Dong, L.; Shi, M.; Qin, J.; et al. Single-cell RNA-seq analysis reveals BHLHE40-driven pro-tumour neutrophils with hyperactivated glycolysis in pancreatic tumour microenvironment. Gut 2023, 72, 958–971. [Google Scholar] [CrossRef] [PubMed]
- Yin, Y.; Xin, Y.; Zhang, F.; An, D.; Fan, H.; Qin, M.; Xia, J.; Xi, T.; Xiong, J. Overcoming ABCB1-mediated multidrug resistance by transcription factor BHLHE40. Neoplasia 2023, 39, 100891. [Google Scholar] [CrossRef] [PubMed]
- Frazzi, R. BIRC3 and BIRC5: Multi-faceted inhibitors in cancer. Cell Biosci. 2021, 11, 8. [Google Scholar] [CrossRef] [PubMed]
- Putowski, M.; Giannopoulos, K. Perspectives on Precision Medicine in Chronic Lymphocytic Leukemia: Targeting Recurrent Mutations-NOTCH1, SF3B1, MYD88, BIRC3. J. Clin. Med. 2021, 10, 3735. [Google Scholar] [CrossRef]
- Li, S.; Yang, P.; Xu, L.; Li, M. Blocking of Birc3/TLR4/Myd88 signaling protects carbapenem-resistant klebsiella pneumoniae in a mouse model of infection. Transpl. Immunol. 2021, 69, 101464. [Google Scholar] [CrossRef] [PubMed]
- Liu, L.; Liu, H.; Luo, S.; Patz, E.F., Jr.; Glass, C.; Su, L.; Lin, L.; Christiani, D.C.; Wei, Q. Genetic Variants of CLEC4E and BIRC3 in Damage-Associated Molecular Patterns-Related Pathway Genes Predict Non-Small Cell Lung Cancer Survival. Front. Oncol. 2021, 11, 717109. [Google Scholar] [CrossRef] [PubMed]
- Roohollahi, K.; de Jong, Y.; Pai, G.; Zaini, M.A.; de Lint, K.; Sie, D.; Rooimans, M.A.; Rockx, D.; Hoskins, E.E.; Ameziane, N.; et al. BIRC2-BIRC3 amplification: A potentially druggable feature of a subset of head and neck cancers in patients with Fanconi anemia. Sci. Rep. 2022, 12, 45. [Google Scholar] [CrossRef] [PubMed]
- Hu, C.A.; Klopfer, E.I.; Ray, P.E. Human apolipoprotein L1 (ApoL1) in cancer and chronic kidney disease. FEBS Lett. 2012, 586, 947–955. [Google Scholar] [CrossRef]
- Yoshida, T.; Latt, K.Z.; Rosenberg, A.Z.; Shrivastav, S.; Heymann, J.; Halushka, M.K.; Winkler, C.A.; Kopp, J.B. Transcriptomic Analysis of Human Podocytes In Vitro: Effects of Differentiation and APOL1 Genotype. Kidney Int. Rep. 2023, 8, 164–178. [Google Scholar] [CrossRef]
- Tzukerman, M.; Shamai, Y.; Abramovich, I.; Gottlieb, E.; Selig, S.; Skorecki, K. Comparative Analysis of the APOL1 Variants in the Genetic Landscape of Renal Carcinoma Cells. Cancers 2022, 14, 733. [Google Scholar] [CrossRef]
- Xu, Y.; Chen, X.; Liu, N.; Chu, Z.; Wang, Q. Identification of fibroblast-related genes based on single-cell and machine learning to predict the prognosis and endocrine metabolism of pancreatic cancer. Front. Endocrinol. 2023, 14, 1201755. [Google Scholar] [CrossRef] [PubMed]
- Liu, X.; Zheng, W.; Wang, W.; Shen, H.; Liu, L.; Lou, W.; Wang, X.; Yang, P. A new panel of pancreatic cancer biomarkers discovered using a mass spectrometry-based pipeline. Br. J. Cancer 2018, 118, e15. [Google Scholar] [CrossRef] [PubMed]
- Stromnes, I.M. IL18 at the Crossroads between Chronic Inflammation and T-cell Exhaustion in Pancreatic Cancer. Cancer Immunol. Res. 2023, 11, 400. [Google Scholar] [CrossRef] [PubMed]
- Widowati, W.; Jasaputra, D.K.; Sumitro, S.B.; Widodo, M.A.; Mozef, T.; Rizal, R.; Kusuma, H.S.W.; Laksmitawati, D.R.; Murti, H.; Bachtiar, I.; et al. Effect of interleukins (IL-2, IL-15, IL-18) on receptors activation and cytotoxic activity of natural killer cells in breast cancer cell. Afr. Health Sci. 2020, 20, 822–832. [Google Scholar] [CrossRef]
- Farbod, M.; Dastgheib, S.A.; Asadian, F.; Karimi-Zarchi, M.; Sayad, S.; Barahman, M.; Kargar, S.; Mazaheri, M.; Neamatzadeh, H. Association of IL-8 -251T>A and IL-18 -607C>A polymorphisms with susceptibility to breast cancer—A meta-analysis. Klin. Onkol. 2022, 35, 181–189. [Google Scholar] [CrossRef]
- Guo, X.; Zheng, L.; Jiang, J.; Zhao, Y.; Wang, X.; Shen, M.; Zhu, F.; Tian, R.; Shi, C.; Xu, M.; et al. Blocking NF-kappaB Is Essential for the Immunotherapeutic Effect of Recombinant IL18 in Pancreatic Cancer. Clin. Cancer Res. 2016, 22, 5939–5950. [Google Scholar] [CrossRef]


Disclaimer/Publisher’s Note: The statements, opinions and data contained in all publications are solely those of the individual author(s) and contributor(s) and not of MDPI and/or the editor(s). MDPI and/or the editor(s) disclaim responsibility for any injury to people or property resulting from any ideas, methods, instructions or products referred to in the content. |
© 2024 by the authors. Licensee MDPI, Basel, Switzerland. This article is an open access article distributed under the terms and conditions of the Creative Commons Attribution (CC BY) license (https://creativecommons.org/licenses/by/4.0/).
Share and Cite
Wang, K.; Han, S.; Liu, L.; Zhao, L.; Herr, I. Multi-Algorithm Analysis Reveals Pyroptosis-Linked Genes as Pancreatic Cancer Biomarkers. Cancers 2024, 16, 372. https://doi.org/10.3390/cancers16020372
Wang K, Han S, Liu L, Zhao L, Herr I. Multi-Algorithm Analysis Reveals Pyroptosis-Linked Genes as Pancreatic Cancer Biomarkers. Cancers. 2024; 16(2):372. https://doi.org/10.3390/cancers16020372
Chicago/Turabian StyleWang, Kangtao, Shanshan Han, Li Liu, Lian Zhao, and Ingrid Herr. 2024. "Multi-Algorithm Analysis Reveals Pyroptosis-Linked Genes as Pancreatic Cancer Biomarkers" Cancers 16, no. 2: 372. https://doi.org/10.3390/cancers16020372
APA StyleWang, K., Han, S., Liu, L., Zhao, L., & Herr, I. (2024). Multi-Algorithm Analysis Reveals Pyroptosis-Linked Genes as Pancreatic Cancer Biomarkers. Cancers, 16(2), 372. https://doi.org/10.3390/cancers16020372