
Advances in the Use of Deep Learning for the Analysis of Magnetic Resonance Image in Neuro-Oncology


Abstract
Simple Summary
Abstract
1. Introduction
2. Open Problems in AI Applied to MRI Analysis
- Resampling: MRI scans can exhibit variations in resolution and voxel sizes depending on the acquisition system. Resampling standardizes the resolution across the MRI images to ensure uniform dimensions.
- Co-registration: entails the alignment of MRI scans with a standardized anatomical template with the purpose of situating different scans within the same anatomical coordinate system.
- Skull-stripping: The main objective of the skull-stripping step is to efficiently isolate the cerebral region of interest from non-cerebral tissues, which enables DL models to focus exclusively on those brain tissues.
- Bias Field Correction: aims to rectify intensity inhomogeneities that are pervasive in MRI scans to guarantee uniformity in intensity values. The technique of choice for bias field correction is N4ITK (N4 Bias Field Correction) [20], which is an improved variant of the N3 (non-parametric nonuniform normalization) retrospective bias correction algorithm [21].
- Normalization: a technique adopted to rescale intensity values of MRI scans to a numeric range, rendering them consistent across the dataset. This process mitigates scale-related disparities. Two prominent approaches commonly applied to MRI data as input for DL models are min-max normalization and z-score normalization. Min-max achieves its goal by rescaling intensity values within MRI scans, spanning their range between 0 and 1. In contrast, z-score, often referred to as standardization, transforms the distribution of intensity values by centering it around a zero mean and standard deviation of value 1.
- Tumor identification: A critical and optional pre-processing step before the classification task involves identifying the tumor region of interest (ROI) through segmentation or by defining a bounding box that encompasses the tumor. Popular DL architectures, such as UNet [22], Faster-RCNN [23], and Mask-RCNN [24] are often employed to perform such segmentation or detection tasks.
3. Ml-Based Analytical Pipelines and Their Use in Neuro-Oncology
4. Deep Learning in Neuro-Oncology Data Analysis: A Review
4.1. Overview of the Main DL Methods of Interest
4.2. Publicly Available Datasets
4.3. Literature Review
5. Machine Learning Applications to Ultra-Low Field Imaging
6. Conclusions
Author Contributions
Funding
Institutional Review Board Statement
Informed Consent Statement
Data Availability Statement
Conflicts of Interest
Abbreviations
| AUC | Area Under the ROC Curve |
| CDSS | Clinical Decision Support System |
| CNN | Convolutional Neural Network |
| DA | Data Augmentation |
| DL | Deep Learning |
| FAIR | Findable, Accessible, Interoperable, Reusable |
| GAN | Generative Adversarial Network |
| HGG | High-Grade Glioma |
| ICA | Independent Component Analysis |
| LGG | Low-Grade Glioma |
| ML | Machine Learning |
| MRI | Magnetic Resonance Imaging |
| MRS | Magnetic Resonance Spectroscopy |
| MRSI | Magnetic Resonance Spectroscopy Imaging |
| NMF | Nonnegative Matrix Factorization |
| RF | Random Forest |
| RGB | Red, Green, Blue |
| ROI | Region of Interest |
| SVM | Support Vector Machine |
| TCGA | The Cancer Genome Atlas |
| TCIA | The Cancer Imaging Archive |
| tICA | Temporal ICA |
| TL | Transfer Learning |
| TPOT | Tree-based Pipeline Optimization Tool |
| ULF | Ultra-Low Field |
| ViT | Vision Transformer |
| WHO | World Health Organization |
| WSI | Whole Slide Imaging |
Appendix A. Literature Review Summary of Deep-Learning Sources

| No. | Reference | Dim. | Dataset | Sample Size | Plane | MRI Modality | Pre-Processing | Data Augmentation (Augmentation Factor) | |
|---|---|---|---|---|---|---|---|---|---|
| Patients | Images | ||||||||
| 1 | Ge et al. [100] (2018) | 2D | BraTS2017 | 285 (Table 1) | - | Ax, Sag, Cor | T1c, T2, Flair | Tumor mask enhancement | Multi-view images (ax, sag, cor), rotation, flipping |
| 2 | Ge et al. [73] (2018) | 3D | BraTS2017 | 285 (Table 1) | 285 (Table 1) | Ax, Sag, Cor | T1c | None 1 Tumor mask enhancement 2 | (LGG: 2) Flipping |
| 3 | Pereira et al. [74] (2018) | 3D | BraTS2017 | 285 (Table 1) | 285 (Table 1) | Ax, Sag, Cor | T1, T1c, T2, Flair | BFC, z-score normalization (inside brain mask) | Sagittal flipping, rotation, exponential intensity transformation |
| 4 | Yang et al. [101] (2018) | 2D | Private | 113 (LGG: 52, HGG: 61) | 867 (LGG: 368, HGG: 499) | Ax | T1c | Z-score normalization, tumor ROI | (14) HE, random rotation, zooming, adding noise, flipping |
| 5 | Abd-Ellah et al. [167] (2019) | 2D | Brats2017 | - | 1800 (H: 600, LGG: 600, HGG:600) | - | - | - | - |
| 6 | Anaraki et al. [168] (2019) | 2D | IXI REMBRANDT TCGA-GBM TCGA-LGG Private Figshare | 600 130 199 299 60 233 | 16,000 (H: 8000, G.II: 2000, G.III: 2000, G.IV: 4000) 989 | Ax - - - - Ax | T1 T1c T1c T1c T1c T1c | Normalization, resizing | Rotation, translating, scaling, flipping |
| 7 | Deepak and Ameer [76] (2019) | 2D | Figshare | 233 (Table 1) | 3064 (Table 1) | Ax, Sag, Cor | T1c | Min-max normalization, resizing | Rotation, flipping |
| 8 | Hemanth et al. [169] (2019) | 2D | Private | - | 220 | - | T1, T2, Flair | None | None |
| 9 | Kutlu and Avcı [120] (2019) | 2D | Figshare | 233 (Table 1) | 3064 | Ax, Sag, Cor | T1c | None | None |
| 10 | Lo et al. [102] (2019) | 2D | TCIA | 134 (G.II: 30, G.III: 43, G.IV: 57) | 134 (G.II: 30, G.III: 43, G.IV: 57) | Ax | T1c | Normalization, CE, tumor segmentation | (56) AutoAugment [170] |
| 11 | Muneer et al. [171] (2019) | 2D | Private | 20 | 557 (G.I: 130, G.II: 169, G.III: 103, G.IV: 155) | Ax | T2 | Skull-stripping, tumor segmentation | Resize, reflection, rotation |
| 12 | Rajini [172] (2019) | 2D | IXI REMBRANDT TCGA-GBM TCGA-LGG Figshare | 600 130 “around 200” 299 233 | - - - - - | - - - - - | - - - - T1c | - - - - - | - - - - - |
| 13 | Rahmathunneesa and Muneer [173] (2019) | 2D | Private | - | 760 (G.I: 198, G.II: 205, G.III: 172, G.IV: 185) | Axial | T2 | Skull-stripping, resizing | Resizing, rotation, translation, reflection |
| 14 | Sajjad et al. [174] (2019) | 2D | Radiopaedia Figshare | - 233 | 121 (G.I: 36, G.II: 32, G.III: 25, G.IV: 28) 3064 (Table 1) | - - | - T1c | BFC, Segmentation, Z-score normalization | (30) Rotation, flipping, skewness, shears, gaussian blur, sharpening, edge detection, emboss |
| 15 | Sultan et al. [175] (2019) | 2D | Figshare REMBRANDT | 233 (Table 1) 73 (G.II: 33, G.III: 19, G.IV: 21) | 3064 (Table 1) 516 (G.II: 205, G.III: 129, G.IV: 182) | Ax, Sag, Cor | T1c | Resizing | (5) Rotation, flipping, mirroring, noise |
| 16 | Swati et al. [77] (2019) | 2D | Figshare | 233 (Table 1) | 3064 (Table 1) | Ax, Sag, Cor | T1c | Min-max normalization, resizing | - |
| 17 | Toğaçar et al. [176] (2019) | 2D | Kaggle-III | - | 253 (Table 1) | - | - | - | Rotation, flipping, brightening, CE, shifting, scaling |
| 18 | Amin et al. [177] (2020) | 2D | BraTS2012 1 BraTS2013 2 BraTS2013 (LB) 3 BraTS2015 4 BraTS2018 5 | 25 (LGG: 5, HGG: 10) 30 (Table 1) 25 (LGG: 4, HGG: 21) 274 (Table 1) 284 (Table 1) | - - - - - | - | T1, T1c, T2, Flair | Noise Removal, tumor enhancement, MRI modality fusion | - |
| 19 | Afshar et al. [178] (2020) | 2D | Figshare | 233 | 3064 | - | - | - | - |
| 20 | Badža and Barjaktarović [158] (2020) | 2D | Figshare | 233 | 3064 (Table 1) | Ax, Sag, Cor | T1c | Normalization, Resizing | Rotation, flipping |
| 21 | Banerjee et al. [56] (2020) | 2D | TCGA-GBM TCGA-LGG BraTS2017 | 262 199 285 (Table 1) | 1590 (LGG:750, HGG:840) | Ax 1 Ax, Sag, Cor 2 | T1, T1c, T2, Flair | - | Rotation, shifts, flipping |
| 22 | Bhanothu et al. [179] (2020) | 2D | Figshare | 233 | 2406 (MN: 694, GL: 805, PT: 907) | - | T1c | Min-max normalization | - |
| 23 | Çinar and Yildirim [180] (2020) | 2D | Kaggle-III | - | 253 (Table 1) | Ax, Sag, Cor | - | - | - |
| 24 | Ge et al. [93] (2020) | 2D | BraTS2017 | 285 (Table 1) | - | Ax, Sag, Cor | T1, T1c, T2, Flair | - | GAN |
| 25 | Ghassemi et al. [85] (2020) | 2D | Figshare | 233 | 3064 (Table 1) | Ax, Sag, Cor | T1c | Normalization (−1,1) | Rotation, flipping |
| 26 | Ismael et al. [159] (2020) | 2D | Figshare | 233 (Table 1) | 3064 (Table 1) | - | T1c | Resizing, cropping | Rotation, flipping, shifting, zooming, ZCA whitening, shearing, brightening |
| 27 | Khan et al. [181] (2020) | 2D | Kaggle-III | - | 253 (Table 1) | - | - | Brain cropping | Flipping, rotation, brightness |
| 28 | Ma and Jia [129] (2020) | 3D | CPM-RadPath2019 | 329 (Table 1) | 329 | Ax, Sag, Cor | T1, T1c, T2, Flair | Z-score normalization | Cropping, rotation, zooming, translation, color changes |
| 29 | Mohammed and Al-Ani [182] (2020) | 2D | Radiopaedia | 60 (15 per class) | 1258 (H: 286, MN: 380, E: 311, Med: 281) | Ax, Sag, Cor | - | Resizing, denoising | Rotation, scaling, reflection, translating, cropping |
| 30 | Mzoughi et al. [142] (2020) | 3D | BraTS2018 | 284 (LGG: 75, HGG: 209) | 285 | Ax, Sag, Cor | T1c | Min-max normalization, CE, resizing | flipping |
| 31 | Naser and Deen [183] (2020) | 2D | TCGA-LGG | 108 (G.II: 50, G.III: 58) | 815 (G.II: 400, G.III: 415) | - | T1, T1c, Flair | Cropping, normalization (−1,1), resizing, segmentation | Rotation, zooming, shifting, flipping |
| 32 | Noreen et al. [184] (2020) | 2D | Figshare | 233 | 3064 (Table 1) | T1c | Normalization | - | |
| 33 | Pei et al. [143] (2020) | 3D | CPM-RadPath2020 | 270 (Table 1) | 270 | Ax, Sag, Cor | T1, T1c, T2, Flair | Noise reduction, z-score normalization, tumor segmentation | Rotation, scaling |
| 34 | Rehman et al. [104] (2020) | 2D | Figshare | 233 | 3064 (Table 1) | T1c | CE | Rotation, flipping | |
| 35 | Saxena et al. [185] (2020) | 2D | Kaggle-III | - | 253 (Table 1) | - | - | Brain cropping, resizing | (20) not specified |
| 36 | Sharif et al. [186] (2020) | 2D | BraTS 2013 1 BraTS2015 2 BraTS2017 3 BraTS2018 4 | 30 (Table 1) 274 (Table 1) 285 (Table 1) 284 (Table 1) | - | - | T1, T1c, T2, Flair | CE, tumor segmentation | - |
| 37 | Tandel et al. [105] (2020) | 2D | REMBRANDT | 112 (Table 1) | 2132 (H: 1041, T: 1091) 2156 (H: 1041, LGG: 484, HGG: 631) 2156 (H: 1041, AS: 557, OG: 219, GB: 339) 1115 (AS-II: 356, AS-III: 201, OG-II: 128, OG-III: 91, GB: 339) 2156 (H: 1041, AS-II: 356, AS-III: 201, OG-II: 128, OG-III: 91, GB: 339) | Ax, Sag, Cor | T2 | Skull-stripping | Rotation, scaling |
| 38 | Toğaçar et al. [96] (2020) | 2D | Kaggle-III | - | 253 (Table 1) | - | - | - | Oversampling |
| 39 | Vimal Kurup et al. [187] (2020) | 2D | Figshare | 233 | 3064 (Table 1) | - | T1c | Resizing | Rotation, cropping |
| 40 | Zhuge et al. [58] (2020) | 2D | BraTS2018 TCGA-LGG | 284 (Table 1) 30 | 284 (Table 1) 30 | Ax, Sag, Cor | T1c, T2, Flair | Inhomogeneity correction, z-score normalization, min-max normalization, tumor segmentation | (23) - AutoAugment [170] |
| 3D | BraTS2018 TCGA-LGG | 284 (Table 1) 30 | 284 (Table 1) 30 | Ax, Sag, Cor | T1c, T2, Flair | Rotation, scaling, flipping | |||
| 41 | Alaraimi et al. [78] (2021) | 2D | Figshare | 233 | 3064 (Table 1) | - | - | HE, z-score normalization | Rotation, cropping, flipping, scaling, translation |
| 42 | Ayadi et al. [86] (2021) | 2D | Figshare 1 Radiopaedia 2 REMBRANDT 3 | 233 (Table 1) - 112 (AS-II: 30, AS-III: 17, OG-II: 14, OG-III: 7, GB: 44) | 3064 (Table 1) 121 (MN G.I: 36, GL G.II: 32, GL G.III: 25, GB: 28) - | Ax, Sag, Cor - - | T1c - - | - - - | (17) - Rotation, flipping, gaussian blur, sharpen |
| 43 | Bashir-Gonbadi and Khotanlou [188] (2021) | 2D | IXI BraTS2017 Figshare Private | 582 (healthy) 285 - - | - - 3064 230 | - | - | Skull-stripping, resizing | Flipping, mirroring, shifting, scaling, rotation |
| 44 | Chakrabarty et al. [144] (2021) | 3D | BraTS 2018 BraTS2019 LGG-1p19q Private | 43 LGG 335 (Table 1) 145 1234 (MET: 710, MN: 143, AN: 158, PA: 82, H: 141) | 43 335 159 1234 | Ax, Sag, Cor | T1c | Co-registration, resampling, skull-stripping, z-score normalization, resizing | - |
| 45 | Decuyper et al. [140] (2021) | 3D | TCGA TCGA-1p19q BraTS2019 GUH dataset | 285 (LGG: 121, HGG: 164) 141 202 110 | 285 141 202 110 | Ax, Sag, Cor | T1, T1c, T2, Flair | Tumor segmentation | Rotation, Flipping, Intensity scaling, Elastic transform |
| 46 | Díaz-Pernas et al. [151] (2021) | 2D | Figshare | 233 | 3064 (Table 1) | Ax, Sag, Cor | T1c | Z-score normalization | (2) Elastic transforms |
| 47 | Gab Allah et al. [94] (2021) | 2D | Figshare | 233 | 3064 (Table 1) | Ax, Sag, Cor | T1c | Normalization (−1,1) | (12) PGGAN 1 (9) Rotation, mirroring, flipping 2 |
| 48 | Gilanie et al. [152] (2021) | 2D | Private | 180 (AS-1: 50, AS-II: 40, AS-III: 40, AS-IV: 50) | 30,240 (AS-1: 8400, AS-II: 6720, AS-III: 6720, AS-IV: 8400) | T1 & Flair: Ax, T2: Ax, Sag | T1, T2, Flair | BFC, normalization, tumor Segmentation | Rotation |
| 49 | Gu et al. [189] (2021) | 2D | REMBRANDT 1 Figshare 2 | 130 - | 110,020 3064 (Table 1) | - - | - T1c | - - | - - |
| 50 | Guan et al. [153] (2021) | 2D | Figshare | 233 (Table 1) | 3064 (Table 1) | Ax, Sag, Cor | T1c | CE, tumor ROI, min-max normalization | (3) Rotation, flipping |
| 51 | Gull et al. [154] (2021) | 2D | BraTS2018 1 BraTS2019 2 BraTS2020 3 | - - - | 1425 (LGG: 375, HGG: 1050) 1675 (LGG: 380, HGG: 1295) 2470 (LGG: 645, HGG: 1435, unknown: 390) | - - - | T1, T1c, T2, Flair T1, T1c, T2, Flair T1, T1c, T2, Flair | Grayscaling, median filtering, skull-stripping | - |
| 52 | Gutta et al. [106] (2021) | 2D | Private | 237 (G.I: 17, G.II: 59, G.III: 46, G.IV: 115) | 660 (G.I: 27, G.II: 144, G.III: 184, G.IV: 305) | - | T1, T1c, T2, Flair | Resampling, co-registration, skull-stripping, tumor segmentation | - |
| 53 | Hao et al. [79] (2021) | 2D | BraTS2019 | 335 (Table 1) | 6700 (20 random slices per patient) | Ax, Sag, Cor | T1c, T1, T2 | - | - |
| 54 | Irmak [190] (2021) | 2D | RIDER REMBRANDT TCGA-LGG Figshare | 19 (G.IV) 130 199 233 | (total) 2990 (H: 1350, T: 1640) 3950 (H: 850, MN: 700, GL: 950, PT: 700, MT: 750) 4570 (G.II: 1676, G.III: 1218, G.IV: 1676) | - | T1c, Flair T1c, Flair T1c, Flair T1c | - | - |
| 55 | Kader et al. [191] (2021) | 2D | BraTS2012 BraTS2013 BraTS2014 BraTS2015 | - - - - | 1000 1000 800 700 | - - - - | - - - - | Noise removal, tumor segmentation, resizing | - |
| 56 | Kader et al. [192] (2021) | 2D | Private | - | 17,600 | - | T1, T2, Flair | - | Yes, not specified |
| 57 | Kakarla et al. [193] (2021) | 2D | Figshare | 233 | 3064 (Table 1) | - | T1c | Resizing, min-max normalization, CE | - |
| 58 | Kang et al. [133] (2021) | 2D | Kaggle-III 1 Kaggle-II 2 Kaggle-I 3 | - - - | 253 (Table 1) 3264 (Table 1) 3000 (Table 1) | - - - | - - - | Brain cropping, resizing | Rotation, flipping |
| 59 | Khan et al. [87] (2021) | 2D | BraTS2015 | 274 | 169,880 | Ax, Sag, Cor | T1, T1c, T2, Flair | Z-score normalization, tumor segmentation | (20) Rotation, zooming, geometric transforms, sharpening, noise addition, CE |
| 60 | Kumar et al. [88] (2021) | 2D | Figshare | 233 | 3064 (Table 1) | T1c | - | Rotation | |
| 61 | Masood et al. [194] (2021) | 2D | Figshare Kaggle-III | 233 - | 3064 (Table 1) 253 (Table 1) | - - | T1c - | BFC, CE, tumor ROI | - |
| 62 | Noreen et al. [134] (2021) | 2D | Figshare | 233 | 3064 (Table 1) | - | - | Min-max normalization | - |
| 63 | Özcan et al. [155] (2021) | 2D | Private | 104 (G.II: 50, G.IV: 54) | 518 | Ax, Sag, Cor | Flair | Multiple-cropping, z-score normalization | (20) Rotation, zooming, shearing, flipping, elastic gaussian transforms |
| 64 | Pei et al. [97] (2021) | 3D | CPM-RadPath2020 | 256 (Table 1) | 256 (Table 1) | Ax, Sag, Cor | T1, T1c, T2, Flair | BFC, z-score normalization | (oversampling) |
| 65 | Sadad et al. [195] (2021) | 2D | Figshare | 233 (Table 1) | 3064 (Table 1) | Ax, Sag, Cor | - | CE, tumor detection | Rotation, flipping |
| 66 | Tandel et al. [107] (2021) | 2D | REMBRANDT | 130 (H: 18, T: 112) | 2156 (H: 1041, T: 1091) 557 (AS-II: 356, AS-III: 201) 219 (OG-II: 218, OG-III: 91) 1115 (LGG: 484, HGG: 631) | Ax, Sag, Cor | T2 | - | Rotation, scaling |
| 67 | Toğaçar et al. [80] (2021) | 2D | Figshare | 233 | 3064 (Table 1) | - | T1c | - | Rotation, scrolling, brightening |
| 68 | Yamashiro et al. [145] (2021) | 3D | BraTS2018 | 284 (Table 1) | 285 (Table 1) | Ax, Sag, Cor | T1c | Tumor segmentation | Flipping, scaling, shifting |
| 69 | Yin et al. [130] (2021) | 3D | CPM-RadPath2020 | 256 (Table 1) | 256 (Table 1) | Ax, Sag, Cor | T1, T1c, T2, Flair | Tumor segmentation, resizing, z-score normalization | Brightness, CE, saturation, hue, flipping, rotation |
| 70 | Aamir et al. [156] (2022) | 2D | Figshare | 233 (Table 1) | 3064 (Table 1) | Ax, Sag, Cor | T1c | CE, min-max normalization, tumor ROI | (2) Rotation, flipping |
| 71 | Ahmad et al. [89] (2022) | 2D | Figshare | 233 | 3064 (Table 1) | - | T1c | Resizing, normalization | CDA: Rotation, scaling GDA: VAE, GAN |
| 72 | Alanazi et al. [160] (2022) | 2D | Kaggle-I Kaggle-II 1 Figshare 2 | - - 233 | 3000 (H: 1500, T: 1500) 3264 (Table 1) 3064 (Table 1) | - | - | Noise removal, cropping, z-score normalization, resizing | - |
| 73 | Almalki et al. [121] (2022) | 2D | Kaggle-II 1 Figshare 2 | - 233 | 2870 (H: 395, MN: 822, GL: 826, PT: 827) 3064 (Table 1) | - - | - - | Brain cropping, denoising, resizing | - - |
| 74 | Amou et al. [81] (2022) | 2D | Figshare | 233 | 3064 (Table 1) | Ax, Sag, Cor | T1c | Min-max normalization, resizing | None |
| 75 | Aurna et al. [82] (2022) | 2D | Figshare Kaggle-II Kaggle [196] | 233 - - | 3064 (Table 1) 3264 (Table 1) 4292 (H: 681, MN: 1318, GL: 1038, PT: 1255) | - - - | - - - | Resizing | Rotation, flipping, zooming, shifting, scaling |
| 76 | Chatterjee et al. [59] (2022) | 2D-3D | BraTS2019 IXI | 332 (LGG: 73, HGG: 259) 259 | 332 259 | 2D: Ax, 3D: Ax, Sag, Cor | T1c | Skull-stripping, normalization (0.5,99.5), resampling | Affine, flipping |
| 77 | Chitnis et al. [197] (2022) | 2D | Kaggle-II | - | 3264 (Table 1) | - | - | Resizing | Autoaugment |
| 78 | Coupet et al. [135] (2022) | 2D-3D | BraTS2018 BraTS2020 | 284 (Table 1) 369 (Table 1) | 50,812 | Ax | T1, T1c, T2, Flair | Histogram & min-max normalization | Rotation, deformations, shearing, zooming, flipping |
| 79 | Dang et al. [98] (2022) | 3D | BraTS2019 | 335 (Table 1) | 335 (Table 1) | Ax, Sag, Cor | T1, T1c, T2, Flair | Segmentation, gamma correction, window setting optimization | (oversampling) Rotation |
| 80 | Danilov et al. [146] (2022) | 3D 2D | Private | 707 (G.I: 189, G.II: 133, G.III: 127, G.IV: 258) | 707 17,730 | Ax, Sag, Cor Ax, Sag, Cor | T1c T1c | Z-score normalization, resampling ImageNet standardization | - Rotation, scaling, mirroring |
| 81 | Ding et al. [57] (2022) | 2D-3D | Private TCIA + Private | 101 (LGG: 58, HGG: 43) 50 (LGG: 25, HGG: 25) | 3 slices as channels | Ax, Sag, Cor | T1c | Tumor ROI, normalization, resizing | - |
| 82 | Ekong et al. [198] (2022) | 2D | BraTS2015 IXI Figshare | - - - | (total) 4000 (H: 1000, MN: 10,000, GL: 1000, PT: 1000) | - - - | - T1, T2 T1c | Resizing, normalization, denoising, BFC, registration, tumor segmentation | Shifting, Rotation, Brightening, Image enlargement, Flipping |
| 83 | Gao et al. [112] (2022) | 3D | Private | 39,210 | 39,210 | Ax, Sag, Cor | T1, T2, T1c | Z-score normalization, resampling | - |
| 84 | Gaur et al. [199] (2022) | 2D | Kaggle-II | - | 2870 | - | - | Resizing | Gaussian Noise |
| 85 | Guo et al. [150] (2022) | 3D | CPM-RadPath2020 | 221 (Table 1) | 221 | Ax, Sag, Cor | T1, T1c, T2, Flair | BFC, skull-stripping, co-registration, tumor segmentation | Rotation, resizing, scaling, gaussian noise, CE |
| 86 | Gupta et al. [95] (2022) | 2D | Kaggle-II | - | 3264 (Table 1) | - | - | CE | CycleGAN |
| 87 | Gurunathan and Krishnan [200] (2022) | 2D | BraTS | - | 260 (LGG: 156, HGG: 104) | Ax, Sag, Cor | T1, T2 | Resizing, tumor segmentation | Rotation, shifts, reflection, flipping, scaling, shearing |
| 88 | Haq et al. [90] (2022) | 2D | Figshare | 233 (Table 1) | 3064 (Table 1) | - | T1c | Resizing | (2) Zooming |
| 89 | Hsu et al. [131] (2022) | 3D | BraTS2020 CPM-RadPath2020 | 369 (Table 1) 270 (Table 1) | 369 270 | Ax, Sag, Cor | T1, T1c, T2, Flair | Sampling patches, z-score normalization, tumor segmentation | Rotation, flipping, affine translation |
| 90 | Isunuri and Kakarla [201] (2022) | 2D | Figshare | - | 3064 (Table 1) | - | T1c | Resizing, Normalization | - |
| 91 | Jeong et al. [113] (2022) | 2D | BraTS2017 | 285 (Table 1) | 1445 (largest slice ± 8) | Ax, Sag, Cor | T1, T1c, T2, Flair | Resizing, z-score normalization | Rotation, flipping |
| 92 | Kazemi et al. [108] (2022) | 2D | Figshare 1 TCIA 2 | 233 20 | 1500 (MN: 1000, GL: 800, PT: 600) 8798 | - - | T1c T1c | Resizing | - |
| 93 | Khazaee et al. [202] (2022) | 2D | BraTS2019 | - | 26,904 (LGG: 13,671, HGG: 13,233) | - | T1c, T2, Flair | - | Rotation, flipping |
| 94 | Kibriya et al. [122] (2022) | 2D | Figshare | 233 (Table 1) | 3064 (Table 1) | - | - | Min-max normalization, resizing | (5) Rotation, flipping, mirroring, adding noise |
| 95 | Koli et al. [203] (2022) | 2D | Kaggle-III Figshare | - - | 253 (Table 1) 3064 (Table 1) | - - | - - | - | Rotation |
| 96 | Lakshmi and Rao [204] (2022) | 2D | Figshare | - | 3064 | - | T1c | - | - |
| 97 | Maqsood et al. [114] (2022) | 2D - | Figshare BraTS2018 | 233 284 (Table 1) | 3064 (Table 1) - | - - | T1c - | CE, tumor segmentation, z-score normalization | - |
| 98 | Murthy et al. [205] (2022) | 2D | Kaggle-III | - | 253 (Table 1) | - | - | Median filtering, CE, tumor segmentation | - |
| 99 | Nayak et al. [206] (2022) | 2D | Figshare | - | 3260 (196 H, 3064 Table 1) | Ax, Sag, Cor | T1c | Noise removal, gaussian blurring, min-max normalization | (21) Rotation, Shifting, Zooming |
| 100 | Rajinikanth et al. [124] (2022) | 2D | TCIA | - | 2000 (GL = 1000, GB = 1000) | Ax | - | - | - |
| 101 | Rasool et al. [125] (2022) | 2D | Figshare | 233 | 3064 (Table 1) | Ax, Sag, Cor | T1c | - | Yes, not specified |
| 102 | Raza et al. [207] (2022) | 2D | Figshare | 233 (Table 1) | 3064 (Table 1) | Ax, Sag, Cor | T1c | Resizing | - |
| 103 | Rizwan et al. [208] (2022) | 2D | Figshare REMBRANDT | 230 (MN: 81, GL: 90, PT: 59) 70 (G.II: 32, G.III: 18, G.IV: 20) | 3061 (MN: 707, GL: 1425, PT: 929) 513 (G.II: 204, G.III: 128, G.IV: 181) | Ax, Sag, Cor - | T1c T1c | Noise, cropping, resizing | (5) Salt-noise, grayscaling |
| 104 | Samee et al. [209] (2022) | 2D | Figshare | 236 (MN: 83, GL: 90, PT: 63) | 3075 (MN: 708, GL: 1427, PT: 940) | Ax, Sag, Cor | T1c | Grayscaling | (16) Rotation, zooming, brightening |
| 105 | Samee et al. [147] (2022) | 3D | BraTS2015 | 65 (LGG: 14, HGG: 51) | 1056 (LGG: 176, HGG: 880) | - | T1, T1c, T2, Flair | Resizing, denoising, CE, tumor segmentation | - |
| 106 | Sangeetha et al. [210] (2022) | 3D | Private | 45 | 45 | Ax, Sag, Cor | T2 | Min-max normalization | (14) Rotation, translation |
| 107 | Saravanan et al. [109] (2022) | 2D | BRATS REMBRANDT | 274 135 | 1200 - | - - | - - | Resizing | - |
| 108 | Sekhar et al. [126] (2022) | 2D | Figshare | 233 (Table 1) | 3064 (Table 1) | Ax, Sag, Cor | T1c | Min-max normalization, resizing | Yes but not specified |
| 109 | Senan et al. [99] (2022) | 2D | Kaggle-II | - | 3060 (H: 396, MN: 937, GL: 826, PT: 901) | Ax, Sag, Cor | - | Denoising, min-max normalization, resizing, CE | (H: 11, MN: 5, GL:6, PT: 5) Rotation, cutting, zooming, patching, padding, brightening |
| 110 | Srinivas et al. [211] (2022) | 2D | Kaggle | - | 256 (Benign: 158, Malignant: 98) | - | - | Brain cropping, z-score normalization, resizing | Scaling, cropping, resizing, flipping, rotation, geometric transforms |
| 111 | Tandel et al. [75] (2022) | 2D | Rembrandt | 112 (LGG = 44, HGG = 68) | - | Ax | T1, T2, Flair | None 1, Skull-stripping 2, tumor ROI 3 | Scaling, rotation |
| 112 | Tripathi and Bag [83] (2022) | 2D | TCIA | 322 (LGG:159, HGG: 163) | 7392 (LGG: 5088, HGG: 2304) | - | T2 | Skull-stripping, segmentation | Rotation, flipping, scaling, cropping, translation |
| 113 | Tripathi and Bag [141] (2022) | 3D | BraTS2019 TCGA-GBM TCGA-LGG LGG-1p19qdeletion [212] | 202 158 119 138 | (total) 617 (LGG: 331, HGG: 286) | Ax, Sag, Cor | T1c, T2, Flair | Co-registration, skul-stripping, resampling, tumor segmentation | Flipping, shifting, rotation, cropping |
| 114 | Tummala et al. [136] (2022) | 2D | Figshare | 233 | 3064 (Table 1) | Ax, Sag, Cor | T1c | - | - |
| 115 | Vankdothu et al. [213] (2022) | 2D | Kaggle-II | - | 3264 | - | - | Grayscaling, rotation, denoising, tumor ROI | - |
| 116 | Wang et al. [132] (2022) | 3D | CPM-RadPath2020 | 270 | 270 | Ax, Sag, Cor | T1, T1c, T2, Flair | Resizing, brain cropping | Rotation, flipping, scaling, jittering |
| 117 | Xiong et al. [115] (2022) | 2D | Private | 211 (AS: 54, OG: 67, GB: 90) | 633 | Ax, Sag, Cor | ADC, T1c, Flair | Resampling, skull-stripping, z-score normalization, min-max normalization | - |
| 118 | Xu et al. [118] (2022) | 2D | BraTS2020 | 369 (Table 1) | 369 | Ax | T1c, T1, T2 | BFC, skull-stripping, registration, z-score normalization 1 tumor ROI 2 | - |
| 119 | Yazdan et al. [214] (2022) | 2D | Kaggle-II | - | 3264 (Table 1) | - | T1, T2, Flair | Denoising | None |
| 120 | Zahoor et al. [103] (2022) | 2D | Kaggle 1 Figshare 2 | - | 1994 (H) 3064 | - Ax, Sag, Cor | - - | Resizing | Rotation, sharing, scaling, reflection |
| 121 | AlTahhan et al. [127] (2023) | 2D | Figshare Kaggle-II Kaggle-I | - - - | 2880 (H: 396, MN: 825, GL: 829, PT: 830) | - - - | T1c | - | - |
| 122 | Al-Zoghby et al. [137] (2023) | 2D | Figshare | 233 | 3064 (Table 1) | Ax, Sag, Cor | T1c | Resizing | - |
| 123 | Anagun [215] (2023) | 2D | Figshare | - | 3064 (Table 1) | Ax, Sag, Cor | T1c | Brain cropping, HE, denoising | (9) Flipping, rotation, shifting, zooming |
| 124 | Anand et al. [91] (2023) | 2D | TCGA-LGG | 110 | 3929 | - | Flair | - | Flipping |
| 125 | Apostolopoulos et al. [216] (2023) | 2D | Kaggle [217] Kaggle [218] | - | 26,249 (H: 2000, MN: 7866, GL: 8208, PT: 8175) | - | - | - | - |
| 126 | Asif et al. [138] (2023) | 2D | Figshare | 233 (Table 1) | 3064 (Table 1) | - | - | Resizing, denoising | - |
| 127 | Athisayamani et al. [110] (2023) | 2D | Figshare | - | - | - | - | Denoising, skull-stripping, brain segmentation | Rotation, flipping |
| 128 | Bairagi et al. [111] (2023) | 2D | BraTS2013 BraTS2015 OPEN-I NLM | - | 65 327 229 | - | T1, T2, Flair | Resizing | (40) Resizing, cropping, rotation, reflection, shear, translation |
| 129 | Deepa et al. [84] (2023) | 2D | BraTS2018 1 Figshare 2 | - - | - 3064 (Table 1) | - | - T1c | Min-max normalization, tumor segmentation | Flipping, translation, rotation, brightening, CE, gaussian noise |
| 130 | El-Wahab et al. [219] (2023) | 2D | Figshare | 233 | 3064 (Table 1) | Ax, Sag, Cor | T1c | - | - |
| 131 | Hossain et al. [116] (2023) | 2D | Kaggle-II | - | 3264 | - | - | - | (4) Rescaling, shearing, zooming, flipping |
| 132 | Hussain et al. [148] (2023) | 3D | BraTS2020 | 369 (Table 1) | 369 (Table 1) | Ax, Sag, Cor | T1, T1c, T2, Flair, Segmentation | Denosing, tumor segmentation | - |
| 133 | Kibriya et al. [119] (2023) | 2D | Kaggle-III 1 Kaggle-I 2 | - - | 253 (Table 1) 3000 (Table 1) | - - | - - | - - | - - |
| 134 | Krishnapriya and Karuna [92] (2023) | 2D | Kaggle-III | - | 253 (Table 1) | - | - | Brain cropping | (Oversampling) Rotation, shifting, rescaling, mirroring |
| 135 | Kumar et al. [128] (2023) | 2D | ACRIN-DSC-MR-BRAIN | - | 1731 | - | T1 | Resizing, grayscaling, CE, tumor segmentation | - |
| 136 | Mahmud et al. [220] (2023) | 2D | Kaggle-II CPTAC-GB ACRIN-FMISO-BRAIN | - 189 45 | 3264 (Table 1) - - | - | - | Normalization, smoothing | Mirroring, rotation, shifting, zooming |
| 137 | Muezzinoglu et al. [221] (2023) | 2D | Kaggle-II | - | 3264 (Table 1) | - | - | Resizing, patch division | - |
| 138 | Özkaraca et al. [222] (2023) | 2D | Kaggle [223] (combines Figshare, Kaggle-I, Kaggle-II) | - | total: 7021 (H: 2002, MN: 1627, GL: 1623, PT: 1769) | - | - | - | - |
| 139 | Özkaya and Şağıroğlu [224] (2023) | 2D | BraTS2020 | 369 | (undersampling slices HGG) | Ax | T1c, T2, Flair | Tumor segmentation, min-max normalization | - |
| 140 | Rasheed et al. [225] (2023) | 2D | Figshare | 233 | 3064 (Table 1) | Ax, Sag, Cor | T1c | Resizing, normalization | None |
| 141 | Rui et al. [149] (2023) | 2D | Private | 42 (G.II: 18, G.III: 10, G.IV: 14) | 1176 (G.II: 504, G.III: 280, G.IV: 392) | Ax | T1c, T2, Flair | Brain cropping, normalization | - |
| 142 | Shirehjini et al. [123] (2023) | 2D | Private | 58 (G.I: 8, G.II: 16, G.III: 10, G.IV: 22) | 1061 (T1c: 229, T1: 251, T2: 299, Flair: 282) | Ax, Sag, Cor | T1, T1c, T2, Flair | Resizing, min-max normalization | - |
| 143 | Srinivasan et al. [226] (2023) | 2D | REMBRANDT | - | 3100 | - | - | Denoising, tumor segmentation | - |
| 144 | Tandel et al. [139] (2023) | 2D | REMBRANDT | 112 (LGG: 44, HGG: 68) | - | Ax, Sag, Cor | T1, T2, Flair | Resizing | Rotation, scaling |
| 145 | van der Voort et al. [117] (2023) | 3D | Erasmus MC [227] Haaglanden Medical Center BraTS REMBRANDT CPTAC-GBM Ivy GAP Amsterdam UMC Brain-tumor-progression University Medical Center Utrecht TCGA-LGG TCGA-GBM | 816 279 168 109 51 39 20 20 6 107 133 | (total) 1412 (G.II: 277, G.III:173, G.IV: 962) | Ax, Sag, Cor | T1, T1c, T2, Flair | Registration, resampling, BFC, skull-stripping, brain cropping, z-score normalization | (2) Cropping, rotation, brightening, CE |
| 146 | Wu et al. [157] (2023) | 2D | BraTS2019 | 326 (LGG:76, HGG: 250) | slices with tumor | - | T1, T1c, T2, Flair | Z-score normalization, center-cropping | Rotation, translation, clipping |
| No. | Reference | Classification Task | Data Split | Architecture | Acc% | AUC% | F1% | Class Performance % | ||
|---|---|---|---|---|---|---|---|---|---|---|
| Method | Ratio | Level | ||||||||
| 1 | Ge et al. [100] (2018) | LGG vs. HGG | Three-way | 60:20:20 | Patient | [T1c] CNN [T2] CNN [Flair] CNN [Modality-ensemble] CNN | 83.73 69.74 75.40 90.87 | - - - - | - - - - | LGG = 82.54, HGG = 84.92 LGG = 59.52, HGG = 80.15 LGG = 76.19, HGG = 74.60 LGG = 90.48, HGG = 91.27 |
| 2 | Ge et al. [73] (2018) | LGG vs. HGG | Three-way | 60:20:20 | Patient | Custom CNN 1 [whole image] 2 [tumor ROI] | 84.21 89.47 | - - | - - | - LGG = 90.48, HGG = 86.67 |
| 3 | Pereira et al. [74] (2018) | LGG vs. HGG | Three-way | 60:20:20 | Patient | Custom CNN ROI: brain, Std.: image ROI: brain, Std.: brain ROI: tumor, Std.: image ROI: tumor, Std.: brain | 89.50 89.50 87.70 92.98 | 88.57 89.13 88.41 98.41 | 86.45 86.43 85.08 90.96 | LGG = 80.00, HGG = 92.90 LGG = 80.00, HGG = 92.86 LGG = 86.67, HGG = 88.10 LGG = 86.67, HGG = 95.24 |
| 4 | Yang et al. [101] (2018) | LGG vs. HGG | 5-fold CV, Test | 80:20 | Patient | TL GoogLeNet TL AlexNet GoogLeNet AlexNet | 94.50 92.70 90.90 85.50 | 96.80 96.60 93.90 89.40 | - - - - | - - - - |
| 5 | Abd-Ellah et al. [167] (2019) | H vs. LGG vs. HGG | Three-way | 65:10:25 | - | Parallel CNNs | 97.44 | - | - | (R) 97.00, (S) 98.00 |
| 6 | Anaraki et al. [168] (2019) | H vs. G.II vs. G.III vs. G.IV G.II vs. G.III vs. G.IV MN vs. GL vs. PT | Hold-out | 80:20 | - | Custom CNN + GA | 93.10 90.90 94.20 | - - - | - - - | H = 99.80, G.II = 88.40, G.III = 86.80, G.IV = 97.40 - MN = 87.80, GL = 98.30, PT = 96.5 |
| 7 | Deepak and Ameer [76] (2019) | MN vs. GL vs. PT | 5-fold CV | Patient | TL GoogLeNet -KNN -SVM -SoftMax | 98.00 97.80 92.30 | - - - | - 97.00 - | - MN = 96.00, GL = 97.90, PT = 98.90 - | |
| 8 | Hemanth et al. [169] (2019) | MT vs. MN vs. GL vs. AS | - | - | - | Custom CNN | 96.40 | - | - | MT = 94.00, MN = 93.00, GL = 93.00, AS = 89.00 |
| 9 | Kutlu and Avcı [120] (2019) | Benign vs. Malignant | 5-fold CV | 70:30 | - | TL AlexNet-DWT -LSTM -SVM -KNN | 98.66 92.09 85.91 | 99.00 - - | - - - | B = 99.33, M = 98.66 B = 96.04, M = 92.08 B = 92.95, M = 85.91 |
| 10 | Lo et al. [102] (2019) | G.II vs. G.III vs. G.IV | 10-fold CV | - | TL AlexNet AlexNet | 97.90 61.42 | 99.91 82.22 | - - | G.II = 96.90, G.III = 96.80, G.IV = 99.10 - | |
| 11 | Muneer et al. [171] (2019) | G.I vs. G.II vs. G.III vs. G.IV | Hold-out | 70:30 | - | TL VGG19 Wndchrm | 94.64 92.86 | - - | 93.71 92.32 | - - |
| 12 | Rajini [172] (2019) | H vs. G.II vs G.III vs. G.IV MN vs. GL vs. PT | Hold-out | 80:20 | - | Custom CNN | 96.77 98.16 | 95.65 97.93 | 93.54 97.21 | H = 99.80, G.II = 89.20, G.III = 85.27, G.IV = 98.00 MN = 93.69, GL = 99.15, PT = 99.13 |
| 13 | Rahmathunneesa and Muneer [173] (2019) | G.I vs. G.II vs. G.III vs. G.IV | Hold-out | 70:30 | - | TL AlexNet TL GoogLeNet TL InceptionV3 TL ResNet50 | 92.98 85.96 86.84 96.05 | - - - - | 96.06 91.71 91.62 97.76 | G.I = 96.67, G.II = 93.44, G.III = 92.31, G.IV = 89.09 G.I = 86.67, G.II = 98.36, G.III = 63.46, G.IV = 92.73 G.I = 76.67, G.II = 93.44, G.III = 90.38, G.IV = 87.27 G.I = 93.33, G.II = 91.80, G.III = 100.00, G.IV = 100.00 |
| 14 | Sajjad et al. [174] (2019) | G.I vs. G.II vs. G.III vs. G.IV MN vs. GL vs. PT | Three-way | 50:25:25 | - | TL VGG-19 w/o DA w/ DA w/o DA w/ DA | 87.38 90.67 - 94.58 | - - - - | - - - - | G.I = 90.03, G.II = 89.91, G.III = 84.11, G.IV = 85.50 G.I = 95.54, G.II = 92.66, G.III = 87.77, G.IV = 86.71 MN = 90.22, GL = 93.12, PT = 89.08 MN = 94.05, GL = 96.14, PT = 93.21 |
| 15 | Sultan et al. [175] (2019) | MN vs. GL vs. PT G.II vs. G.III vs. G.IV | Hold-out | 68:32 | - | Custom CNN | 96.13 98.70 | - - | - - | MN = 95.50, GL = 94.40, PT = 93.40 G.II = 100, G.III = 95.00, G.IV = 100.00 |
| 16 | Swati et al. [77] (2019) | MN vs. GL vs. PT | 5-fold CV | Patient | Block-wise TL VGG19 Block-wise TL VGG16 TL AlexNet | 94.82 94.65 89.95 | - - - | 91.73 91.50 86.83 | GL = 95.97, MN = 89.98, PT = 96.81 (R) 93.51, (S) 94.56 (R) 89.10, (S) 89.84 | |
| 17 | Toğaçar et al. [176] (2019) | H vs. T | Hold-out | 70:30 | - | Custom CNN GoogLeNet AlexNet VGG16 | 96.05 89.66 87.93 84.48 | 98.00 - - - | 94.12 90.32 88.52 85.25 | H = 96.00, T = 96.08 H = 84.85, T = 96.00 H = 84.38, T = 92.31 H = 81.25, T = 88.46 |
| 18 | Amin et al. [177] (2020) | H vs. T | Hold-out | 50:50 | - | Custom CNN | 1 97.00 2 98.00 3 100.00 4 96.00 5 97.00 | - - - - - | - - - - - | H = 97.00, T = 97.00 H = 99.00, T = 95.00 H = 100.00, T = 100.00 H = 98.00, T = 92.00 H = 99.00, T = 93.00 |
| 19 | Afshar et al. [178] (2020) | MN vs. GL vs. PT | Hold-out | 80:20 | Custom CNN | 92.45 | 98.00 | - | MN = 75.35, GL = 96.85, PT = 98.90 | |
| 20 | Badža and Barjaktarović [158] (2020) | MN vs. GL vs. PT | 10-fold CV | 60:20:20 | Patient Patient Image Image | Custom CNN w/o DA w/ DA w/o DA w/ DA | 84.45 88.48 95.40 96.56 | - - - - | 81.86 86.97 94.93 96.11 | MN = 62.70, GL = 90.20, PT = 91.30 MN = 71.60, GL = 92.80, PT = 95.00 MN = 89.80, GL = 96.20, PT = 98.40 MN = 90.20, GL = 98.00, PT = 99.20 |
| 21 | Banerjee et al. [56] (2020) | LGG vs. HGG | Hold-out | Patient | 2 VolumeNet 1 SliceNet 1 PatchNet 1 TL ResNet 1 TL VGGNet | 94.74 85.96 82.45 72.30 68.07 | - - - - - | - - - - - | LGG = 94.29, HGG = 96.00 LGG = 80.00, HGG = 88.10 LGG = 74.67, HGG = 85.24 LGG = 72.06, HGG = 71.43 LGG = 69.33, HGG = 67.62 | |
| 22 | Bhanothu et al. [179] (2020) | MN vs. GL vs. PT | Hold-out | 80:20 | - | F-RCNN + VGG16 | - | - | - | (P) GL = 75.18, MN = 68.18, PT = 97.28 |
| 23 | Çinar and Yildirim [180] (2020) | H vs. T | - | - | - | Custom CNN ResNet50 DenseNet201 AlexNet InceptionV3 GoogLeNet | 97.01 92.54 91.04 89.55 88.07 71.64 | - - - - - | 96.90 93.33 92.30 90.05 81.81 66.03 | H = 94.70, T = 100.00 H = 89.74, T = 96.40 H = 85.71, T = 100.00 H = 87.17, T = 92.85 H = 81.81, T = 100.00 H = 66.03, T = 92.85 |
| 24 | Ge et al. [93] (2020) | LGG vs. HGG | Hold-out | 60:20:20 | Patient | Modality-ensemble Semi-supervised CNN w/o DA w/ DA | 89.53 90.70 | - - | - - | LGG = 78.26, HGG = 93.65 LGG = 84.35, HGG = 93.01 |
| 25 | Ghassemi et al. [85] (2020) | MN vs. GL vs. PT | 5-fold CV | Patient Patient Image | Custom CNN w/o pre-training w/ GAN pre-training w/ GAN pre-training | 91.70 93.01 95.60 | - - - | 90.54 92.10 95.10 | MN = 79.86, GL = 94.96, PT = 95.67 MN = 84.82, GL = 94.92, PT = 96.92 MN = 89.98, GL = 96.83, PT = 97.93 | |
| 26 | Ismael et al. [159] (2020) | MN vs. GL vs. PT | Hold-out | 80:20 | Patient Image | ResNet50 | 97.82 99.34 | - - | 97.00 99.00 | MN = 93.00, GL = 99.00, PT = 99.00 MN = 98.00, GL = 99.00, PT = 100.00 |
| 27 | Khan et al. [181] (2020) | H vs. T | Three-way | 70:20:10 | - | Custom CNN VGG16 ResNet50 InceptionV3 | 100.00 96.00 89.00 75.00 | 100.00 96.00 89.00 75.00 | 100.00 97.00 90.00 74.00 | H = 100.00, T = 100.00 H = 92.85, T = 100.00 H = 85.71, T = 92.86 H = 76.92, T = 73.33 |
| 28 | Ma and Jia [129] (2020) | AS vs. OG vs. GB | Three-way | 70:10:20 | Patient | [WSI] 2D ResNet50 [MRI] 3D DenseNet121 [WSI-MRI] Ensemble 2D-3D | 83.33 71.10 88.90 | - - - | 91.40 82.90 94.30 | - - - |
| 29 | Mohammed and Al-Ani [182] (2020) | H vs. EP vs. MN vs. MB | Three-way | 70:10:20 | - | Custom CNN | 96.00 | - | - | - |
| 30 | Mzoughi et al. [142] (2020) | LGG vs. HGG | - | - | Patient | Custom CNN | 96.49 | - | - | - |
| 31 | Naser and Deen [183] (2020) | G.II vs. G.III | 5-fold CV | - | TL VGG16 | 95.00 | 97.00 | - | G.II = 98.00, G.III = 93.00 | |
| 32 | Noreen et al. [184] (2020) | MN vs. GL vs. PT | Hold-out | 80:20 | - | InceptionV3 DenseNet201 | 99.34 99.51 | 99.00 100.00 | - - | MN = 99.00, GL = 100.00, PT = 100.00 MN = 99.00, GL = 100.00, PT = 99.00 |
| 33 | Pei et al. [143] (2020) | AS vs. OG vs. GB | Three-way | 67:11:22 | Patient | Custom CNN | 63.90 | - | - | - |
| 34 | Rehman et al. [104] (2020) | MN vs. GL vs. PT | Three-way | 70:15:15 | - | AlexNet GoogLeNet VGG16 TL AlexNet TL GoogLeNet TL VGG16 | 97.39 98.04 98.69 95.77 95.44 89.79 | - - - - - - | - - - - - - | - - - - - - |
| 35 | Saxena et al. [185] (2020) | H vs. T | Three-way | 70:20:10 | - | TL ResNet50 TL VGG16 TL InceptionV3 | 95.00 90.00 55.00 | 95.00 90.00 55.00 | 95.20 90.90 68.90 | - - - |
| 36 | Sharif et al. [186] (2020) * | LGG vs. HGG | 10-fold CV, Test | 70:30 | - | Ensemble TL InceptionV3-DRLBP | 1 98.30 2 97.80 3 96.90 4 92.50 | - - - - | - - - - | - - - - |
| 37 | Tandel et al. [105] (2020) * | H vs. T H vs. LGG vs. HGG H vs. AS vs. OG vs. GB AS-II vs. AS-III vs. OG-2 vs. OG-3 vs. GB H vs. AS-II vs. AS-III vs. OG-2 vs. OG-3 vs. GB | 2-fold CV, 5-fold CV, 10-fold CV | - | TL AlexNet | 100.00 95.97 96.65 87.14 93.74 | - - - - - | 100.00 94.80 94.78 86.89 91.97 | 100.00 94.85 94.17 84.40 91.51 | |
| 38 | Toğaçar et al. [96] (2020) * | H vs. T | Hold-out | 70:30 | - | Ensemble TL AlexNet-VGG16-RFE-SVM TL AlexNet TL VGG16 | 96.77 90.32 87.10 | - - - | 96.77 89.89 87.23 | (R) 97.83, (S) 95.74 (R) 95.24, (S) 86.27 (R) 87.23, (S) 86.96 |
| 39 | Vimal Kurup et al. [187] (2020) | MN vs. GL vs. PT | Hold-out | 80:20 | - | Custom CNN | 92.60 | 96.33 | 93.33 | GL = 96.00, MN = 94.00, PT = 94.00 |
| 40 | Zhuge et al. [58] (2020) | LGG vs. HGG | 5-fold CV, Test | 60:20:20 | Patient | TL 2D ResNet50 w/o DA w/ DA 3D ConvNet | 89.10 96.30 97.10 | - - - | - - - | (R) 86.40, (S) 91.70 (R) 93.50, (S) 97.20 (R) 94.70, (S) 96.80 |
| 41 | Alaraimi et al. [78] (2021) | MN vs. GL vs. PT | Hold-out | 80:20 | - | TL VGG16 TL GoogLeNet TL AlexNet | 100.00 98.50 94.40 | 98.60 98.10 97.60 | - - - | - - - |
| 42 | Ayadi et al. [86] (2021) | 1 MN vs. GL vs. PT 2 G.I vs. G.II vs. G.III vs. G.IV 3 H vs. T 3 H vs. LGG vs. HGG 3 H vs. AS vs. OG vs. GB 3 AS-II vs. AS-III vs. OG-II vs. OG-III vs. GB 3 H vs. AS-II vs. AS-III vs. OG-II vs. OG-III vs. GB 2 G.I vs. G.II vs. G.III vs. G.IV 3 H vs. T 3 H vs. LGG vs. HGG 3 H vs. AS vs. OG vs. GB 3 AS-II vs. AS-III vs. OG-II vs. OG-III vs. GB 3 H vs. AS-II vs. AS-III vs. OG-II vs. OG-III vs. GB | 5-fold CV | 70:30 | - | Custom CNN [w/o DA] Custom CNN [w/ DA] | 94.74 90.35 100.00 95.00 94.41 86.08 92.09 93.71 100.00 97.22 97.02 88.86 95.72 | - - - - - - - - - - - - - | 94.19 90.38 100.00 91.35 92.89 86.85 89.84 93.88 100.00 95.45 95.75 87.52 91.76 | MN = 89.68, GL = 94.46, PT = 99.03 G.I = 88.23, G.II = 93.33, G.III = 84.00, G.IV = 96.00 H = 100.00, T = 100.00 H = 100.00, LGG = 100.00, HGG = 70.00 H = 99.00, AS = 96.36, OG = 92.00, GB = 80.00 AS-II = 85.71, AS-III = 90.00, OG-II = 86.66, OG-III = 80.00, GB = 85.71 H = 100.00, AS-II = 85.71, AS-III = 90.00, OG-II =86.66, OG-III = 80.00, GB = 82.85 G.I = 90.79, G.II = 95.66, G.III = 90.84, G.IV = 98.22 H = 100.00, T = 100.00 H = 100.00, LGG = 98.40, HGG = 86.00 H = 99.80, AS = 97.09, OG = 90.40, GB = 93.71 AS-II = 88.50, AS-III = 94.00, OG-II = 96.00, OG-III = 62.00, GB = 90.85 H = 100.00, AS-II = 93.14, AS-III = 88.00, OG-II = 98.66, OG-III = 76.00, GB = 94.85 |
| 43 | Bashir-Gonbadi and Khotanlou [188] (2021) | MN vs. GL vs. PT H vs. LGG vs. HGG H vs. AS vs. MN vs. PT vs. LGG vs. HGG | Three-way | - | - | Auto-encoder CNN | 98.50 99.10 99.30 | - - - | 98.6 99.2 99 | MN = 97.90, GL = 99.00, PT = 98.60 H = 98.10, LGG = 99.00, HGG = 97.70 H = 100.00, AS = 100.00, MN = 100.00, PT = 100.00, LGG = 96.60, HGG = 97.80 |
| 44 | Chakrabarty et al. [144] (2021) | LGG vs. HGG vs. MT vs. PT vs. AN vs. H vs. MN | 5-fold CV, Test | 80:20 | Patient | Custom CNN | 91.95 | 96.93 | 93.86 | LGG = 81.50, HGG = 87.00, MT = 98.60, PA = 100.00, AN = 100.00, H = 89.70, MN = 93.30 |
| 45 | Decuyper et al. [140] (2021) | LGG vs. HGG | Three-way | 73:11:16 | Patient | Custom CNN | 90.00 | 93.98 | - | LGG = 89.80, HGG = 90.16 |
| 46 | Díaz-Pernas et al. [151] (2021) | MN vs. GL vs. PT | 5-fold CV | Patient | Custom CNN | 97.30 | - | - | GL = 99.00, MN = 93.00, PT = 98.00 | |
| 47 | Gab Allah et al. [94] (2021) * | MN vs. GL vs. PT | Three-way | 70:15:15 | - | 1 VGG19 2 VGG19 | 98.54 96.59 | - - | - - | GL = 100, MN = 90.20, PT = 96.92 - |
| 48 | Gilanie et al. [152] (2021) | AS-1 vs. AS-II vs. AS-III vs. AS-IV | Hold-out | 50:25:25 | Patient | Custom CNN | 95.56 | - | - | (Acc) G.I = 99.06, G.II = 94.01, G.III = 95.31, G.IV = 97.85 |
| 49 | Gu et al. [189] (2021) | 1 AS vs. OG vs. GB 2 MN vs. GL vs. PT | 5-fold CV | 70:30 | - | Custom CNN | 97.64 96.34 | - - | 94.18 94.69 | AS = 96.86, OG = 91.27, GB = 93.09 MN = 88.75, GL = 94.87, PT = 98.37 |
| 50 | Guan et al. [153] (2021) | MN vs. GL vs. PT | 5-fold CV | 70:30 | Patient | EfficientNet | 98.04 | - | 97.79 | MN = 96.89, GL = 97.82, PT = 99.24 |
| 51 | Gull et al. [154] (2021) | H vs. T | 10-fold CV, Test | 70:10:20 | Patient | GoogLeNet | 1 96.49 2 97.31 3 98.79 | - - - | 97.27 97.92 99.12 | H = 94.17, T = 97.80 H = 95.83, T = 98.14 H = 97.37, T = 99.42 |
| 52 | Gutta et al. [106] (2021) | G.I vs. G.II vs. G.III vs. G.IV | Three-way | 70:15:15 | Patient | Modality-ensemble CNN GrB RF SVM | 87.00 64.00 58.00 56.00 | - - - - | - - - - | G.I = 100.00, G.II = 82.35, G.III = 76.92, G.IV = 92.50 G.I = 0.00, G.II = 23.53, G.III = 42.31, G.IV = 90.74 G.I = 0.00, G.II = 35.23, G.III = 7.69, G.IV = 92.50 G.I = 33.00, G.II = 70.00, G.III = 34.62, G.IV = 72.00 |
| 53 | Hao et al. [79] (2021)* | LGG vs. HGG | Three-way | 60:20:20 | Patient | AlexNet TL AlexNet | - - | 71.93 79.91 | - - | - - |
| 54 | Irmak [190] (2021) | H vs. T H vs. MN vs. GL vs. PT vs. MT G.II vs. G.III vs. G.IV | 5-fold CV, Test | 60:20:20 | - | Custom CNN | 99.33 92.66 98.14 | 99.95 99.81 99.94 | - - - | H = 100, T = 98.80 H = 92.10, MN = 94.20, GL = 94.40, PT = 88.00, MT = 90.00 G.II = 97.91, G.III = 100, G.IV = 97.01 |
| 55 | Kader et al. [191] (2021) | H vs. T | - | - | - | DWAE model | 99.30 | - | 96.55 | H = 96.90, T = 95.60 |
| 56 | Kader et al. [192] (2021) * | H vs. T | 5-fold CV | - | Custom CNN GoogLeNet AlexNet VGG16 | 99.25 89.66 87.66 84.48 | - - - - | 95.23 90.32 88.52 85.25 | (R) 95.89, (S) 93.75 (R) 84.85, (S) 96.00 (R) 84.38, (S) 92.31 (R) 81.25, (S) 8.48 | |
| 57 | Kakarla et al. [193] (2021) | MN vs. GL vs. PT | 5-fold CV, Test | 80:20 | - | Custom CNN | 97.42 | - | - | - |
| 58 | Kang et al. [133] (2021) * | H vs. T H vs. T H vs. MN vs. GL vs. PT | Hold-out | 80:20 | - | Ensemble TL CNNs DenseNet169-InceptionV3-ResNeXt50-AdaBoost DenseNet121-ResNeXt-MnasNet DenseNet169-ShuffleNet-MnasNet | 1 92.16 2 98.83 3 91.58 | - - - | - - - | - - - |
| 59 | Khan et al. [87] (2021) | LGG vs. HGG | - | - | - | VGG19 (w/o DA) VGG19 (w/ DA) | 90.03 94.06 | - - | - - | LGG = 91.05, HGG = 84.03 LGG = 96.05, HGG = 89.09 |
| 60 | Kumar et al. [88] (2021) | MN vs. GL vs. PT | 5-fold CV | - | TL ResNet50 (w/o DA) TL ResNet50 (w/ DA) | 97.48 97.08 | - - | 97.20 97.20 | 97.20 97.20 | |
| 61 | Masood et al. [194] (2021) | MN vs. GL vs. PT H vs. T | Hold-out | 70:30 | - | DenseNet-41-based Mask-RCNN | 98.34 97.90 | - - | - - | (Acc) MN = 97.81, GL = 98.62, PT = 98.60 (Acc) H = 98.06, T = 97.74 |
| 62 | Noreen et al. [134] (2021) * | MN vs. GL vs. PT | 10-fold CV | - | TL InceptionV3 Ensemble InceptionV3-KNN-SVM-RF TL XceptionV3 Ensemble Xception-KNN-SVM-RF | 93.31 94.34 91.63 93.79 | - - - - | 92.67 - 90.00 - | MN = 84.00, GL = 95.00, PT = 98.00 - MN = 78.00, GL = 94.00, PT = 100.00 - | |
| 63 | Özcan et al. [155] (2021) | G.II vs. G.IV | 5-fold CV, Test | 80:20 | Patient | Custom CNN AlexNet GoogLeNet SqueezeNet | 97.10 92.30 93.30 89.40 | 98.90 97.00 98.70 97.50 | 97.00 92.22 93.30 89.30 | G.II = 98.00, G.IV = 96.30 G.II = 94.00, G.IV = 90.70 G.II = 98.00, G.IV = 88.90 G.II = 92.00, G.IV = 87.00 |
| 64 | Pei et al. [97] (2021) | AS vs. OG vs. GB | Hold-out | 85:15 | Patient | [WSI] 2D CNN [MRI] 3D CNN [WSI-MRI] Ensemble 2D-3D CNNs | 77.00 69.80 80.00 | - - - | 88.60 77.10 88.60 | - - - |
| 65 | Sadad et al. [195] (2021) * | MN vs. GL vs. PT | Hold-out | 80:20 | - | Custom CNN | 99.60 | 99.00 | - | - |
| 66 | Tandel et al. [107] (2021) * | H vs. T AS-II vs. AS-III OG-2 vs. OG-3 LGG vs. HGG | 5-fold CV | Patient | Ensemble TL AlexNet, VGG16, ResNet18, GoogleNet, ResNet50 | 96.51 97.70 100.00 98.43 | 96.60 97.04 100.00 98.45 | - - - - | (R) 96.76, (S) 96.43 (R) 94.63, (S) 99.44 (R) 100.00, (S) 100.00 (R) 98.33, (S) 98.57 | |
| 67 | Toğaçar et al. [80] (2021) | MN vs. GL vs. PT | Hold-out | 80:20 | - | Custom CNN | - | - | 96.22 | MN = 94.81, GL = 98.48, PT = 95.38 |
| 68 | Yamashiro et al. [145] (2021) | LGG vs. HGG | Hold-out | 85:15 | Patient | Custom CNN | 91.30 | 92.7 | - | LGG = 69.20, HGG = 100.00 |
| 69 | Yin et al. [130] (2021) | AS vs. OG vs. GB | Hold-out | 86:14 | Patient | [WSI] 2D DenseNet [MRI] 3D DenseNet [WSI-MRI] Ensemble 2D-3D | 88.90 82.00 94.40 | - - - | 94.30 85.70 97.10 | - - - |
| 70 | Aamir et al. [156] (2022) | MN vs. GL vs. PT | 5-fold CV | Patient | Custom CNN | 98.95 | - | 97.98 | MN = 97.31, GL = 99.51, PT = 99.34 | |
| 71 | Ahmad et al. [89] (2022) | MN vs. GL vs. PT | Three-way | 60:20:20 | - | ResNet50 (w/o DA) ResNet50 (w/ CDA) ResNet50 (w/ GDA) ResNet50 (w/ CDA+GDA) | 72.63 77.52 92.30 96.25 | - - - - | 71.07 76.06 91.77 96.97 | MN = 73.94, GL = 76.92, PT = 65.05 MN = 76.76, GL = 82.87, PT = 69.89 MN = 92.25, GL = 96.15, PT = 86.56 MN = 96.47, GL = 96.50, PT = 95.70 |
| 72 | Alanazi et al. [160] (2022) | H vs. T MN vs. GL vs. PT | Three-way | 80:20, 2 Test | - | TL (on Kaggle-I) Custom CNN | 95.75 96.90 | - - | - 99.00 | - MN = 92.00, GL = 98.70, PT = 98.20 |
| 73 | Almalki et al. [121] (2022) * | H vs. MN vs. GL vs. PT MN vs. GL vs. PT | Hold-out | 80:20, 2 Test | - | Custom CNN-SVM | 98.00 97.16 | - - | - - | H = 94.70, MN = 97.30, GL = 98.80, PT = 99.40 MN = 99.20, GL = 94.71, PT = 99.40 |
| 74 | Amou et al. [81] (2022) | MN vs. GL vs. PT | Hold-out | 90:10 | - | Custom CNN VGG16 VGG19 DenseNet201 InceptionV3 ResNet50 | 98.70 97.08 96.43 94.81 92.86 89.29 | - - - - - - | 98.60 96.60 95.56 93.60 92.00 89.00 | MN = 97.00, GL = 99.00, PT = 99.00 MN = 97.00, GL = 96.00, PT = 99.00 MN = 93.00, GL = 97.00, PT = 99.00 MN = 85.00, GL = 97.00, PT = 100.00 MN = 82.00, GL = 97.00, PT = 96.00 MN = 57.00, GL = 77.00, PT = 98.00 |
| 75 | Aurna et al. [82] (2022) | H vs. MN vs. GL vs. PT | LOOCV (on dataset) | - | 2-stage Ensemble EfficientNetB0-ResNet50- Custom CNN | 98.96 | 98.90 | 99.00 | H = 100.00, MN = 99.00, GL = 98.00, PT = 99.00 | |
| 76 | Chatterjee et al. [59] (2022) | H vs. LGG vs. HGG | 3-fold CV, Test | 70:30 | Patient | (2+1)D ResNet TL (2+1)D ResNet 2D-3D Mixed ResNet TL 2D-3D Mixed ResNet 3D ResNet18 TL 3D ResNet18 | - - - 96.98 - - | - - - - - - | 90.35 92.37 86.07 93.45 90.95 89.25 | H = 99.04, LGG = 91.43, HGG = 82.29 H = 99.88, LGG = 91.08, HGG = 87.05 H = 97.69, LGG = 88.60, HGG = 75.05 H = 99.51, LGG = 93.19, HGG = 88.37 H = 99.44, LGG = 92.06, HGG = 82.89 H = 99.97, LGG = 85.52, HGG = 83.53 |
| 77 | Chitnis et al. [197] (2022) * | H vs. MN vs. GL vs. PT | Hold-out | 88:12 | - | Custom CNN DenseNet101 VGGNet16 ResNet50 | 90.60 86.80 88.33 85.79 | 95.60 92.84 94.31 94.34 | 91.48 87.84 89.60 86.96 | (R) 91.50, (S) 97.99 (R) 86.14, (S) 96.07 (R) 88.15, (S) 98.61 (R) 85.17, (S) 95.77 |
| 78 | Coupet et al. [135] (2022) * | H vs. T | Three-way | 70:15:15 | Patient | Modality-ensemble TL CNNs TL 3DUNet | 86.38 82.96 | - - | - - | - H = 69.81, T = 96.44 |
| 79 | Dang et al. [98] (2022) | LGG vs. HGG | Three-way | 60:20:20 | - | VGG | 97.44 | - | - | - |
| 80 | Danilov et al. [146] (2022) | LGG vs. HGG G.I vs. G.II vs. G.III vs. G.IV LGG vs. HGG G.I vs. G.II vs. G.III vs. G.IV | Three-way | 80:10:10 | - | (3D) DenseNet (2D) TL ResNet200e | 67.00 83.00 61.00 50.00 | 76.00 95.00 73.00 72.00 | - 80.25 - 35.00 | (R) 58.00, (S) 78.00 G.I = 100.00, G.II = 63.00, G.III = 100.00, G.IV = 85.00 (R) 44.00, (S) 81.00 G.I = 56.00, G.II = 45.00, G.III = 32.00, G.IV = 47.00 |
| 81 | Ding et al. [57] (2022) * | LGG vs. HGG | Hold-out | Patient | Radiomics VGG16 Ensemble Radiomics-VGG16-RF | 74.00 60.00 80.00 | 82.20 71.20 89.80 | - - - | (R) 80.00, (S) 68.00 (R) 68.00, (S) 52.00 (R) 84.00, (S) 76.00 | |
| 82 | Ekong et al. [198] (2022) | H vs. MN vs. GL vs. PT | Three-way | 80:10:10 | - | Bayesian CNN MobileNet AlexNet VGG16 ResNet50 | 94.32 93.42 92.75 89.51 86.58 | - - - - - | 94.00 94.00 93.00 91.00 86.00 | H = 97.50, MN = 92.50, GL = 85.50, PT = 100.00 94.00 93.00 91.00 87.00 |
| 83 | Gao et al. [112] (2022) * | 18 types of tumors * | Three-way | 72:24:4 | Patient | DenseNet | 81.20 | 92.00 | - | (R) 87.60, (S) 84.90 |
| 84 | Gaur et al. [199] (2022) | MN vs. GL vs. PT | Three-way | 80:10:10 | - | Custom CNN | 85.37 | - | - | - |
| 85 | Guo et al. [150] (2022) | AS vs. OG vs. GB | 3-fold CV | - | Radiomics Modality-fusion DenseNet201 Modality-ensemble DenseNet201 | 83.70 84.60 87.80 | 87.00 88.30 90.2 | 83.40 84.60 87.80 | (R) 70.40, (S) 89.90 (R) 73.10, (S) 93.00 (R) 77.20, (S) 93.00 | |
| 86 | Gupta et al. [95] (2022) | H vs. T MN vs. GL vs. PT | Hold-out | 88:12 | - | InceptionResNetV2-RF | 96.66 96.88 | - - | 97.00 96.00 | H = 100.00, T = 93.00 MN = 100.00, GL = 100.00, PT = 85.00 |
| 87 | Gurunathan and Krishnan [200] (2022) | LGG vs. HGG | Hold-out | 75:25 | - | Custom CNN AlexNet VGG19 GoogLeNet | 99.40 98.14 97.97 95.69 | - - - - | 98.10 - - - | (R) 97.20, (S) 98.60 - - - |
| 88 | Haq et al. [90] (2022) * | MN vs. GL vs. PT | Hold-out | 70:30 | - | [w/o DA] TL ResNet50 TL VGG-16 TL InceptionV3 [w/ DA] TL ResNet50 TL VGG-16 TL InceptionV3 | 99.10 98.78 97.78 99.89 98.98 98.50 | 98.78 98.06 97.00 99.56 97.98 98.76 | 99.50 97.49 97.39 99.43 98.79 98.00 | (R) 89.60, (S) 100.00 (R) 84.64, (S) 99.80 (R) 92.23, (S) 96.88 (R) 96.13, (S) 99.08 (R) 97.87, (S) 100.00 (R) 98.56, (S) 100.00 |
| 89 | Hsu et al. [131] (2022) | AS vs. OG vs. GB | Three-way | 67:11:22 | Patient | [WSI] 2D ResNet50 [MRI] 3D ResUNet [WSI-MRI] ResNet50-ResUNet | 77.70 69.80 80.00 | - - - | 88.60 77.10 88.60 | - - - |
| 90 | Isunuri and Kakarla [201] (2022) | MN vs. GL vs. PT | 5-fold CV | - | Custom CNN | 97.52 | - | 97.26 | 97.19 | |
| 91 | Jeong et al. [113] (2022) | LGG vs. HGG | 5-fold CV | - | Custom CNN | 90.91 | 96.34 | - | (R) 92.69, (S) 84.90 | |
| 92 | Kazemi et al. [108] (2022) * | 1 MN vs. GL vs. PT 2 G.II vs. G.III vs. G.IV | Hold-out | 75:25 | - | SVM-KNN AlexNet VGGNet AlexNet-VGGNet SVM-KNN AlexNet VGGNet AlexNet-VGGNet | 80.14 91.88 89.96 98.06 82.44 92.59 90.05 98.99 | 80.93 92.67 90.29 99.14 84.63 92.9 90.51 99.23 | - - - - - - - - | - - - MN = 98.10, GL = 98.88, PT = 98.50 - - - MN = 98.02, GL = 95.90, PT = 98.95 |
| 93 | Khazaee et al. [202] (2022) | LGG vs. HGG | Hold-out | 80:20 | - | TL EfficientNetB0 | 98.87 | - | - | (R) 98.86, (S) 98.79 |
| 94 | Kibriya et al. [122] (2022) | MN vs. GL vs. PT | - | - | - | Ensemble AlexNet-GoogLeNet-ResNet18-SVM | 99.70 | 100.00 | - | MN = 99.80, GL = 98.96, PT = 100.00 |
| 95 | Koli et al. [203] (2022) | H vs. T MN vs. GL vs. PT | Three-way | 70:15:15 | - | TL ResNet50 | 90.00 96.00 | - - | 90.00 95.00 | - MN = 90.00, GL = 98.00, PT = 97.00 |
| 96 | Lakshmi and Rao [204] (2022) | H vs. MN vs. GL vs. PT | Hold-out | 80:20 | - | InceptionV3 | 89.00 | - | - | - |
| 97 | Maqsood et al. [114] (2022) | MN vs. GL vs. PT LGG vs. HGG | 5-fold CV | - | TL MobileNetV2-SVM | 98.92 97.47 | 98.93 - | 97.87 96.71 | MN = 99.03, GL = 98.82, PT = 98.79 (R) 97.22, (S) 97.94 | |
| 98 | Murthy et al. [205] (2022) * | H vs. T | - | - | - | Custom CNN | 95.26 | - | 97.52 | (R) 97.12, (S) 50.00 |
| 99 | Nayak et al. [206] (2022) | MN vs. GL vs. PT | Hold-out | 80:20 | - | TL EfficientNet TL ResNet50 TL MobileNet TL MobileNetV2 | 98.78 96.33 96.94 94.80 | - - - - | 98.75 96.50 97.00 95.00 | H = 98.00, MN = 100.00, GL = 97.00, PT = 100.00 H = 98.00, MN = 98.00, GL = 90.00, PT = 100.00 H = 98.00, MN = 95.00, GL = 94.00, PT = 100.00 H = 96.00, MN = 99.00, GL = 95.00, PT = 90.00 |
| 100 | Rajinikanth et al. [124] (2022) | LGG vs. HGG | 5-fold CV | 90:10 | - | TL VGG16-SoftMax TL VGG16-DT TL VGG16-KNN TL VGG16-SVM | 96.50 96.00 96.50 97.00 | - - - - | 96.55 96.00 96.52 97.00 | (R) 97.03, (S) 95.96 (R) 96.97, (S) 95.05 (R) 97.00, (S) 96.00 (R) 97.00, (S) 97.00 |
| 101 | Rasool et al. [125] (2022) | H vs. MN vs. GL vs. PT | Hold-out | 80:20 | - | TL GoogLeNet GoogLeNet-SVM | 93.10 98.10 | - | - | H = 95.20, MN = 85.10, GL = 97.00, PT = 100.00 H = 98.70, MN = 97.30, GL = 97.80, PT = 98.90 |
| 102 | Raza et al. [207] (2022) | MN vs. GL vs. PT | Hold-out | 70:30 | - | Custom TL GoogLeNet TL AlexNet TL GoogLeNet TL ShuufleNet TL ResNet50 TL MobileNetV2 TL SqueezeNet TL Darknet53 TL ResNet101 TL ExceptionNet | 99.67 97.80 98.26 98.37 98.60 99.00 97.91 99.13 98.91 98.69 | - - - - - - - - - - | 99.66 97.66 98.33 98.33 98.33 99.00 97.66 99.00 98.66 98.00 | (R) 100.00 (R) 97.66 (R) 98.66 (R) 98.66 (R)98.66 (R) 99.00 (R) 98.00 (R) 99.33 (R) 99.00 (R) 98.33 |
| 103 | Rizwan et al. [208] (2022) | MN vs. GL vs. PT G.II vs. G.III vs. G.IV | Train, Val+Test | 65:35 | - | Custom CNN | 99.80 97.14 | - - | - - | (Acc) MN = 98.92, GL = 96.72, PT = 97.81 (Acc) G.II = 99.00, G.III = 96.00, G.IV = 99.00 |
| 104 | Samee et al. [209] (2022) | MN vs. GL vs. PT | Hold-out | 70:30 | - | TL hybrid GoogLeNet-AlexNet TL AlexNet TL VGG16 TL MobileNetV2 TL ResNet TL SqueezeNet | 99.10 96.00 95.00 95.00 94.00 92.00 | 99.00 97.00 95.00 95.00 94.00 92.00 | - - - - - - | MN = 99.00, GL = 99.00, PT = 99.00 MN = 96.00, GL = 96.00, PT = 96.00 MN = 95.00, GL = 95.00, PT = 95.00 MN = 95.00, GL = 95.00, PT = 95.00 MN = 94.00, GL = 94.00, PT = 94.00 MN = 92.00, GL = 92.00, PT = 92.00 |
| 105 | Samee et al. [147] (2022) | LGG vs. HGG | 10-fold CV, Test | 70:15:15 | Patient | Custom CNN | 88.60 | - | - | LGG = 80.00, HGG = 88.60 |
| 106 | Sangeetha et al. [210] (2022) | H vs. T | LOOCV | Patient | TL (in Rembrandt) CNN | 94.00 | - | - | (R) 85.00, (S) 73.00 | |
| 107 | Saravanan et al. [109] (2022) | 1 LGG vs. HGG vs. PIT 2 OLI vs. EP vs. CAM | 10-fold CV | - | SVM-RBF GoogLeNet CDbLNL SVM-RBF GoogLeNet CDbLNL | 85.80 94.60 97.21 84.80 91.60 97.21 | - - - - - - | 85.10 90.90 95.72 84.10 90.10 94.34 | (R) 81.90 (R) 91.50 (R) 95.62 (R) 80.90 (R) 91.50 (R) 93.86 | |
| 108 | Sekhar et al. [126] (2022) | MN vs. GL vs. PT | 5-fold CV | Patient | TL GoogLeNet-SoftMax TL GoogLeNet-SVM TL GoogLeNet-KNN | 94.90 97.60 98.30 | - - - | 94.30 97.35 97.24 | MN = 96.92, GL = 91.13, PT = 97.77 MN = 97.96, GL = 94.59, PT = 100.00 MN = 94.57, GL = 98.02, PT = 99.10 | |
| 109 | Senan et al. [99] (2022) | H vs. MN vs. GL vs. PT | Hold-out | 80:20 | - | AlexNet-SoftMax AlexNet-SVM ResNet18-SoftMax ResNet18-SVM | 93.30 95.10 93.80 91.20 | - - - - | - - - - | H = 91.10, MN = 89.80, GL = 93.30, PT = 97.80 H = 91.10, MN = 89.80, GL = 93.30, PT = 97.80 H = 94.90, MN = 93.60, GL = 93.90, PT = 97.80 H = 87.30, MN = 93.60, GL = 93.30, PT = 97.20 H = 92.40, MN = 86.10, GL = 91.50, PT = 95.60 |
| 110 | Srinivas et al. [211] (2022) | Benign vs. Malignant | Three-way | - | - | TL VGG16 TL InceptionV3 TL ResNet50 | 86.05 64.00 74.00 | - - - | - - - | B = 89.47, M = 87.09 B = 5.55, M = 100.00 B = 89.47, M = 64.52 |
| 111 | Tandel et al. [75] (2022) * | LGG vs. HGG | 5-fold CV | - | TL Ensemble AlexNet, VGGNet, ResNet18, GoogLeNet, ResNet50 [Whole image] [Skull-stripped brain] [Tumor ROI] | 98.43 98.63 99.06 | 98.45 98.63 99.07 | - - - | (R) 98.33, (S) 98.57 (R) 98.63. (S) 98.57 (R) 99.04, (S) 99.10 | |
| 112 | Tripathi and Bag [83] (2022) * | LGG vs. HGG | Hold-out | 70:30 80:20 90:10 Average | - - - - | DST Fusion TL ResNets | 95.64 95.78 96.19 95.87 | - - - - | 92.41 91.91 94.13 92.82 | (R) 92.12, (S) 95.97 (R) 95.12, (S) 95.10 (R) 96.95, (S) 95.77 - |
| 113 | Tripathi and Bag [141] (2022) | LGG vs. HGG | 10-fold CV | Patient | Attention-based CNN | 95.86 | - | 94.84 | (R) 94.82, (S) 96.81 | |
| 114 | Tummala et al. [136] (2022) | MN vs. GL vs. PT | Three-way | 70:10:20 | - | Ensemble ViT | 98.70 | - | - | (R) 97.78, (S) 99.42 |
| 115 | Vankdothu et al. [213] (2022) | H vs. MN vs. GL vs. PIT | Hold-out | 88:12 | - | CNN RNN CNN-LSTM | 89.39 90.02 92.00 | - - - | - - - | (R) 98.30 (R) 98.00 (R) 98.50 |
| 116 | Wang et al. [132] (2022) | AS vs. OG vs. GB | Three-way | 70:10:20 | Patient | [WSI] Ensemble EfficientNet-B2, EfficientNet-B3, SE-ResNext10 [MRI] 3D CNN [WSI-MRI] 2D-3D Ensemble | 82.20 73.30 75.00 | - - - | 88.60 82.90 75.30 | - |
| 117 | Xiong et al. [115] (2022) * | AS vs. OG vs. GB | Three-way | 70:15:15 | Patient | [MRI] TL ResNet34 [MRI-tabular] TL ResNet34 | 67.50 70.00 | - - | - - | AST = 85.70, OLI = 40.00, GBM = 68.80 AST = 85.70, OLI = 30.00, GBM = 81.30 |
| 118 | Xu et al. [118] (2022) * | LGG vs. HGG | Three-way | 60:20:20 | Patient | 1 TL ResNet18 1 TL ResNet18+radiomics 2 TL ResNet18 2 TL ResNet18+radiomics | 83.33 88.10 87.40 94.10 | - - - - | - - - - | (R) 90.8 (R) 90.1 (R) 93.1 (R) 97.1 |
| 119 | Yazdan et al. [214] (2022) * | H vs. MN vs. GL vs. PT | k-fold CV | - | TL AlexNet TL ResNet Multi-scale CNN 1 Multi-scale CNN 2 Multi-scale CNN 3 | 87.89 91.98 89.27 94.19 89.67 | - - - - - | 88.03 91.59 89.41 94.06 89.49 | (R) 87.86, (S) 85.42 (R) 91.44, (S) 89.79 (R) 89.15, (S) 86.91 (R) 93.74, (S) 92.62 (R) 89.24, (S) 88.35 | |
| 120 | Zahoor et al. [103] (2022) * | 1 H vs. T 2 MN vs. GL vs. PT | Hold-out | 60:40 80:20 | - | ResNet18-Softmax TL ResNet18-Softmax TL ResNet18-SVM Custom CNN-SVM Custom CNN-SVM | 97.43 98.91 99.16 99.56 99.20 | - - - 99.90 - | 97.56 98.69 98.94 99.45 99.09 | (R) 98.12 (R) 99.66 (R) 97.99 (R) 98.99 MN = 98.60, GL = 99.30, PT = 99.50 |
| 121 | AlTahhan et al. [127] (2023) | H vs. MN vs. GL vs. PT | Three-way | 70:30:- | - | TL GoogLeNet-SoftMax TL AlexNet-SoftMax TL AlexNet-SVM TL AlexNet-KNN | 88.00 85.00 95.00 97.00 | - - - - | 88.46 86.27 93.62 97.96 | H = 87.50, MN = 88.00, GL = 88.50, PT = 88.00 H = 84.00, MN = 84.60, GL = 88.00, PT = 83.30 H = 92.60, MN = 92.30, GL = 100.00, PT = 96.00 H = 96.20, MN = 96.00, GL = 100.00, PT = 96.00 |
| 122 | Al-Zoghby et al. [137] (2023) | MN vs. GL vs. PT | Hold-out | 80:20 | - | Ensemble TL VGG-16 & Custom CNN | 99.00 | 99.00 | 99.00 | MN = 98.00, GL = 100.00, PT = 99.00 |
| 123 | Anagun [215] (2023) | MN vs. GL vs. PT | Three-way | 80:10:10 | - | TL EfficientNetv2 TL ResNet18 TL ResNet200d TL InceptionV4 | 99.85 99.62 99.83 99.69 | 99.92 99.75 99.84 99.73 | 98.07 96.64 97.72 97.19 | 98.05 96.71 97.66 97.37 |
| 124 | Anand et al. [91] (2023) | H vs. T | Three-way | 76:14:10 | - | TL EfficientNetB0 TL InceptionV3 TL ResNet50 TL VGG19 Custom CNN w/o DA Custom CNN w/ DA Ensemble TL VGG19 & Custom CNN | - - - 95.00 96.00 97.00 98.00 | - - - - - - - | 54.50 91.50 85.00 96.00 96.50 97.00 98.50 | H = 44.00, T = 30.00 H = 90.00, T = 94.00 H = 82.00, T = 81.00 H = 98.00, T = 96.00 H = 95.00, T = 98.00 H = 98.00, T = 96.00 H = 98.50, T = 99.00 |
| 125 | Apostolopoulos et al. [216] (2023) * | H vs. MN vs. GL vs. PT | H10-fold CV | - | Attention VGG19 VGG19 ResNet152 MobileNetV2 InceptionV3 | 93.53 91.08 86.00 86.89 87.13 | 95.3 - - - - | 90.55 - - - - | H = 99.60, MN = 90.62, GL = 96.76, PT = 91.61 - - - - | |
| 126 | Asif et al. [138] (2023) | MN vs. GL vs. PT | Hold-out | 80:20 | - | TL Xception TL VGG16 TL DenseNet201 TL ResNet152V2 TL InceptionResNetV2 Ensemble TL DenseNet201, ResNet152V2, InceptionResNetV2 | 91.83 93.54 97.22 95.58 95.75 98.69 | - - 98.00 98.00 96.00 99.00 | 90.65 93.01 96.81 95.12 94.96 98.39 | MN = 82.98, GL = 92.63, PT = 97.31 MN = 84.40, GL = 96.49, PT = 97.31 MN = 92.91, GL = 98.60, PT = 98.39 MN = 92.91, GL = 94.74, PT = 98.92 MN = 89.36, GL = 97.54, PT = 97.85 MN = 96.45, GL = 99.29, PT = 99.46 |
| 127 | Athisayamani et al. [110] (2023) | MN vs. GL vs. PT | - | - | - | TL ResNet152 CNN SVM | 98.85 97.00 94.00 | 98.00 - - | - - - | MN = 97.00, GL = 98.00, PT = 99.00 (R) 94.00 (R) 94.00 |
| 128 | Bairagi et al. [111] (2023) * | H vs. T | 10-fold CV, Test | 80:20 | - | SVM TL AlexNet TL VGG16 TL GoogLeNet | 89.53 98.67 90.67 91.49 | - - - - | - - - - | - - - - |
| 129 | Deepa et al. [84] (2023) * | H vs. T | Hold-out | 90:10 | - | Custom CJHBA Based DRN | 1 92.10 2 91.84 | - | - - | (R) 93.13, (S) 92.84 (R) 91.55, (S) 91.86 |
| 130 | El-Wahab et al. [219] (2023) | MN vs. GL vs. PT | 5-fold CV, Test | 80:20 | - | TL VGG16 TL VGG19 TL InceptionV3 TL ResNet50 TL MobileNet BTCfCNN TL BTCfCNN (bt folds) TL BTC-fCNN | 92.07 93.05 80.35 74.48 89.16 93.08 98.63 98.86 | - - - - - - - - | - - - - - 92.21 98.46 98.77 | - - - - - (R) 92.01, (S) 96.34 (R) 98.49, (S) 99.31 (R) 98.83, (S) 99.41 |
| 131 | Hossain et al. [116] (2023) | H vs. MN vs. GL vs. PT | three-way | 80:10:10 | - | TL InceptionV3 TL VGG16 TL Xception TL ResNet50 TL VGG19 TL InceptionResNetV2 Ensemble TL VGG16, InceptionV3, Xception | 95.72 95.11 94.50 93.88 94.19 93.58 96.94 | - - - - - - - | 69.00 69.00 69.00 72.00 64.00 70.00 76.00 | H = 100.00, MN = 98.00, GL = 31.00, PT = 70.00 H = 100.00, MN = 99.00, GL = 22.00, PT = 80.00 H = 98.00, MN = 91.00, GL = 39.00, PT = 77.00 H = 100.00, MN = 97.00, GL = 28.00, PT = 72.00 H = 100.00, MN = 97.00, GL = 22.00, PT = 64.00 H = 98.00, MN = 99.00, GL = 33.00, PT = 68.00 H = 100, MN = 93.00, GL = 49.00, PT = 73.00 |
| 132 | Hussain et al. [148] (2023) | LGG vs. HGG | Hold-out | - | Patient | 3D CNN -T1 -T1c -T2 -Flair -Segmentation Ensemble | 94.00 94.00 94.38 93.23 94.38 94.20 | - - - - - - | 95.77 95.77 95.65 95.77 95.77 95.75 | - - - - - - |
| 133 | Kibriya et al. [119] (2023) | H vs. T | Hold-out | 70:30 | - | 1 Radiomics-SVM 1 Radiomics-KNN 1 VGG16-SVM 1 VGG16-KNN 1 Radiomics+VGG16-SVM 1 Radiomics+VGG16-KNN 2 Radiomics-SVM 2 Radiomics-KNN 2 VGG16-SVM 2 VGG16-KNN 2 Radiomics+VGG16-SVM 2 Radiomics+VGG16-KNN | 72.00 84.00 92.10 88.10 93.30 96.00 96.10 96.00 98.00 97.80 99.00 98.70 | - - - - 99.00 99.00 - - - - 100.00 100.00 | - - - - 93.50 94.50 - - - - 99.00 99.00 | - - - - 93.00 95.50 - - - - 99.00 99.00 |
| 134 | Krishnapriya and Karuna [92] (2023) | H vs. T | Hold-out | 70:30 | - | [w/o DA] TL VGG16 TL VGG19 TL ResNet 50 TL InceptionV3 [w/ DA] TL VGG 16 TL VGG19 TL ResNet50 TL InceptionV3 | 90.50 90.70 88.02 66.26 99.00 99.48 97.92 81.25 | - - - - - - - - | - - - - 99.08 99.17 82.24 58.16 | - - - - 98.18 98.76 87.27 63.25 |
| 135 | Kumar et al. [128] (2023) * | Benign vs. Malignant | Hold-out | 90:10 | - | ResNet50-Softmax ResNet50-SVM TL ResNet50 | 86.57 91.24 96.80 | - - - | - - 97.34 | - - Benign = 95.21, Malignant = 97.56 |
| 136 | Mahmud et al. [220] (2023) | H vs. M vs GL vs. PT | Three-way | 80:10:10 | - | Custom CNN ResNet50 VGG16 InceptionV3 | 93.30 81.10 71.60 80.00 | 98.43 94.2 89.6 89.14 | - - - - | 91.13 81.04 70.03 79.81 |
| 137 | Muezzinoglu et al. [221] (2023) | H vs. MN vs. GL vs. PT | 10-fold CV | - | PatchResNet | 98.10 | 98.01 | H = 98.40, MN = 98.51, GL = 95.68, PT = 100.00 | ||
| 138 | Özkaraca et al. [222] (2023) | H vs. MN vs. GL vs. PT | 10-fold CV, Test | 80:20 | - | CNN VGG16 DenseNet Custom CNN | - - - - | - - - - | 92.00 85.75 84.75 96.5 | H = 98.00, MN = 84.00, GL = 90.00, PT = 97.00 H = 96.00, MN = 67.00, GL = 89.00, PT = 94.00 H = 99.00, MN = 83.00, GL = 99.00, PT = 58.00 H = 98.00, MN = 91.00, GL = 97.00, R PT = 99.00 |
| 139 | Özkaya and Şağıroğlu [224] (2023) | LGG vs. HGG | 10-fold CV | - | TL MobileNetV2 TL DenseNet201 TL Xception 99.63 TL InceptionV3 TL EfficientNetV2S 99.24 | 99.85 99.66 99.70 99.63 99.41 | 99.92 99.77 99.64 99.74 99.25 | 99.85 99.67 - 99.64 - | - - - | |
| 140 | Rasheed et al. [225] (2023) | MN vs. GL vs. PT | Hold-out | 80:20 | - | Custom CNN VGG16 VGG19 ResNet50 MobileNet InceptionV3 | 98.04 90.70 92.82 94.77 93.47 85.97 | 98.00 93.00 94.00 96.00 95.00 88.00 | 98.00 90.00 93.00 95.00 93.00 85.00 | MN = 95.00, GL = 99.00, PT = 100.00 MN = 79.00, GL = 92.00, PT = 99.00 MN = 85.00, GL = 94.00, PT = 98.00 MN = 89.00, GL = 95.00, PT = 99.00 MN = 90.00, GL = 92.00, PT = 99.00 MN = 66.00, GL = 89.00, PT = 98.00 |
| 141 | Rui et al. [149] (2023) * | LGG vs. HGG | 5-fold CV, Test | - | Patient | Inception CNN [Flair] [T1c] Modality-ensemble | 69.00 74.00 80.00 | - - - | 60.00 70.00 78.00 | (R) 75.00, (S) 60.00 (R) 75.00, (S) 73.00 (R) 76.00, (S) 87.00 |
| 142 | Shirehjini et al. [123] (2023) * | G.I vs. G.II vs. G.III vs. G.IV | Three-way | 70:15:15 | - | TL VGG16-Softmax TL VGG16-LR TL-SVM | 96.93 98.15 99.38 | - - 99.93 | 96.64 98.12 99.09 | (R) 99.29 (R) 97.94 G.I: 96.00, G.II = 100.00, G.III = 100.00, G.IV = 100.00 |
| 143 | Srinivasan et al. [226] (2023) | H vs. MN vs. GL vs. PT | Hold-out | 80:20 | - | Custom CNN UNet ResNet | 98.17 92.61 96.23 | - - - | - - - | (R) 98.79, (S)91.34 (R) 97.56 (S) 81.51 (R) 97.90, (S) 90.23 |
| 144 | Tandel et al. [139] (2023) * | LGG vs. HGG | 5-fold CV | - | Ensemble TL AlexNet, VGG16, ResNet18, GoogLeNet, ResNet50 | [T1] 94.75 [T2] 97.98 [Flair] 98.88 | 94.92 97.99 98.88 | - - - | (R) 94.29, (S) 95.56 (R) 97.60, (S) 98.37 (R) 98.95, (S) 98.80 | |
| 145 | van der Voort et al. [117] (2023) | G.II vs. G.III vs. G.IV LGG vs. HGG | Three-way | 75:15:15 | Patient | UNet | 71.00 84.00 | 81.00 91.00 | - | G.II = 75.00, G.III = 17.00, G.IV = 95.00 (R) 72.00, (S) 93.00 |
| 146 | Wu et al. [157] (2023) | LGG vs. HGG | Three-way | 54:13:33 | Patient | Attention-based custom CNN VGG19 ResNet50 DenseNet201 InceptionV4 | 95.19 - - - - | 98.40 95.80 94.10 95.70 97.00 | 93.34 - - - - | (R) 94.01, (S) 99.53 - - - - |
References
- Sohn, E. The reproducibility issues that haunt health-care AI. Nature 2023, 613, 402–403. [Google Scholar] [CrossRef] [PubMed]
- McDermott, M.; Wang, S.; Marinsek, N.; Ranganath, R.; Foschini, L.; Ghassemi, M. Reproducibility in machine learning for health research: Still a ways to go. Sci. Transl. Med. 2021, 13, eabb1655. [Google Scholar] [CrossRef] [PubMed]
- Muehlematter, U.; Daniore, P.; Vokinger, K. Approval of artificial intelligence and machine learning-based medical devices in the USA and Europe (2015–20): A comparative analysis. Lancet Digit. Health 2021, 3, e195–e203. [Google Scholar] [CrossRef] [PubMed]
- Nakagawa, K.; Moukheiber, L.; Celi, L.; Patel, M.; Mahmood, F.; Gondim, D.; Hogarth, M.; Levenson, R. AI in Pathology: What could possibly go wrong? Semin. Diagn. Pathol. 2023, 40, 100–108. [Google Scholar] [CrossRef] [PubMed]
- Di Nunno, V.; Fordellone, M.; Minniti, G.; Asioli, S.; Conti, A.; Mazzatenta, D.; Balestrini, D.; Chiodini, P.; Agati, R.; Tonon, C.; et al. Machine learning in neuro-oncology: Toward novel development fields. J. Neuro-Oncol. 2022, 159, 333–346. [Google Scholar] [CrossRef] [PubMed]
- Bacciu, D.; Lisboa, P.; Vellido, A. Deep Learning in Biology and Medicine; World Scientific: London, UK, 2022. [Google Scholar]
- Bernal, J.; Kushibar, K.; Clèrigues, A.; Oliver, A.; Lladó, X. Deep learning for medical imaging. In Deep Learning in Biology and Medicine; World Scientific: London, UK, 2022; pp. 11–54. [Google Scholar]
- Xue, H.; Hu, G.; Hong, N.; Dunnick, N.; Jin, Z. How to keep artificial intelligence evolving in the medical imaging world? Challenges and opportunities. Sci. Bull. 2023, 68, 648–652. [Google Scholar] [CrossRef] [PubMed]
- Pati, S.; Baid, U.; Edwards, B.; Sheller, M.; Wang, S.-H.; Reina, G.A.; Foley, P.; Gruzdev, A.; Karkada, D.; Davatzikos, C.; et al. Federated learning enables big data for rare cancer boundary detection. Nat. Commun. 2022, 13, 7346. [Google Scholar] [CrossRef]
- Thrall, J.; Li, X.; Quanzheng, L.; Cruz, C.; Do, S.; Dreyer, K.; Brink, J. Artificial Intelligence and Machine Learning in Radiology: Opportunities, challenges, pitfalls, and criteria for success. J. Am. Coll. Radiol. 2018, 15, 504–508. [Google Scholar] [CrossRef]
- Liu, Y.; Leong, A.; Zhao, Y.; Xiao, L.; Mak, H.; Tsang, A.; Lau, G.; Leung, G.; Wu, E. A low-cost and shielding-free ultra-low-field brain MRI scanner. Nat. Commun. 2021, 12, 7238. [Google Scholar] [CrossRef]
- Julià-Sapé, M.; Acosta, D.; Majós, C.; Moreno-Torres, A.; Wesseling, P.; Acebes, J.; Griffiths, J.R.; Arús, C. Comparison between neuroimaging classifications and histopathological diagnoses using an international multicenter brain tumor magnetic resonance imaging database. J. Neurosurg. 2006, 105, 6–14. [Google Scholar] [CrossRef]
- Arita, K.; Miwa, M.; Bohara, M.; Moinuddin, F.; Kamimura, K.; Yoshimoto, K. Precision of preoperative diagnosis in patients with brain tumor—A prospective study based on “top three list” of differential diagnosis for 1061 patients. Surg. Neurol. Int. 2020, 11, 55. [Google Scholar] [CrossRef] [PubMed]
- Osborn, A.; Louis, D.; Poussaint, T.; Linscott, L.; Salzman, K.L. The 2021 World Health Organization classification of tumors of the central nervous system: What neuroradiologists need to know. Am. J. Neuroradiol. 2022, 43, 928–937. [Google Scholar] [CrossRef]
- Wen, P.Y.; Macdonald, D.R.; Reardon, D.A.; Cloughesy, T.F.; Sorensen, A.G.; Galanis, E.; DeGroot, J.; Wick, W.; Gilbert, M.R.; Lassman, A.B.; et al. Updated response assessment criteria for high-grade gliomas: Response assessment in neuro-oncology working group. J. Clin. Oncol. 2010, 28, 1963–1972. [Google Scholar] [CrossRef] [PubMed]
- Kumar, A.; Leeds, N.; Fuller, G.; Van Tassel, P.; Maor, M.; Sawaya, R.; Levin, V. Malignant gliomas: MR imaging spectrum of radiation therapy-and chemotherapy-induced necrosis of the brain after treatment. Radiology 2000, 217, 377–384. [Google Scholar] [CrossRef]
- Segura, P.P.; Quintela, N.V.; García, M.M.; del Barco Berrón, S.; Sarrió, R.G.; Gómez, J.G.; Castaño, A.G.; Martín, L.M.N.; Rubio, O.G.; Losada, E.P. SEOM-GEINO clinical guidelines for high-grade gliomas of adulthood (2022). Clin. Transl. Oncol. 2023, 25, 2634–2646. [Google Scholar] [CrossRef] [PubMed]
- Da Cruz, L.C.H.; Rodriguez, I.; Domingues, R.; Gasparetto, E.; Sorensen, A. Pseudoprogression and Pseudoresponse: Imaging Challenges in the Assessment of Posttreatment Glioma. AJNR Am. J. Neuroradiol. 2011, 32, 1978–1985. [Google Scholar] [CrossRef] [PubMed]
- Wen, P.Y.; van den Bent, M.; Youssef, G.; Cloughesy, T.F.; Ellingson, B.M.; Weller, M.; Galanis, E.; Barboriak, D.P.; de Groot, J.; Gilbert, M.R.; et al. RANO 2.0: Update to the response assessment in neuro-oncology criteria for high-and low-grade gliomas in adults. J. Clin. Oncol. 2023, 41, 5187–5199. [Google Scholar] [CrossRef]
- Tustison, N.J.; Avants, B.B.; Cook, P.A.; Zheng, Y.; Egan, A.; Yushkevich, P.A.; Gee, J.C. N4ITK: Improved N3 bias correction. IEEE Trans. Med. Imaging 2010, 29, 1310–1320. [Google Scholar] [CrossRef]
- Sled, J.G.; Zijdenbos, A.P.; Evans, A.C. A nonparametric method for automatic correction of intensity nonuniformity in MRI data. IEEE Trans. Med. Imaging 1998, 17, 87–97. [Google Scholar] [CrossRef]
- Ronneberger, O.; Fischer, P.; Brox, T. U-Net: Convolutional Networks for biomedical image segmentation. In Proceedings of the Medical Image Computing and Computer-Assisted Intervention—MICCAI, Munich, Germany, 5–9 October 2015; Springer International Publishing: Berlin/Heidelberg, Germany, 2015; pp. 234–241. [Google Scholar]
- Ren, S.; He, K.; Girshick, R.; Sun, J. Faster R-CNN: Towards real-time object detection with region proposal networks. In Proceedings of the Advances in Neural Information Processing Systems; Cortes, C., Lawrence, N., Lee, D., Sugiyama, M., Garnett, R., Eds.; Curran Associates, Inc.: Red Hook, NY, USA, 2015; Volume 28. [Google Scholar]
- He, K.; Gkioxari, G.; Dollár, P.; Girshick, R. Mask R-CNN. In Proceedings of the IEEE International Conference on Computer Vision, Venice, Italy, 22–29 October 2017; pp. 2961–2969. [Google Scholar]
- Lisboa, P.; Saralajew, S.; Vellido, A.; Fernández-Domenech, R.; Villmann, T. The Coming of Age of Interpretable and Explainable Machine Learning Models. Neurocomputing 2023, 535, 25–39. [Google Scholar] [CrossRef]
- Mukherjee, T.; Pournik, O.; Lim Choi Keung, S.; Arvanitis, T. Clinical decision support systems for brain tumour diagnosis and prognosis: A systematic review. Cancers 2023, 15, 3523. [Google Scholar] [CrossRef] [PubMed]
- Bertsimas, D.; Wiberg, H. Machine Learning in Oncology: Methods, applications, and challenges. JCO Clin. Cancer Inform. 2020, 4, 885–894. [Google Scholar] [CrossRef]
- Jha, A.; Mithun, S.; Sherkhane, U.B.; Jaiswar, V.; Shi, Z.; Kalendralis, P.; Kulkarni, C.; Dinesh, M.S.; Rajamenakshi, R.; Sunder, G.; et al. Implementation of big imaging data pipeline adhering to FAIR principles for Federated Machine Learning in Oncology. IEEE Trans. Radiat. Plasma Med. Sci. 2022, 6, 207–213. [Google Scholar] [CrossRef]
- Su, X.; Chen, N.; Sun, H.; Liu, Y.; Yang, X.; Wang, W.; Zhang, S.; Tan, Q.; Su, J.; Gong, Q.; et al. Automated Machine Learning based on radiomics features predicts H3 K27M mutation in midline gliomas of the brain. Neuro-Oncology 2020, 22, 393–401. [Google Scholar] [CrossRef] [PubMed]
- Mocioiu, V.; Pedrosa de Barros, N.; Ortega-Martorell, S.; Slotboom, J.; Knecht, U.; Arús, C.; Vellido, A.; Julià-Sapé, M. A Machine Learning pipeline for supporting differentiation of glioblastomas from single brain metastases. In Proceedings of the ESANN 2016, European Symposium on Artificial Neural Networks, Computational Intelligence and Machine Learning (ESANN) Bruges (Belgium), Bruges, Belgium, 5–7 October 2016; pp. 247–252. [Google Scholar]
- Pitarch, C.; Ribas, V.; Vellido, A. AI-Based Glioma Grading for a Trustworthy Diagnosis: An Analytical Pipeline for Improved Reliability. Cancers 2023, 15, 3369. [Google Scholar] [CrossRef]
- Tabassum, M.; Suman, A.; Suero Molina, E.; Pan, E.; Di Ieva, A.; Liu, S. Radiomics and Machine Learning in Brain Tumors and Their Habitat: A Systematic Review. Cancers 2023, 15, 3845. [Google Scholar] [CrossRef] [PubMed]
- Griethuysen, J.; Fedorov, A.; Parmar, C.; Hosny, A.; Aucoin, N.; Narayan, V.; Beets-Tan, R.; Fillon-Robin, J.; Pieper, S.; Aerts, H. Clinical Decision Support Systems for Brain Tumour Diagnosis and Prognosis: A Systematic Review. Cancer Res. 2017, 77, e104–e107. [Google Scholar] [CrossRef]
- Hyvärinen, A.; Oja, E. Independent component analysis: Algorithms and applications. Neural Netw. 2000, 13, 411–430. [Google Scholar] [CrossRef]
- Lee, J.; Zhao, Q.; Kent, M.; Platt, S. Tumor Segmentation using temporal Independent Component Analysis for DCE-MRI. BioRxiv 2022. [Google Scholar] [CrossRef]
- Chakhoyan, A.; Raymond, C.; Chen, J.; Goldman, J.; Yao, J.; Kaprealian, T.; Pouratian, N.; Ellingson, B. Probabilistic independent component analysis of dynamic susceptibility contrast perfusion MRI in metastatic brain tumors. Cancer Imaging 2019, 19, 14. [Google Scholar] [CrossRef]
- Lee, D.; Seung, H. Learning the parts of objects by non-negative matrix factorization. Nature 1999, 401, 788–791. [Google Scholar] [CrossRef] [PubMed]
- Ortega-Martorell, S.; Lisboa, P.; Vellido, A.; Julià-Sapé, M.; Arús, C. Non-negative matrix factorisation methods for the spectral decomposition of MRS data from human brain tumours. BMC Bioinform. 2012, 13, 38. [Google Scholar] [CrossRef]
- Ungan, G.; Arús, C.; Vellido, A.; Julià-Sapé, M. A Comparison of Non-Negative Matrix Underapproximation Methods for the Decomposition of Magnetic Resonance Spectroscopy Data from Human Brain Tumors. NMR Biomed. 2023, 36, e5020. [Google Scholar] [CrossRef]
- Sauwen, N.; Acou, M.; Van Cauter, S.; Sima, D.M.; Veraart, J.; Maes, F.; Himmelreich, U.; Achten, E.; Van Huffel, S. Comparison of unsupervised classification methods for brain tumor segmentation using multi-parametric MRI. Neuroimage Clin. 2016, 12, 753–764. [Google Scholar] [CrossRef] [PubMed]
- Ashtari, P.; Sima, D.; De Lathauwer, L.; Sappey-Marinier, D.; Maes, F.; Van Huffel, S. Factorizer: A scalable interpretable approach to context modeling for medical image segmentation. Med. Image Anal. 2023, 84, 102706. [Google Scholar] [CrossRef]
- Dosovitskiy, A.; Beyer, L.; Kolesnikov, A.; Weissenborn, D.; Zhai, X.; Unterthiner, T.; Dehghani, M.; Minderer, M.; Heigold, G.; Gelly, S.; et al. An image is worth 16 × 16 words: Transformers for image recognition at scale. arXiv 2020, arXiv:2010.11929. [Google Scholar]
- Lundervold, A.S.; Lundervold, A. An overview of deep learning in medical imaging focusing on MRI. Z. Med. Phys. 2019, 29, 102–127. [Google Scholar] [CrossRef] [PubMed]
- Cai, L.; Gao, J.; Zhao, D. A review of the application of deep learning in medical image classification and segmentation. Ann. Transl. Med. 2020, 8, 713. [Google Scholar] [CrossRef]
- Chen, X.; Wang, X.; Zhang, K.; Fung, K.M.; Thai, T.C.; Moore, K.; Mannel, R.S.; Liu, H.; Zheng, B.; Qiu, Y. Recent advances and clinical applications of deep learning in medical image analysis. Med. Image Anal. 2022, 79, 102444. [Google Scholar] [CrossRef]
- Krizhevsky, A.; Sutskever, I.; Hinton, G.E. ImageNet classification with deep convolutional neural networks. In Proceedings of the Advances in Neural Information Processing Systems; Pereira, F., Burges, C., Bottou, L., Weinberger, K., Eds.; Curran Associates, Inc.: Red Hook, NY, USA, 2012; Volume 25. [Google Scholar]
- Szegedy, C.; Liu, W.; Jia, Y.; Sermanet, P.; Reed, S.; Anguelov, D.; Erhan, D.; Vanhoucke, V.; Rabinovich, A. Going deeper with convolutions. In Proceedings of the IEEE Computer Society Conference on Computer Vision and Pattern Recognition, Nashville, TN, USA, 20–25 June 2014; pp. 1–9. [Google Scholar] [CrossRef]
- Simonyan, K.; Zisserman, A. Very Deep Convolutional Networks for Large-Scale Image Recognition. In Proceedings of the 3rd International Conference on Learning Representations, ICLR 2015—Conference Track Proceedings, San Diego, CA, USA, 7–9 May 2014. [Google Scholar]
- He, K.; Zhang, X.; Ren, S.; Sun, J. Deep residual learning for image recognition. In Proceedings of the IEEE Computer Society Conference on Computer Vision and Pattern Recognition, Boston, MA, USA, 7–12 June 2015; pp. 770–778. [Google Scholar] [CrossRef]
- Huang, G.; Liu, Z.; Van Der Maaten, L.; Weinberger, K.Q. Densely connected convolutional networks. In Proceedings of the IEEE Conference on Computer Vision and Pattern Recognition, Honolulu, HI, USA, 21–26 July 2017; pp. 4700–4708. [Google Scholar]
- Tan, M.; Le, Q. EfficientNet: Rethinking model scaling for convolutional neural networks. In Proceedings of the 36th International Conference on Machine Learning, Long Beach, CA, USA, 9–15 June 2019; Volume 97, pp. 6105–6114. [Google Scholar]
- Goodfellow, I.J.; Pouget-Abadie, J.; Mirza, M.; Xu, B.; Warde-Farley, D.; Ozair, S.; Courville, A.; Bengio, Y. Generative Adversarial Networks. arXiv 2014, arXiv:1406.2661. [Google Scholar] [CrossRef]
- Deng, J.; Dong, W.; Socher, R.; Li, L.J.; Li, K.; Li, F.-F. Imagenet: A large-scale hierarchical image database. In Proceedings of the 2009 IEEE Conference on Computer Vision and Pattern Recognition, Miami, FL, USA, 20–25 June 2009; pp. 248–255. [Google Scholar]
- Lin, T.Y.; Maire, M.; Belongie, S.; Hays, J.; Perona, P.; Ramanan, D.; Dollár, P.; Zitnick, C.L. Microsoft COCO: Common objects in context. In Proceedings of the Computer Vision—ECCV 2014; Fleet, D., Pajdla, T., Schiele, B., Tuytelaars, T., Eds.; Springer: Cham, Switzerland, 2014; pp. 740–755. [Google Scholar]
- Yang, J.; Huang, X.; He, Y.; Xu, J.; Yang, C.; Xu, G.; Ni, B. Reinventing 2D Convolutions for 3D Images. IEEE J. Biomed. Health Inform. 2021, 25, 3009–3018. [Google Scholar] [CrossRef]
- Banerjee, S.; Mitra, S.; Masulli, F.; Rovetta, S. Glioma classification using deep radiomics. SN Comput. Sci. 2020, 1, 209. [Google Scholar] [CrossRef]
- Ding, J.; Zhao, R.; Qiu, Q.; Chen, J.; Duan, J.; Cao, X.; Yin, Y. Developing and validating a deep learning and radiomic model for glioma grading using multiplanar reconstructed magnetic resonance contrast-enhanced T1-weighted imaging: A robust, multi-institutional study. Quant. Imaging Med. Surg. 2022, 12, 1517. [Google Scholar] [CrossRef] [PubMed]
- Zhuge, Y.; Ning, H.; Mathen, P.; Cheng, J.Y.; Krauze, A.V.; Camphausen, K.; Miller, R.W. Automated glioma grading on conventional MRI images using deep convolutional neural networks. Med. Phys. 2020, 47, 3044–3053. [Google Scholar] [CrossRef] [PubMed]
- Chatterjee, S.; Nizamani, F.A.; Nürnberger, A.; Speck, O. Classification of brain tumours in MR images using deep spatiospatial models. Sci. Rep. 2022, 12, 1505. [Google Scholar] [CrossRef]
- Baheti, B.; Pati, S.; Menze, B.; Bakas, S. Leveraging 2D Deep Learning ImageNet-trained Models for Native 3D Medical Image Analysis. In Brainlesion: Glioma, Multiple Sclerosis, Stroke and Traumatic Brain Injuries, Proceedings of the BrainLes 2022, Singapore, 18 September 2022; Lecture Notes in Computer Science; Springer: Cham, Switzerland, 2023; Volume 13769, pp. 68–79. [Google Scholar] [CrossRef]
- Brain Tumor Segmentation (BraTS) Challenge. Available online: http://www.braintumorsegmentation.org/ (accessed on 10 June 2023).
- Computational Precision Medicine: Radiology-Pathology Challenge on Brain Tumor Classification 2019 (CPM-RadPath). Available online: https://www.med.upenn.edu/cbica/cpm-rad-path-2019/ (accessed on 30 August 2023).
- Figshare Brain Tumor Dataset. Available online: https://figshare.com/articles/dataset/brain_tumor_dataset/1512427 (accessed on 1 June 2023).
- IXI Dataset. Available online: https://brain-development.org/ixi-dataset/ (accessed on 10 June 2023).
- Hamada, A. Br35H Brain Tumor Detection 2020 Dataset. Available online: https://www.kaggle.com/datasets/ahmedhamada0/brain-tumor-detection (accessed on 1 June 2023).
- Bhuvaji, S.; Kadam, A.; Bhumkar, P.; Dedge, S. Brain Tumor Classification (MRI). Available online: https://www.kaggle.com/datasets/sartajbhuvaji/brain-tumor-classification-mri (accessed on 1 June 2023).
- Chakrabarty, N. Brain MRI Images Dataset for Brain Tumor Detection, Kaggle. 2019. Available online: https://www.kaggle.com/datasets/navoneel/brain-mri-images-for-brain-tumor-detection (accessed on 1 June 2023).
- Radiopaedia. Available online: https://radiopaedia.org/cases/system/central-nervous-system (accessed on 1 June 2023).
- Scarpace, L.; Flanders, A.E.; Jain, R.; Mikkelsen, T.; Andrews, D.W. Data From REMBRANDT [Data set]. The Cancer Imaging Archive. 2019. Available online: https://www.cancerimagingarchive.net/collection/rembrandt/ (accessed on 20 April 2023).
- Scarpace, L.; Mikkelsen, T.; Cha, S.; Rao, S.; Tekchandani, S.; Gutman, D.; Saltz, J.H.; Erickson, B.J.; Pedano, N.; Flanders, A.E.; et al. The Cancer Genome Atlas Glioblastoma Multiforme Collection (TCGA-GBM) (Version 4) [Data set]. The Cancer Imaging Archive. 2016. Available online: https://www.cancerimagingarchive.net/collection/tcga-gbm/ (accessed on 4 March 2023).
- Pedano, N.; Flanders, A.E.; Scarpace, L.; Mikkelsen, T.; Eschbacher, J.M.; Hermes, B.; Sisneros, V.; Barnholtz-Sloan, J.; Ostrom, Q. The Cancer Genome Atlas Low Grade Glioma Collection (TCGA-LGG) (Version 3) [Data set]. The Cancer Imaging Archive. 2016. Available online: https://www.cancerimagingarchive.net/collection/tcga-lgg/ (accessed on 5 March 2023).
- Upadhyay, N.; Waldman, A.D. Conventional MRI evaluation of gliomas. Br. J. Radiol. 2011, 84, S107. [Google Scholar] [CrossRef] [PubMed]
- Ge, C.; Qu, Q.; Gu, I.Y.H.; Store Jakola, A. 3D Multi-scale convolutional networks for glioma grading using MR images. In Proceedings of the 2018 25th IEEE International Conference on Image Processing (ICIP), Athens, Greece, 7–10 October 2018; pp. 141–145. [Google Scholar] [CrossRef]
- Pereira, S.; Meier, R.; Alves, V.; Reyes, M.; Silva, C.A. Automatic brain tumor grading from MRI data using convolutional neural networks and quality assessment. In Understanding and Interpreting Machine Learning in Medical Image Computing Applications, Proceedings of the MLCN 2018, DLF 2018, and iMIMIC 2018, Granada, Spain, 16–20 September 2018; Lecture Notes in Computer Science; Springer: Cham, Switzerland, 2018; Volume 11038, pp. 106–114. [Google Scholar] [CrossRef]
- Tandel, G.S.; Tiwari, A.; Kakde, O. Performance enhancement of MRI-based brain tumor classification using suitable segmentation method and deep learning-based ensemble algorithm. Biomed. Signal Process. Control. 2022, 78, 104018. [Google Scholar] [CrossRef]
- Deepak, S.; Ameer, P.M. Brain tumor classification using deep CNN features via transfer learning. Comput. Biol. Med. 2019, 111, 103345. [Google Scholar] [CrossRef]
- Swati, Z.N.K.; Zhao, Q.; Kabir, M.; Ali, F.; Ali, Z.; Ahmed, S.; Lu, J. Brain tumor classification for MR images using transfer learning and fine-tuning. Comput. Med. Imaging Graph. 2019, 75, 34–46. [Google Scholar] [CrossRef]
- Alaraimi, S.; Okedu, K.E.; Tianfield, H.; Holden, R.; Uthmani, O. Transfer learning networks with skip connections for classification of brain tumors. Int. J. Imaging Syst. Technol. 2021, 31, 1564–1582. [Google Scholar] [CrossRef]
- Hao, R.; Namdar, K.; Liu, L.; Khalvati, F. A Transfer Learning—Based Active Learning Framework for Brain Tumor Classification. Front. Artif. Intell. 2021, 4, 61. [Google Scholar] [CrossRef]
- Toğaçar, M.; Ergen, B.; Cömert, Z. Tumor type detection in brain MR images of the deep model developed using hypercolumn technique, attention modules, and residual blocks. Med. Biol. Eng. Comput. 2021, 59, 57–70. [Google Scholar] [CrossRef]
- Amou, M.A.; Xia, K.; Kamhi, S.; Mouhafid, M. A Novel MRI Diagnosis Method for Brain Tumor Classification Based on CNN and Bayesian Optimization. Healthcare 2022, 10, 494. [Google Scholar] [CrossRef] [PubMed]
- Aurna, N.F.; Yousuf, M.A.; Taher, K.A.; Azad, A.K.M.; Moni, M.A. A classification of MRI brain tumor based on two stage feature level ensemble of deep CNN models. Comput. Biol. Med. 2022, 146, 105539. [Google Scholar] [CrossRef] [PubMed]
- Tripathi, P.C.; Bag, S. A computer-aided grading of glioma tumor using deep residual networks fusion. Comput. Methods Programs Biomed. 2022, 215, 106597. [Google Scholar] [CrossRef] [PubMed]
- Deepa, S.; Janet, J.; Sumathi, S.; Ananth, J.P. Hybrid Optimization Algorithm Enabled Deep Learning Approach Brain Tumor Segmentation and Classification Using MRI. J. Digit. Imaging 2023, 36, 1–22. [Google Scholar] [CrossRef] [PubMed]
- Ghassemi, N.; Shoeibi, A.; Rouhani, M. Deep neural network with generative adversarial networks pre-training for brain tumor classification based on MR images. Biomed. Signal Process. Control. 2020, 57, 101678. [Google Scholar] [CrossRef]
- Ayadi, W.; Elhamzi, W.; Charfi, I.; Atri, M. Deep CNN for brain tumor classification. Neural Process. Lett. 2021, 53, 671–700. [Google Scholar] [CrossRef]
- Khan, A.R.; Khan, S.; Harouni, M.; Abbasi, R.; Iqbal, S.; Mehmood, Z. Brain tumor segmentation using K-means clustering and deep learning with synthetic data augmentation for classification. Microsc. Res. Tech. 2021, 84, 1389–1399. [Google Scholar] [CrossRef]
- Kumar, R.L.; Kakarla, J.; Isunuri, B.V.; Singh, M. Multi-class brain tumor classification using residual network and global average pooling. Multimed. Tools Appl. 2021, 80, 13429–13438. [Google Scholar] [CrossRef]
- Ahmad, B.; Sun, J.; You, Q.; Palade, V.; Mao, Z. Brain Tumor Classification Using a Combination of Variational Autoencoders and Generative Adversarial Networks. Biomedicines 2022, 10, 223. [Google Scholar] [CrossRef] [PubMed]
- Haq, A.U.; Li, J.P.; Kumar, R.; Ali, Z.; Khan, I.; Uddin, M.I.; Agbley, B.L.Y. MCNN: A multi-level CNN model for the classification of brain tumors in IoT-healthcare system. J. Ambient. Intell. Humaniz. Comput. 2022, 14, 4695–4706. [Google Scholar] [CrossRef]
- Anand, V.; Gupta, S.; Gupta, D.; Gulzar, Y.; Xin, Q.; Juneja, S.; Shah, A.; Shaikh, A. Weighted Average Ensemble Deep Learning Model for Stratification of Brain Tumor in MRI Images. Diagnostics 2023, 13, 1320. [Google Scholar] [CrossRef] [PubMed]
- Krishnapriya, S.; Karuna, Y. Pre-trained deep learning models for brain MRI image classification. Front. Hum. Neurosci. 2023, 17, 1150120. [Google Scholar] [CrossRef] [PubMed]
- Ge, C.; Gu, I.Y.H.; Jakola, A.S.; Yang, J. Deep semi-supervised learning for brain tumor classification. BMC Med. Imaging 2020, 20, 1–11. [Google Scholar] [CrossRef]
- Gab Allah, A.M.; Sarhan, A.M.; Elshennawy, N.M. Classification of brain MRI tumor images based on deep learning PGGAN augmentation. Diagnostics 2021, 11, 2343. [Google Scholar] [CrossRef] [PubMed]
- Gupta, R.K.; Bharti, S.; Kunhare, N.; Sahu, Y.; Pathik, N. Brain Tumor Detection and Classification Using Cycle Generative Adversarial Networks. Interdiscip. Sci. Comput. Life Sci. 2022, 14, 485–502. [Google Scholar] [CrossRef]
- Toğaçar, M.; Cömert, Z.; Ergen, B. Classification of brain MRI using hyper column technique with convolutional neural network and feature selection method. Expert Syst. Appl. 2020, 149, 113274. [Google Scholar] [CrossRef]
- Pei, L.; Hsu, W.W.; Chiang, L.A.; Guo, J.M.; Iftekharuddin, K.M.; Colen, R. A Hybrid Convolutional Neural Network Based-Method for Brain Tumor Classification Using mMRI and WSI. In Brainlesion: Glioma, Multiple Sclerosis, Stroke and Traumatic Brain Injuries, Proceedings of the BrainLes 2020, Lima, Peru, 4 October 2020; Lecture Notes in Computer Science; Springer: Cham, Switzerland, 2021; Volume 12659, pp. 487–496. [Google Scholar]
- Dang, K.; Vo, T.; Ngo, L.; Ha, H. A deep learning framework integrating MRI image preprocessing methods for brain tumor segmentation and classification. IBRO Neurosci. Rep. 2022, 13, 523–532. [Google Scholar] [CrossRef]
- Senan, E.M.; Jadhav, M.E.; Rassem, T.H.; Aljaloud, A.S.; Mohammed, B.A.; Al-Mekhlafi, Z.G. Early Diagnosis of Brain Tumour MRI Images Using Hybrid Techniques between Deep and Machine Learning. Comput. Math. Methods Med. 2022, 2022, 8330833. [Google Scholar] [CrossRef]
- Ge, C.; Gu, I.Y.H.; Jakola, A.S.; Yang, J. Deep learning and multi-sensor fusion for glioma classification using multistream 2D convolutional networks. In Proceedings of the Annual International Conference of the IEEE Engineering in Medicine and Biology Society, EMBS, Sarawak, Malaysia, 18–21 July 2018; pp. 5894–5897. [Google Scholar] [CrossRef]
- Yang, Y.; Yan, L.F.; Zhang, X.; Han, Y.; Nan, H.Y.; Hu, Y.C.; Hu, B.; Yan, S.L.; Zhang, J.; Cheng, D.L.; et al. Glioma grading on conventional MR images: A deep learning study with transfer learning. Front. Neurosci. 2018, 12, 804. [Google Scholar] [CrossRef] [PubMed]
- Lo, C.M.; Chen, Y.C.; Weng, R.C.; Hsieh, K.L.C. Intelligent Glioma Grading Based on Deep Transfer Learning of MRI Radiomic Features. Appl. Sci. 2019, 9, 4926. [Google Scholar] [CrossRef]
- Zahoor, M.M.; Qureshi, S.A.; Bibi, S.; Khan, S.H.; Khan, A.; Ghafoor, U.; Bhutta, M.R. A New Deep Hybrid Boosted and Ensemble Learning-Based Brain Tumor Analysis Using MRI. Sensors 2022, 22, 2726. [Google Scholar] [CrossRef] [PubMed]
- Rehman, A.; Naz, S.; Razzak, M.I.; Akram, F.; Imran, M. A Deep Learning-Based Framework for Automatic Brain Tumors Classification Using Transfer Learning. Circuits Syst. Signal Process. 2020, 39, 757–775. [Google Scholar] [CrossRef]
- Tandel, G.S.; Balestrieri, A.; Jujaray, T.; Khanna, N.N.; Saba, L.; Suri, J.S. Multiclass magnetic resonance imaging brain tumor classification using artificial intelligence paradigm. Comput. Biol. Med. 2020, 122, 103804. [Google Scholar] [CrossRef]
- Gutta, S.; Acharya, J.; Shiroishi, M.S.; Hwang, D.; Nayak, K.S. Improved Glioma Grading Using Deep Convolutional Neural Networks. Am. J. Neuroradiol. 2021, 42, 233–239. [Google Scholar] [CrossRef]
- Tandel, G.S.; Tiwari, A.; Kakde, O.G. Performance optimisation of deep learning models using majority voting algorithm for brain tumour classification. Comput. Biol. Med. 2021, 135, 104564. [Google Scholar] [CrossRef]
- Kazemi, A.; Shiri, M.E.; Sheikhahmadi, A.; Khodamoradi, M. Classifying tumor brain images using parallel deep learning algorithms. Comput. Biol. Med. 2022, 148, 105775. [Google Scholar] [CrossRef]
- Saravanan, S.; Kumar, V.V.; Sarveshwaran, V.; Indirajithu, A.; Elangovan, D.; Allayear, S.M. Computational and Mathematical Methods in Medicine Glioma Brain Tumor Detection and Classification Using Convolutional Neural Network. Comput. Math. Methods Med. 2022, 2022, 4380901. [Google Scholar] [CrossRef]
- Athisayamani, S.; Antonyswamy, R.S.; Sarveshwaran, V.; Almeshari, M.; Alzamil, Y.; Ravi, V. Feature Extraction Using a Residual Deep Convolutional Neural Network (ResNet-152) and Optimized Feature Dimension Reduction for MRI Brain Tumor Classification. Diagnostics 2023, 13, 668. [Google Scholar] [CrossRef]
- Bairagi, V.K.; Gumaste, P.P.; Rajput, S.H.; Chethan, K.S. Automatic brain tumor detection using CNN transfer learning approach. Med. Biol. Eng. Comput. 2023, 61, 1821–1836. [Google Scholar] [CrossRef]
- Gao, P.; Shan, W.; Guo, Y.; Wang, Y.; Sun, R.; Cai, J.; Li, H.; Chan, W.S.; Liu, P.; Yi, L.; et al. Development and Validation of a Deep Learning Model for Brain Tumor Diagnosis and Classification Using Magnetic Resonance Imaging. JAMA Netw. Open 2022, 5, e2225608. [Google Scholar] [CrossRef] [PubMed]
- Jeong, S.W.; Cho, H.H.; Lee, S.; Park, H. Robust multimodal fusion network using adversarial learning for brain tumor grading. Comput. Methods Programs Biomed. 2022, 226, 107165. [Google Scholar] [CrossRef]
- Maqsood, S.; Damaševičius, R.; Maskeliūnas, R. Multi-Modal Brain Tumor Detection Using Deep Neural Network and Multiclass SVM. Medicina 2022, 58, 1090. [Google Scholar] [CrossRef] [PubMed]
- Xiong, D.; Ren, X.; Huang, W.; Wang, R.; Ma, L.; Gan, T.; Ai, K.; Wen, T.; Li, Y.; Wang, P.; et al. Noninvasive Classification of Glioma Subtypes Using Multiparametric MRI to Improve Deep Learning. Diagnostics 2022, 12, 3063. [Google Scholar] [CrossRef] [PubMed]
- Hossain, S.; Chakrabarty, A.; Gadekallu, T.R.; Alazab, M.; Piran, M.J. Vision Transformers, Ensemble Model, and Transfer Learning Leveraging Explainable AI for Brain Tumor Detection and Classification. IEEE J. Biomed. Health Inform. 2023. [Google Scholar] [CrossRef] [PubMed]
- van der Voort, S.R.; Incekara, F.; Wijnenga, M.M.; Kapsas, G.; Gahrmann, R.; Schouten, J.W.; Nandoe Tewarie, R.; Lycklama, G.J.; De Witt Hamer, P.C.; Eijgelaar, R.S.; et al. Combined molecular subtyping, grading, and segmentation of glioma using multi-task deep learning. Neuro-Oncology 2023, 25, 279–289. [Google Scholar] [CrossRef] [PubMed]
- Xu, C.; Peng, Y.; Zhu, W.; Chen, Z.; Li, J.; Tan, W.; Zhang, Z.; Chen, X. An automated approach for predicting glioma grade and survival of LGG patients using CNN and radiomics. Front. Oncol. 2022, 12, 969907. [Google Scholar] [CrossRef]
- Kibriya, H.; Amin, R.; Kim, J.; Nawaz, M.; Gantassi, R. A Novel Approach for Brain Tumor Classification Using an Ensemble of Deep and Hand-Crafted Features. Sensors 2023, 23, 4693. [Google Scholar] [CrossRef]
- Kutlu, H.; Avcı, E. A Novel Method for Classifying Liver and Brain Tumors Using Convolutional Neural Networks, Discrete Wavelet Transform and Long Short-Term Memory Networks. Sensors 2019, 19, 1992. [Google Scholar] [CrossRef]
- Almalki, Y.E.; Ali, M.U.; Kallu, K.D.; Masud, M.; Zafar, A.; Alduraibi, S.K.; Irfan, M.; Basha, M.A.A.; Alshamrani, H.A.; Alduraibi, A.K.; et al. Isolated Convolutional-Neural-Network-Based Deep-Feature Extraction for Brain Tumor Classification Using Shallow Classifier. Diagnostics 2022, 12, 1793. [Google Scholar] [CrossRef] [PubMed]
- Kibriya, H.; Amin, R.; Alshehri, A.H.; Masood, M.; Alshamrani, S.S.; Alshehri, A. A Novel and Effective Brain Tumor Classification Model Using Deep Feature Fusion and Famous Machine Learning Classifiers. Comput. Intell. Neurosci. 2022, 2022, 7897669. [Google Scholar] [CrossRef] [PubMed]
- Shirehjini, O.F.; Mofrad, F.B.; Shahmohammadi, M.; Karami, F. Grading of gliomas using transfer learning on MRI images. Magn. Reson. Mater. Phys. Biol. Med. 2023, 36, 43–53. [Google Scholar] [CrossRef] [PubMed]
- Rajinikanth, V.; Kadry, S.; Damaševičius, R.; Sujitha, R.A.; Balaji, G.; Mohammed, M.A. Glioma/glioblastoma detection in brain MRI using pre-trained deep-learning scheme. In Proceedings of the 2022 Third International Conference on Intelligent Computing Instrumentation and Control Technologies (ICICICT), Guangzhou, China, 12–14 August 2022; pp. 987–990. [Google Scholar]
- Rasool, M.; Ismail, N.; Boulila, W.; Ammar, A.; Samma, H.; Yafooz, W.S.; Emara, A.H. A Hybrid Deep Learning Model for Brain Tumour Classification. Entropy 2022, 24, 799. [Google Scholar] [CrossRef] [PubMed]
- Sekhar, A.; Biswas, S.; Hazra, R.; Sunaniya, A.K.; Mukherjee, A.; Yang, L. Brain Tumor Classification Using Fine-Tuned GoogLeNet Features and Machine Learning Algorithms: IoMT Enabled CAD System. IEEE J. Biomed. Health Inform. 2022, 26, 983–991. [Google Scholar] [CrossRef]
- AlTahhan, F.E.; Khouqeer, G.A.; Saadi, S.; Elgarayhi, A.; Sallah, M. Refined Automatic Brain Tumor Classification Using Hybrid Convolutional Neural Networks for MRI Scans. Diagnostics 2023, 13, 864. [Google Scholar] [CrossRef] [PubMed]
- Kumar, S.; Choudhary, S.; Jain, A.; Singh, K.; Ahmadian, A.; Bajuri, M.Y. Brain Tumor Classification Using Deep Neural Network and Transfer Learning. Brain Topogr. 2023, 36, 305–318. [Google Scholar] [CrossRef]
- Ma, X.; Jia, F. Brain tumor classification with multimodal MR and pathology images. In Brainlesion: Glioma, Multiple Sclerosis, Stroke and Traumatic Brain Injuries, Proceedings of the BrainLes 2019, Shenzhen, China, 17 October 2019; Lecture Notes in Computer Science; Springer: Cham, Switzerland, 2020; Volume 11993, pp. 343–352. [Google Scholar] [CrossRef]
- Yin, B.; Cheng, H.; Wang, F.; Wang, Z. Brain tumor classification based on MRI images and noise reduced pathology images. In Proceedings of the Brainlesion: Glioma, Multiple Sclerosis, Stroke and Traumatic Brain Injuries: 6th International Workshop, BrainLes 2020, Lima, Perú, 4–8 October 2020; Springer: Berlin/Heidelberg, Germany, 2021; pp. 465–474. [Google Scholar]
- Hsu, W.W.; Guo, J.M.; Pei, L.; Chiang, L.A.; Li, Y.F.; Hsiao, J.C.; Colen, R.; Liu, P. A weakly supervised deep learning-based method for glioma subtype classification using WSI and mpMRIs. Sci. Rep. 2022, 12, 6111. [Google Scholar] [CrossRef]
- Wang, X.; Wang, R.; Yang, S.; Zhang, J.; Wang, M.; Zhong, D.; Zhang, J.; Han, X. Combining Radiology and Pathology for Automatic Glioma Classification. Front. Bioeng. Biotechnol. 2022, 10, 841958. [Google Scholar] [CrossRef]
- Kang, J.; Ullah, Z.; Gwak, J. MRI-Based Brain Tumor Classification Using Ensemble of Deep Features and Machine Learning Classifiers. Sensors 2021, 21, 2222. [Google Scholar] [CrossRef]
- Noreen, N.; Palaniappan, S.; Qayyum, A.; Ahmad, I.; Alassafi, M.O. Brain Tumor Classification Based on Fine-Tuned Models and the Ensemble Method. Comput. Mater. Contin. 2021, 67, 3967–3982. [Google Scholar] [CrossRef]
- Coupet, M.; Urruty, T.; Leelanupab, T.; Naudin, M.; Bourdon, P.; Maloigne, C.F.; Guillevin, R. A multi-sequences MRI deep framework study applied to glioma classfication. Multimed. Tools Appl. 2022, 81, 13563–13591. [Google Scholar] [CrossRef] [PubMed]
- Tummala, S.; Kadry, S.; Bukhari, S.A.C.; Rauf, H.T. Classification of Brain Tumor from Magnetic Resonance Imaging Using Vision Transformers Ensembling. Curr. Oncol. 2022, 29, 7498–7511. [Google Scholar] [CrossRef] [PubMed]
- Al-Zoghby, A.M.; Al-Awadly, E.M.K.; Moawad, A.; Yehia, N.; Ebada, A.I. Dual Deep CNN for Tumor Brain Classification. Diagnostics 2023, 13, 2050. [Google Scholar] [CrossRef] [PubMed]
- Asif, S.; Zhao, M.; Chen, X.; Zhu, Y. BMRI-NET: A Deep Stacked Ensemble Model for Multi-class Brain Tumor Classification from MRI Images. Interdiscip. Sci. Comput. Life Sci. 2023, 15, 499–514. [Google Scholar] [CrossRef]
- Tandel, G.S.; Tiwari, A.; Kakde, O.G.; Gupta, N.; Saba, L.; Suri, J.S. Role of Ensemble Deep Learning for Brain Tumor Classification in Multiple Magnetic Resonance Imaging Sequence Data. Diagnostics 2023, 13, 481. [Google Scholar] [CrossRef]
- Decuyper, M.; Bonte, S.; Deblaere, K.; Holen, R.V. Automated MRI based pipeline for segmentation and prediction of grade, IDH mutation and 1p19q co-deletion in glioma. Comput. Med. Imaging Graph. 2021, 88, 101831. [Google Scholar] [CrossRef]
- Tripathi, P.C.; Bag, S. An attention-guided CNN framework for segmentation and grading of glioma using 3D MRI scans. IEEE/ACM Trans. Comput. Biol. Bioinform. 2022, 3, 1890–1904. [Google Scholar] [CrossRef]
- Mzoughi, H.; Njeh, I.; Wali, A.; Slima, M.B.; BenHamida, A.; Mhiri, C.; Mahfoudhe, K.B. Deep Multi-Scale 3D Convolutional Neural Network (CNN) for MRI Gliomas Brain Tumor Classification. J. Digit. Imaging 2020, 33, 903–915. [Google Scholar] [CrossRef]
- Pei, L.; Vidyaratne, L.; Rahman, M.M.; Iftekharuddin, K.M. Context aware deep learning for brain tumor segmentation, subtype classification, and survival prediction using radiology images. Sci. Rep. 2020, 10, 19726. [Google Scholar] [CrossRef]
- Chakrabarty, S.; Sotiras, A.; Milchenko, M.; Lamontagne, P.; Hileman, M.; Marcus, D. MRI-based identification and classification of major intracranial tumor types by using a 3D convolutional neural network: A retrospective multi-institutional analysis. Radiol. Artif. Intell. 2021, 3, e200301. [Google Scholar] [CrossRef] [PubMed]
- Yamashiro, H.; Teramoto, A.; Saito, K.; Fujita, H. Development of a Fully Automated Glioma-Grading Pipeline Using Post-Contrast T1-Weighted Images Combined with Cloud-Based 3D Convolutional Neural Network. Appl. Sci. 2021, 11, 5118. [Google Scholar] [CrossRef]
- Danilov, G.; Korolev, V.; Shifrin, M.; Ilyushin, E.; Maloyan, N.; Saada, D.; Ishankulov, T.; Afandiev, R.; Shevchenko, A.; Konakova, T.; et al. Noninvasive Glioma Grading with Deep Learning: A Pilot Study. Stud. Health Technol. Inform. 2022, 290, 675–678. [Google Scholar] [CrossRef] [PubMed]
- Samee, N.A.; Ahmad, T.; Mahmoud, N.F.; Atteia, G.; Abdallah, H.A.; Rizwan, A. Clinical Decision Support Framework for Segmentation and Classification of Brain Tumor MRIs Using a U-Net and DCNN Cascaded Learning Algorithm. Healthcare 2022, 10, 2340. [Google Scholar] [CrossRef] [PubMed]
- Hussain, S.; Haider, S.; Maqsood, S.; Damaševičius, R.; Maskeliūnas, R.; Khan, M. ETISTP: An Enhanced Model for Brain Tumor Identification and Survival Time Prediction. Diagnostics 2023, 13, 1456. [Google Scholar] [CrossRef]
- Rui, W.; Zhang, S.; Shi, H.; Sheng, Y.; Zhu, F.; Yao, Y.; Chen, X.; Cheng, H.; Zhang, Y.; Aili, A.; et al. Deep Learning-Assisted Quantitative Susceptibility Mapping as a Tool for Grading and Molecular Subtyping of Gliomas. Phenomics 2023, 3, 243–254. [Google Scholar] [CrossRef]
- Guo, S.; Wang, L.; Chen, Q.; Wang, L.; Zhang, J.; Zhu, Y. Multimodal MRI Image Decision Fusion-Based Network for Glioma Classification. Front. Oncol. 2022, 12, 819673. [Google Scholar] [CrossRef]
- Díaz-Pernas, F.J.; Martínez-Zarzuela, M.; Antón-Rodríguez, M.; González-Ortega, D. A deep learning approach for brain tumor classification and segmentation using a multiscale convolutional neural network. Healthcare 2021, 9, 153. [Google Scholar] [CrossRef]
- Gilanie, G.; Bajwa, U.I.; Waraich, M.M.; Anwar, M.W. Risk-free WHO grading of astrocytoma using convolutional neural networks from MRI images. Multimed. Tools Appl. 2021, 80, 4295–4306. [Google Scholar] [CrossRef]
- Guan, Y.; Aamir, M.; Rahman, Z.; Ali, A.; Abro, W.A.; Dayo, Z.A.; Bhutta, M.S.; Hu, Z.; Guan, Y.; Aamir, M.; et al. A framework for efficient brain tumor classification using MRI images. Math. Biosci. Eng. 2021, 18, 5790–5815. [Google Scholar] [CrossRef]
- Gull, S.; Akbar, S.; Khan, H.U. Automated Detection of Brain Tumor through Magnetic Resonance Images Using Convolutional Neural Network. BioMed Res. Int. 2021, 2021, 3365043. [Google Scholar] [CrossRef]
- Özcan, H.; Emiroğlu, B.G.; Sabuncuoğlu, H.; Özdoğan, S.; Soyer, A.; Saygı, T. A comparative study for glioma classification using deep convolutional neural networks. Math. Biosci. Eng. 2021, 18, 1550–1572. [Google Scholar] [CrossRef] [PubMed]
- Aamir, M.; Rahman, Z.; Dayo, Z.A.; Abro, W.A.; Uddin, M.I.; Khan, I.; Imran, A.S.; Ali, Z.; Ishfaq, M.; Guan, Y.; et al. A deep learning approach for brain tumor classification using MRI images. Comput. Electr. Eng. 2022, 101, 108105. [Google Scholar] [CrossRef]
- Wu, P.; Wang, Z.; Zheng, B.; Li, H.; Alsaadi, F.E.; Zeng, N. AGGN: Attention-based glioma grading network with multi-scale feature extraction and multi-modal information fusion. Comput. Biol. Med. 2023, 152, 106457. [Google Scholar] [CrossRef]
- Badža, M.M.; Barjaktarović, M.Č. Classification of brain tumors from MRI images using a convolutional neural network. Appl. Sci. 2020, 10, 1999. [Google Scholar] [CrossRef]
- Ismael, S.A.A.; Mohammed, A.; Hefny, H. An enhanced deep learning approach for brain cancer MRI images classification using residual networks. Artif. Intell. Med. 2020, 102, 101779. [Google Scholar] [CrossRef]
- Alanazi, M.F.; Ali, M.U.; Hussain, S.J.; Zafar, A.; Mohatram, M.; Irfan, M.; AlRuwaili, R.; Alruwaili, M.; Ali, N.H.; Albarrak, A.M. Brain tumor/mass classification framework using magnetic-resonance-imaging-based isolated and developed transfer deep-learning model. Sensors 2022, 22, 372. [Google Scholar] [CrossRef]
- O’Reilly, T.; Teeuwisse, W.M.; de Gans, D.; Koolstra, K.; Webb, A.G. In vivo 3D brain and extremity MRI at 50 mT using a permanent magnet Halbach array. Magn. Reson. Med. 2021, 85, 495–505. [Google Scholar] [CrossRef]
- Cooley, C.Z.; McDaniel, P.C.; Stockmann, J.P.; Srinivas, S.A.; Cauley, S.F.; Śliwiak, M.; Sappo, C.R.; Vaughn, C.F.; Guerin, B.; Rosen, M.S.; et al. A portable scanner for magnetic resonance imaging of the brain. Nat. Biomed. Eng. 2020, 5, 229–239. [Google Scholar] [CrossRef]
- Man, C.; Lau, V.; Su, S.; Zhao, Y.; Xiao, L.; Ding, Y.; Leung, G.K.; Leong, A.T.; Wu, E.X. Deep learning enabled fast 3D brain MRI at 0.055 tesla. Sci. Adv. 2023, 9, eadi9327. [Google Scholar] [CrossRef]
- Swoop Portable MR System. Available online: https://hyperfine.io.assets/pdfs/Swoop (accessed on 6 November 2023).
- Altaf, A.; Baqai, M.W.S.; Urooj, F.; Alam, M.S.; Aziz, H.F.; Mubarak, F.; Knopp, E.A.; Siddiqui, K.M.; Enam, S.A. Utilization of an ultra-low-field, portable magnetic resonance imaging for brain tumor assessment in lower middle-income countries. Surg. Neurol. Int. 2023, 14, 260. [Google Scholar] [CrossRef] [PubMed]
- Altaf, A.; Baqai, M.W.S.; Urooj, F.; Alam, M.S.; Aziz, H.F.; Mubarak, F.; Knopp, E.; Siddiqui, K.; Enam, S.A. Intraoperative use of ultra-low-field, portable magnetic resonance imaging—First report. Surg. Neurol. Int. 2023, 14, 212. [Google Scholar] [CrossRef] [PubMed]
- Abd-Ellah, M.K.; Awad, A.I.; Hamed, H.F.; Khalaf, A.A. Parallel deep CNN structure for glioma detection and classification via brain MRI Images. In Proceedings of the 2019 31st International Conference on Microelectronics (ICM), Cairo, Egypt, 15–18 December 2019; pp. 304–307. [Google Scholar]
- Anaraki, A.K.; Ayati, M.; Kazemi, F. Magnetic resonance imaging-based brain tumor grades classification and grading via convolutional neural networks and genetic algorithms. Biocybern. Biomed. Eng. 2019, 39, 63–74. [Google Scholar] [CrossRef]
- Hemanth, D.J.; Anitha, J.; Naaji, A.; Geman, O.; Popescu, D.E.; Son, L.H. A Modified Deep Convolutional Neural Network for Abnormal Brain Image Classification. IEEE Access 2019, 7, 4275–4283. [Google Scholar] [CrossRef]
- Cubuk, E.D.; Zoph, B.; Mane, D.; Vasudevan, V.; Le, Q.V. AutoAugment: Learning Augmentation Policies from Data. arXiv 2018. [Google Scholar] [CrossRef]
- Muneer, K.V.A.; Rajendran, V.R.; Joseph, K.P. Glioma Tumor Grade Identification Using Artificial Intelligent Techniques. J. Med. Syst. 2019, 43, 1–12. [Google Scholar] [CrossRef]
- Rajini, N.H. Brain Tumor Image Classification and Grading Using Convolutional Neural Network and Particle Swarm Optimization Algorithm. Int. J. Eng. Adv. Technol. (IJEAT) 2019, 8, 2249–8958. [Google Scholar]
- Rahmathunneesa, A.P.; Muneer, K.V.A. Performance analysis of pre-trained deep learning networks for brain tumor categorization. In Proceedings of the 2019 9th International Conference on Advances in Computing and Communication (ICACC), Changsha, China, 18–20 October 2019; pp. 253–257. [Google Scholar] [CrossRef]
- Sajjad, M.; Khan, S.; Muhammad, K.; Wu, W.; Ullah, A.; Baik, S.W. Multi-grade brain tumor classification using deep CNN with extensive data augmentation. J. Comput. Sci. 2019, 30, 174–182. [Google Scholar] [CrossRef]
- Sultan, H.H.; Salem, N.M.; Al-Atabany, W. Multi-Classification of Brain Tumor Images Using Deep Neural Network. IEEE Access 2019, 7, 69215–69225. [Google Scholar] [CrossRef]
- Toğaçar, M.; Ergen, B.; Cömert, Z. BrainMRNet: Brain tumor detection using magnetic resonance images with a novel convolutional neural network model. Med. Hypotheses 2020, 134, 109531. [Google Scholar] [CrossRef]
- Amin, J.; Sharif, M.; Gul, N.; Yasmin, M.; Shad, S.A. Brain tumor classification based on DWT fusion of MRI sequences using convolutional neural network. Pattern Recognit. Lett. 2020, 129, 115–122. [Google Scholar] [CrossRef]
- Afshar, P.; Plataniotis, K.N.; Mohammadi, A. BoostCaps: A boosted capsule network for brain tumor classification. In Proceedings of the Annual International Conference of the IEEE Engineering in Medicine and Biology Society, Virtual, 20–24 July 2020; pp. 1075–1079. [Google Scholar] [CrossRef]
- Bhanothu, Y.; Kamalakannan, A.; Rajamanickam, G. Detection and classification of brain tumor in MRI images using deep convolutional network. In Proceedings of the 2020 6th International Conference on Advanced Computing and Communication Systems (ICACCS), Coimbatore, India, 6–7 March 2020; pp. 248–252. [Google Scholar] [CrossRef]
- Çinar, A.; Yildirim, M. Detection of tumors on brain MRI images using the hybrid convolutional neural network architecture. Med. Hypotheses 2020, 139, 109684. [Google Scholar] [CrossRef] [PubMed]
- Khan, H.A.; Jue, W.; Mushtaq, M.; Mushtaq, M.U.; Khan, H.A.; Jue, W.; Mushtaq, M.; Mushtaq, M.U. Brain tumor classification in MRI image using convolutional neural network. Math. Biosci. Eng. 2020, 17, 6203–6216. [Google Scholar] [CrossRef] [PubMed]
- Mohammed, B.A.; Al-Ani, S. An efficient approach to diagnose brain tumors through deep CNN. Math. Biosci. Eng. 2020, 18, 851–867. [Google Scholar] [CrossRef] [PubMed]
- Naser, M.A.; Deen, M.J. Brain tumor segmentation and grading of lower-grade glioma using deep learning in MRI images. Comput. Biol. Med. 2020, 121, 103758. [Google Scholar] [CrossRef] [PubMed]
- Noreen, N.; Palaniappan, S.; Qayyum, A.; Ahmad, I.; Imran, M.; Shoaib, M. A deep learning model based on concatenation approach for the diagnosis of brain tumor. IEEE Access 2020, 8, 55135–55144. [Google Scholar] [CrossRef]
- Saxena, P.; Maheshwari, A.; Maheshwari, S. Predictive Modeling of Brain Tumor: A Deep Learning Approach. Adv. Intell. Syst. Comput. 2020, 1189, 275–285. [Google Scholar] [CrossRef]
- Sharif, M.I.; Li, J.P.; Khan, M.A.; Saleem, M.A. Active deep neural network features selection for segmentation and recognition of brain tumors using MRI images. Pattern Recognit. Lett. 2020, 129, 181–189. [Google Scholar] [CrossRef]
- Vimal Kurup, R.; Sowmya, V.; Soman, K. Effect of data pre-processing on brain tumor classification using capsulenet. In Proceedings of the ICICCT 2019—System Reliability, Quality Control, Safety, Maintenance and Management: Applications to Electrical, Electronics and Computer Science and Engineering, Hyderabad, India, 9–11 January 2019; Springer: Berlin/Heidelberg, Germany, 2020; pp. 110–119. [Google Scholar]
- Bashir-Gonbadi, F.; Khotanlou, H. Brain tumor classification using deep convolutional autoencoder-based neural network: Multi-task approach. Multimed. Tools Appl. 2021, 80, 19909–19929. [Google Scholar] [CrossRef]
- Gu, X.; Shen, Z.; Xue, J.; Fan, Y.; Ni, T. Brain Tumor MR Image Classification Using Convolutional Dictionary Learning with Local Constraint. Front. Neurosci. 2021, 15, 679847. [Google Scholar] [CrossRef]
- Irmak, E. Multi-Classification of Brain Tumor MRI Images Using Deep Convolutional Neural Network with Fully Optimized Framework. Iran. J. Sci. Technol. Trans. Electr. Eng. 2021, 45, 1015–1036. [Google Scholar] [CrossRef]
- Kader, I.A.E.; Xu, G.; Shuai, Z.; Saminu, S.; Javaid, I.; Ahmad, I.S.; Kamhi, S. Brain Tumor Detection and Classification on MR Images by a Deep Wavelet Auto-Encoder Model. Diagnostics 2021, 11, 1589. [Google Scholar] [CrossRef]
- Kader, I.A.E.; Xu, G.; Shuai, Z.; Saminu, S.; Javaid, I.; Ahmad, I.S. Differential Deep Convolutional Neural Network Model for Brain Tumor Classification. Brain Sci. 2021, 11, 352. [Google Scholar] [CrossRef]
- Kakarla, J.; Isunuri, B.V.; Doppalapudi, K.S.; Bylapudi, K.S.R. Three-class classification of brain magnetic resonance images using average-pooling convolutional neural network. Int. J. Imaging Syst. Technol. 2021, 31, 1731–1740. [Google Scholar] [CrossRef]
- Masood, M.; Nazir, T.; Nawaz, M.; Mehmood, A.; Rashid, J.; Kwon, H.Y.; Mahmood, T.; Hussain, A. A novel deep learning method for recognition and classification of brain tumors from MRI images. Diagnostics 2021, 11, 744. [Google Scholar] [CrossRef] [PubMed]
- Sadad, T.; Rehman, A.; Munir, A.; Saba, T.; Tariq, U.; Ayesha, N.; Abbasi, R. Brain tumor detection and multi-classification using advanced deep learning techniques. Microsc. Res. Tech. 2021, 84, 1296–1308. [Google Scholar] [CrossRef] [PubMed]
- MohamedMetwalySherif. Brain Tumor Dataset. 2020. Available online: https://www.kaggle.com/datasets/mohamedmetwalysherif/braintumordataset (accessed on 10 June 2023).
- Chitnis, S.; Hosseini, R.; Xie, P. Brain tumor classification based on neural architecture search. Sci. Rep. 2022, 12, 19206. [Google Scholar] [CrossRef] [PubMed]
- Ekong, F.; Yu, Y.; Patamia, R.A.; Feng, X.; Tang, Q.; Mazumder, P.; Cai, J. Bayesian Depth-Wise Convolutional Neural Network Design for Brain Tumor MRI Classification. Diagnostics 2022, 12, 1657. [Google Scholar] [CrossRef]
- Gaur, L.; Bhandari, M.; Razdan, T.; Mallik, S.; Zhao, Z. Explanation-Driven Deep Learning Model for Prediction of Brain Tumour Status Using MRI Image Data. Front. Genet. 2022, 13, 448. [Google Scholar] [CrossRef]
- Gurunathan, A.; Krishnan, B. A Hybrid CNN-GLCM Classifier For Detection And Grade Classification Of Brain Tumor. Brain Imaging Behav. 2022, 16, 1410–1427. [Google Scholar] [CrossRef]
- Isunuri, B.V.; Kakarla, J. Three-class brain tumor classification from magnetic resonance images using separable convolution based neural network. Concurr. Comput. Pract. Exp. 2022, 34, e6541. [Google Scholar] [CrossRef]
- Khazaee, Z.; Langarizadeh, M.; Ahmadabadi, M.E.S. Developing an Artificial Intelligence Model for Tumor Grading and Classification, Based on MRI Sequences of Human Brain Gliomas. Int. J. Cancer Manag. 2022, 15, 120638. [Google Scholar] [CrossRef]
- Koli, R.; Lotya, S.; Govekar, P.; Sachdev, K.; Bhatia, G. Detection and classification of brain tumor using MRI images. In Proceedings of the ICT Analysis and Applications, Goa, India, 29–30 July 2022; Springer: Berlin/Heidelberg, Germany, 2022; pp. 393–402. [Google Scholar]
- Lakshmi, M.J.; Rao, S.N. Brain tumor magnetic resonance image classification: A deep learning approach. Soft Comput. 2022, 26, 6245–6253. [Google Scholar] [CrossRef]
- Murthy, M.Y.B.; Koteswararao, A.; Babu, M.S. Adaptive fuzzy deformable fusion and optimized CNN with ensemble classification for automated brain tumor diagnosis. Biomed. Eng. Lett. 2022, 12, 37–58. [Google Scholar] [CrossRef] [PubMed]
- Nayak, D.R.; Padhy, N.; Mallick, P.K.; Zymbler, M.; Kumar, S. Brain Tumor Classification Using Dense Efficient-Net. Axioms 2022, 11, 34. [Google Scholar] [CrossRef]
- Raza, A.; Ayub, H.; Khan, J.A.; Ahmad, I.; S. Salama, A.; Daradkeh, Y.I.; Javeed, D.; Ur Rehman, A.; Hamam, H. A hybrid deep learning-based approach for brain tumor classification. Electronics 2022, 11, 1146. [Google Scholar] [CrossRef]
- Rizwan, M.; Shabbir, A.; Javed, A.R.; Shabbir, M.; Baker, T.; Obe, D.A.J. Brain Tumor and Glioma Grade Classification Using Gaussian Convolutional Neural Network. IEEE Access 2022, 10, 29731–29740. [Google Scholar] [CrossRef]
- Samee, N.A.; Mahmoud, N.F.; Atteia, G.; Abdallah, H.A.; Alabdulhafith, M.; Al-Gaashani, M.S.; Ahmad, S.; Muthanna, M.S.A. Classification Framework for Medical Diagnosis of Brain Tumor with an Effective Hybrid Transfer Learning Model. Diagnostics 2022, 12, 2541. [Google Scholar] [CrossRef]
- Sangeetha, S.K.; Muthukumaran, V.; Deeba, K.; Rajadurai, H.; Maheshwari, V.; Dalu, G.T. Multiconvolutional Transfer Learning for 3D Brain Tumor Magnetic Resonance Images. Comput. Intell. Neurosci. 2022, 2022, 8722476. [Google Scholar] [CrossRef]
- Srinivas, C.; Nandini, N.P.; Zakariah, M.; Alothaibi, Y.A.; Shaukat, K.; Partibane, B.; Awal, H. Deep Transfer Learning Approaches in Performance Analysis of Brain Tumor Classification Using MRI Images. J. Healthc. Eng. 2022, 2022, 3264367. [Google Scholar] [CrossRef]
- Erickson, B.; Akkus, Z.; Sedlar, J.; Korfiatis, P. Data from LGG-1p19qDeletion (Version 2) [Data set]. The Cancer Imaging Archive. 2017. Available online: https://www.cancerimagingarchive.net/collection/lgg-1p19qdeletion/ (accessed on 14 July 2023).
- Vankdothu, R.; Hameed, M.A.; Fatima, H. A brain tumor identification and classification using deep learning based on CNN-LSTM method. Comput. Electr. Eng. 2022, 101, 107960. [Google Scholar] [CrossRef]
- Yazdan, S.A.; Ahmad, R.; Iqbal, N.; Rizwan, A.; Khan, A.N.; Kim, D.H. An Efficient Multi-Scale Convolutional Neural Network Based Multi-Class Brain MRI Classification for SaMD. Tomography 2022, 8, 1905–1927. [Google Scholar] [CrossRef] [PubMed]
- Anagun, Y. Smart brain tumor diagnosis system utilizing deep convolutional neural networks. Multimed. Tools Appl. 2023, 82, 44527–44553. [Google Scholar] [CrossRef] [PubMed]
- Apostolopoulos, I.D.; Aznaouridis, S.; Tzani, M. An Attention-Based Deep Convolutional Neural Network for Brain Tumor and Disorder Classification and Grading in Magnetic Resonance Imaging. Information 2023, 14, 174. [Google Scholar] [CrossRef]
- Komaravolu, A. Brain Tumor MRI Images. Available online: https://www.kaggle.com/datasets/adityakomaravolu/brain-tumor-mri-images (accessed on 10 June 2023).
- Yaseen, R. Brain Tumor Data MRI. Available online: https://www.kaggle.com/datasets/roroyaseen/brain-tumor-data-mri (accessed on 10 June 2023).
- El-Wahab, B.S.A.; Nasr, M.E.; Khamis, S.; Ashour, A.S. BTC-fCNN: Fast Convolution Neural Network for Multi-class Brain Tumor Classification. Health Inf. Sci. Syst. 2023, 11, 3. [Google Scholar] [CrossRef]
- Mahmud, M.I.; Mamun, M.; Abdelgawad, A. A Deep Analysis of Brain Tumor Detection from MR Images Using Deep Learning Networks. Algorithms 2023, 16, 176. [Google Scholar] [CrossRef]
- Muezzinoglu, T.; Baygin, N.; Tuncer, I.; Barua, P.D.; Baygin, M.; Dogan, S.; Tuncer, T.; Palmer, E.E.; Cheong, K.H.; Acharya, U.R. PatchResNet: Multiple Patch Division–Based Deep Feature Fusion Framework for Brain Tumor Classification Using MRI Images. J. Digit. Imaging 2023, 12, 973–987. [Google Scholar] [CrossRef] [PubMed]
- Özkaraca, O.; İhsan Bağrıaçık, O.; Gürüler, H.; Khan, F.; Hussain, J.; Khan, J.; e Laila, U. Multiple Brain Tumor Classification with Dense CNN Architecture Using Brain MRI Images. Life 2023, 13, 349. [Google Scholar] [CrossRef]
- Nickparvar, M. Brain Tumor MRI Dataset. 2021. Available online: https://www.kaggle.com/datasets/masoudnickparvar/brain-tumor-mri-dataset?select=Training (accessed on 4 June 2023).
- Özkaya, C.; Şağıroğlu, C. Glioma Grade Classification Using CNNs and Segmentation with an Adaptive Approach Using Histogram Features in Brain MRIs. IEEE Access 2023, 11, 52275–52287. [Google Scholar] [CrossRef]
- Rasheed, Z.; Ma, Y.K.; Ullah, I.; Shloul, T.A.; Tufail, A.B.; Ghadi, Y.Y.; Khan, M.Z.; Mohamed, H.G. Automated Classification of Brain Tumors from Magnetic Resonance Imaging Using Deep Learning. Brain Sci. 2023, 13, 602. [Google Scholar] [CrossRef]
- Srinivasan, S.; Bai, P.S.M.; Mathivanan, S.K.; Muthukumaran, V.; Babu, J.C.; Vilcekova, L. Grade Classification of Tumors from Brain Magnetic Resonance Images Using a Deep Learning Technique. Diagnostics 2023, 13, 1153. [Google Scholar] [CrossRef] [PubMed]
- van der Voort, S.R.; Incekara, F.; Wijnenga, M.M.; Kapsas, G.; Gahrmann, R.; Schouten, J.W.; Dubbink, H.J.; Vincent, A.J.; van den Bent, M.J.; French, P.J.; et al. The Erasmus Glioma Database (EGD): Structural MRI scans, WHO 2016 subtypes, and segmentations of 774 patients with glioma. Data Brief 2021, 37, 107191. [Google Scholar] [CrossRef] [PubMed]

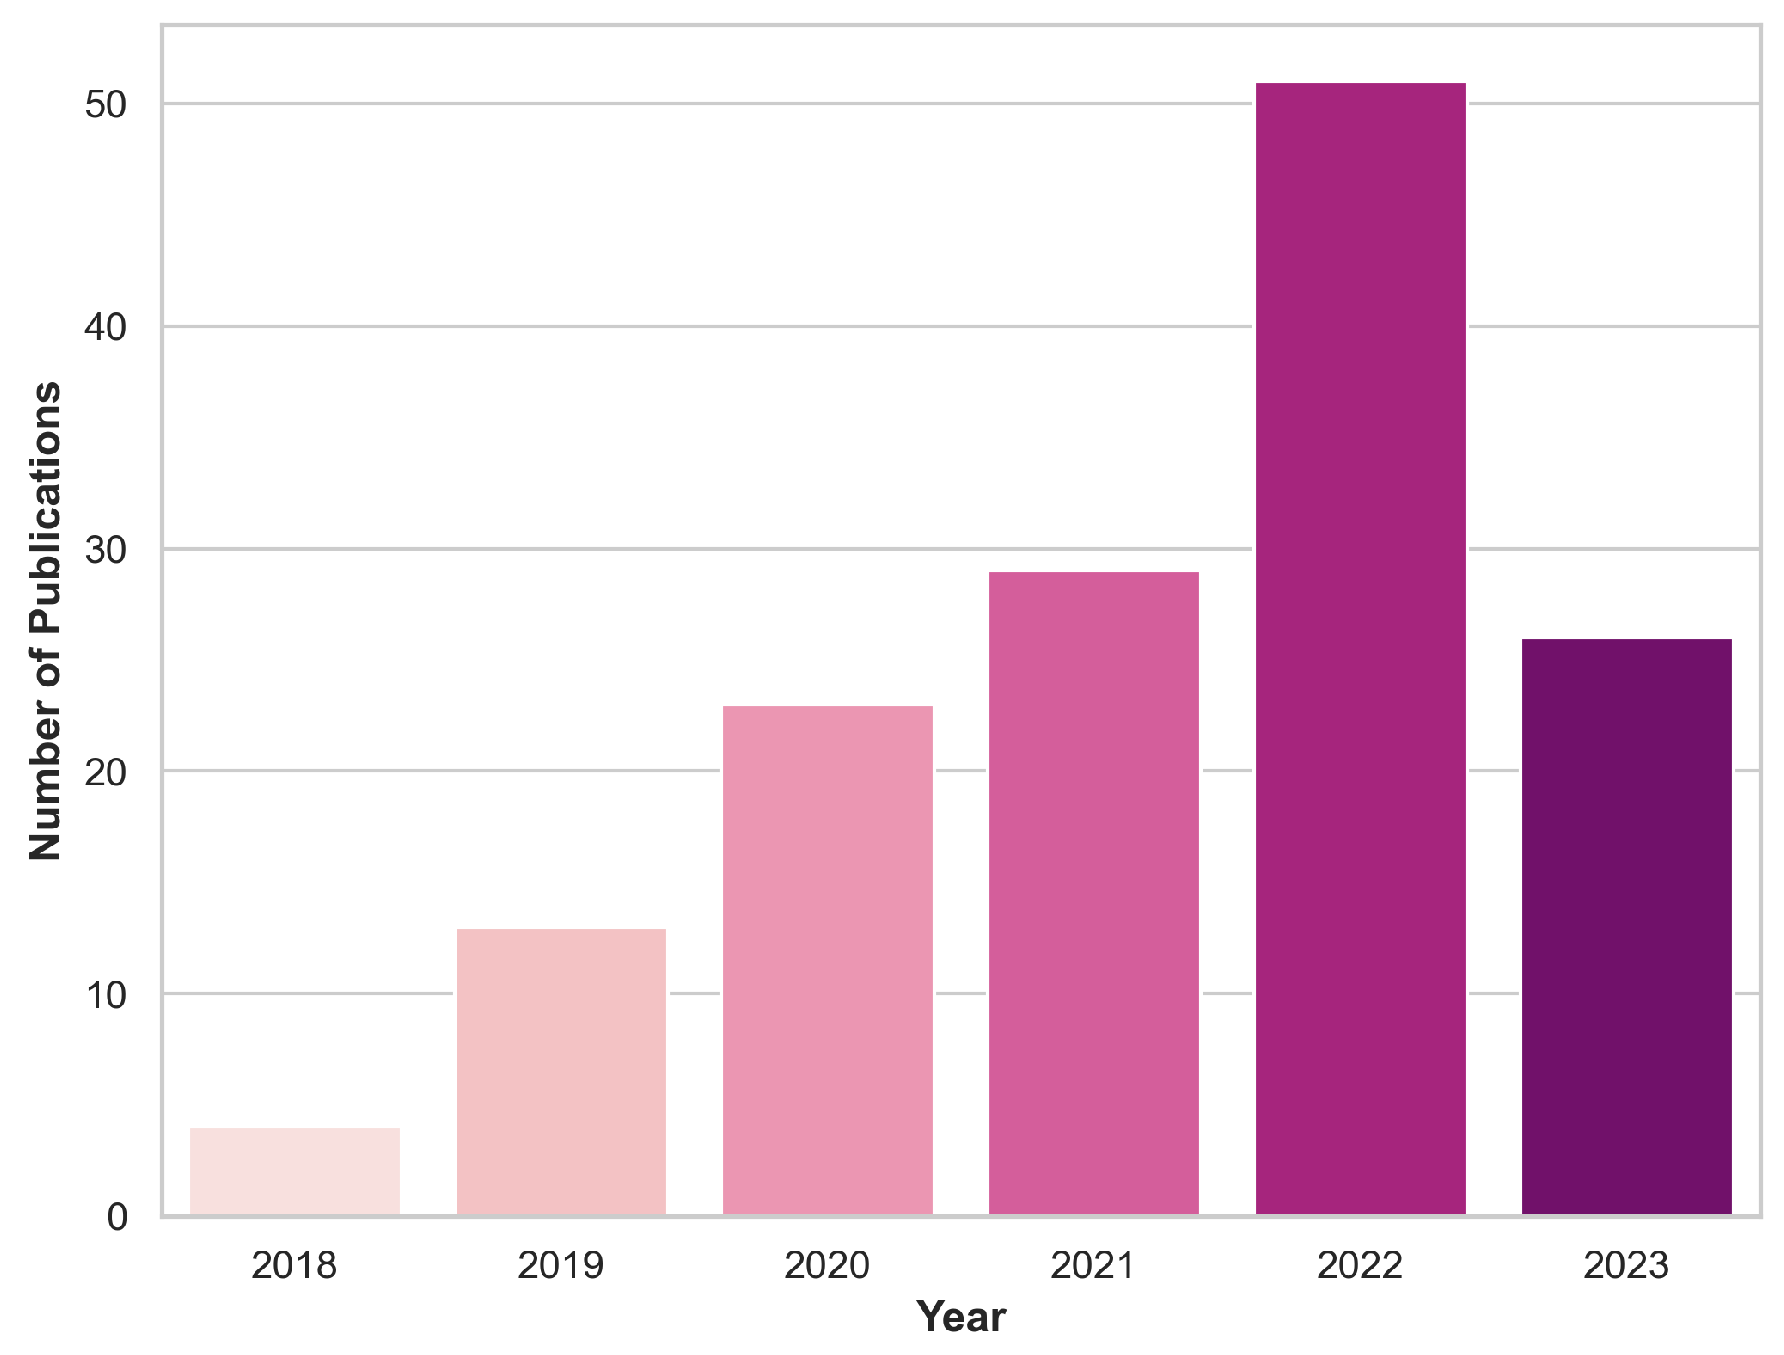
| Dataset | Categories | Dim. | Sample Size | MRI Modalities | |
|---|---|---|---|---|---|
| BraTS [61] | 2020 | Low-Grade Glioma (LGG) High-Grade Glioma (HGG) | 3D | 369 (LGG: 76, HGG: 293) | T1, T1c, T2, FLAIR |
| 2019 | 3D | 335 (LGG: 76, HGG: 259) | T1, T1c, T2, FLAIR | ||
| 2018 | 3D | 284 (LGG: 75, HGG: 209) | T1, T1c, T2, FLAIR | ||
| 2017 | 3D | 285 (LGG: 75, HGG: 210) | T1, T1c, T2, FLAIR | ||
| 2015 | 3D | 274 (LGG: 54, HGG: 220) | T1, T1c, T2, FLAIR | ||
| 2013 | 3D | 30 (LGG: 10, HGG: 20) | T1, T1c, T2, FLAIR | ||
| 2012 | 3D | 30 (LGG: 10, HGG: 20) | T1, T1c, T2, FLAIR | ||
| CPM-RadPath [62] | Astrocytoma (AS) IDH-mutant Oligodendroglioma (OG) IDH-mutant 1p/19q codeletion Glioblastoma (GB) IDH-wildtype | 3D | Training: 221 (AS: 54, OG: 34, GB: 133) [unseen sets] Val: 35, Test: 73 | T1, T1c, T2, FLAIR | |
| Figshare [63] | Meningioma (MN), Glioma (GL), Pituitary (PT) | 2D | 233 (MN: 82, GL: 89, PT: 62) | T1c | |
| IXI [64] | Healthy | 3D | 600 | T1, T2, PD, DW | |
| Kaggle-I [65] | Healthy (H), Tumor (T) | 2D | 3000 (H: 1500, T: 1500) | - | |
| Kaggle-II [66] | Healthy (H), Meningioma (MN), Glioma (GL), Pituitary (PT) | 2D | 3264 (H: 500, MN: 937, GL: 926, PT: 901) | - | |
| Kaggle-III [67] | Healthy (H), Tumor (T) | 2D | 253 (H: 98, T: 155) | - | |
| Radiopaedia [68] | - | - | - | - | |
| REMBRANDT [69] | Oligodendroglioma (OG), Astroctyoma (AS), Glioblastoma (GB) | 3D | 111 (OG: 21, AS: 47, GB: 44) | T1, T1c, T2, FLAIR | |
| Grade II (G.II), Grade III (G.III), Grade IV (G.IV) | 109 (G.II: 44, G.III:24, G.IV: 44) | ||||
| TCGA-GBM [70] | Glioblastoma | 3D | 262 | T1, T1c, T2, FLAIR | |
| TCGA-LGG [71] | Grade II (G.II), Grade III (G.III) | 3D | 197 (G.II: 100, G.III: 96, discrepancy: 1) | T1, T1c, T2, FLAIR | |
| Astroctyoma (AS), Oligodendroglioma (OG), Oligoastrocytoma (OAS) | 197 (AS: 64, OG: 86, OAS: 47) | ||||
Disclaimer/Publisher’s Note: The statements, opinions and data contained in all publications are solely those of the individual author(s) and contributor(s) and not of MDPI and/or the editor(s). MDPI and/or the editor(s) disclaim responsibility for any injury to people or property resulting from any ideas, methods, instructions or products referred to in the content. |
© 2024 by the authors. Licensee MDPI, Basel, Switzerland. This article is an open access article distributed under the terms and conditions of the Creative Commons Attribution (CC BY) license (https://creativecommons.org/licenses/by/4.0/).
Share and Cite
Pitarch, C.; Ungan, G.; Julià-Sapé, M.; Vellido, A. Advances in the Use of Deep Learning for the Analysis of Magnetic Resonance Image in Neuro-Oncology. Cancers 2024, 16, 300. https://doi.org/10.3390/cancers16020300
Pitarch C, Ungan G, Julià-Sapé M, Vellido A. Advances in the Use of Deep Learning for the Analysis of Magnetic Resonance Image in Neuro-Oncology. Cancers. 2024; 16(2):300. https://doi.org/10.3390/cancers16020300
Chicago/Turabian StylePitarch, Carla, Gulnur Ungan, Margarida Julià-Sapé, and Alfredo Vellido. 2024. "Advances in the Use of Deep Learning for the Analysis of Magnetic Resonance Image in Neuro-Oncology" Cancers 16, no. 2: 300. https://doi.org/10.3390/cancers16020300
APA StylePitarch, C., Ungan, G., Julià-Sapé, M., & Vellido, A. (2024). Advances in the Use of Deep Learning for the Analysis of Magnetic Resonance Image in Neuro-Oncology. Cancers, 16(2), 300. https://doi.org/10.3390/cancers16020300