Article

Deep Residual Learning-Based Classification with Identification of Incorrect Predictions and Quantification of Cellularity and Nuclear Morphological Features in Digital Pathological Images of Common Astrocytic Tumors

by
Yen-Chang Chen
1,2,3,
Shinn-Zong Lin
3,4,5,6,7,
Jia-Ru Wu
8,9,
Wei-Hsiang Yu
10,
Horng-Jyh Harn
4,11,
Wen-Chiuan Tsai
12,
Ching-Ann Liu
4,5,9,
Ken-Leiang Kuo
13,
Chao-Yuan Yeh
10,* and
Sheng-Tzung Tsai
3,5,6,7,*
1
Division of Digital Pathology, Department of Anatomical Pathology, Hualien Tzu Chi Hospital, Buddhist Tzu Chi Medical Foundation, Hualien 970, Taiwan
2
Department of Pathology, School of Medicine, Tzu Chi University, Hualien 970, Taiwan
3
Institute of Medical Sciences, Tzu Chi University, Hualien 970, Taiwan
4
Bioinnovation Center, Buddhist Tzu Chi Medical Foundation, Hualien 970, Taiwan
5
Department of Neuroscience Center, Hualien Tzu Chi Hospital, Buddhist Tzu Chi Medical Foundation, Hualien 970, Taiwan
6
Department of Neurosurgery, Hualien Tzu Chi Hospital, Buddhist Tzu Chi Medical Foundation, Hualien 970, Taiwan
7
Department of Surgery, School of Medicine, Tzu Chi University, Hualien 970, Taiwan
8
Integration Center of Traditional Chinese and Modern Medicine, Hualien Tzu Chi Hospital, Buddhist Tzu Chi Medical Foundation, Hualien 970, Taiwan
9
Department of Medical Research, Hualien Tzu Chi Hospital, Buddhist Tzu Chi Medical Foundation, Hualien 970, Taiwan
10
aetherAI, Co., Ltd., Taipei 115, Taiwan
11
Division of Molecular Pathology, Department of Anatomical Pathology, Hualien Tzu Chi Hospital, Buddhist Tzu Chi Medical Foundation, Hualien 970, Taiwan
12
Department of Pathology, Tri-Service General Hospital, National Defense Medical Center, Taipei 114, Taiwan
13
YuanLi Instrument Co., Ltd., Taipei 114, Taiwan
*
Authors to whom correspondence should be addressed.
Cancers 2024, 16(13), 2449; https://doi.org/10.3390/cancers16132449
Submission received: 11 June 2024 / Revised: 26 June 2024 / Accepted: 1 July 2024 / Published: 3 July 2024
(This article belongs to the Special Issue Digital Pathology Systems Enabling the Quality of Cancer Patient Care)

Abstract

:

Simple Summary

This study presented an artificial intelligence-based classification emphasizing error identification and quantification of cellularity and nuclear morphological features in digital pathological images of common astrocytic tumors. The identification of incorrect predictions was essential for the subsequent development of better techniques. Quantifying cellularity and nuclear morphological features brought deeper insights into neoplastic morphology and paved the way for further development of a scoring system for objective classification and precision diagnosis to improve interobserver variations.

Abstract

Interobserver variations in the pathology of common astrocytic tumors impact diagnosis and subsequent treatment decisions. This study leveraged a residual neural network-50 (ResNet-50) in digital pathological images of diffuse astrocytoma, anaplastic astrocytoma, and glioblastoma to recognize characteristic pathological features and perform classification at the patch and case levels with identification of incorrect predictions. In addition, cellularity and nuclear morphological features, including axis ratio, circularity, entropy, area, irregularity, and perimeter, were quantified via a hybrid task cascade (HTC) framework and compared between different characteristic pathological features with importance weighting. A total of 95 cases, including 15 cases of diffuse astrocytoma, 11 cases of anaplastic astrocytoma, and 69 cases of glioblastoma, were collected in Taiwan Hualien Tzu Chi Hospital from January 2000 to December 2021. The results revealed that an optimized ResNet-50 model could recognize characteristic pathological features at the patch level and assist in diagnosis at the case level with accuracies of 0.916 and 0.846, respectively. Incorrect predictions were mainly due to indistinguishable morphologic overlap between anaplastic astrocytoma and glioblastoma tumor cell area, zones of scant vascular lumen with compact endothelial cells in the glioblastoma microvascular proliferation area mimicking the glioblastoma tumor cell area, and certain regions in diffuse astrocytoma with too low cellularity being misrecognized as the glioblastoma necrosis area. Significant differences were observed in cellularity and each nuclear morphological feature among different characteristic pathological features. Furthermore, using the extreme gradient boosting (XGBoost) algorithm, we found that entropy was the most important feature for classification, followed by cellularity, area, circularity, axis ratio, perimeter, and irregularity. Identifying incorrect predictions provided valuable feedback to machine learning design to further enhance accuracy and reduce errors in classification. Moreover, quantifying cellularity and nuclear morphological features with importance weighting provided the basis for developing an innovative scoring system to achieve objective classification and precision diagnosis among common astrocytic tumors.

1. Introduction

The astrocytic tumor is the major type of glioma, which includes glioblastoma, anaplastic astrocytoma, diffuse astrocytoma, and other rare subtypes [1,2,3,4]. Each subtype is characterized by specific pathological features and is assigned to one of four grades (grades I to IV) according to the World Health Organization (WHO) classification based on tumor behavior and prognosis [3,4]. Glioblastoma is categorized as grade IV, anaplastic astrocytoma as grade III, and diffuse astrocytoma as grade II [3,4]. Currently, pathologists perform classification subjectively, but the task remains challenging due to interobserver variations [5,6]. Interobserver variations can affect the accuracy of diagnosis and subsequent treatment decisions [6]. Recently, the superior performance of artificial intelligence (AI)-assisted approaches in digital pathological images has been demonstrated, including target detection, counting, grading, and classification of various diseases [7,8,9,10,11,12,13]. Further, cellularity and nuclear morphological features extracted by the instance segmentation technique enable the classification of diseases and the discovery of prognostic factors [14,15,16,17,18].
Nowadays, the deep residual learning algorithm is the main strategy for image recognition [19]. It is an advanced machine learning technique with a residual neural network (ResNet) to address the degradation problem in conventional deep neural networks [19]. Some research applying different AI models, including deep learning algorithms, in glioma classification has showcased various performances [20,21,22,23]. Moreover, incorrect predictions by AI models have always occurred and have yet to be presented and explained in previous works [20,21,22,23]. Several studies integrating cellularity and nuclear morphologic features into deep learning models have enhanced glioma classification [17,18]. However, the quantification or importance weight of the parameters has yet to be presented [17,18].
In the present study, we leveraged a ResNet [19] in digital pathological images of common astrocytic tumors, specifically the diffuse astrocytoma, anaplastic astrocytoma, and glioblastoma, to recognize characteristic pathological features and perform classification at the patch and case levels. The focus is on the identification and presentation of prediction errors. In addition, we quantified cellularity and nuclear morphological features, including axis ratio, circularity, entropy, area, irregularity, and perimeter, via a hybrid task cascade (HTC) framework. Comparisons between different characteristic pathological features and importance weighting were also performed. The identification of prediction errors has the potential to enhance the machine learning algorithm’s performance. Furthermore, measuring cellularity and nuclear morphological features with weighting could aid in developing a prediction model for common astrocytic tumors.

2. Materials and Methods

2.1. Cases

Cases of diffuse astrocytoma, anaplastic astrocytoma, and glioblastoma in Taiwan Hualien Tzu Chi Hospital were collected from January 2000 to December 2021. Two pathology doctors made and confirmed their pathological diagnoses in routine medical practice. Each case’s representative pathological hematoxylin-and-eosin-stained (H&E stain) slide was scanned and transformed into digital pathological images. Then, we annotated the regions of interest (ROIs) for characteristic pathological features. The annotated ROIs included diffuse astrocytoma, anaplastic astrocytoma, glioblastoma tumor cell area, glioblastoma microvascular proliferation area, and glioblastoma necrosis area (Figure 1). The study was approved by the Institutional Review Board of Hualien Tzu Chi Hospital (approval No. IRB112-255-B).

2.2. Application of Deep Residual Learning Model for Classification

To prepare training data for the development of the classification model, we initially allocated 40% of the digital pathological images to an independent testing set through random selection. The remaining 60% were subdivided into training and validation sets in a 7:3 ratio via random splitting. For each ROI on a slide, we extracted 512 × 512 patches using a stride of 256. Given the irregularity of the ROIs, we excluded patches in the margin that had less than a 50% intersection area with an ROI. Then, we optimized a residual neural network-50 (ResNet-50) [19], a convolutional neural network with a depth of 50 layers and a residual learning algorithm, with the prepared dataset. The flowchart of this work is presented in Figure 2. The results are presented using a confusion matrix, in which the x-axis represents precision and the y-axis represents recall, at the patch and case levels, respectively.
At the patch level, a bootstrapping strategy [24] was adopted, involving 50 samplings of the independent testing set to determine the 95% confidence interval (CI) of prediction results. Two confusion matrices were planned to be presented. One presented all five annotated characteristic pathological features. Another matrix, with the expectation of a partially indistinguishable morphological spectrum between anaplastic astrocytoma and glioblastoma tumor cell area [4], presented four categories in which the anaplastic astrocytoma and glioblastoma tumor cell area were combined into a single category, the high-grade astrocytoma tumor cell area.
At the case level, different inclusion criteria for the patch ratio of the predicted characteristic pathological feature to be considered for classification were tested to filter out minor errors. The criteria we used were 0.00, 0.02, and 0.05. The inclusion criterion of 0.00 meant that any predicted characteristic pathological feature patch ratio was considered for classification. The inclusion criteria of 0.02 and 0.05 meant that the patch ratios of the predicted characteristic pathological features could only be considered for classification if they reached 0.02 and 0.05, respectively.

2.3. Quantification of Cellularity and Nuclear Morphological Features with Importance Weighting

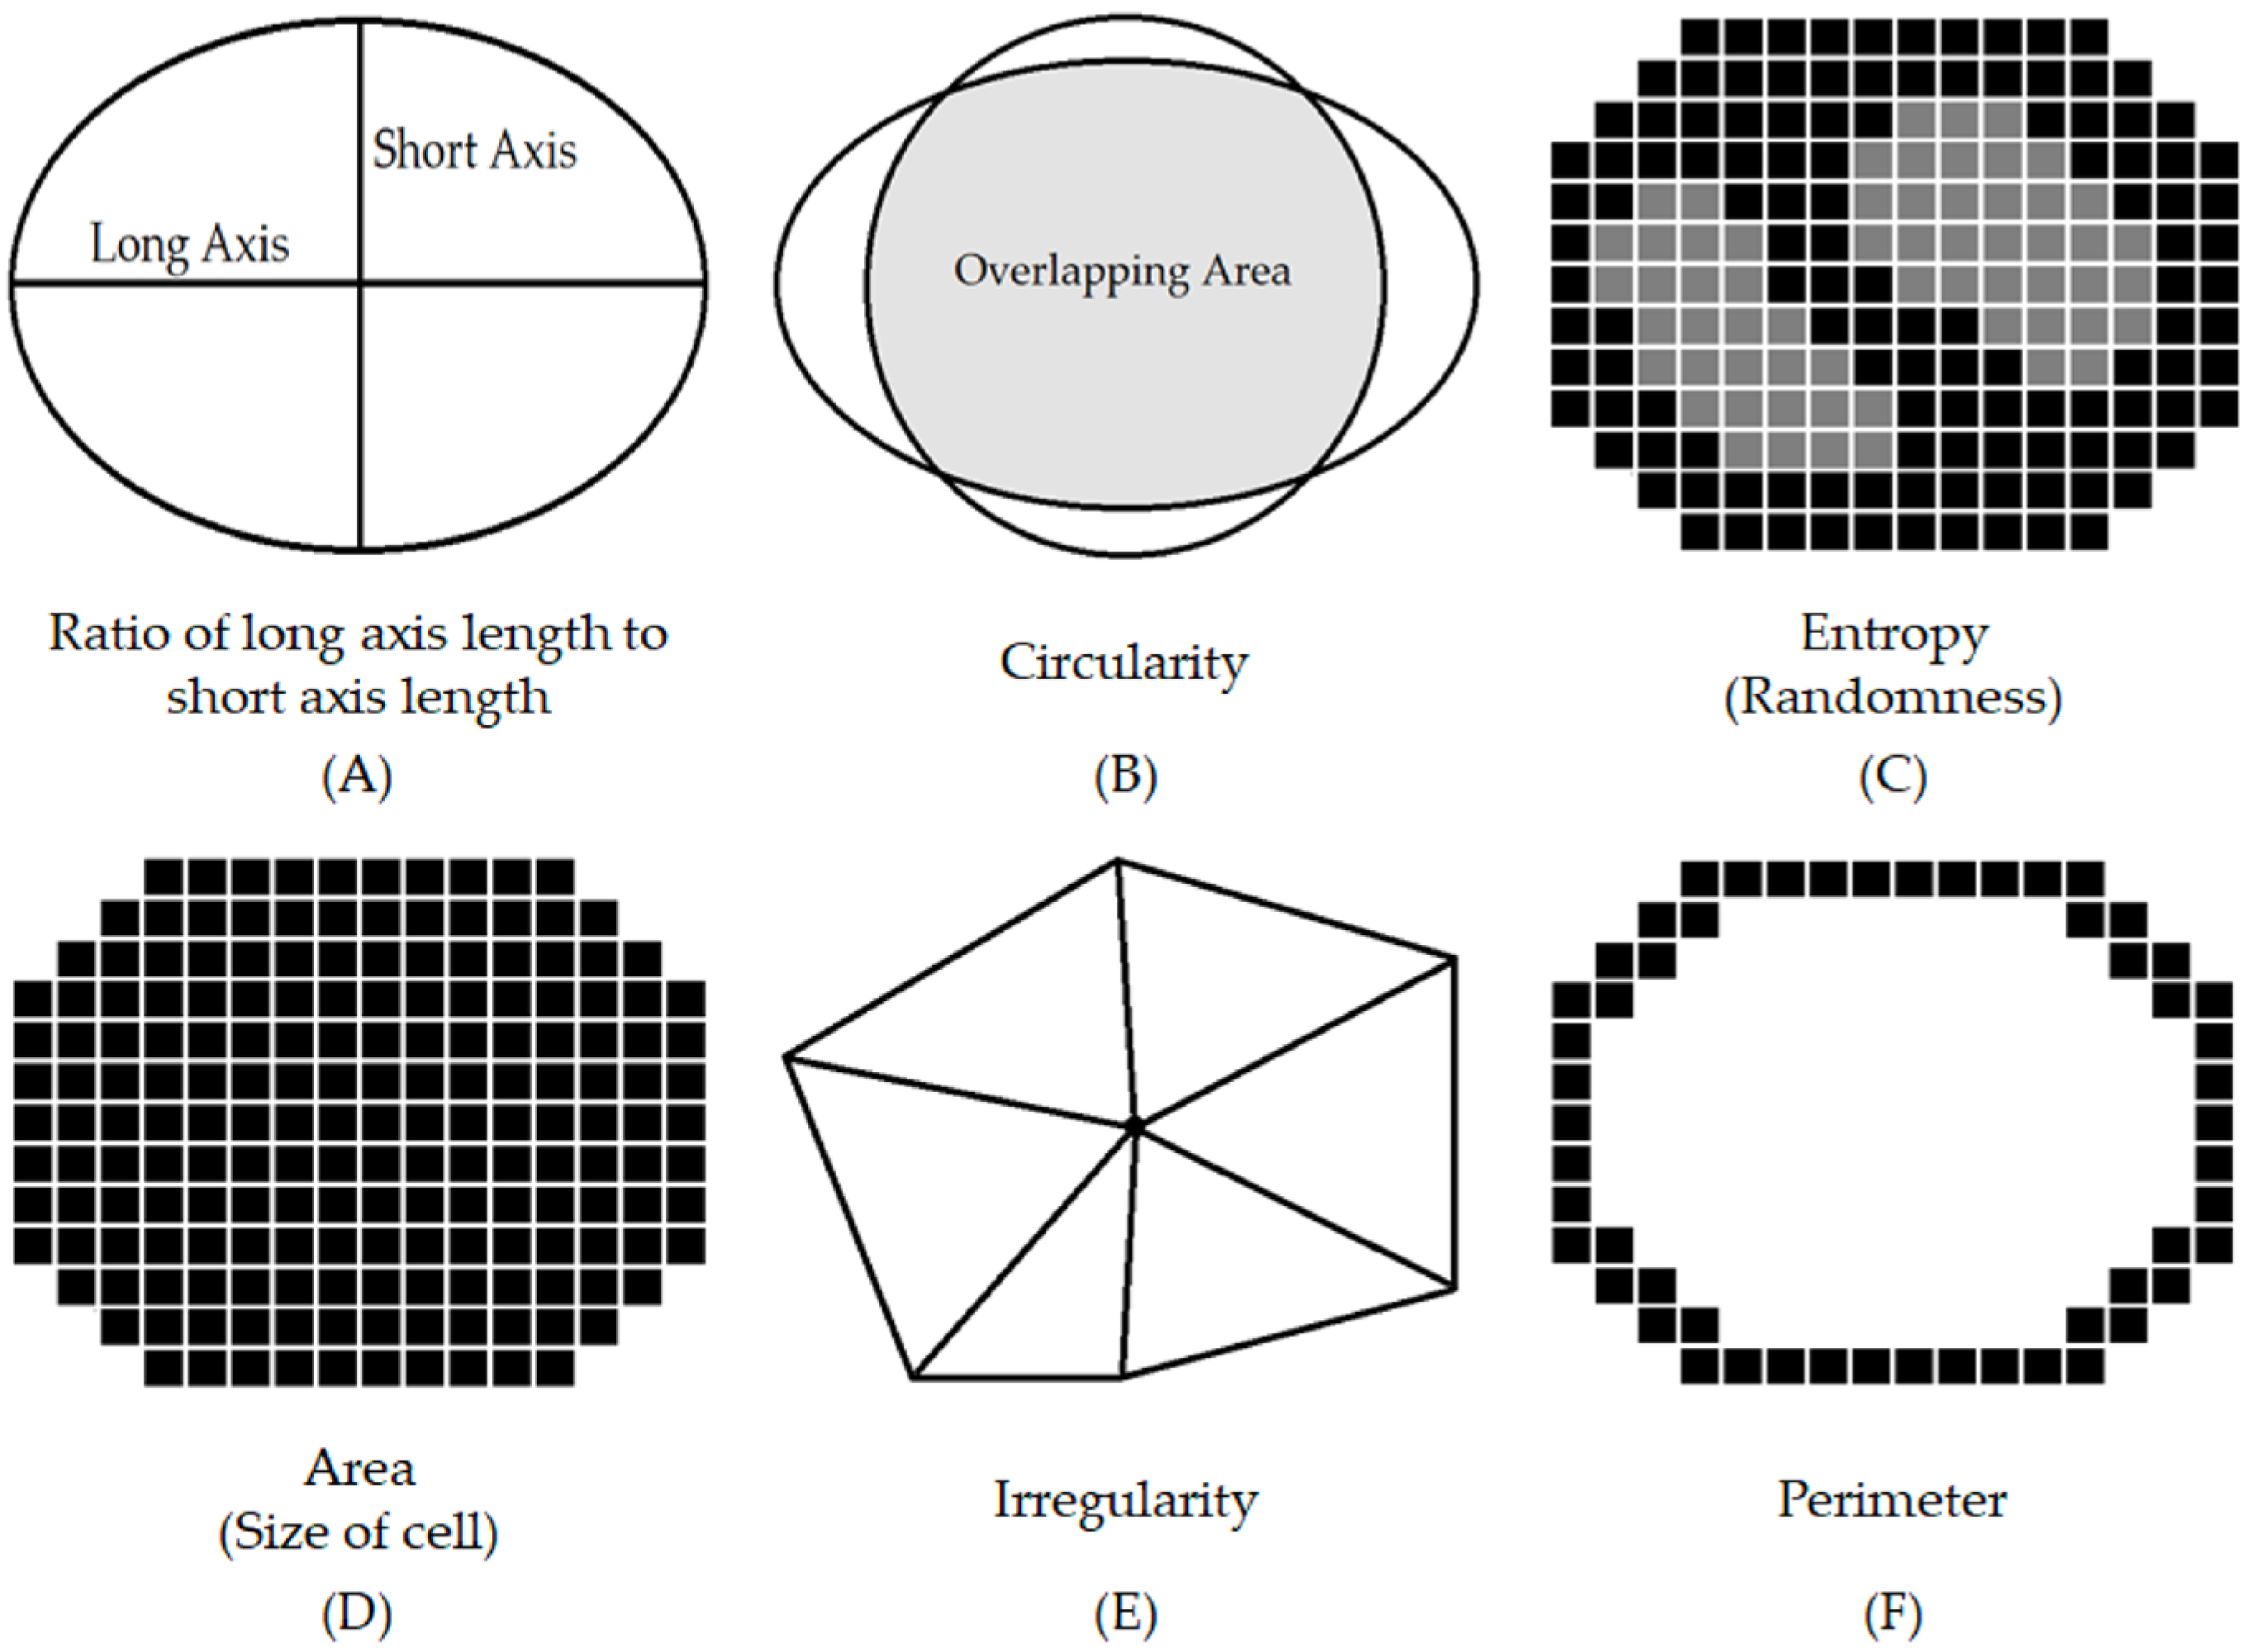
For nucleus detection, we applied a hybrid task cascade (HTC) framework for instance segmentation [14]. After that, cellularity and nuclear morphological features, including axis ratio, circularity, entropy, area, irregularity, and perimeter, were evaluated. Cellularity was the ratio of the area occupied by cells to the total area (Figure 3). Welch’s t-test with Bonferroni correction [25] was used to test whether the means of cellularity were equal for all two-group combinations of the characteristic pathological features. A p-value less than 0.05 is considered statistically significant. For nuclear morphological features, we measured the lengths of both the long and short axes in each nucleus and calculated the long-to-short axis ratio. Circularity was determined by the pixel overlap between a concentric circle and the nucleus. The entropy quantified pixel randomness. The area denoted nuclear size in square micrometers. Irregularity represented the length variance from the nucleus center to each boundary vertex. Perimeter was the estimated total length along a nuclear boundary in micrometers. The nuclear morphological features are sketched in Figure 4. For each nuclear morphological feature, four commonly used statistical moments (mean, variance, skewness, and kurtosis) were computed for comparisons [26,27]. In addition, one-way analysis of variance (ANOVA) [28] was used to test the differences in each moment of each nuclear morphological feature between the characteristic pathological features. A p-value less than 0.05 is considered statistically significant. A decision-tree-based machine learning algorithm, extreme gradient boosting (XGBoost) [29], was applied to evaluate the importance weights. A bootstrapping strategy [24] was adopted, involving 50 samplings of the independent testing set to determine the 95% confidence interval (CI) of importance weights.

3. Results

3.1. Data Summary

A total of 95 cases were collected, including 15 cases of diffuse astrocytoma, 11 cases of anaplastic astrocytoma, and 69 cases of glioblastoma. Among these cases, 39, 17, and 39 were randomly split into training, validation, and testing sets. The sum of annotated ROIs was 10,920, producing 61,696 patches of 512 × 512 pixels. The details of cases, ROIs, and patches are presented in Table 1.

3.2. Outcomes of Application of Deep Residual Learning Model for Classification

3.2.1. At the Patch Level

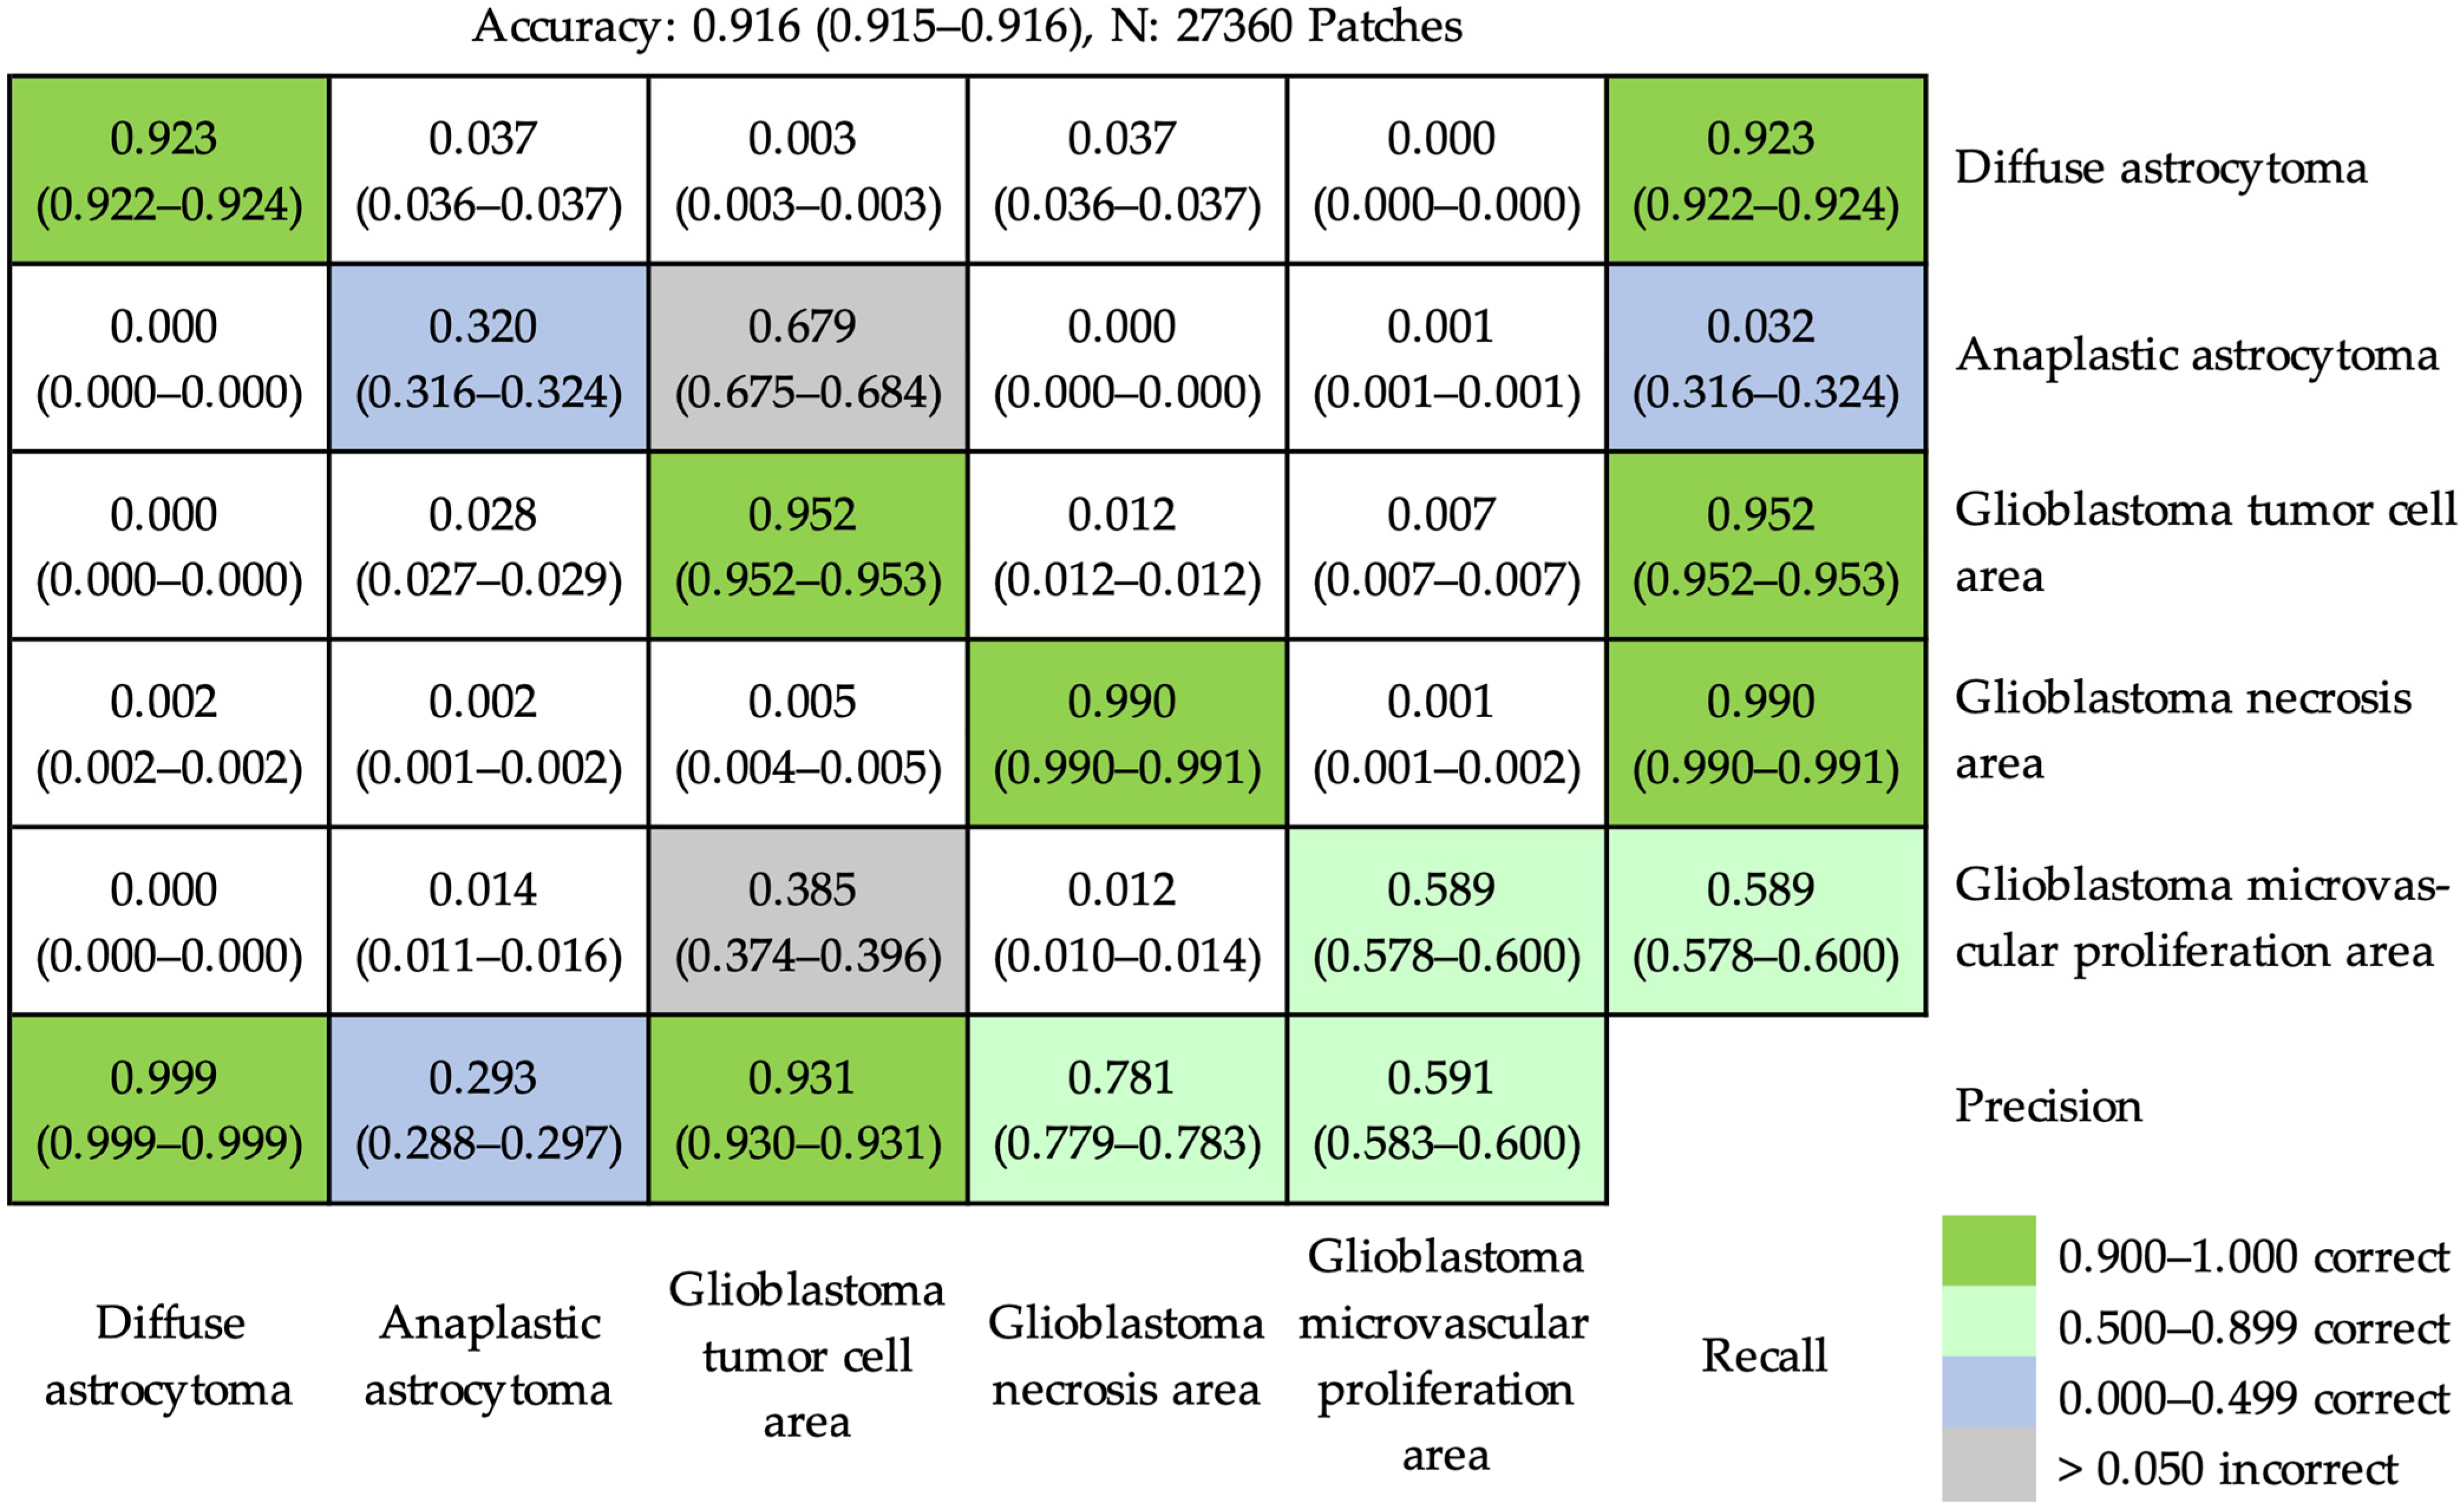
Using ResNet-50 to recognize the characteristic pathological features, the accuracy was 0.916 (95% CI, 0.915–0.916) at the patch level. The details of the results are shown in Figure 5, in which most patches fell on the diagonal line from upper left to lower right, representing correct predictions. However, two principal incorrect predictions occurred (marked by gray background lattices in Figure 5). Around 67.9% of patches from anaplastic astrocytoma were misrecognized as glioblastoma tumor cell area. In addition, around 38.5% of patches from the glioblastoma microvascular proliferation area were also misrecognized as glioblastoma tumor cell area.
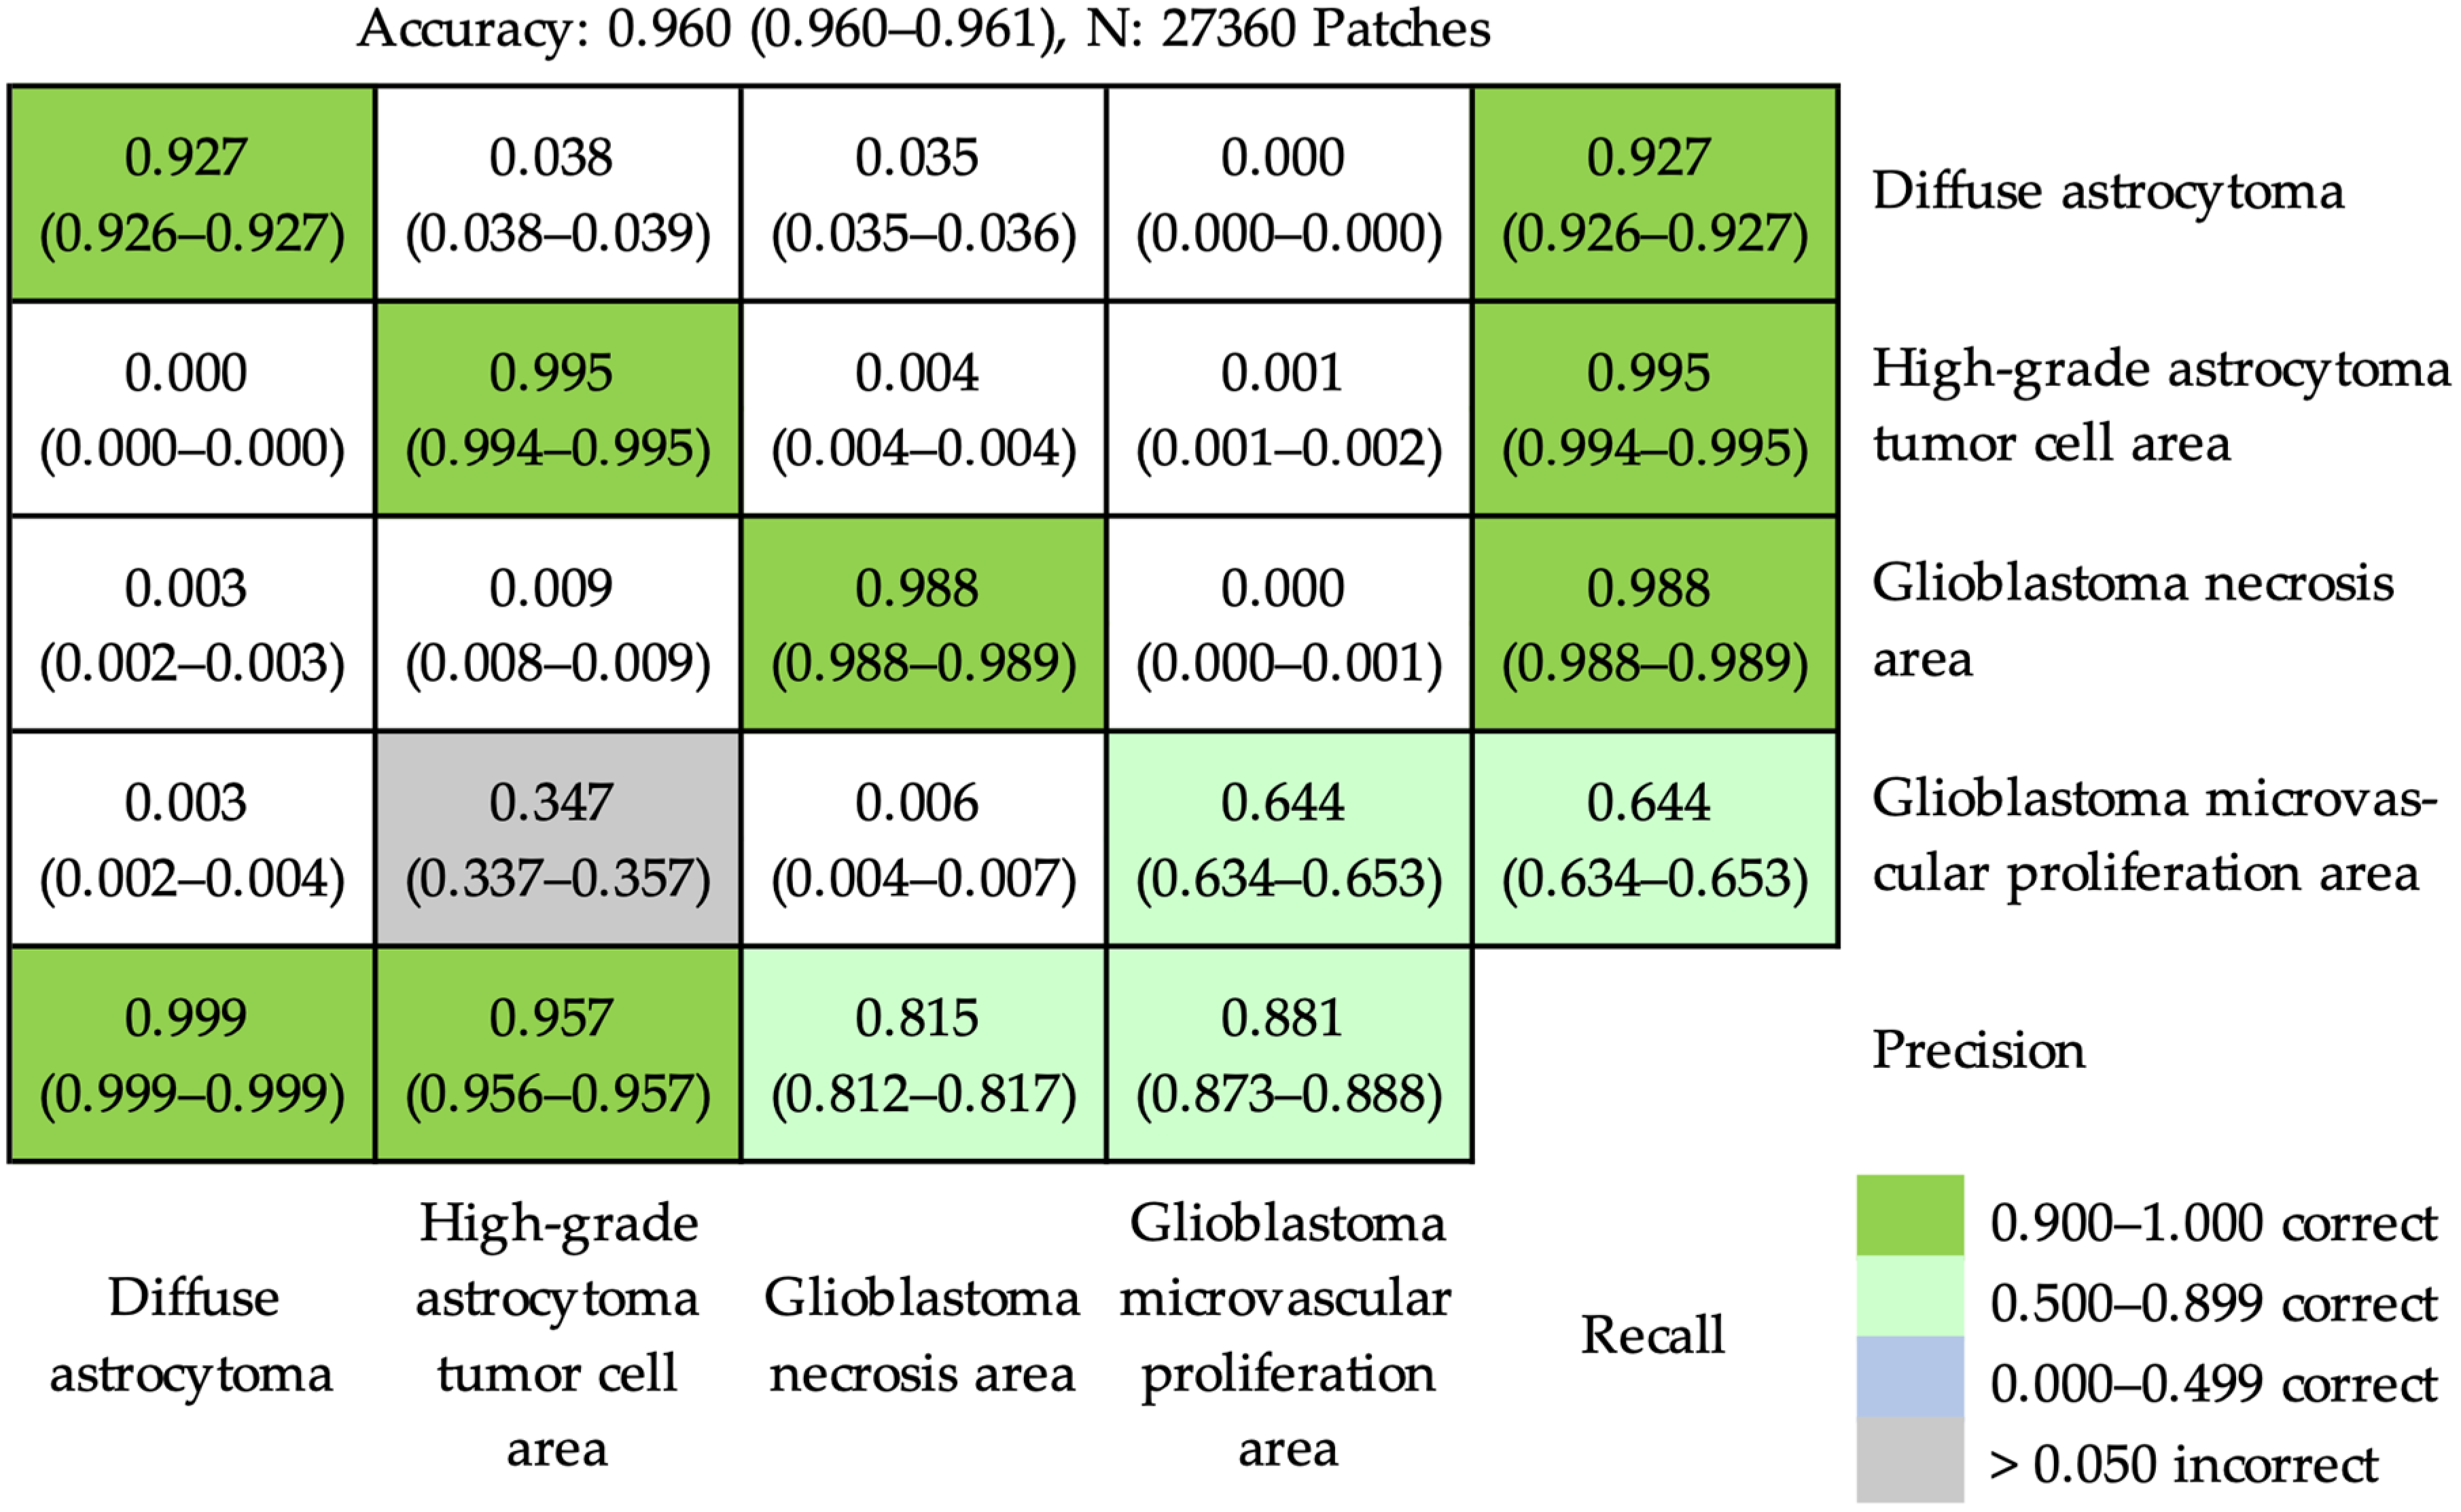
An accuracy of 0.960 (95% CI, 0.960–0.961) was achieved at the patch level after combining anaplastic astrocytoma and glioblastoma tumor cell area into a single category of high-grade astrocytoma tumor cell area (Figure 6). In the confusion matrix, the majority of patches were correctly predicted. Nevertheless, a main incorrect prediction was presented (lattice with gray background in Figure 6). Approximately 34.7% of patches from the glioblastoma microvascular proliferation area were erroneously categorized into high-grade astrocytoma tumor cell area.

3.2.2. At the Case Level

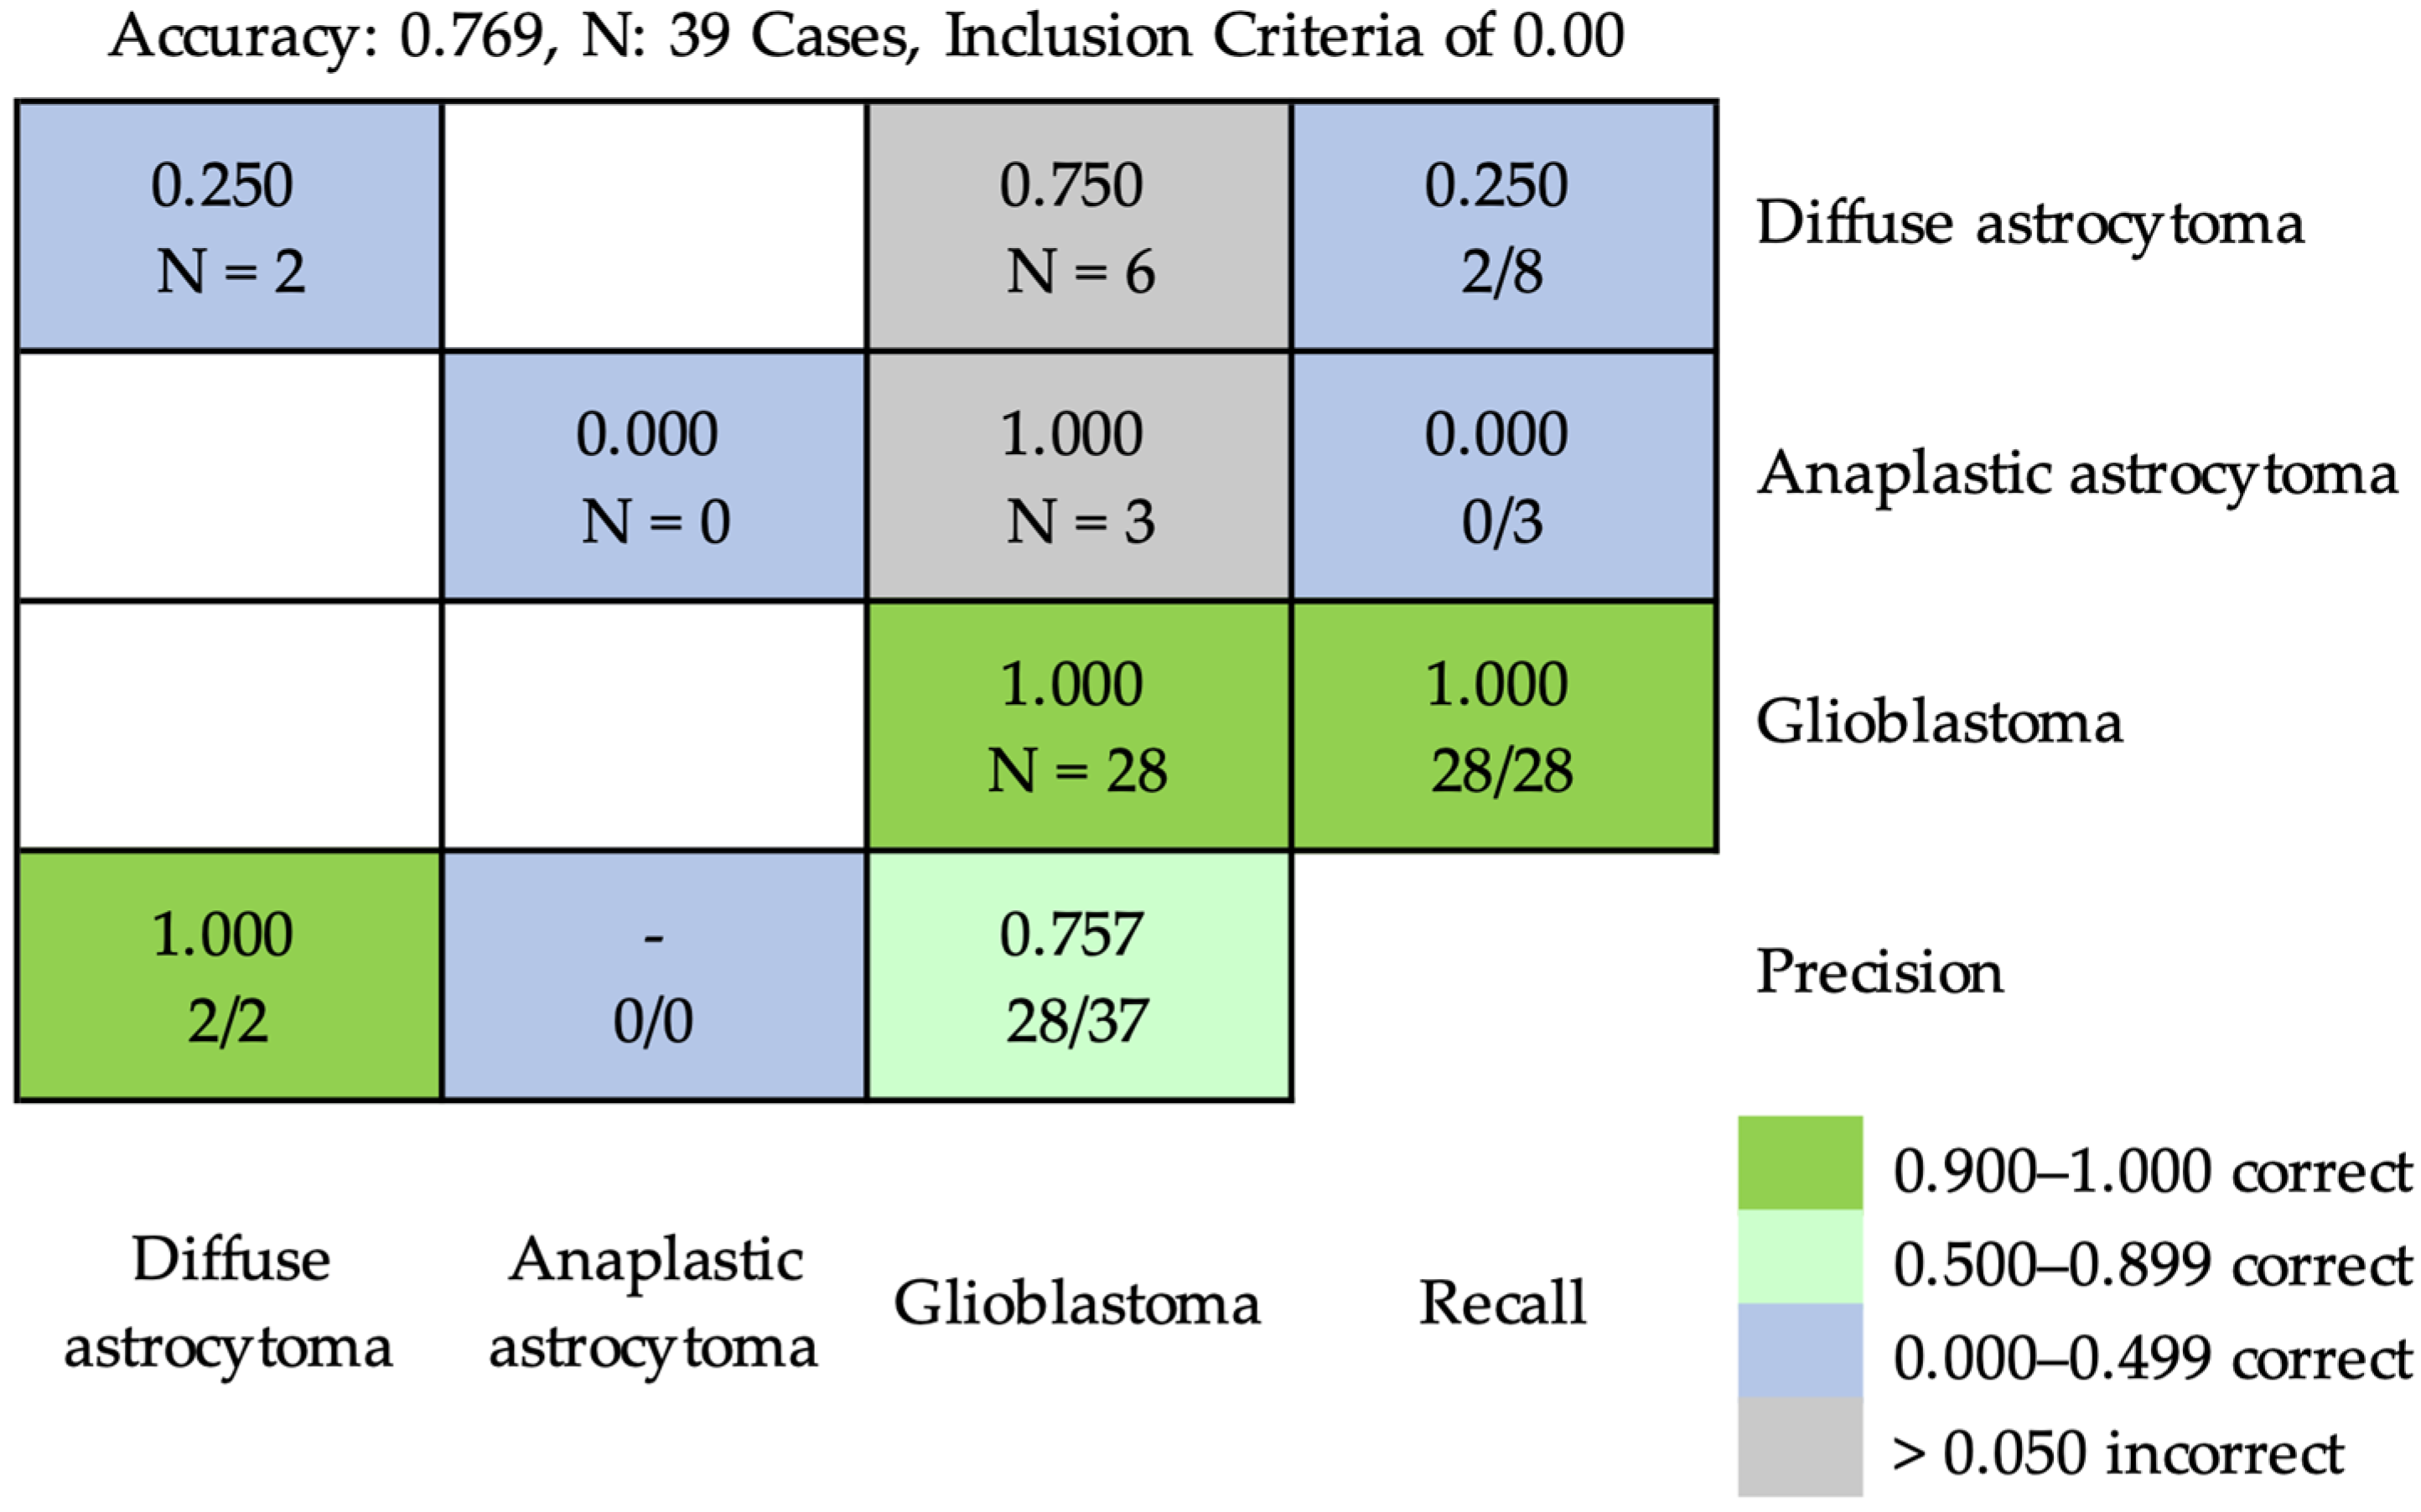
Based on inclusion criterion of 0.00, the accuracy attained using ResNet-50 for classifying diffuse astrocytoma, anaplastic astrocytoma, and glioblastoma was 0.769 at the case level. The details of the results are shown in Figure 7, in which six cases of diffuse astrocytoma and three cases of anaplastic astrocytoma were incorrectly classified as cases of glioblastoma.
Based on the inclusion criterion of 0.02, the accuracy obtained using ResNet-50 for classifying diffuse astrocytoma, anaplastic astrocytoma, and glioblastoma at the case level was 0.846 (Figure 8). Three cases of diffuse astrocytoma and three cases of anaplastic astrocytoma were incorrectly classified as cases of glioblastoma. Based on the inclusion criterion of 0.05, the accuracy was 0.846 at the case level (Figure 9). Two cases of diffuse astrocytoma and three cases of anaplastic astrocytoma were incorrectly classified as cases of glioblastoma. A case of diffuse astrocytoma was incorrectly classified as anaplastic astrocytoma.
The details of testing results using ResNet-50 for classifying diffuse astrocytoma, anaplastic astrocytoma, and glioblastoma are shown in Table S1 of the Supplementary Materials. Table 2 presents the selective cases with incorrect classification from Table S1. Among these, three cases of diffuse astrocytoma (cases 13, 17, and 22) were incorrectly classified into glioblastoma due to the presence of erroneously predicted scant patches of glioblastoma necrosis area or glioblastoma microvascular proliferation area based on the inclusion criterion of 0.00. Moreover, one case of diffuse astrocytoma (case 14) was wrongly classified as glioblastoma, attributed to the small number of erroneous prediction patches in the glioblastoma tumor cell area, glioblastoma necrosis area, and glioblastoma microvascular proliferation area. Additionally, another diffuse astrocytoma case (case 25) was incorrectly classified as glioblastoma based on the inclusion criteria of 0.00 and 0.02, stemming from the presence of falsely predicted minor patches of glioblastoma tumor cell area, glioblastoma necrosis area, and glioblastoma microvascular proliferation area. This case was also misclassified as anaplastic astrocytoma with the criterion of 0.05 due to the incorrectly predicted major patches of anaplastic astrocytoma. Furthermore, one instance of diffuse astrocytoma (case 38) was inaccurately classified as glioblastoma because of the falsely predicted major patches of glioblastoma necrosis area. Lastly, three cases of anaplastic astrocytoma (cases 15, 27, and 29) were misclassified as glioblastoma due to the significant number of incorrect prediction patches of glioblastoma tumor cell areas.

3.3. Outcomes of Quantification of Cellularity and Nuclear Morphological Features with Importance Weighting

3.3.1. Cellularity

The average cellularities for individual characteristic pathological features are shown in Table 3. Glioblastoma tumor cell area exhibited the highest cellularity at 0.195 ± 0.051 (mean ± standard deviation [SD]), followed by anaplastic astrocytoma with a cellularity of 0.180 ± 0.063, and glioblastoma microvascular proliferation area, which had a cellularity of 0.122 ± 0.052. The diffuse astrocytoma displayed a cellularity of 0.052 ± 0.018. The glioblastoma necrosis area exhibited the lowest cellularity, measured at 0.003 ± 0.008. Welch’s t-test with Bonferroni correction revealed that the cellularities were significantly different between all two-group combinations (Table 4).

3.3.2. Nuclear Morphological Features

The nuclear morphological features in individual characteristic pathological features are presented in Table 5. The average axis ratio ranged from 1.437 ± 0.103 to 1.734 ± 0.144, circularity from 0.574 ± 0.035 to 0.672 ± 0.037, entropy from 4.711 ± 0.227 to 4.925 ± 0.202, area from 13.676 ± 3.536 to 30.546 ± 6.183 μm, irregularity from 2.648 ± 1.115 to 7.784 ± 2.161, and perimeter from 14.327 ± 1.827 to 21.745 ± 2.075 μm. The one-way ANOVA analysis revealed significant differences in both mean and variance for all six individual nuclear morphological features among the various categories. Furthermore, there were statistically significant variations in the skewness and kurtosis of the axis ratio, circularity, and irregularity among the different categories. However, the skewness and kurtosis values for entropy, area, and perimeter were not statistically significant in discriminating between these categories.

3.3.3. Importance Weighting

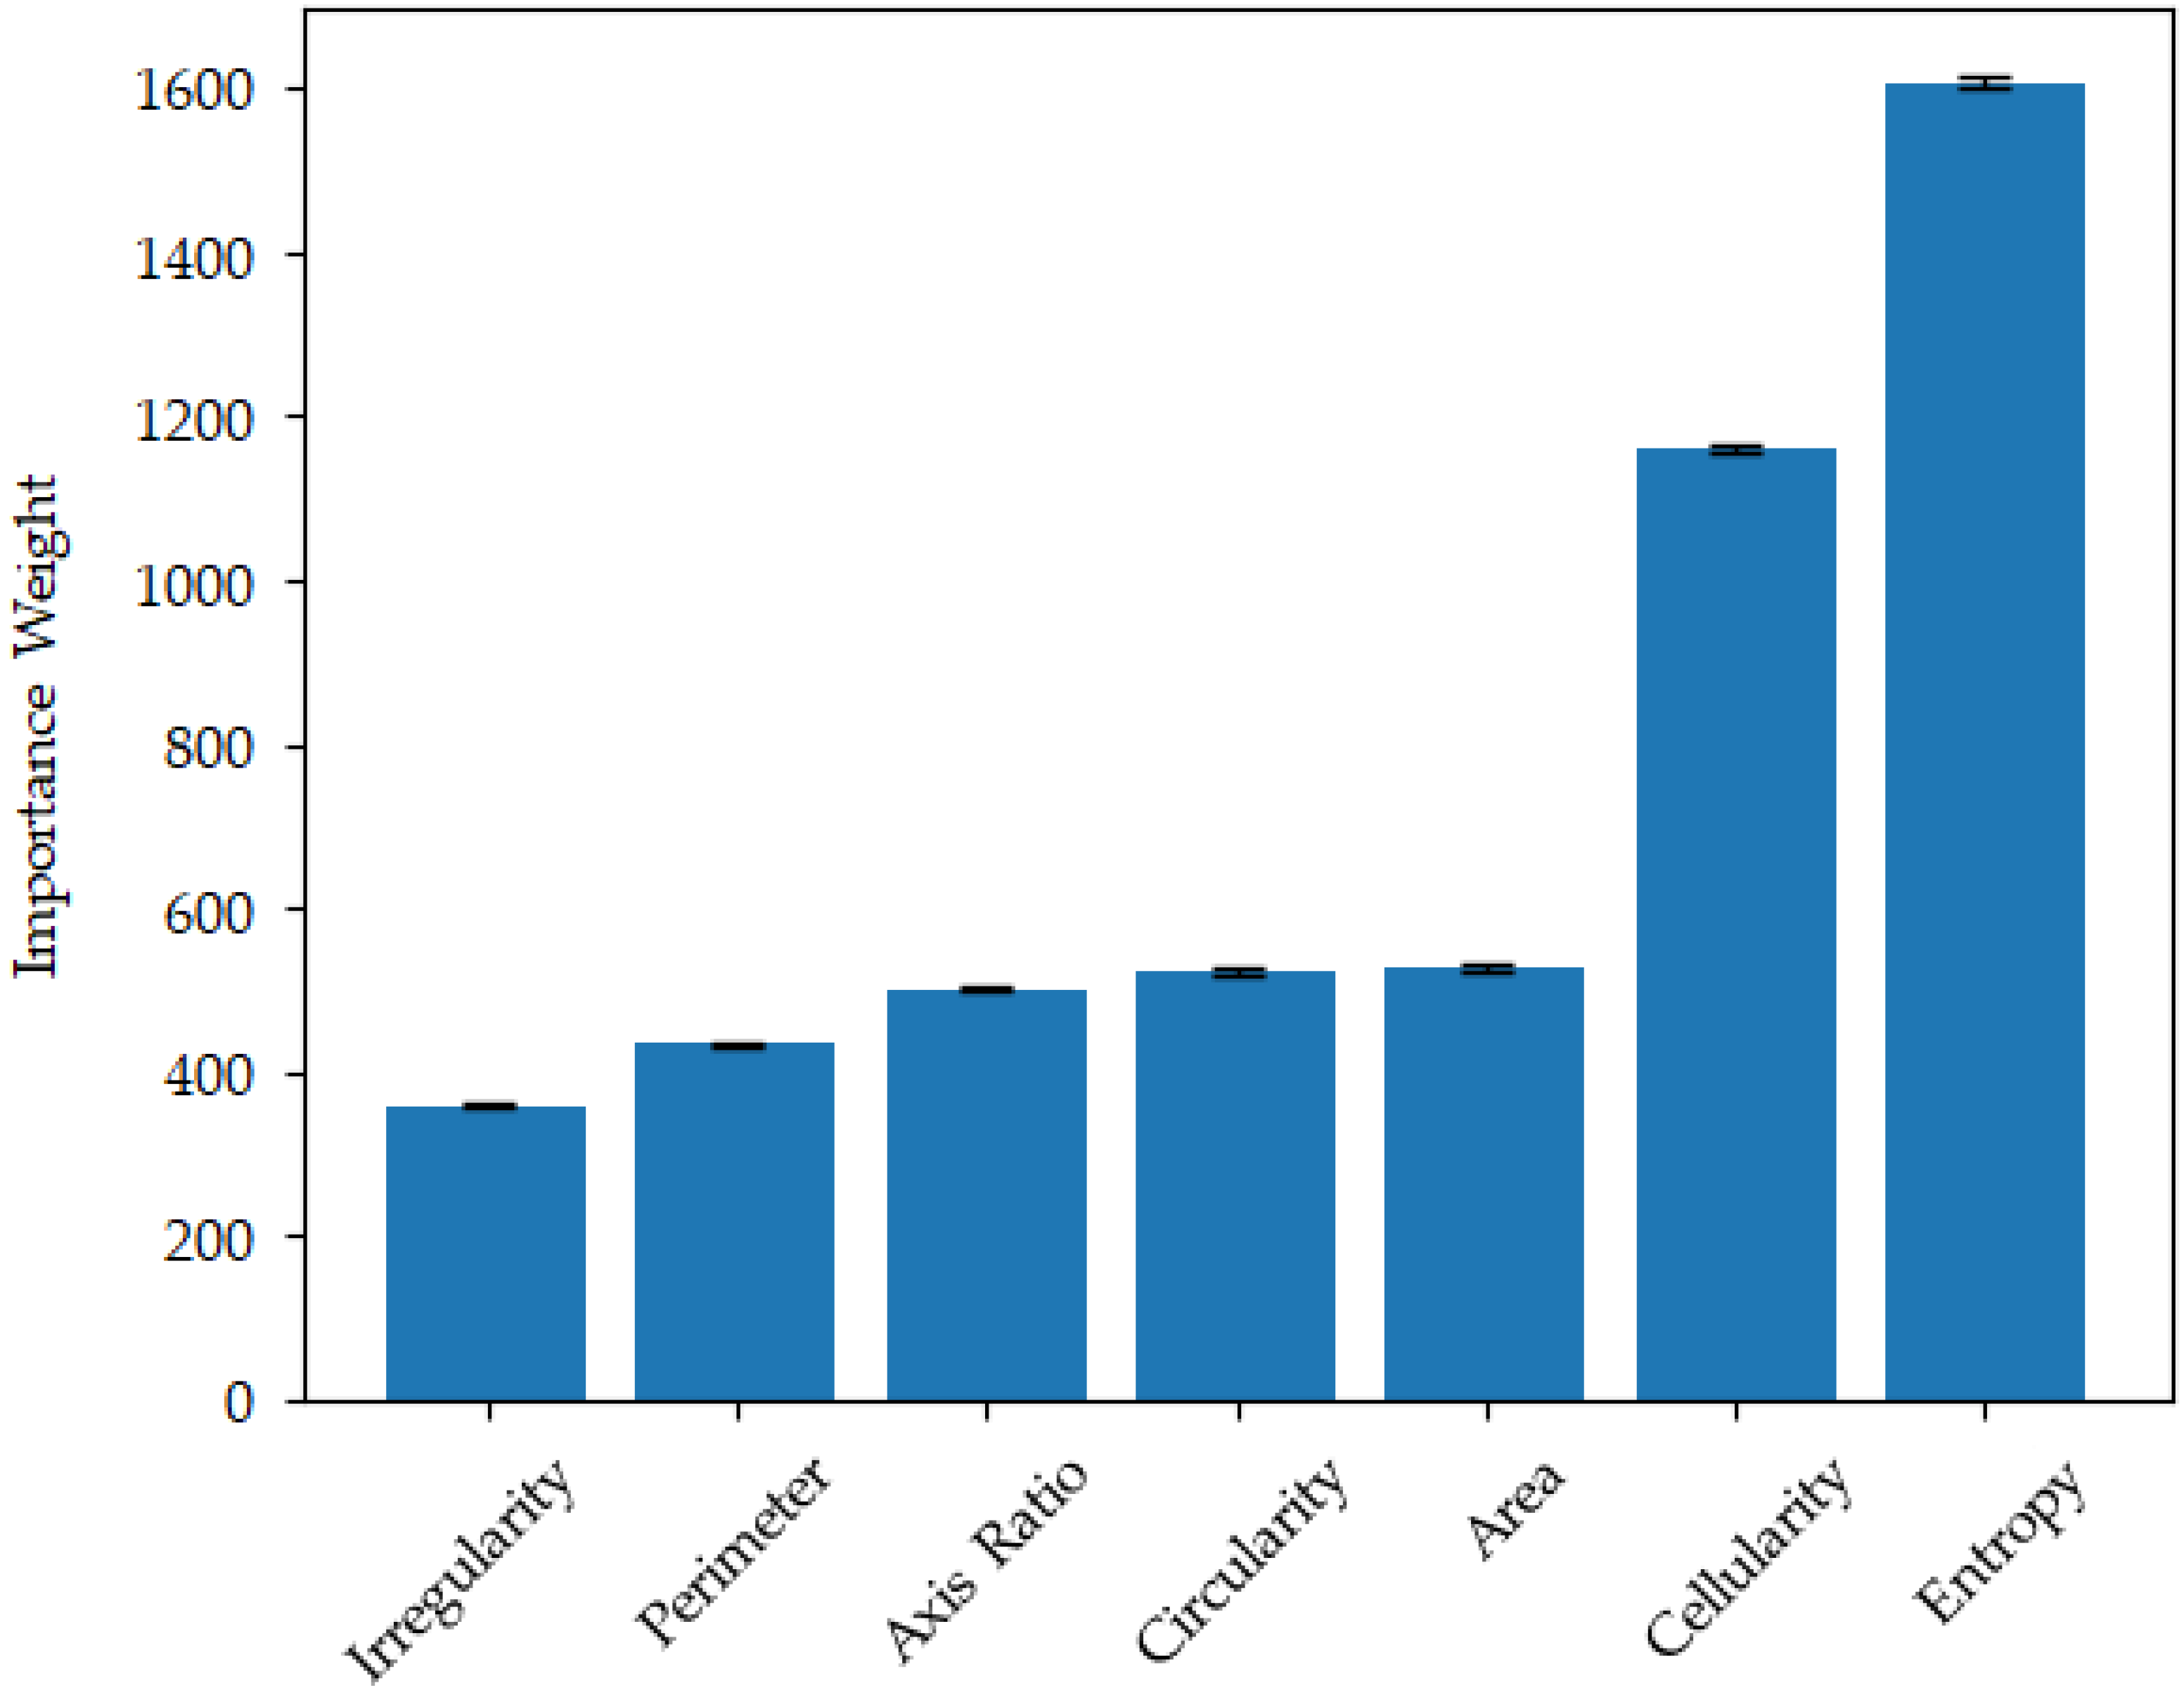
By using XGBoost to evaluate importance weight, entropy was the most important with a weight of 1607.2 (95% CI, 1600.2–1614.2), followed by cellularity with an important weight of 1160.4 (95% CI, 1153.9–1166.9), area, 528.8 (95% CI, 524.4–533.2), circularity, 524.2 (95% CI, 519.7–528.7), axis ratio, 502.1 (95% CI, 498.6–505.6), perimeter, 434.8 (95% CI, 432.3–437.3), and irregularity with an importance weight of 358.0 (95% CI, 355.9–360.1) (Figure 10).

4. Discussion

This study presented a deep residual learning-based classification focusing on identifying incorrect predictions and quantification of cellularity and nuclear morphological features with importance weighting specifically in common astrocytic tumors.
A patch size of 512 × 512 pixels was chosen to balance graphics processing unit (GPU) video random access memory (VRAM) limitations and the need to consider a more extensive region within each patch. While larger patches could provide more information for the model, they also require more GPU VRAM. In our case, a 512 × 512 patch size requires approximately 20 GB of VRAM, which fits within the 24 GB VRAM capacity of our display card. Additionally, using a 512 × 512 patch size is common in previous AI-related studies [30,31,32]. For the stride length, we aimed to balance storage requirements and the desire for the model to see all possible regions. An extreme approach would be to set the stride to one pixel, ensuring that all possible patches are provided. However, this would result in excessive patches, exceeding our server’s storage capacity. Setting the stride to half the patch size (256 pixels) balances storage requirements and region coverage well.
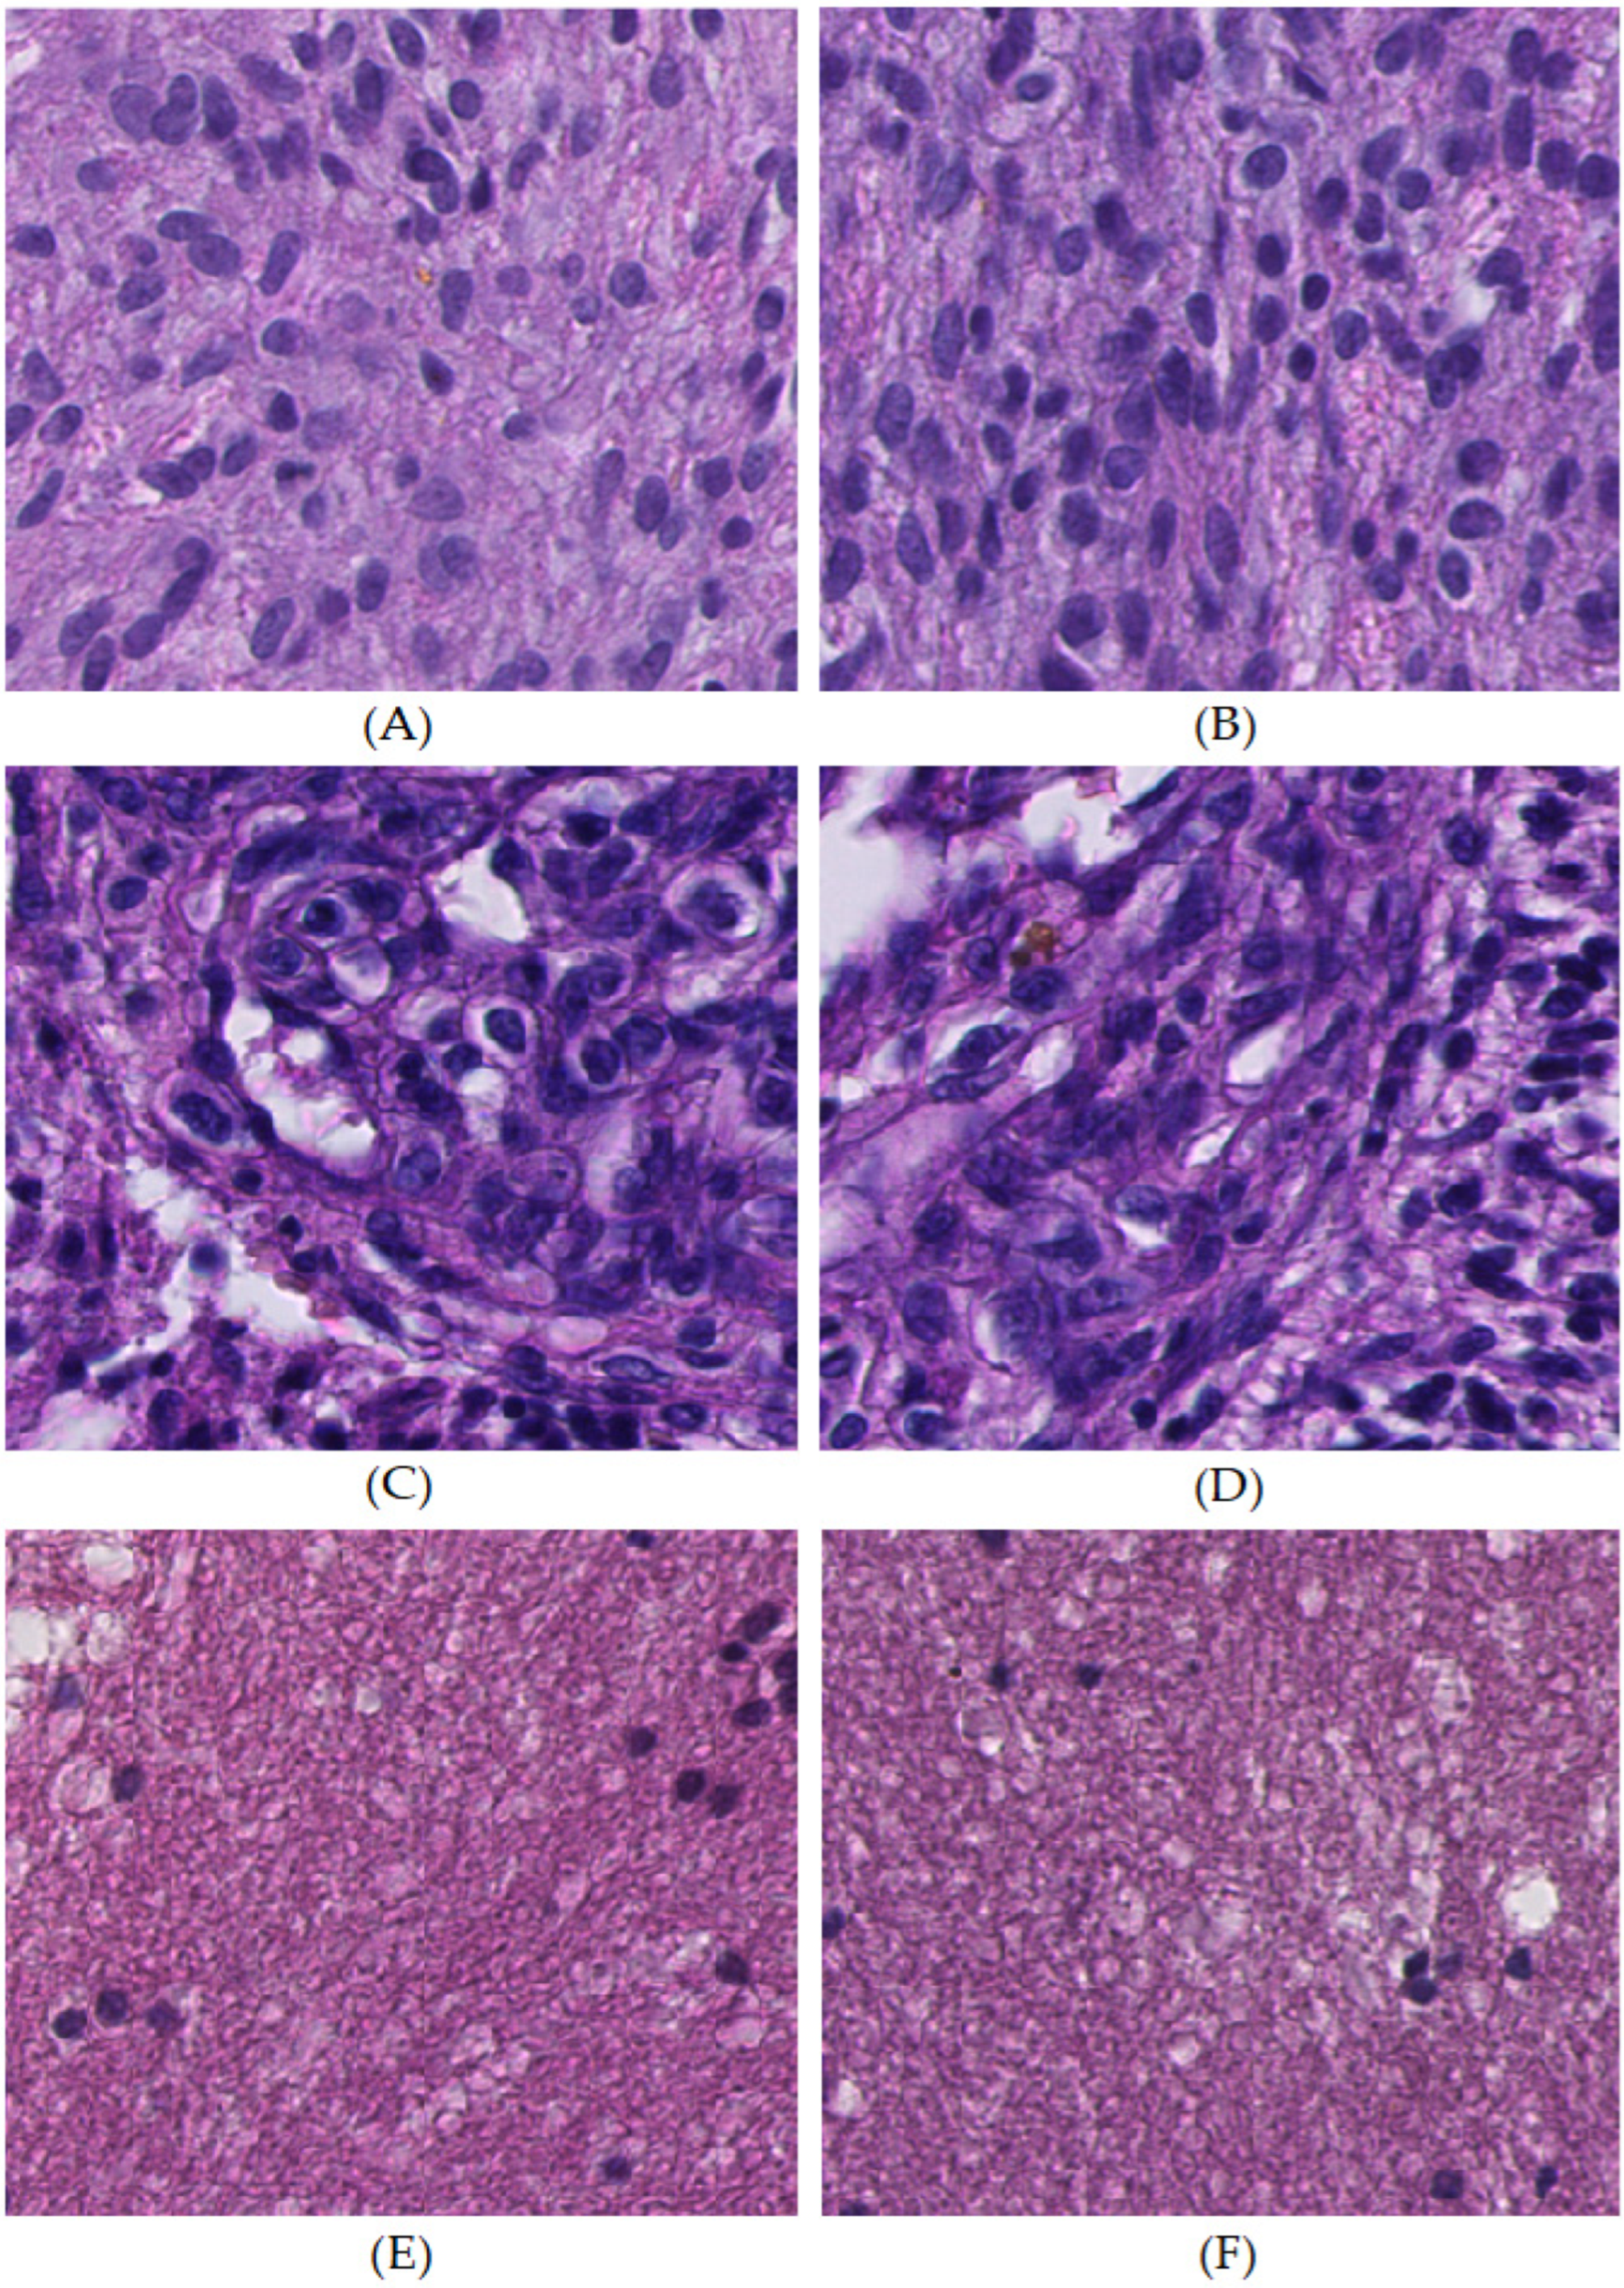
We demonstrated the excellent performance of the ResNet-50 for recognizing characteristic pathologic features and classification in common astrocytic tumors, compared to other similar previous works [20,21,22,23]. However, what distinguished our work from others was that we identified and explained the details of incorrect predictions, which were not articulated in previous works. Our study revealed three main incorrect predictions (Figure 11). Firstly, partial indistinguishable morphological overlap led to anaplastic astrocytoma being misrecognized as glioblastoma tumor cell area at the patch level and classified as glioblastoma at the case level. Secondly, certain zones within the glioblastoma microvascular proliferation area presented dense and crowded endothelial cells with scarce vascular lumen mimicking the glioblastoma tumor cell area. Thirdly, the cellularity in certain regions of diffuse astrocytoma was too low, leading to misrecognition as the glioblastoma necrosis area at the patch level and glioblastoma at the case level. As suggested by our results, the selection of an inclusion criterion of 0.02 for the patch ratio considered for classification was appropriate to filter out minor errors and reduce misclassification.
Several studies have applied a deep learning model integrating cellularity and nuclear morphologic features to enhance glioma classification [17,18]. However, no quantified value or importance weight is available. Our study quantified cellularity and nuclear morphological features, including axis ratio, circularity, entropy, area, irregularity, and perimeter, with an evaluation of importance weight. In addition, the comparisons of the above attributes showed significant differences among different characteristic pathological features. Furthermore, using the XGBoost algorithm, we found that entropy was the most important feature for classification. The entropy of an image indicates the level of randomness present [21,33]. Previous studies demonstrated the value of entropy in low-grade gliomas was different than that of high-grade gliomas [21], and the entropy could differentiate patients with glioblastoma from a healthy control in pathological images [33]. The entropy of the nucleus reflects spatial homogeneity/heterogeneity [21], which is potentially influenced by factors like the extent of nuclear anaplasia and pleomorphism in neoplastic cells, suggesting the potential reason for this importance. Further large-scale studies applying advanced statistical methods, such as a receiver operating characteristic (ROC) curve [34,35], logistic regression model [36], or nomogram [37], to determine the cut-off value of each attribute are needed to establish a prediction model for differentiation among common astrocytic tumors.
Our study had several limitations. Firstly, the case number was relatively small, potentially requiring a more robust dataset that might yield more powerful and convincing results. Secondly, this study only included cases from a single hospital. Including a more diverse and representative selection of cases could enhance the ability to extract disease characteristics more effectively. Thirdly, the study did not include other rare subtypes of astrocytic tumors that were difficult to collect, suggesting a potential area for further exploration and inclusion to provide a more comprehensive understanding of the astrocytic tumors.

5. Conclusions

This study demonstrated a deep residual learning-based classification focusing on identifying and explaining the incorrect predictions and quantification of cellularity and nuclear morphological features with importance weighting specifically in common astrocytic tumors. Identifying incorrect predictions provided worthwhile feedback to machine learning algorithm design to further refine accuracy and diminish errors in classification. Quantifying cellularity and nuclear morphological features with importance weighting was the basis for developing an innovative scoring system. Further multicentric study involving more significant case numbers and other rare subtypes of astrocytic tumors is necessary to establish a powerful prediction model to achieve objective classification and precision diagnosis among astrocytic tumors.

Supplementary Materials

The following supporting information can be downloaded at: https://www.mdpi.com/article/10.3390/cancers16132449/s1, Table S1. The details of testing results using ResNet-50 for classifying diffuse astrocytoma, anaplastic astrocytoma, and glioblastoma.

Author Contributions

Conceptualization, Y.-C.C., S.-Z.L., H.-J.H., K.-L.K., C.-Y.Y. and S.-T.T.; methodology, Y.-C.C., W.-H.Y., C.-Y.Y. and S.-T.T.; software, W.-H.Y. and C.-Y.Y.; validation, Y.-C.C. and W.-H.Y.; formal analysis, Y.-C.C. and W.-H.Y.; investigation, Y.-C.C., J.-R.W. and C.-A.L.; resources, S.-Z.L., H.-J.H., W.-C.T., K.-L.K. and C.-Y.Y.; data curation, Y.-C.C. and W.-H.Y.; writing—original draft preparation, Y.-C.C. and W.-H.Y.; writing—review and editing, S.-Z.L., H.-J.H., W.-C.T., K.-L.K., C.-Y.Y. and S.-T.T.; visualization, Y.-C.C. and W.-H.Y.; supervision, C.-Y.Y. and S.-T.T.; project administration, Y.-C.C., S.-Z.L., H.-J.H., C.-Y.Y. and S.-T.T. All authors have read and agreed to the published version of the manuscript.

Funding

This research received no external funding. This article publishing charge was funded by Hualien Tzu Chi Hospital, Buddhist Tzu Chi Medical Foundation, Hualien, Taiwan, Project No. TCRD111-066.

Institutional Review Board Statement

The study was conducted in accordance with the Declaration of Helsinki and approved by the Institutional Review Board of Hualien Tzu Chi Hospital (approval No. IRB112-255-B, Permission date: 14 December 2023).

Informed Consent Statement

Patient consent was waived because this study was a retrospective study involving no risk to patients and most patients had expired before this study.

Data Availability Statement

The datasets and codes used and analyzed in this study are available from the corresponding authors upon reasonable request.

Acknowledgments

We would like to extend my sincere gratitude to aetherAI Co., Ltd., especially Ming-Yang Ho, and YuanLi Instrument Co., Ltd. for their invaluable support and assistance throughout the course of this research. Their provision of equipment and technical expertise were crucial to the successful completion of this project. We are grateful to Yu-Ru Kou, who provided critical and essential suggestions for polishing this manuscript.

Conflicts of Interest

Authors Wei-Hsiang Yu and Chao-Yuan Yeh were employed by the company aetherAI Co., Ltd. Author Ken-Leiang Kuo was the leader of the company YuanLi Instrument Co., Ltd. The remaining authors declare that the research was conducted in the absence of any commercial or financial relationships that could be construed as a potential conflict of interest.

References

  1. Ostrom, Q.T.; Gittleman, H.; Stetson, L.; Virk, S.; Barnholtz-Sloan, J.S. Epidemiology of intracranial gliomas. In Progress in Neurological Surgery; S. Karger: Berlin, Germany, 2018; Volume 30, pp. 1–11. [Google Scholar] [CrossRef]
  2. Rasmussen, B.K.; Hansen, S.; Laursen, R.J.; Kosteljanetz, M.; Schultz, H.; Nørgård, B.M.; Guldberg, R.; Gradel, K.O. Epidemiology of glioma: Clinical characteristics, symptoms, and predictors of glioma patients grade I–IV in the Danish Neuro-Oncology Registry. J. Neurooncol. 2017, 135, 571–579. [Google Scholar] [CrossRef]
  3. Louis, D.N.; Perry, A.; Reifenberger, G.; von Deimling, A.; Figarella-Branger, D.; Cavenee, W.K.; Ohgaki, H.; Wiestler, O.D.; Kleihues, P.; Ellison, D.W. The 2016 World Health Organization classification of tumors of the central nervous system: A summary. Acta Neuropathol. 2016, 131, 803–820. [Google Scholar] [CrossRef] [PubMed]
  4. Louis, D.N.; Ohgaki, H.; Wiestier, O.D.; Cavenee, W.K.; Ellison, D.W.; Figarella-Branger, D.; Perry, A.; Reifenberger, G.; von Deimling, A. WHO Classification of Tumours of the Central Nervous System, 4th ed.; International Agency for Research on Cancer (IARC): Lyon, France, 2016; pp. 18–56. [Google Scholar]
  5. Kros, J.M.; Gorlia, T.; Kouwenhoven, M.C.; Zheng, P.-P.; Collins, V.P.; Figarella-Branger, D.; Giangaspero, F.; Giannini, C.; Mokhtari, K.; Mørk, S.J.; et al. Panel review of anaplastic oligodendroglioma from European Organization for Research and Treatment of Cancer Trial 26951: Assessment of consensus in diagnosis, influence of 1p/19q loss, and correlations with outcome. J. Neuropathol. Exp. Neurol. 2007, 66, 545–551. [Google Scholar] [CrossRef] [PubMed]
  6. van den Ben, M.J. Interobserver variation of the histopathological diagnosis in clinical trials on glioma: A clinician’s perspective. Acta Neuropathol. 2010, 120, 297–304. [Google Scholar] [CrossRef]
  7. Kim, I.; Kang, K.; Song, Y.; Kim, T.-J. Application of artificial intelligence in pathology: Trends and challenges. Diagnostics 2022, 12, 2794. [Google Scholar] [CrossRef] [PubMed]
  8. Pantanowitz, L.; Wu, U.; Seigh, L.; LoPresti, E.; Yeh, F.-C.; Salgia, P.; Michelow, P.; Hazelhurst, S.; Chen, W.-Y.; Hartman, D.; et al. Artificial intelligence–based screening for mycobacteria in whole-slide images of tissue samples. Am. J. Clin. Pathol. 2021, 156, 117–128. [Google Scholar] [CrossRef]
  9. Chuang, W.-Y.; Chang, S.-H.; Yu, W.-H.; Yang, C.-K.; Yeh, C.-J.; Ueng, S.-H.; Liu, Y.-J.; Chen, T.-D.; Chen, K.-H.; Hsieh, Y.-Y.; et al. Successful identification of nasopharyngeal carcinoma in nasopharyngeal biopsies using deep learning. Cancers 2020, 12, 507. [Google Scholar] [CrossRef]
  10. Chuang, W.-Y.; Chen, C.-C.; Yu, W.-H.; Yeh, C.-J.; Chang, S.-H.; Ueng, S.-H.; Wang, T.-H.; Hsueh, C.; Kuo, C.-F.; Yeh, C.-Y. Identification of nodal micrometastasis in colorectal cancer using deep learning on annotation-free whole-slide images. Mod. Pathol. 2021, 34, 1901–1911. [Google Scholar] [CrossRef]
  11. Li, L.; Han, D.; Yu, Y.; Li, J.; Liu, Y. Artificial intelligence-assisted interpretation of ki-67 expression and repeatability in breast cancer. Diagn. Pathol. 2022, 17, 20. [Google Scholar] [CrossRef]
  12. Bulten, W.; Balkenhol, M.; Belinga, J.-J.A.; Brilhante, A.; Çakır, A.; Egevad, L.; Eklund, M.; Farré, X.; Geronatsiou, K.; Molinié, V. Artificial intelligence assistance significantly improves Gleason grading of prostate biopsies by pathologists. Mod. Pathol. 2021, 34, 660–671. [Google Scholar] [CrossRef]
  13. Yang, C.-K.; Lee, C.-Y.; Wang, H.-S.; Huang, S.-C.; Liang, P.-I.; Chen, J.-S.; Kuo, C.-F.; Tu, K.-H.; Yeh, C.-Y.; Chen, T.-D. Glomerular disease classification and lesion identification by machine learning. Biomed. J. 2022, 45, 675–685. [Google Scholar] [CrossRef] [PubMed]
  14. Chen, K.; Pang, J.; Wang, J.; Xiong, Y.; Li, X.; Sun, S.; Feng, W.; Liu, Z.; Shi, J.; Ouyang, W.; et al. Hybrid task cascade for instance segmentation. In Proceedings of the IEEE/CVF Conference on Computer Vision and Pattern Recognition (CVPR), Long Beach, CA, USA, 15–20 June 2019. [Google Scholar] [CrossRef]
  15. Yu, W.-H.; Li, C.-H.; Wang, R.-C.; Yeh, C.-Y.; Chuang, S.-S. Machine learning based on morphological features enables classification of primary intestinal T-cell lymphomas. Cancers 2021, 13, 5463. [Google Scholar] [CrossRef] [PubMed]
  16. Chuang, W.-Y.; Yu, W.-H.; Lee, Y.-C.; Zhang, Q.-Y.; Chang, H.; Shih, L.-Y.; Yeh, C.-J.; Lin, S.M.-T.; Chang, S.-H.; Ueng, S.-H.; et al. Deep learning-based nuclear morphometry reveals an independent prognostic factor in mantle cell lymphoma. Am. J. Pathol. 2022, 192, 1763–1778. [Google Scholar] [CrossRef] [PubMed]
  17. Pei, L.; Jones, K.A.; Shboul, Z.A.; Chen, J.Y.; Iftekharuddin, K.M. Deep neural network analysis of pathology images with integrated molecular data for enhanced glioma classification and grading. Front. Oncol. 2021, 11, 668694. [Google Scholar] [CrossRef] [PubMed]
  18. Reza, S.M.S.; Iftekharuddin, K.M. Glioma grading using cell nuclei morphologic features in digital pathology images. In Proceedings of the SPIE Conference on Medical Imaging, San Diego, CA, USA, 24 March 2016. [Google Scholar] [CrossRef]
  19. He, K.; Zhang, X.; Ren, S.; Sun, J. Deep residual learning for image recognition. In Proceedings of the IEEE Conference on Computer Vision and Pattern Recognition (CVPR), Las Vegas, NV, USA, 27–30 June 2016. [Google Scholar] [CrossRef]
  20. Su, F.; Cheng, Y.; Chang, L.; Wang, L.; Huang, G.; Yuan, P.; Zhang, C.; Ma, Y. Annotation-free glioma grading from pathological images using ensemble deep learning. Heliyon 2023, 9, e14654. [Google Scholar] [CrossRef]
  21. Rathore, S.; Niazi, T.; Iftikhar, M.A.; Chaddad, A. Glioma grading via analysis of digital pathology images using machine learning. Cancers 2020, 12, 578. [Google Scholar] [CrossRef] [PubMed]
  22. Jose, L.; Liu, S.; Russo, C.; Cong, C.; Song, Y.; Rodriguez, M.; Ieva, A.D. Artificial intelligence–assisted classification of gliomas using whole slide images. Arch. Pathol. Lab. Med. 2023, 147, 916–924. [Google Scholar] [CrossRef] [PubMed]
  23. Im, S.; Hyeon, J.; Rha, E.; Lee, J.; Choi, H.; Jung, Y.; Kim, T. Classification of diffuse glioma subtype from clinical-grade pathological images using deep transfer learning. Sensors 2021, 21, 3500. [Google Scholar] [CrossRef] [PubMed]
  24. Efron, B.; DiCiccio, T. Bootstrap confidence intervals. Stat. Sci. 1996, 11, 189–228. [Google Scholar]
  25. Kim, H.-Y. Statistical notes for clinical researchers: The independent samples t-test. Restor. Dent. Endod. 2019, 44, e26. [Google Scholar] [CrossRef]
  26. Doane, D.P.; Seward, L.E. Measuring skewness: A forgotten statistic? J. Stat. Educ. 2011, 9, 1–18. [Google Scholar] [CrossRef]
  27. Groeneveld, R.A.; Meeden, G. Measuring skewness and kurtosis. J. R. Stat. Soc. Ser. D Stat. 1984, 33, 391–399. [Google Scholar] [CrossRef]
  28. Kim, T.K. Understanding one-way ANOVA using conceptual figures. Korean J. Anesthesiol. 2017, 70, 22–26. [Google Scholar] [CrossRef] [PubMed]
  29. Chen, T.; Guestrin, C. XGBoost: A scalable tree boosting system. In Proceedings of the 22nd ACM SIGKDD International Conference on Knowledge Discovery and Data Mining, San Francisco, CA, USA, 13–17 August 2016. [Google Scholar] [CrossRef]
  30. Ciga, O.; Xu, T.; Nofech-Mozes, S.; Noy, S.; Lu, F.-I.; Martel, A.L. Overcoming the limitations of patch-based learning to detect cancer in whole slide images. Sci. Rep. 2021, 11, 8894. [Google Scholar] [CrossRef]
  31. Li, W.; Nguyen, V.D.; Liao, H.; Wilder, M.; Cheng, K.; Luo, J. Patch transformer for multi-tagging whole slide histopathology images. In Proceedings of the 22nd International Conference on Medical Image Computing and Computer Assisted Intervention (MICCAI), Shenzhen, China, 13–17 October 2019. [Google Scholar]
  32. Hans, P.; Wouter, B.; Jeroen, V.D.L.; Geert, L. Detection of prostate cancer in whole-slide images through end-to-end training with image-level labels. IEEE Trans. Med. Imaging 2021, 40, 1817–1826. [Google Scholar]
  33. Cheung, E.Y.W.; Wu, R.W.K.; Li, A.S.M.; Chu, E.S.M. AI deployment on GBM diagnosis: A novel approach to analyze histopathological images using image feature-based analysis. Cancers 2023, 15, 5063. [Google Scholar] [CrossRef]
  34. Nahm, F.S. Receiver operating characteristic curve: Overview and practical use for clinicians. Korean J. Anesthesiol. 2022, 75, 25–36. [Google Scholar] [CrossRef]
  35. Unal, I. Defining an optimal cut-point value in ROC analysis: An alternative approach. Comput. Math. Methods Med. 2017, 2017, 3762651. [Google Scholar] [CrossRef]
  36. Boateng, E.Y.; Abaye, D.A. A review of the logistic regression model with emphasis on medical research. J. Data Anal. Inf. Process. 2019, 7, 190–207. [Google Scholar] [CrossRef]
  37. Lee, W.; Lam, S.-K.; Zhang, Y.; Yang, R.; Cai, J. Review of methodological workflow, interpretation and limitations of nomogram application in cancer study. Radiat. Med. Prot. 2022, 3, 200–207. [Google Scholar] [CrossRef]
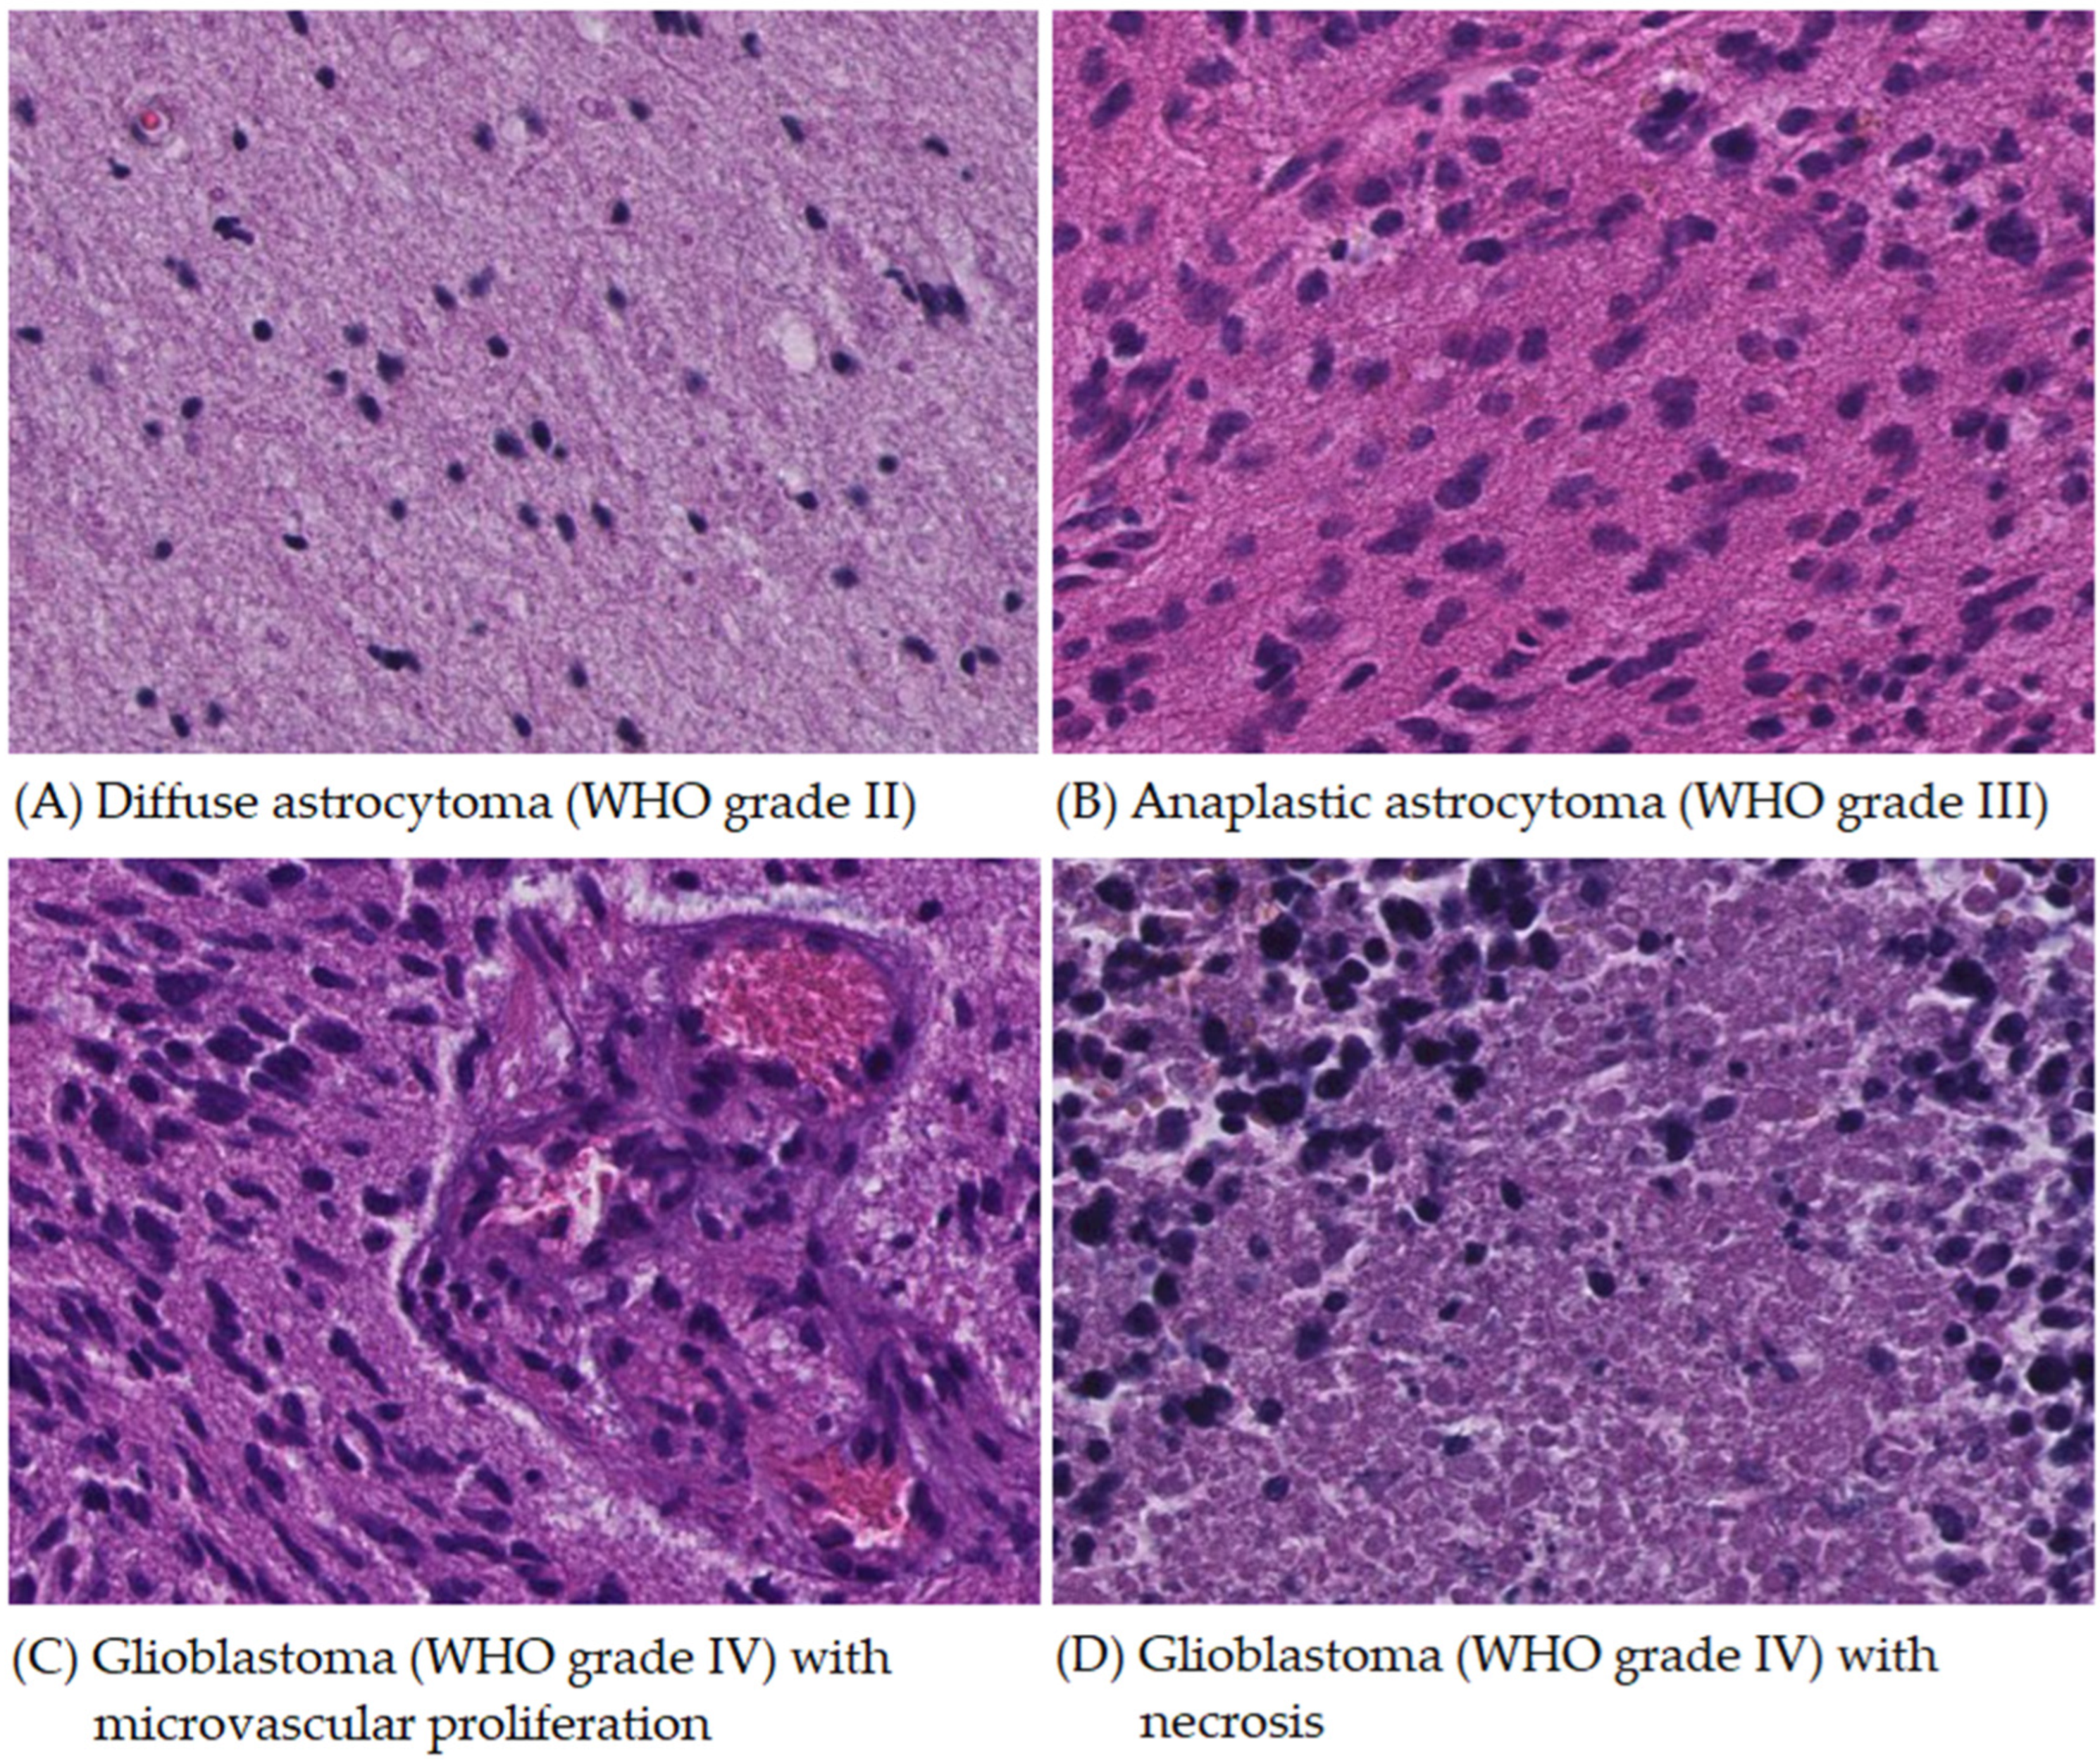
Figure 1. Representative images and the annotated regions of interest (ROIs) included the following: (A) diffuse astrocytoma showing nuclear atypia of neoplastic astrocytes, (B) anaplastic astrocytoma in which neoplastic astrocytes show nuclear atypia with anaplasia, (C) glioblastoma tumor cell area (left), composed of neoplastic astrocytes with nuclear atypia and anaplasia, and microvascular proliferation (right) with vascular lumen filled with blood cells and lined by endothelial cells, and (D) glioblastoma necrosis area presenting the contours of dead cells mixed with a small number of viable cells. The cellularity is moderately increased in diffuse astrocytoma, while high cellularity is usually presented in anaplastic astrocytoma and glioblastoma. (H&E stain, all pictures in the same magnification of 200×).
Cancers 16 02449 g001
Figure 2. The flowchart for applying residual neural network-50 (ResNet-50) to predict characteristic pathological features. Regions of interest (ROIs) were annotated on digital pathological images, and 512 × 512 patches were extracted from ROIs by using a stride of 256. Residual neural network-50 (ResNet-50) was utilized to generate predictions.
Cancers 16 02449 g002
Figure 3. Examples of cellularity. Cellularity represents the proportion of cell-occupied area to the overall area. The green boxes indicate the cells detected. (A) Cellularity of 0.012 and (B) cellularity of 0.081.
Cancers 16 02449 g003
Figure 4. The nuclear morphological features. The attributes we used in the present study and the definitions are as follows: (A) axis ratio, the ratio of the length of the long axis to the short axis; (B) circularity, the overlapping area between the nucleus and a concentric circle; (C) entropy, the measurement of pixel randomness; (D) area, the estimated nuclear size in square micrometers; (E) irregularity, the length variance from the center of a nucleus to each vertex of nuclear boundary; and (F) perimeter, the total length along a nuclear contour in micrometers.
Cancers 16 02449 g004
Figure 5. The confusion matrix of prediction results using ResNet-50 to recognize characteristic pathological features at the patch level. The accuracy was 0.916 (95% confidence interval, 0.915–0.916). Most patches were correctly predicted. Two main incorrect predictions (lattices with gray background) were that partial patches (67.9%) of anaplastic astrocytoma and some patches (38.5%) of glioblastoma microvascular proliferation area were misrecognized as glioblastoma tumor cell area.
Cancers 16 02449 g005
Figure 6. The confusion matrix of prediction results using ResNet-50 to recognize diffuse astrocytoma, high-grade astrocytoma tumor cell area, glioblastoma necrosis area, and glioblastoma microvascular proliferation area at the patch level. The accuracy achieved was 0.960 (95% confidence interval, 0.960–0.961). Most patches were correctly predicted. A principal incorrect prediction (lattice marked by gray background) was that some patches (34.7%) of the glioblastoma microvascular proliferation area were erroneously categorized into high-grade astrocytoma tumor cell area.
Cancers 16 02449 g006
Figure 7. The confusion matrix of prediction results using ResNet-50 for classifying diffuse astrocytoma, anaplastic astrocytoma, and glioblastoma at the case level, based on inclusion criterion of 0.00. The inclusion criterion of 0.00 meant that any predicted characteristic pathological feature patch ratio was considered for classification. The accuracy was 0.769. Six cases of diffuse astrocytoma and three cases of anaplastic astrocytoma were incorrectly classified into cases of glioblastoma.
Cancers 16 02449 g007
Figure 8. The confusion matrix of prediction results using ResNet-50 for classifying diffuse astrocytoma, anaplastic astrocytoma, and glioblastoma at the case level, based on the inclusion criterion of 0.02. The inclusion criterion of 0.02 meant that the patch ratios of the predicted characteristic pathological features could only be considered for classification if they reached 0.02. The accuracy was 0.846. Three cases of diffuse astrocytoma and three cases of anaplastic astrocytoma were incorrectly classified as cases of glioblastoma.
Cancers 16 02449 g008
Figure 9. The confusion matrix of prediction results using ResNet-50 for classifying diffuse astrocytoma, anaplastic astrocytoma, and glioblastoma at the case level, based on inclusion criterion of 0.05. Inclusion criterion of 0.05 meant that the patch ratios of the predicted characteristic pathological features could only be considered for classification if they reached 0.05. The accuracy was 0.846. Two cases of diffuse astrocytoma and three cases of anaplastic astrocytoma were incorrectly classified into cases of glioblastoma. A case of diffuse astrocytoma was incorrectly classified as anaplastic astrocytoma.
Cancers 16 02449 g009
Figure 10. The importance weight evaluated by using the XGBoost model. Entropy was the most significant contributor, followed by cellularity, area, circularity, axis ratio, perimeter, and irregularity.
Cancers 16 02449 g010
Figure 11. The actual case examples of incorrect predictions. (A,B) Anaplastic astrocytoma resembled and was misrecognized as a glioblastoma tumor cell area. (C,D) Densely compact endothelial cells with a small amount of vessel lumen in the glioblastoma microvascular proliferation area mimicked the glioblastoma tumor cell area. (E,F) Low cellularity regions in diffuse astrocytoma imitated glioblastoma necrosis area.
Cancers 16 02449 g011
Table 1. Data summary.
CategoryTrainingValidationTesting
CasesROIsPatchesCasesROIsPatchesCasesROIsPatches
Diffuse astrocytoma472915,17632121877883312,316
Anaplastic astrocytoma614873551217740132561014
Glioblastoma tumor cell area 22077382 515913 152111,653
Glioblastoma necrosis area2965723571210722088284602145
Glioblastoma microvascular proliferation area 423465 114126 257232
Total39550328,931172090540539332727,360
Abbreviation: ROIs, regions of interest.
Table 2. The selective testing cases with incorrect classification by using ResNet-50 for classifying diffuse astrocytoma, anaplastic astrocytoma, and glioblastoma.
Testing Case No.DiagnosisCharacteristic Morphological
Features
PredictionInclusion Criterion of 0.00Inclusion Criterion of 0.02Inclusion Criterion of 0.05
CountRatioRatioClassificationRatioClassificationRatioClassification
Case 13Diffuse astrocytomaDiffuse astrocytoma50250.998 0.998 Glioblastoma0.998Diffuse astrocytoma0.998Diffuse astrocytoma
Anaplastic astrocytoma30.001 0.001 0.0010.001
Glioblastoma tumor cell area
Glioblastoma necrosis area90.002 0.0020.0020.002
Glioblastoma microvascular proliferation area
Case 14Diffuse astrocytomaDiffuse astrocytoma2160.722 0.722 Glioblastoma0.722 Glioblastoma0.722 Glioblastoma
Anaplastic astrocytoma
Glioblastoma tumor cell area220.074 0.0740.0740.074
Glioblastoma necrosis area600.201 0.2010.2010.201
Glioblastoma microvascular proliferation area10.003 0.0030.0030.003
Case 15Anaplastic astrocytomaDiffuse astrocytoma Glioblastoma Glioblastoma Glioblastoma
Anaplastic astrocytoma
Glioblastoma tumor cell area1461.000 1.0001.0001.000
Glioblastoma necrosis area
Glioblastoma microvascular proliferation area
Case 17Diffuse
astrocytoma
Diffuse astrocytoma52800.998 0.998 Glioblastoma0.998Diffuse astrocytoma0.998Diffuse astrocytoma
Anaplastic astrocytoma
Glioblastoma tumor cell area
Glioblastoma necrosis area90.002 0.0020.0020.002
Glioblastoma microvascular proliferation area
Case 22Diffuse astrocytomaDiffuse astrocytoma5300.994 0.994 Glioblastoma0.994Diffuse astrocytoma0.994Diffuse astrocytoma
Anaplastic astrocytoma
Glioblastoma tumor cell area
Glioblastoma necrosis area10.002 0.0020.0020.002
Glioblastoma microvascular proliferation area20.004 0.0040.0040.004
Case 25Diffuse astrocytomaDiffuse astrocytoma10.002 0.002 Glioblastoma0.002Glioblastoma0.002Anaplastic astrocytoma
Anaplastic astrocytoma4490.943 0.943 0.943 0.943
Glioblastoma tumor cell area160.034 0.0340.0340.034
Glioblastoma necrosis area80.017 0.0170.0170.017
Glioblastoma microvascular proliferation area20.004 0.0040.0040.004
Case 27Anaplastic astrocytomaDiffuse astrocytoma Glioblastoma Glioblastoma Glioblastoma
Anaplastic astrocytoma280.113 0.113 0.113 0.113
Glioblastoma tumor cell area2200.887 0.8870.8870.887
Glioblastoma necrosis area
Glioblastoma microvascular proliferation area
Case 29Anaplastic astrocytomaDiffuse astrocytoma Glioblastoma Glioblastoma Glioblastoma
Anaplastic astrocytoma2960.477 0.477 0.477 0.477
Glioblastoma tumor cell area3230.521 0.5210.5210.521
Glioblastoma necrosis area
Glioblastoma microvascular proliferation area10.002 0.0020.0020.002
Case 38Diffuse astrocytomaDiffuse astrocytoma60.016 0.016 Glioblastoma0.016 Glioblastoma0.016Glioblastoma
Anaplastic astrocytoma
Glioblastoma tumor cell area
Glioblastoma necrosis area3670.984 0.9840.9840.984
Glioblastoma microvascular proliferation area
The inclusion criterion of 0.00 meant any predicted characteristic pathological feature patch ratio was considered for classification. The inclusion criteria of 0.02 and 0.05 meant that the patch ratios of the predicted characteristic pathological features could only be considered for classification if they reached 0.02 and 0.05, respectively. Number with strikethrough means criteria exclude the patch ratio. The bold number in the ratio column indicates the determinant(s) for classification. Red text indicates incorrect classification.
Table 3. The average cellularities for individual characteristic pathological features.
CategoryROIsCellularity
Diffuse astrocytoma17740.052 ± 0.018
Anaplastic astrocytoma19150.180 ± 0.063
Glioblastoma tumor cell area42380.195 ± 0.051
Glioblastoma necrosis area21840.003 ± 0.008
Glioblastoma microvascular proliferation area7940.122 ± 0.052
Abbreviation: ROI, region of interest. Cellularity is presented by mean ± standard deviation.
Table 4. The p-value of Welch’s t-test with Bonferroni correction for cellularities between characteristic pathological features.
Diffuse AstrocytomaAnaplastic AstrocytomaGlioblastoma Tumor Cell AreaGlioblastoma Necrosis AreaGlioblastoma Microvascular Proliferation Area
Diffuse astrocytoma <0.001 *<0.001 *<0.001 *<0.001 *
Anaplastic astrocytoma <0.001 *<0.001 *<0.001 *
Glioblastoma tumor cell area <0.001 *<0.001 *
Glioblastoma necrosis area <0.001 *
Glioblastoma microvascular proliferation area
* Statistically significant, p < 0.05.
Table 5. The nuclear morphological features for individual characteristic pathological features.
AttributesMoments (Mean ± SD)Diffuse AstrocytomaAnaplastic AstrocytomaGlioblastoma Tumor Cell AreaGlioblastoma Necrosis AreaGlioblastoma Microvascular Proliferation AreaF-Test
N = 15N = 11N = 69F-Statisticsp Value
Axis RatioMean1.437 ± 0.1031.540 ± 0.1181.570 ± 0.1231.504 ± 0.1931.734 ± 0.14420.377<0.001 *
Variance0.139 ± 0.0660.192 ± 0.0920.194 ± 0.1010.169 ± 0.1950.359 ± 0.18212.489<0.001 *
Skewness2.351 ± 0.2852.113 ± 0.4091.844 ± 0.3321.704 ± 0.9031.839 ± 0.61410.38<0.001 *
Kurtosis10.106 ± 2.9799.264 ± 4.5456.201 ± 2.9595.264 ± 6.0705.368 ± 3.93621.733<0.001 *
CircularityMean0.672 ± 0.0370.634 ± 0.0400.622 ± 0.0380.641 ± 0.0530.574 ± 0.03525.248<0.001 *
Variance0.014 ± 0.0030.015 ± 0.0030.015 ± 0.0030.013 ± 0.0070.018 ± 0.00310.478<0.001 *
Skewness−0.642 ± 0.153−0.422 ± 0.153−0.330 ± 0.163−0.423 ± 0.365−0.250 ± 0.22311.425<0.001 *
Kurtosis0.140 ± 0.308−0.235 ± 0.274−0.341 ± 0.248−0.282 ± 0.657−0.525 ± 0.30711.417<0.001 *
EntropyMean4.921 ± 0.1984.745 ± 0.1654.808 ± 0.1874.925 ± 0.2024.711 ± 0.2277.833<0.001 *
Variance0.127 ± 0.0350.131 ± 0.0340.135 ± 0.0350.138 ± 0.0720.192 ± 0.0599.655<0.001 *
Skewness−0.401 ± 0.187−0.398 ± 0.229−0.408 ± 0.290−0.474 ± 0.453−0.517 ± 0.3480.8060.546
Kurtosis0.993 ± 0.5680.885 ± 0.5680.900 ± 0.6920.766 ± 1.7450.866 ± 0.9410.3230.899
Area (μm2)Mean21.311 ± 3.46625.958 ± 4.90130.546 ± 6.18313.676 ± 3.53625.345 ± 6.75053.112<0.001 *
Variance83.678 ± 40.508164.005 ± 78.404231.174 ± 126.80355.408 ± 37.289185.253 ± 181.00713.109<0.001 *
Skewness1.460 ± 0.3771.588 ± 0.3551.471 ± 0.5111.575 ± 1.0371.362 ± 0.5671.6390.151
Kurtosis6.493 ± 7.0974.493 ± 2.1774.257 ± 5.2026.362 ± 14.9653.129 ± 3.7741.1530.334
IrregularityMean3.339 ± 0.9485.342 ± 1.3276.783 ± 1.9072.648 ± 1.1157.784 ± 2.16159.537<0.001 *
Variance17.540 ± 9.77940.655 ± 15.94161.880 ± 32.0279.060 ± 9.49890.134 ± 115.8299.488<0.001 *
Skewness4.279 ± 0.7283.691 ± 0.8653.200 ± 0.6632.710 ± 1.6502.747 ± 1.2437.622<0.001 *
Kurtosis33.584 ± 11.74726.882 ± 14.45218.175 ± 9.30014.466 ± 17.31113.132 ± 15.3719.002<0.001 *
Perimeter (μm)Mean17.887 ± 1.39019.942 ± 1.76021.745 ± 2.07514.327 ± 1.82720.254 ± 2.3979.245<0.001 *
Variance14.608 ± 5.06424.255 ± 5.94130.381 ± 8.93213.589 ± 7.07530.875 ± 13.95324.395<0.001 *
Skewness0.824 ± 0.2051.014 ± 0.3130.833 ± 0.3000.827 ± 0.5090.846 ± 0.4051.4130.221
Kurtosis2.137 ± 1.2241.732 ± 0.9521.190 ± 1.0891.392 ± 3.1471.062 ± 1.2751.350.245
Abbreviation: SD, standard deviation. * Statistically significant, p < 0.05.
Disclaimer/Publisher’s Note: The statements, opinions and data contained in all publications are solely those of the individual author(s) and contributor(s) and not of MDPI and/or the editor(s). MDPI and/or the editor(s) disclaim responsibility for any injury to people or property resulting from any ideas, methods, instructions or products referred to in the content.