


Concurrent Endometrial Cancer in Women with Atypical Endometrial Hyperplasia: What Is the Predictive Value of Patient Characteristics? †
 ,
,  , ,
, ,  , , , , , , ,
  add
Show full author list
add
Show full author list
Abstract
:Simple Summary
Abstract
1. Introduction
2. Materials and Methods
2.1. Study Design and Setting
2.2. Variables
2.3. Sample Size Calculation
2.4. Statistical Methods
3. Results
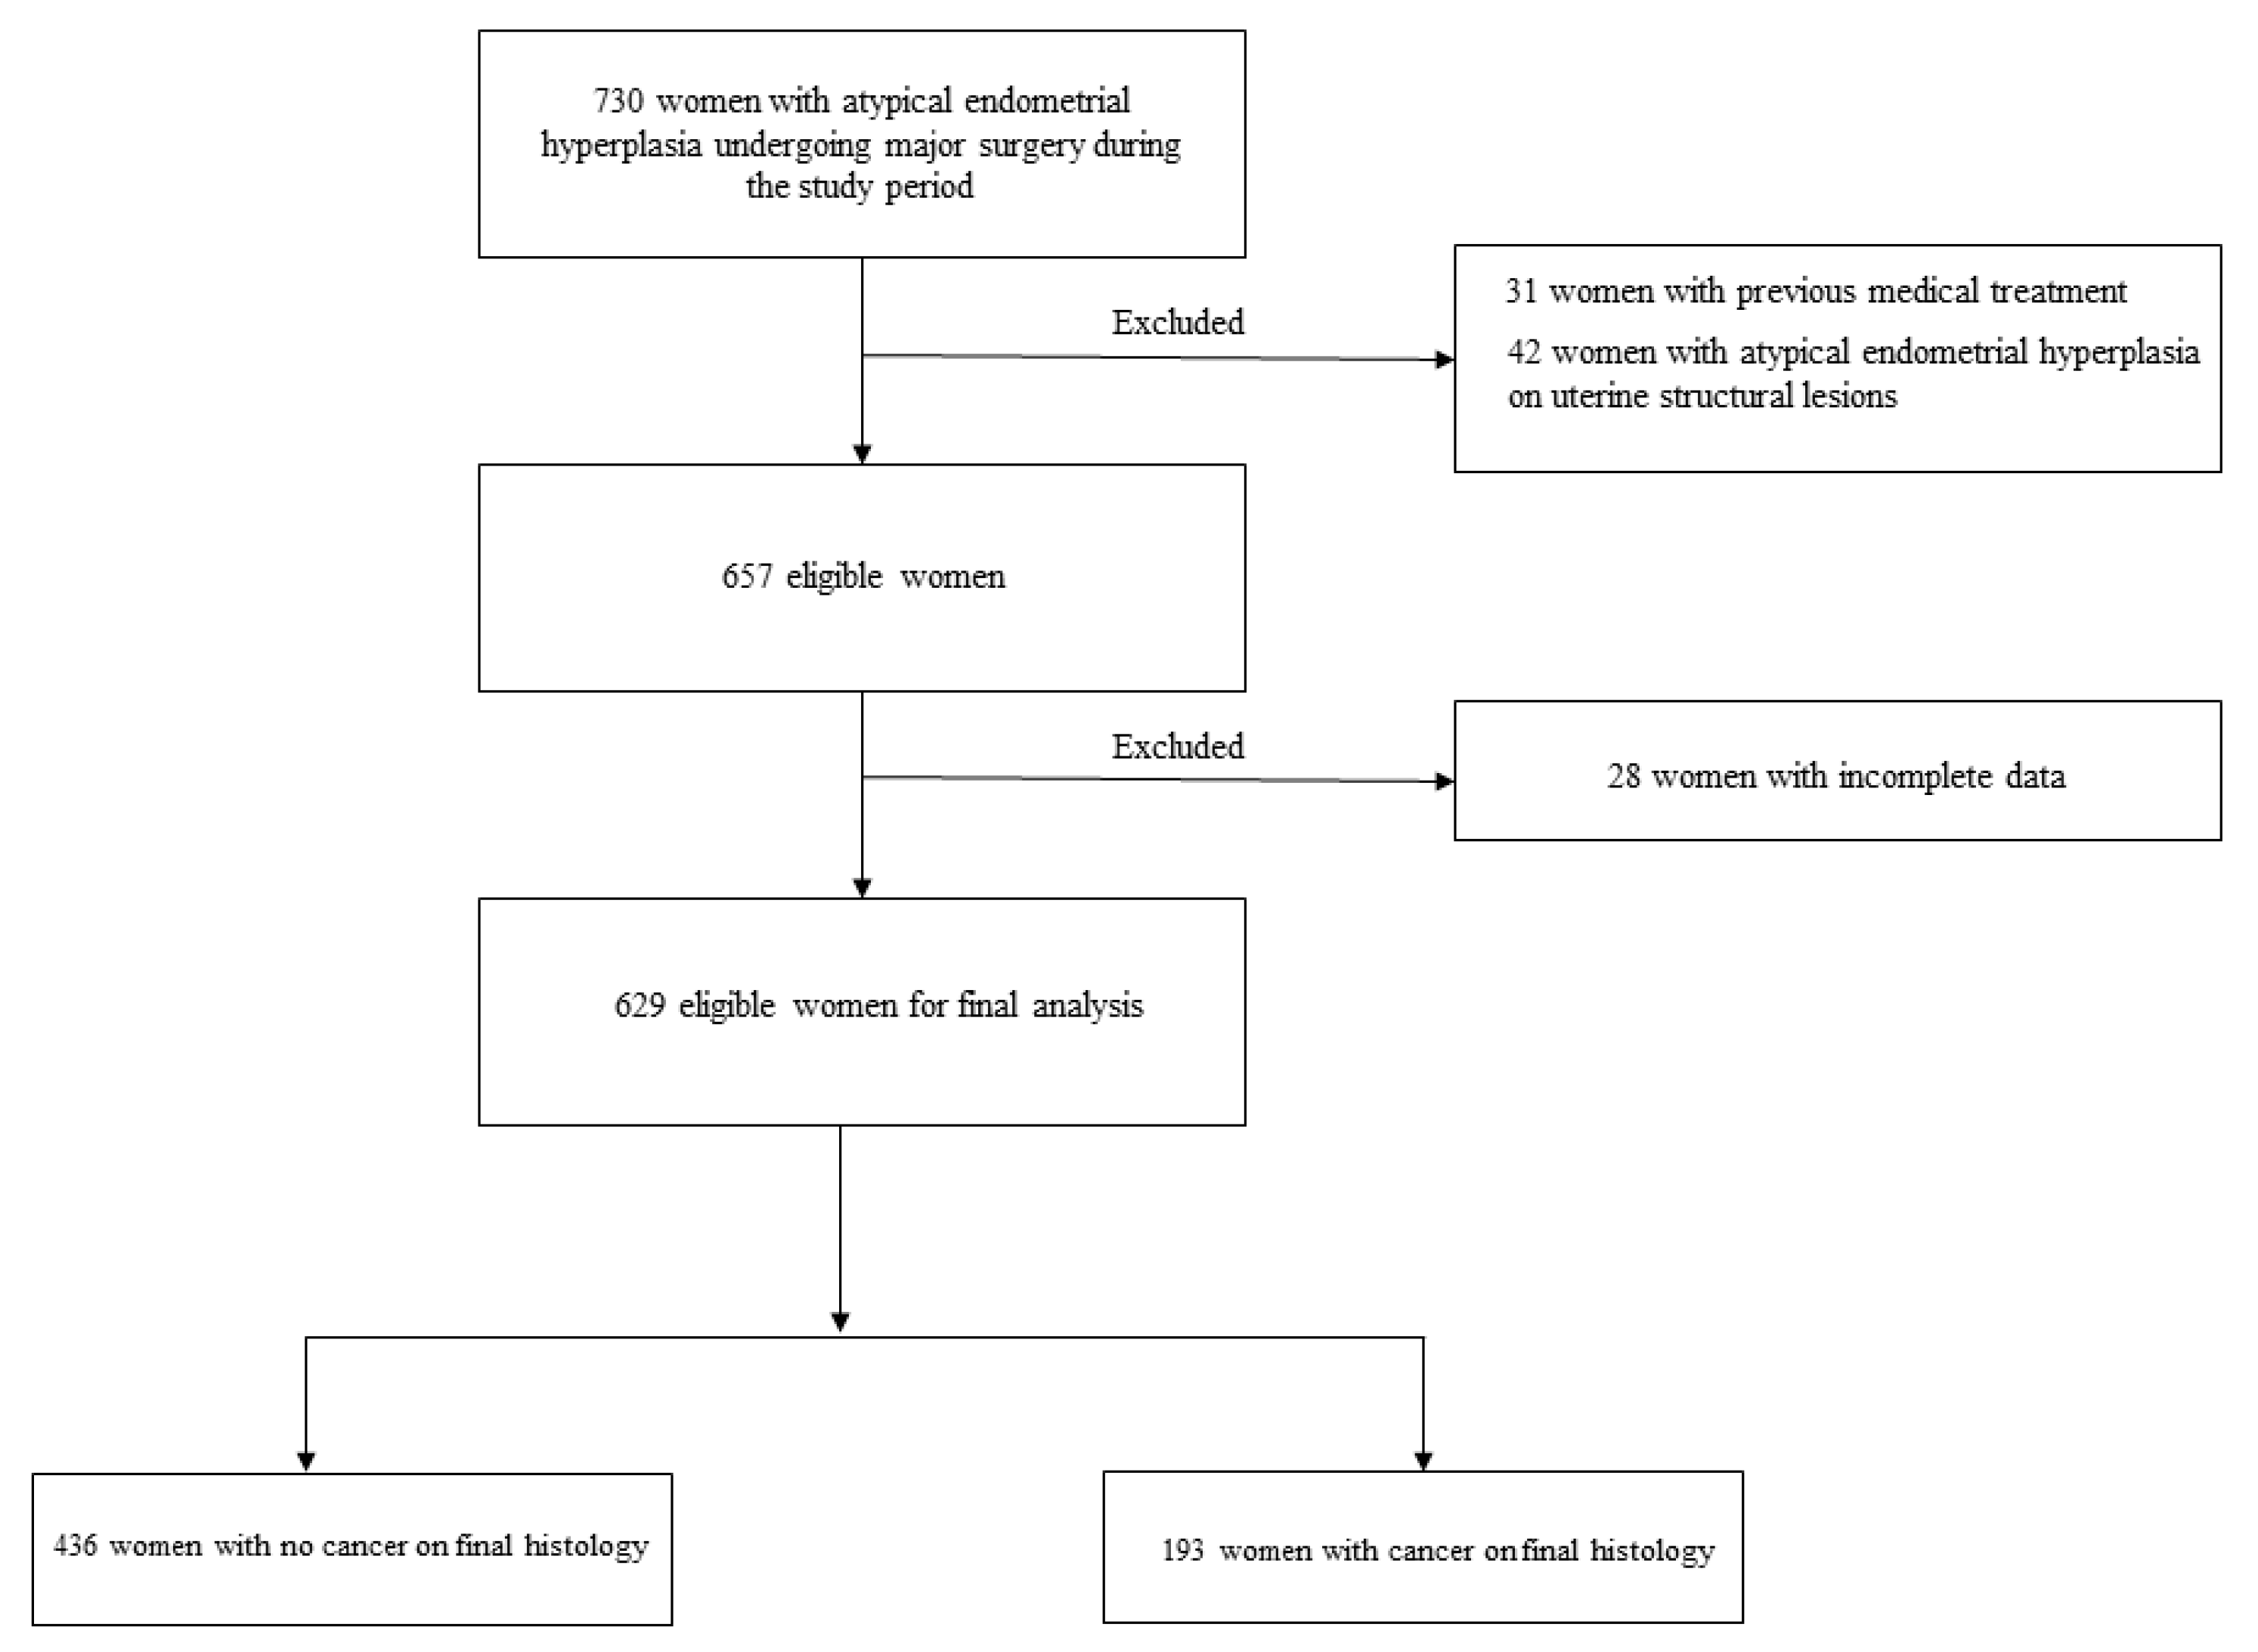
3.1. Study Population
3.2. Regression-Based Predictors
3.3. Artificial Intelligence-Based Predictors
3.4. Recurrent Patient Characteristics in Women with High-Risk Disease
4. Discussion
5. Conclusions
Supplementary Materials
Author Contributions
Funding
Institutional Review Board Statement
Informed Consent Statement
Data Availability Statement
Conflicts of Interest
References
- Gücer, F.; Reich, O.; Tamussino, K.; Bader, A.A.; Pieber, D.; Schöll, W.; Haas, J.; Petru, E. Concomitant Endometrial Hyperplasia in Patients with Endometrial Carcinoma. Gynecol. Oncol. 1998, 69, 64–68. [Google Scholar] [CrossRef] [PubMed]
- Widra, E.; Dunton, C.; McHugh, M.; Palazzo, J. Endometrial hyperplasia and the risk of carcinoma. Int. J. Gynecol. Cancer 1995, 5, 233–235. [Google Scholar] [CrossRef] [PubMed]
- Whyte, J.S.; Gurney, E.P.; Curtin, J.P.; Blank, S.V. Lymph node dissection in the surgical management of atypical endometrial hyperplasia. Am. J. Obstet. Gynecol. 2010, 202, 176.e1–176.e4. [Google Scholar] [CrossRef] [PubMed]
- Touhami, O.; Grégoire, J.; Renaud, M.-C.; Sebastianelli, A.; Grondin, K.; Plante, M. The utility of sentinel lymph node mapping in the management of endometrial atypical hyperplasia. Gynecol. Oncol. 2018, 148, 485–490. [Google Scholar] [CrossRef] [PubMed]
- Kurman, R.J.; Kaminski, P.F.; Norris, H.J. The behavior of endometrial hyperplasia. A long-term study of “untreated” hyperplasia in 170 patients. Cancer 1985, 56, 403–412. [Google Scholar] [CrossRef] [PubMed]
- Concin, N.; Matias-Guiu, X.; Vergote, I.; Cibula, D.; Mirza, M.R.; Marnitz, S.; Ledermann, J.A.; Bosse, T.; Chargari, T.; Fagotti, A. ESGO/ESTRO/ESP guidelines for the management of patients with endometrial carcinoma. Int. J. Gynecol. Cancer 2021, 31, 12–39. [Google Scholar] [CrossRef] [PubMed]
- Shalowitz, D.I.; Goodwin, A.; Schoenbachler, N. Does surgical treatment of atypical endometrial hyperplasia require referral to a gynecologic oncologist? Am. J. Obstet. Gynecol. 2019, 220, 460–464. [Google Scholar] [CrossRef] [PubMed]
- Wise, M.R.; Gill, P.; Lensen, S.; Thompson, J.M.; Farquhar, C.M. Body mass index trumps age in decision for endometrial biopsy: Cohort study of symptomatic premenopausal women. Am. J. Obstet. Gynecol. 2016, 215, 598.e1–598.e8. [Google Scholar] [CrossRef]
- Vetter, M.H.; Smith, B.; Benedict, J.; Hade, E.M.; Bixel, K.; Copeland, L.J.; Cohn, D.E.; Fowler, J.M.; O’malley, D.; Salani, R.; et al. Preoperative predictors of endometrial cancer at time of hysterectomy for endometrial intraepithelial neoplasia or complex atypical hyperplasia. Am. J. Obstet. Gynecol. 2020, 222, 60.e1–60.e7. [Google Scholar] [CrossRef]
- Matsuo, K.; Ramzan, A.A.; Gualtieri, M.R.; Mhawech-Fauceglia, P.; Machida, H.; Moeini, A.; Dancz, C.E.; Ueda, Y.; Roman, L.D. Prediction of concurrent endometrial carcinoma in women with endometrial hyperplasia. Gynecol. Oncol. 2015, 139, 261–267. [Google Scholar] [CrossRef]
- Giannella, L.; Carpini, G.D.; Sopracordevole, F.; Papiccio, M.; Serri, M.; Giorda, G.; Tsiroglou, D.; Del Fabro, A.; Ciavattini, A. Atypical Endometrial Hyperplasia and Unexpected Cancers at Final Histology: A Study on Endometrial Sampling Methods and Risk Factors. Diagnostics 2020, 10, 474. [Google Scholar] [CrossRef] [PubMed]
- Erdem, B.; Aşıcıoğlu, O.; Seyhan, N.A.; Peker, N.; Ülker, V.; Akbayır, Ö. Can concurrent high-risk endometrial carcinoma occur with atypical endometrial hyperplasia? Int. J. Surg. 2018, 53, 350–353. [Google Scholar] [CrossRef] [PubMed]
- Available online: https://www.gazzettaufficiale.it/eli/gu/2012/03/26/72/sg/pdf (accessed on 1 October 2023).
- Emons, G.; Beckmann, M.W.; Schmidt, D.; Mallmann, P. Uterus commission of the Gynecological Oncology Working Group (AGO). New WHO Classification of Endometrial Hyperplasias. Geburtshilfe Frauenheilkd. 2015, 75, 135–136. [Google Scholar] [PubMed]
- Zaino, R.C.S.G.; Carinelli, S.G.; Ellenson, L.H.; Eng, C.; Katabuchi, H.; Konishi, I.; Lax, S. Tumours of the uterine Corpus: Epithelial Tumours and Precursors. In WHO Classification of Tumours of female reproductive Organs, 4th ed.; Kurman, R.J., Carcanglu, M.L., Herrington, C.S., Young, R.H., Eds.; WHO Press: Lyon, France, 2014; pp. 125–126. [Google Scholar]
- Riley, R.D.; Ensor, J.; I E Snell, K.; E Harrell, F.; Martin, G.P.; Reitsma, J.B.; Moons, K.G.M.; Collins, G.; van Smeden, M. Calculating the sample size required for developing a clinical prediction model. BMJ 2020, 368, m441. [Google Scholar] [CrossRef] [PubMed]
- Swets, J.A. Measuring the accuracy of diagnostic systems. Science 1988, 240, 1285–1293. [Google Scholar] [CrossRef] [PubMed]
- Safari, S.; Baratloo, A.; Elfil, M.; Negida, A. Evidence Based Emergency Medicine; Part 5 Receiver Operating Curve and Area under the Curve. Emergency 2016, 4, 111–113. [Google Scholar] [PubMed]
- Nahm, F.S. Receiver operating characteristic curve: Overview and practical use for clinicians. Korean J. Anesthesiol. 2022, 75, 25–36. [Google Scholar] [CrossRef]
- Nees, L.K.; Heublein, S.; Steinmacher, S.; Juhasz-Böss, I.; Brucker, S.; Tempfer, C.B.; Wallwiener, M. Endometrial hyperplasia as a risk factor of endometrial cancer. Arch. Gynecol. Obstet. 2022, 306, 407–421. [Google Scholar] [CrossRef]
- Giannella, L.; Paganelli, S. Abnormal uterine bleeding in premenopausal women and the role of body mass index. Am. J. Obstet. Gynecol. 2017, 216, 533. [Google Scholar] [CrossRef]
- Wise, M.R.; Farquhar, C.M. Reply. Am. J. Obstet. Gynecol. 2017, 216, 533–534. [Google Scholar] [CrossRef]
- Russo, M.; Newell, J.M.; Budurlean, L.; Houser, K.R.; Sheldon, K.; Kesterson, J.; Phaeton, R.; Hossler, C.; Rosenberg, J.; DeGraff, D.; et al. Mutational profile of endometrial hyperplasia and risk of progression to endometrioid adenocarcinoma. Cancer 2020, 126, 2775–2783. [Google Scholar] [CrossRef] [PubMed]
- Raffone, A.; Travaglino, A.; Gabrielli, O.; Micheli, M.; Zuccalà, V.; Bitonti, G.; Camastra, C.; Gargiulo, V.; Insabato, L.; Zullo, F. Clinical features of ProMisE groups identify different phenotypes of patients with endometrial cancer. Arch. Gynecol. Obstet. 2021, 303, 1393–1400. [Google Scholar] [CrossRef] [PubMed]
- Huang, Y.-J.; Li, B.-L. The significance of plasma D-dimer level in predicting high risk factors of endometrial cancer. Transl. Cancer Res. 2020, 9, 7688–7696. [Google Scholar] [CrossRef] [PubMed]
- Ge, L.; Liu, G.; Hu, K.; Huang, K.; Zhang, M.; Zhou, J.; Teng, F.; Cao, J.; Dai, C.; Jia, X. A New Risk Index Combining d-Dimer, Fibrinogen, HE4, and CA199 Differentiates Suspecting Endometrial Cancer From Patients With Abnormal Vaginal Bleeding or Discharge. Technol. Cancer Res. Treat. 2020, 19, 1533033819901117. [Google Scholar] [CrossRef]

| Independent Variables | n (%) (sample Size = 629) |
|---|---|
| Age (median and interquartile ranges) | 56.0 (51.0–65.0) |
| Menopause | 427 (67.9) |
| Nulligravid | 118 (18.8) |
| Smoking habit | 121 (19.2) |
| Body Mass Index (reported as continuous variable; median and interquartile ranges) | 27.0 (24.0–33.0) |
| Comorbidity | |
| Diabetes | 18 (2.9) |
| Hypertension | 192 (30.5) |
| Diabetes + Hypertension | 43 (6.8) |
| Lynch Syndrome | 9 (1.4) |
| Previous breast cancer | 92 (14.6) |
| Previous Tamoxifen therapy | 36 (5.7) |
| Hormonal therapy | |
| OC | 33 (5.2) |
| HRT | 17 (2.7) |
| Abnormal uterine bleeding | 429 (68.2) |
| Endometrial sampling methods | |
| HSC-bio | 383 (60.9) |
| HSC-res | 153 (24.3) |
| D&C | 93 (14.8) |
| Endometrial Cancer | 193 (30.7) |
| Women with Pre-Operative AEH | Final Histology (Hysterectomy) | ||
|---|---|---|---|
| Independent Variables | No Endometrial Cancer (436) n (%) | Endometrial Cancer (193) n (%) | p Value |
| Age (median and interquartile ranges) | 56 (51.0–64.0) | 59 (52.0–69.0) | <0.001 |
| Menopause | 284 (65.1) | 143 (74.1) | 0.026 |
| Nulligravid | 77 (17.7) | 41 (21.2) | 0.288 |
| Smoking habit | 89 (20.4) | 32 (16.6) | 0.261 |
| Body Mass Index (median and interquartile ranges) | 27 (23.0–32.0) | 29 (25.0–35.0) | <0.001 |
| Comorbidity | 0.311 | ||
| Diabetes | 14 (3.2) | 4 (2.1) | |
| Hypertension | 126 (28.9) | 66 (34.2) | |
| Diabetes + Hypertension | 27 (6.2) | 16 (8.3) | |
| Lynch Syndromes | 2 (0.5) | 7 (3.6) | 0.002 |
| Previous breast cancer | 73 (16.7) | 19 (9.8) | 0.024 |
| Previous Tamoxifen therapy | 29 (6.7) | 7 (3.6) | 0.132 |
| Hormonal therapy users | 0.273 | ||
| OC | 27 (6.2) | 6 (3.1) | |
| HRT | 12 (2.8) | 5 (2.6) | |
| Abnormal uterine bleeding | 291 (66.7) | 138 (71.5) | 0.237 |
| Endometrial sampling methods | 0.109 | ||
| HSC-bio | 260 (59.6) | 123 (63.7) | |
| HSC-res | 116 (26.6) | 37 (19.2) | |
| D&C | 60 (13.8) | 33 (17.1) | |
| 10-Fold Cross-Validation and Quadratic Regression | Train | Test | More Discriminating Variables | Explicit Variables | ||||
|---|---|---|---|---|---|---|---|---|
| Variable Number (Number of Tested Combinations) | Mean Sensitivity | Mean Specificity | Mean AUC | Mean Sensitivity | Mean Specificity | Mean AUC | ||
| 2 (120) | 55 | 64.2 | 0.625 (CI 95%: 0.593–0.656) | 50.2 | 64.1 | 0.599 (CI 95%: 0.562–0.637) | 1, 8 | Age, BMI |
| 47.2 | 68.1 | 0.603 (CI 95%: 0.577–0.629) | 46.1 | 68.8 | 0.588 (CI 95%: 0.542–0.633) | 8, 13 | BMI, BC | |
| 40.4 | 70.4 | 0.571 (CI 95%: 0.567–0.575) | 40.9 | 70.5 | 0.576 (CI 95%: 0.538–0.615) | 6, 13 | Hyp, BC | |
| 65.3 | 48.4 | 0.575 (CI 95%: 0.567–0.582) | 64.4 | 48.8 | 0.572 (CI 95%: 0.505–0.639) | 2, 13 | Mp, BC | |
| 44 | 69.7 | 0.596 (CI 95%: 0.559–0.633) | 42.4 | 69.5 | 0.57 (CI 95%: 0.515–0.625) | 8, 15 | BMI, RB | |
| 3 (560) | 62.4 | 61.1 | 0.656 (CI 95%: 0.649–0.663) | 62.1 | 60.5 | 0.643 (CI 95%: 0.593–0.692) | 1, 8, 9 | Age, BMI, Lynch |
| 59 | 61.6 | 0.653 (CI 95%: 0.646–0.659) | 59.5 | 61.4 | 0.625 (CI 95%: 0.578–0.672) | 1, 8, 13 | Age, BMI, BC | |
| 61.5 | 59.6 | 0.643 (CI 95%: 0.637–0.649) | 61.7 | 59 | 0.62 (CI 95%: 0.574–0.666) | 1, 8, 11 | Age, BMI, OC | |
| 53.8 | 64.4 | 0.63 (CI 95%: 0.597–0.664) | 53.5 | 64.8 | 0.62 (CI 95%: 0.559–0.681) | 1, 7, 8 | Age, Dia, BMI | |
| 60.9 | 59.7 | 0.642 (CI 95%: 0.635–0.649) | 60.1 | 58.8 | 0.617 (CI 95%: 0.567–0.668) | 1, 8, 10 | Age, BMI, Tam | |
| 4 (1820) | 61.4 | 62.8 | 0.671 (CI 95%: 0.662–0.68) | 61.1 | 61.7 | 0.655 (CI 95%: 0.571–0.739) | 1, 8, 9, 13 | Age, BMI, Lynch, BC |
| 62.5 | 60.8 | 0.661 (CI 95%: 0.652–0.67) | 61.8 | 60 | 0.649 (CI 95%: 0.56–0.737) | 1, 8, 9, 11 | Age, BMI, Lynch, OC | |
| 62.7 | 60.8 | 0.66 (CI 95%: 0.652–0.669) | 60.5 | 58.8 | 0.643 (CI 95%: 0.567–0.72) | 1, 8, 9, 10 | Age, BMI, Lynch, Tam | |
| 61.7 | 62.2 | 0.666 (CI 95%: 0.658–0.675) | 59.8 | 61.8 | 0.643 (CI 95%: 0.56–0.725) | 1, 8, 9, 15 | Age, BMI, Lynch, RB | |
| 62 | 61.8 | 0.657 (CI 95%: 0.647–0.666) | 60.5 | 60.7 | 0.64 (CI 95%: 0.55–0.731) | 1, 8, 9, 12 | Age, BMI, Lynch, TOS | |
| 5 (4368) | 62.3 | 61.9 | 0.682 (CI 95%: 0.676–0.688) | 60.1 | 61.8 | 0.649 (CI 95%: 0.608–0.691) | 1, 7, 8, 9, 13 | Age, Dia, BMI, Lynch, BC |
| 63 | 61.1 | 0.671 (CI 95%: 0.666–0.676) | 61.5 | 60.1 | 0.642 (CI 95%: 0.597–0.686) | 1, 7, 8, 10, 13 | Age, Dia, BMI, Tam, BC | |
| 62.8 | 62.5 | 0.674 (CI 95%: 0.668–0.68) | 59.2 | 63 | 0.642 (CI 95%: 0.602–0.681) | 1, 8, 9, 10, 13 | Age, BMI, Lynch, Tam, BC | |
| 62.5 | 60.4 | 0.67 (CI 95%: 0.665–0.676) | 61.3 | 60.2 | 0.641 (CI 95%: 0.596–0.686) | 1, 7, 8, 11, 13 | Age, Dia, BMI, OC, BC | |
| 60.7 | 64.8 | 0.672 (CI 95%: 0.665–0.678) | 59 | 63 | 0.639 (CI 95%: 0.587–0.692) | 1, 5, 7, 8, 13 | Age, Bleed, Dia, BMI, BC | |
| 6 (8008) | 59.7 | 66.3 | 0.685 (CI 95%: 0.678–0.691) | 52.4 | 64.2 | 0.638 (CI 95%: 0.572–0.705) | 1, 5, 8, 9, 11, 13 | Age, Bleed, BMI, Lynch, OC, BC |
| 65.2 | 61 | 0.688 (CI 95%: 0.682–0.693) | 61.1 | 59.3 | 0.638 (CI 95%: 0.586–0.69) | 1, 2, 7, 8, 9, 13 | Age, Mp, Dia, BMI, Lynch, BC | |
| 64.3 | 64.6 | 0.69 (CI 95%: 0.683–0.697) | 57.2 | 62.3 | 0.637 (CI 95%: 0.584–0.691) | 1, 6, 8, 9, 13, 14 | Age, Hyp, BMI, Lynch, BC, HB | |
| 62.9 | 61.6 | 0.687 (CI 95%: 0.682–0.692) | 58 | 61.5 | 0.637 (CI 95%: 0.589–0.685) | 1, 7, 8, 9, 11, 13 | Age, Dia, BMI, Lynch, OC, BC | |
| 66.1 | 63.9 | 0.693 (CI 95%: 0.687–0.699) | 59.5 | 64.5 | 0.633 (CI 95%: 0.584–0.682) | 1, 7, 8, 9, 13, 14 | Age, Dia, BMI, Lynch, BC, HB | |
| 7 (11,440) | 68.5 | 60.1 | 0.694 (CI 95%: 0.688–0.701) | 64.2 | 58.8 | 0.653 (CI 95%: 0.592–0.714) | 1, 2, 7, 8, 9, 10, 13 | Age, Mp, Dia, BMI, Lynch, Tam, BC |
| 65.1 | 61.6 | 0.692 (CI 95%: 0.685–0.699) | 62.3 | 58.8 | 0.653 (CI 95%: 0.597–0.709) | 1, 7, 8, 9, 10, 11, 13 | Age, Dia, BMI, Lynch, Tam, OC, BC | |
| 64.2 | 62.5 | 0.693 (CI 95%: 0.687–0.699) | 61.4 | 59.9 | 0.646 (CI 95%: 0.59–0.701) | 1, 7, 8, 9, 10, 12, 13 | Age, Dia, BMI, Lynch, Tam, TOS, BC | |
| 63.8 | 64.3 | 0.694 (CI 95%: 0.687–0.701) | 59.4 | 62.2 | 0.643 (CI 95%: 0.588–0.698) | 1, 5, 7, 8, 9, 10, 13 | Age, Bleed, Dia, BMI, Lynch, Tam, BC | |
| 65.9 | 60.9 | 0.691 (CI 95%: 0.686–0.697) | 60.2 | 59.8 | 0.643 (CI 95%: 0.587–0.699) | 1, 2, 7, 8, 9, 11, 13 | Age, Mp, Dia, BMI, Lynch, OC, BC | |
| 8 (12,870) | 69.8 | 61.7 | 0.711 (CI 95%: 0.705–0.718) | 64.6 | 59 | 0.655 (CI 95%: 0.601–0.709) | 1, 7, 8, 9, 10, 11, 13, 14 | Age, Dia, BMI, Lynch, Tam, OC, BC, HB |
| 69.9 | 63.9 | 0.72 (CI 95%: 0.713–0.727) | 66.8 | 59.7 | 0.654 (CI 95%: 0.599–0.709) | 1, 6, 7, 8, 9, 10, 13, 14 | Age, Hyp, Dia, BMI, Lynch, Tam, BC, HB | |
| 67.8 | 64.4 | 0.715 (CI 95%: 0.709–0.722) | 63.9 | 61.4 | 0.65 (CI 95%: 0.595–0.706) | 1, 6, 7, 8, 9, 11, 13, 14 | Age, Hyp, Dia, BMI, Lynch, OC, BC, HB | |
| 69.2 | 62.7 | 0.709 (CI 95%: 0.703–0.715) | 64.3 | 58.8 | 0.646 (CI 95%: 0.598–0.693) | 1, 7, 8, 9, 10, 12, 13, 14 | Age, Dia, BMI, Lynch, Tam, TOS, BC, HB | |
| 63.9 | 62.5 | 0.698 (CI 95%: 0.69–0.705) | 61.9 | 61 | 0.644 (CI 95%: 0.6–0.688) | 1, 7, 8, 9, 10, 11, 12, 13 | Age, Dia, BMI, Lynch, Tam, OC, TOS, BC | |
| 9 (11,440) | 70.4 | 63 | 0.725 (CI 95%: 0.72–0.73) | 64.1 | 60.1 | 0.655 (CI 95%: 0.606–0.704) | 1, 3, 7, 8, 9, 10, 11, 13, 15 | Age, Preg, Dia, BMI, Lynch, Tam, OC, BC, RB |
| 69.6 | 66.3 | 0.726 (CI 95%: 0.72–0.732) | 63.6 | 63.9 | 0.649 (CI 95%: 0.596–0.702) | 1, 3, 4, 7, 8, 9, 11, 13, 15 | Age, Preg, Smoke, Dia, BMI, Lynch, OC, BC, RB | |
| 69.1 | 62.8 | 0.715 (CI 95%: 0.709–0.72) | 63.9 | 61.2 | 0.646 (CI 95%: 0.588–0.704) | 1, 7, 8, 9, 10, 13, 14, 15, 16 | Age, Dia, BMI, Lynch, Tam, BC, HB, RB, D&C | |
| 70.2 | 63.6 | 0.716 (CI 95%: 0.711–0.722) | 62.3 | 61.6 | 0.645 (CI 95%: 0.59–0.701) | 1, 7, 8, 9, 11, 13, 14, 15, 16 | Age, Dia, BMI, Lynch, OC, BC, HB, RB, D&C | |
| 72.2 | 62.5 | 0.725 (CI 95%: 0.72–0.729) | 64.9 | 59.7 | 0.645 (CI 95%: 0.594–0.696) | 1, 7, 8, 9, 10, 11, 13, 14, 15 | Age, Dia, BMI, Lynch, Tam, OC, BC, HB, RB | |
| 10 (8008) | 67.8 | 68.3 | 0.738 (CI 95%: 0.735–0.742) | 55.6 | 63.5 | 0.627 (CI 95%: 0.585–0.669) | 1, 3, 4, 5, 7, 8, 9, 11, 13, 15 | Age, Preg, Smoke, Bleed, Dia, BMI, Lynch, OC, BC, RB |
| 74.3 | 60.7 | 0.734 (CI 95%: 0.732–0.737) | 67.1 | 57 | 0.626 (CI 95%: 0.594–0.658) | 1, 2, 6, 7, 8, 9, 10, 12, 13, 14 | Age, Mp, Hyp, Dia, BMI, Lynch, Tam, TOS, BC, HB | |
| 69.5 | 64.5 | 0.733 (CI 95%: 0.729–0.736) | 57.1 | 60.2 | 0.626 (CI 95%: 0.574–0.677) | 1, 6, 7, 8, 9, 11, 13, 14, 15, 16 | Age, Hyp, Dia, BMI, Lynch, OC, BC, HB, RB, D&C | |
| 72.5 | 62.3 | 0.733 (CI 95%: 0.732–0.735) | 61.4 | 59.4 | 0.624 (CI 95%: 0.592–0.657) | 1, 6, 7, 8, 9, 10, 11, 12, 13, 15 | Age, Hyp, Dia, BMI, Lynch, Tam, OC, TOS, BC, RB | |
| 69.7 | 63 | 0.718 (CI 95%: 0.715–0.72) | 60.3 | 61 | 0.624 (CI 95%: 0.585–0.662) | 1, 4, 6, 7, 8, 9, 10, 11, 12, 13 | Age, Smoke, Hyp, Dia, BMI, Lynch, Tam, OC, TOS, BC | |
| 11 (4368) | 71.3 | 64.6 | 0.739 (CI 95%: 0.733–0.745) | 64.5 | 59.2 | 0.642 (CI 95%: 0.598–0.686) | 1, 6, 7, 8, 9, 10, 12, 13, 14, 15, 16 | Age, Hyp, Dia, BMI, Lynch, Tam, TOS, BC, HB, RB, D&C |
| 73.5 | 62 | 0.74 (CI 95%: 0.734–0.746) | 64.7 | 56.7 | 0.641 (CI 95%: 0.596–0.687) | 1, 2, 6, 7, 8, 9, 10, 13, 14, 15, 16 | Age, Mp, Hyp, Dia, BMI, Lynch, Tam, BC, HB, RB, D&C | |
| 70.9 | 64.7 | 0.747 (CI 95%: 0.742–0.752) | 63.8 | 57.3 | 0.638 (CI 95%: 0.592–0.685) | 1, 2, 3, 6, 7, 8, 9, 10, 12, 13, 14 | Age, Mp, Preg, Hyp, Dia, BMI, Lynch, Tam, TOS, BC, HB | |
| 70.4 | 65.1 | 0.732 (CI 95%: 0.726–0.737) | 60.6 | 62.3 | 0.634 (CI 95%: 0.577–0.691) | 1, 4, 7, 8, 9, 11, 12, 13, 14, 15, 16 | Age, Smoke, Dia, BMI, Lynch, OC, TOS, BC, HB, RB, D&C | |
| 71.4 | 64.8 | 0.742 (CI 95%: 0.737–0.747) | 60.8 | 58.5 | 0.634 (CI 95%: 0.595–0.673) | 1, 6, 7, 8, 9, 10, 11, 13, 14, 15, 16 | Age, Hyp, Dia, BMI, Lynch, Tam, OC, BC, HB, RB, D&C | |
| 12 (1820) | 76.3 | 60.9 | 0.741 (CI 95%: 0.735–0.747) | 64.7 | 54.8 | 0.607 (CI 95%: 0.544–0.669) | 1, 2, 4, 7, 8, 9, 10, 11, 13, 14, 15, 16 | Age, Mp, Smoke, Dia, BMI, Lynch, Tam, OC, BC, HB, RB, D&C |
| 75.2 | 61.6 | 0.759 (CI 95%: 0.752–0.765) | 63.1 | 53.7 | 0.606 (CI 95%: 0.546–0.666) | 1, 2, 4, 6, 7, 8, 9, 10, 11, 13, 14, 15 | Age, Mp, Smoke, Hyp, Dia, BMI, Lynch, Tam, OC, BC, HB, RB | |
| 75.2 | 61.6 | 0.759 (CI 95%: 0.752–0.765) | 63.1 | 53.7 | 0.606 (CI 95%: 0.545–0.666) | 1, 2, 4, 6, 7, 8, 9, 10, 11, 13, 14, 16 | Age, Mp, Smoke, Hyp, Dia, BMI, Lynch, Tam, OC, BC, HB, D&C | |
| 73.7 | 64.1 | 0.744 (CI 95%: 0.74–0.747) | 59.2 | 59.6 | 0.606 (CI 95%: 0.574–0.637) | 1, 2, 3, 5, 7, 8, 9, 10, 13, 14, 15, 16 | Age, Mp, Preg, Bleed, Dia, BMI, Lynch, Tam, BC, HB, RB, D&C | |
| 72.5 | 65.6 | 0.753 (CI 95%: 0.747–0.758) | 57.8 | 59.1 | 0.605 (CI 95%: 0.563–0.648) | 1, 2, 3, 5, 6, 7, 8, 10, 13, 14, 15, 16 | Age, Mp, Preg, Bleed, Hyp, Dia, BMI, Tam, BC, HB, RB, D&C | |
| 13 (560) | 71.2 | 65.4 | 0.762 (CI 95%: 0.757–0.766) | 59.6 | 59.5 | 0.619 (CI 95%: 0.572–0.667) | 1, 2, 3, 6, 7, 8, 9, 10, 12, 13, 14, 15, 16 | Age, Mp, Preg, Hyp, Dia, BMI, Lynch, Tam, TOS, BC, HB, RB, D&C |
| 72.2 | 64.9 | 0.762 (CI 95%: 0.758–0.765) | 57.3 | 58.8 | 0.614 (CI 95%: 0.572–0.657) | 1, 2, 3, 6, 7, 8, 9, 10, 11, 13, 14, 15, 16 | Age, Mp, Preg, Hyp, Dia, BMI, Lynch, Tam, OC, BC, HB, RB, D&C | |
| 71.2 | 66.4 | 0.756 (CI 95%: 0.751–0.761) | 57.1 | 61.1 | 0.613 (CI 95%: 0.567–0.66) | 1, 3, 4, 5, 7, 8, 9, 11, 12, 13, 14, 15, 16 | Age, Preg, Smoke, Bleed, Dia, BMI, Lynch, OC, TOS, BC, HB, RB, D&C | |
| 71.5 | 65.1 | 0.759 (CI 95%: 0.755–0.762) | 58.6 | 58.8 | 0.613 (CI 95%: 0.576–0.649) | 1, 3, 6, 7, 8, 9, 10, 11, 12, 13, 14, 15, 16 | Age, Preg, Hyp, Dia, BMI, Lynch, Tam, OC, TOS, BC, HB, RB, D&C | |
| 75.2 | 61.8 | 0.759 (CI 95%: 0.755–0.763) | 62.9 | 54.6 | 0.612 (CI 95%: 0.55–0.675) | 1, 2, 4, 6, 7, 8, 9, 10, 11, 13, 14, 15, 16 | Age, Mp, Smoke, Hyp, Dia, BMI, Lynch, Tam, OC, BC, HB, RB, D&C | |
| 14 (120) | 73.5 | 66.7 | 0.776 (CI 95%: 0.77–0.782) | 56.6 | 60.1 | 0.621 (CI 95%: 0.559–0.683) | 1, 2, 3, 4, 5, 6, 7, 8, 9, 11, 13, 14, 15, 16 | Age, Mp, Preg, Smoke, Bleed, Hyp, Dia, BMI, Lynch, OC, BC, HB, RB, D&C |
| 73.8 | 66.7 | 0.775 (CI 95%: 0.768–0.782) | 55 | 60.5 | 0.62 (CI 95%: 0.569–0.671) | 1, 2, 3, 5, 6, 7, 8, 9, 10, 11, 13, 14, 15, 16 | Age, Mp, Preg, Bleed, Hyp, Dia, BMI, Lynch, Tam, OC, BC, HB, RB, D&C | |
| 73.6 | 67.3 | 0.777 (CI 95%: 0.769–0.784) | 53.8 | 60.8 | 0.62 (CI 95%: 0.56–0.679) | 1, 2, 3, 4, 5, 6, 7, 8, 9, 10, 13, 14, 15, 16 | Age, Mp, Preg, Smoke, Bleed, Hyp, Dia, BMI, Lynch, Tam, BC, HB, RB, D&C | |
| 72.8 | 66.4 | 0.766 (CI 95%: 0.761–0.772) | 58.4 | 59.2 | 0.615 (CI 95%: 0.557–0.673) | 1, 3, 4, 5, 7, 8, 9, 10, 11, 12, 13, 14, 15, 16 | Age, Preg, Smoke, Bleed, Dia, BMI, Lynch, Tam, OC, TOS, BC, HB, RB, D&C | |
| 74.3 | 67.2 | 0.774 (CI 95%: 0.768–0.781) | 56.7 | 61 | 0.614 (CI 95%: 0.558–0.67) | 1, 2, 3, 5, 6, 7, 8, 9, 10, 12, 13, 14, 15, 16 | Age, Mp, Preg, Bleed, Hyp, Dia, BMI, Lynch, Tam, TOS, BC, HB, RB, D&C | |
| 15 (16) | 74.7 | 67.1 | 0.783 (CI 95%: 0.777–0.79) | 57.1 | 57.3 | 0.59 (CI 95%: 0.54–0.641) | 1, 2, 3, 5, 6, 7, 8, 9, 10, 11, 12, 13, 14, 15, 16 | Age, Mp, Preg, Bleed, Hyp, Dia, BMI, Lynch, Tam, OC, TOS, BC, HB, RB, D&C |
| 74.6 | 66.4 | 0.788 (CI 95%: 0.781–0.794) | 57.9 | 53.9 | 0.588 (CI 95%: 0.538–0.638) | 1, 2, 3, 4, 5, 6, 7, 8, 9, 10, 11, 13, 14, 15, 16 | Age, Mp, Preg, Smoke, Bleed, Hyp, Dia, BMI, Lynch, Tam, OC, BC, HB, RB, D&C | |
| 74.6 | 68.3 | 0.787 (CI 95%: 0.78–0.794) | 59.5 | 56.4 | 0.588 (CI 95%: 0.532–0.644) | 1, 2, 3, 4, 5, 6, 7, 8, 9, 10, 12, 13, 14, 15, 16 | Age, Mp, Preg, Smoke, Bleed, Hyp, Dia, BMI, Lynch, Tam, TOS, BC, HB, RB, D&C | |
| 74.9 | 67.6 | 0.786 (CI 95%: 0.781–0.791) | 56.9 | 55.1 | 0.587 (CI 95%: 0.538–0.635) | 1, 2, 3, 4, 5, 6, 7, 8, 9, 11, 12, 13, 14, 15, 16 | Age, Mp, Preg, Smoke, Bleed, Hyp, Dia, BMI, Lynch, OC, TOS, BC, HB, RB, D&C | |
| 76.3 | 65.1 | 0.785 (CI 95%: 0.779–0.792) | 60.6 | 53 | 0.584 (CI 95%: 0.54–0.629) | 1, 2, 3, 4, 5, 6, 7, 8, 10, 11, 12, 13, 14, 15, 16 | Age, Mp, Preg, Smoke, Bleed, Hyp, Dia, BMI, Tam, OC, TOS, BC, HB, RB, D&C | |
| 10-Fold Cross-Validation and 3*N Patternnet ANN | Train | Test | More Discriminating Variables | Explicit Variables | ||||
|---|---|---|---|---|---|---|---|---|
| Variable Number (Number of Tested Combinations) | Mean Sensitivity | Mean Specificity | Mean AUC | Mean Sensitivity | Mean Specificity | Mean AUC | ||
| 2 (120) | 52.9 | 65.3 | 0.636 (CI 95%: 0.626–0.646) | 50.3 | 63.8 | 0.629 (CI 95%: 0.56–0.698) | 1, 8 | Age, BMI |
| 49.6 | 66.1 | 0.616 (CI 95%: 0.609–0.623) | 50.3 | 65.9 | 0.613 (CI 95%: 0.544–0.682) | 1, 14 | Age, HB | |
| 50.1 | 66.5 | 0.618 (CI 95%: 0.61–0.626) | 49.4 | 66.1 | 0.61 (CI 95%: 0.546–0.674) | 1, 9 | Age, Lynch | |
| 53.8 | 61.9 | 0.613 (CI 95%: 0.608–0.618) | 52.1 | 61.9 | 0.61 (CI 95%: 0.562–0.657) | 8, 13 | BMI, BC | |
| 63.5 | 53.2 | 0.618 (CI 95%: 0.61–0.626) | 61.9 | 52.2 | 0.606 (CI 95%: 0.56–0.652) | 8, 15 | BMI, RB | |
| 3 (560) | 66.4 | 53.7 | 0.64 (CI 95%: 0.616–0.664) | 67.6 | 55.4 | 0.658 (CI 95%: 0.598–0.718) | 2, 8, 14 | Mp, BMI, HB |
| 60.7 | 61.4 | 0.647 (CI 95%: 0.636–0.659) | 65.2 | 59.1 | 0.657 (CI 95%: 0.598–0.717) | 1, 8, 9 | Age, BMI, Lynch | |
| 60.3 | 62 | 0.651 (CI 95%: 0.634–0.667) | 62.9 | 62 | 0.648 (CI 95%: 0.571–0.726) | 1, 8, 13 | Age, BMI, BC | |
| 50.8 | 67.5 | 0.641 (CI 95%: 0.631–0.65) | 53 | 67 | 0.646 (CI 95%: 0.576–0.716) | 1, 3, 8 | Age, Preg, BMI | |
| 60.2 | 62.5 | 0.641 (CI 95%: 0.627–0.656) | 59.3 | 61.5 | 0.644 (CI 95%: 0.566–0.722) | 1, 8, 15 | Age, BMI, RB | |
| 4 (1820) | 63.3 | 66 | 0.683 (CI 95%: 0.67–0.697) | 65.8 | 66.5 | 0.691 (CI 95%: 0.657–0.725) | 1, 8, 9, 14 | Age, BMI, Lynch, HB |
| 68.1 | 61.6 | 0.689 (CI 95%: 0.683–0.694) | 67.4 | 60 | 0.688 (CI 95%: 0.653–0.722) | 1, 5, 8, 14 | Age, Bleed, BMI, HB | |
| 62.7 | 62.4 | 0.671 (CI 95%: 0.666–0.677) | 63.1 | 62.2 | 0.671 (CI 95%: 0.646–0.697) | 1, 8, 9, 15 | Age, BMI, Lynch, RB | |
| 67.8 | 59.2 | 0.674 (CI 95%: 0.659–0.69) | 66.3 | 62.8 | 0.668 (CI 95%: 0.617–0.72) | 1, 2, 8, 14 | Age, Mp, BMI, HB | |
| 63.6 | 59.4 | 0.658 (CI 95%: 0.654–0.663) | 64.5 | 59.6 | 0.666 (CI 95%: 0.626–0.706) | 1, 3, 8, 9 | Age, Preg, BMI, Lynch | |
| 5 (4368) | 65.8 | 65 | 0.695 (CI 95%: 0.689–0.702) | 67.8 | 63.4 | 0.702 (CI 95%: 0.656–0.749) | 1, 2, 8, 13, 14 | Age, Mp, BMI, BC, HB |
| 63.6 | 63.5 | 0.692 (CI 95%: 0.688–0.697) | 66 | 63.6 | 0.701 (CI 95%: 0.665–0.737) | 1, 8, 9, 13, 15 | Age, BMI, Lynch, BC, RB | |
| 63.9 | 63.6 | 0.682 (CI 95%: 0.675–0.689) | 61.4 | 63.9 | 0.688 (CI 95%: 0.648–0.729) | 1, 2, 8, 9, 14 | Age, Mp, BMI, Lynch, HB | |
| 63.2 | 62.5 | 0.668 (CI 95%: 0.659–0.678) | 65.7 | 60.6 | 0.688 (CI 95%: 0.619–0.756) | 1, 2, 6, 8, 14 | Age, Mp, Hyp, BMI, HB | |
| 65.4 | 61.7 | 0.683 (CI 95%: 0.675–0.69) | 67.4 | 61.3 | 0.687 (CI 95%: 0.636–0.737) | 1, 8, 9, 12, 14 | Age, BMI, Lynch, TOS, HB | |
| 6 (8008) | 68.4 | 60.8 | 0.705 (CI 95%: 0.7–0.711) | 67.8 | 60.3 | 0.702 (CI 95%: 0.653–0.751) | 1, 6, 7, 8, 14, 16 | Age, Hyp, Dia, BMI, HB, D&C |
| 66.2 | 66.7 | 0.708 (CI 95%: 0.702–0.714) | 64.8 | 66.4 | 0.696 (CI 95%: 0.64–0.752) | 1, 7, 8, 9, 11, 14 | Age, Dia, BMI, Lynch, OC, HB | |
| 68.6 | 63.9 | 0.708 (CI 95%: 0.698–0.718) | 67.4 | 63.5 | 0.694 (CI 95%: 0.609–0.779) | 1, 2, 7, 8, 9, 14 | Age, Mp, Dia, BMI, Lynch, HB | |
| 67.1 | 61.5 | 0.699 (CI 95%: 0.693–0.704) | 65.8 | 61.1 | 0.693 (CI 95%: 0.643–0.744) | 1, 5, 8, 9, 11, 15 | Age, Bleed, BMI, Lynch, OC, RB | |
| 72.6 | 62.6 | 0.716 (CI 95%: 0.701–0.731) | 67.2 | 62.6 | 0.693 (CI 95%: 0.633–0.753) | 1, 2, 8, 9, 13, 14 | Age, Mp, BMI, Lynch, BC, HB | |
| 7 (11,440) | 69.9 | 62.5 | 0.707 (CI 95%: 0.687–0.728) | 70.3 | 62 | 0.71 (CI 95%: 0.667–0.753) | 1, 8, 9, 11, 13, 15, 16 | Age, BMI, Lynch, OC, BC, RB, D&C |
| 66.4 | 67.1 | 0.717 (CI 95%: 0.712–0.722) | 66 | 67.5 | 0.709 (CI 95%: 0.655–0.764) | 1, 2, 3, 4, 6, 8, 14 | Age, Mp, Preg, Smoke, Hyp, BMI, HB | |
| 66 | 63.5 | 0.7 (CI 95%: 0.692–0.708) | 68 | 64.7 | 0.705 (CI 95%: 0.667–0.744) | 1, 3, 7, 8, 9, 13, 14 | Age, Preg, Dia, BMI, Lynch, BC, HB | |
| 60.3 | 68.5 | 0.699 (CI 95%: 0.696–0.702) | 59.7 | 68.8 | 0.703 (CI 95%: 0.677–0.728) | 1, 3, 5, 6, 8, 9, 13 | Age, Preg, Bleed, Hyp, BMI, Lynch, BC | |
| 67.1 | 61.2 | 0.707 (CI 95%: 0.694–0.721) | 65.1 | 62.2 | 0.701 (CI 95%: 0.648–0.755) | 1, 6, 8, 9, 10, 13, 15 | Age, Hyp, BMI, Lynch, Tam, BC, RB | |
| 8 (12,870) | 67.1 | 67.2 | 0.738 (CI 95%: 0.696–0.781) | 66.5 | 65.3 | 0.736 (CI 95%: 0.643–0.828) | 1, 2, 6, 7, 8, 9, 10, 14 | Age, Mp, Hyp, Dia, BMI, Lynch, Tam, HB |
| 67 | 65.5 | 0.733 (CI 95%: 0.728–0.739) | 67.5 | 66.3 | 0.731 (CI 95%: 0.677–0.786) | 1, 2, 4, 6, 8, 13, 14, 16 | Age, Mp, Smoke, Hyp, BMI, BC, HB, D&C | |
| 70.9 | 63.6 | 0.733 (CI 95%: 0.726–0.74) | 70.1 | 63.5 | 0.729 (CI 95%: 0.662–0.797) | 1, 2, 5, 6, 8, 9, 10, 14 | Age, Mp, Bleed, Hyp, BMI, Lynch, Tam, HB | |
| 68.2 | 63.8 | 0.721 (CI 95%: 0.716–0.726) | 67.5 | 64.8 | 0.72 (CI 95%: 0.67–0.771) | 1, 4, 6, 7, 8, 9, 13, 15 | Age, Smoke, Hyp, Dia, BMI, Lynch, BC, RB | |
| 72.8 | 60.6 | 0.717 (CI 95%: 0.713–0.721) | 71.3 | 60.1 | 0.719 (CI 95%: 0.675–0.763) | 1, 5, 8, 9, 10, 12, 15, 16 | Age, Bleed, BMI, Lynch, Tam, TOS, RB, D&C | |
| 9 (11,440) | 69.1 | 66.2 | 0.731 (CI 95%: 0.727–0.735) | 67.5 | 67.5 | 0.722 (CI 95%: 0.672–0.773) | 1, 5, 6, 7, 8, 9, 12, 13, 15 | Age, Bleed, Hyp, Dia, BMI, Lynch, TOS, BC, RB |
| 66.8 | 67.1 | 0.741 (CI 95%: 0.735–0.746) | 63.9 | 68.2 | 0.721 (CI 95%: 0.65–0.793) | 1, 3, 6, 8, 9, 10, 13, 15, 16 | Age, Preg, Hyp, BMI, Lynch, Tam, BC, RB, D&C | |
| 68.7 | 66.1 | 0.732 (CI 95%: 0.727–0.737) | 67.4 | 66.8 | 0.72 (CI 95%: 0.663–0.778) | 1, 3, 4, 5, 6, 7, 8, 9, 14 | Age, Preg, Smoke, Bleed, Hyp, Dia, BMI, Lynch, HB | |
| 66.2 | 62.4 | 0.721 (CI 95%: 0.718–0.725) | 66.1 | 62.7 | 0.72 (CI 95%: 0.677–0.763) | 1, 3, 6, 7, 8, 10, 11, 14, 16 | Age, Preg, Hyp, Dia, BMI, Tam, OC, HB, D&C | |
| 71.8 | 62.1 | 0.729 (CI 95%: 0.711–0.747) | 73.6 | 61 | 0.717 (CI 95%: 0.651–0.783) | 2, 4, 5, 6, 7, 8, 10, 14, 15 | Mp, Smoke, Bleed, Hyp, Dia, BMI, Tam, HB, RB | |
| 10 (8008) | 69.2 | 67 | 0.754 (CI 95%: 0.747–0.761) | 68.4 | 67.1 | 0.752 (CI 95%: 0.681–0.824) | 1, 4, 6, 7, 8, 9, 12, 13, 14, 15 | Age, Smoke, Hyp, Dia, BMI, Lynch, TOS, BC, HB, RB |
| 68.5 | 66.3 | 0.743 (CI 95%: 0.739–0.748) | 69.6 | 65.1 | 0.749 (CI 95%: 0.709–0.789) | 1, 4, 6, 7, 8, 10, 11, 13, 14, 16 | Age, Smoke, Hyp, Dia, BMI, Tam, OC, BC, HB, D&C | |
| 70.9 | 66.3 | 0.753 (CI 95%: 0.74–0.765) | 72.6 | 65.2 | 0.745 (CI 95%: 0.686–0.804) | 1, 3, 5, 6, 8, 9, 10, 11, 12, 14 | Age, Preg, Bleed, Hyp, BMI, Lynch, Tam, OC, TOS, HB | |
| 75.5 | 58.5 | 0.736 (CI 95%: 0.732–0.741) | 76 | 58.8 | 0.738 (CI 95%: 0.685–0.791) | 1, 3, 5, 7, 8, 9, 11, 13, 14, 15 | Age, Preg, Bleed, Dia, BMI, Lynch, OC, BC, HB, RB | |
| 67.2 | 65.8 | 0.74 (CI 95%: 0.734–0.745) | 66 | 66.7 | 0.735 (CI 95%: 0.671–0.798) | 1, 6, 7, 8, 9, 11, 12, 13, 14, 15 | Age, Hyp, Dia, BMI, Lynch, OC, TOS, BC, HB, RB | |
| 11 (4368) | 68.9 | 64.9 | 0.749 (CI 95%: 0.744–0.754) | 68.3 | 65.7 | 0.752 (CI 95%: 0.7–0.805) | 1, 3, 4, 5, 6, 8, 9, 11, 13, 15, 16 | Age, Preg, Smoke, Bleed, Hyp, BMI, Lynch, OC, BC, RB, D&C |
| 72.5 | 64.6 | 0.756 (CI 95%: 0.752–0.76) | 71.6 | 65.7 | 0.75 (CI 95%: 0.703–0.797) | 1, 3, 4, 5, 6, 7, 8, 10, 11, 12, 14 | Age, Preg, Smoke, Bleed, Hyp, Dia, BMI, Tam, OC, TOS, HB | |
| 71.5 | 64.6 | 0.74 (CI 95%: 0.73–0.75) | 69.6 | 64.1 | 0.744 (CI 95%: 0.667–0.82) | 1, 4, 5, 6, 7, 8, 9, 11, 13, 14, 16 | Age, Smoke, Bleed, Hyp, Dia, BMI, Lynch, OC, BC, HB, D&C | |
| 67.2 | 67.5 | 0.746 (CI 95%: 0.738–0.753) | 65.3 | 67.9 | 0.742 (CI 95%: 0.678–0.807) | 1, 3, 6, 7, 8, 9, 10, 12, 13, 14, 15 | Age, Preg, Hyp, Dia, BMI, Lynch, Tam, TOS, BC, HB, RB | |
| 75.1 | 59.7 | 0.748 (CI 95%: 0.744–0.753) | 73.8 | 58.5 | 0.74 (CI 95%: 0.684–0.796) | 1, 2, 4, 6, 7, 8, 11, 12, 14, 15, 16 | Age, Mp, Smoke, Hyp, Dia, BMI, OC, TOS, HB, RB, D&C | |
| 12 (1820) | 67.1 | 68.6 | 0.753 (CI 95%: 0.747–0.758) | 68.1 | 68.9 | 0.76 (CI 95%: 0.706–0.814) | 1, 3, 4, 5, 6, 7, 8, 9, 12, 13, 15, 16 | Age, Preg, Smoke, Bleed, Hyp, Dia, BMI, Lynch, TOS, BC, RB, D&C |
| 73.3 | 66.2 | 0.755 (CI 95%: 0.747–0.764) | 72.6 | 65.8 | 0.754 (CI 95%: 0.681–0.826) | 1, 2, 3, 4, 5, 6, 7, 8, 10, 13, 14, 16 | Age, Mp, Preg, Smoke, Bleed, Hyp, Dia, BMI, Tam, BC, HB, D&C | |
| 68.4 | 67.5 | 0.751 (CI 95%: 0.744–0.758) | 68.4 | 66.9 | 0.753 (CI 95%: 0.695–0.812) | 1, 2, 3, 4, 6, 7, 8, 9, 11, 12, 15, 16 | Age, Mp, Preg, Smoke, Hyp, Dia, BMI, Lynch, OC, TOS, RB, D&C | |
| 64.4 | 69.4 | 0.747 (CI 95%: 0.74–0.754) | 67.4 | 69.8 | 0.753 (CI 95%: 0.701–0.805) | 1, 2, 3, 4, 5, 6, 8, 9, 10, 13, 14, 15 | Age, Mp, Preg, Smoke, Bleed, Hyp, BMI, Lynch, Tam, BC, HB, RB | |
| 73.4 | 61.6 | 0.741 (CI 95%: 0.735–0.747) | 73.2 | 60.8 | 0.748 (CI 95%: 0.689–0.808) | 1, 2, 3, 4, 6, 7, 8, 9, 11, 14, 15, 16 | Age, Mp, Preg, Smoke, Hyp, Dia, BMI, Lynch, OC, HB, RB, D&C | |
| 13 (560) | 73.2 | 66.2 | 0.765 (CI 95%: 0.76–0.771) | 71.7 | 65.5 | 0.756 (CI 95%: 0.707–0.805) | 1, 5, 6, 7, 8, 9, 10, 11, 12, 13, 14, 15, 16 | Age, Bleed, Hyp, Dia, BMI, Lynch, Tam, OC, TOS, BC, HB, RB, D&C |
| 73.3 | 60.2 | 0.739 (CI 95%: 0.729–0.748) | 75.4 | 60.8 | 0.742 (CI 95%: 0.669–0.816) | 1, 2, 3, 4, 6, 7, 8, 9, 10, 11, 13, 14, 15 | Age, Mp, Preg, Smoke, Hyp, Dia, BMI, Lynch, Tam, OC, BC, HB, RB | |
| 72.2 | 65.9 | 0.749 (CI 95%: 0.743–0.755) | 72.2 | 64.2 | 0.741 (CI 95%: 0.68–0.802) | 1, 2, 3, 4, 5, 6, 7, 8, 9, 13, 14, 15, 16 | Age, Mp, Preg, Smoke, Bleed, Hyp, Dia, BMI, Lynch, BC, HB, RB, D&C | |
| 71.2 | 65 | 0.746 (CI 95%: 0.732–0.761) | 69.5 | 63.8 | 0.738 (CI 95%: 0.639–0.837) | 1, 2, 3, 4, 5, 6, 7, 8, 10, 13, 14, 15, 16 | Age, Mp, Preg, Smoke, Bleed, Hyp, Dia, BMI, Tam, BC, HB, RB, D&C | |
| 70.7 | 66 | 0.74 (CI 95%: 0.73–0.749) | 72.3 | 66.2 | 0.737 (CI 95%: 0.657–0.817) | 1, 2, 3, 4, 6, 7, 8, 9, 11, 12, 13, 14, 15 | Age, Mp, Preg, Smoke, Hyp, Dia, BMI, Lynch, OC, TOS, BC, HB, RB | |
| 14 (120) | 67.8 | 66.1 | 0.73 (CI 95%: 0.727–0.733) | 68.5 | 65.1 | 0.739 (CI 95%: 0.71–0.767) | 1, 2, 3, 4, 6, 7, 8, 9, 11, 12, 13, 14, 15, 16 | Age, Mp, Preg, Smoke, Hyp, Dia, BMI, Lynch, OC, TOS, BC, HB, RB, D&C |
| 75.4 | 62.1 | 0.737 (CI 95%: 0.703–0.77) | 72 | 62.6 | 0.727 (CI 95%: 0.649–0.804) | 1, 2, 3, 4, 5, 6, 8, 9, 10, 11, 12, 14, 15, 16 | Age, Mp, Preg, Smoke, Bleed, Hyp, BMI, Lynch, Tam, OC, TOS, HB, RB, D&C | |
| 72.3 | 62.3 | 0.738 (CI 95%: 0.734–0.742) | 71.5 | 63.6 | 0.726 (CI 95%: 0.681–0.77) | 1, 3, 4, 5, 6, 7, 8, 9, 10, 12, 13, 14, 15, 16 | Age, Preg, Smoke, Bleed, Hyp, Dia, BMI, Lynch, Tam, TOS, BC, HB, RB, D&C | |
| 65.9 | 67.2 | 0.724 (CI 95%: 0.718–0.73) | 65.9 | 66.7 | 0.723 (CI 95%: 0.661–0.786) | 1, 2, 3, 4, 5, 6, 7, 8, 9, 10, 11, 12, 14, 16 | Age, Mp, Preg, Smoke, Bleed, Hyp, Dia, BMI, Lynch, Tam, OC, TOS, HB, D&C | |
| 67.3 | 66.7 | 0.72 (CI 95%: 0.715–0.724) | 65.2 | 67.3 | 0.722 (CI 95%: 0.684–0.76) | 1, 2, 3, 4, 5, 6, 7, 8, 10, 11, 13, 14, 15, 16 | Age, Mp, Preg, Smoke, Bleed, Hyp, Dia, BMI, Tam, OC, BC, HB, RB, D&C | |
| 15 (16) | 70.3 | 68 | 0.753 (CI 95%: 0.741–0.766) | 70.4 | 67.7 | 0.743 (CI 95%: 0.642–0.844) | 1, 2, 3, 4, 5, 6, 7, 8, 9, 10, 11, 12, 13, 14, 15 | Age, Mp, Preg, Smoke, Bleed, Hyp, Dia, BMI, Lynch, Tam, OC, TOS, BC, HB, RB |
| 68.5 | 66.1 | 0.728 (CI 95%: 0.714–0.742) | 66.4 | 64.9 | 0.713 (CI 95%: 0.629–0.796) | 1, 2, 3, 4, 5, 6, 7, 8, 9, 11, 12, 13, 14, 15, 16 | Age, Mp, Preg, Smoke, Bleed, Hyp, Dia, BMI, Lynch, OC, TOS, BC, HB, RB, D&C | |
| 64.2 | 66 | 0.711 (CI 95%: 0.696–0.725) | 65.9 | 65.9 | 0.708 (CI 95%: 0.629–0.786) | 1, 2, 3, 4, 6, 7, 8, 9, 10, 11, 12, 13, 14, 15, 16 | Age, Mp, Preg, Smoke, Hyp, Dia, BMI, Lynch, Tam, OC, TOS, BC, HB, RB, D&C | |
| 69.1 | 62.4 | 0.699 (CI 95%: 0.694–0.704) | 70.1 | 62 | 0.705 (CI 95%: 0.63–0.779) | 1, 2, 3, 4, 5, 6, 8, 9, 10, 11, 12, 13, 14, 15, 16 | Age, Mp, Preg, Smoke, Bleed, Hyp, BMI, Lynch, Tam, OC, TOS, BC, HB, RB, D&C | |
| 66 | 64.8 | 0.729 (CI 95%: 0.719–0.739) | 62.6 | 63.1 | 0.703 (CI 95%: 0.61–0.795) | 1, 2, 3, 4, 5, 6, 7, 8, 9, 10, 11, 13, 14, 15, 16 | Age, Mp, Preg, Smoke, Bleed, Hyp, Dia, BMI, Lynch, Tam, OC, BC, HB, RB, D&C | |
| Independent Variables | High-Risk Disease (26) n (%) | No High-Risk Disease (167) n (%) | p Value |
|---|---|---|---|
| Age (median and interquartile ranges) | 64 (55.0–71.0) | 58 (52.0–68.8) | 0.313 |
| Body Mass Index (median and interquartile ranges) | 31 (26.0–34.0) | 29 (25.0–35.0) | 0.453 |
| Comorbidity | 0.337 | ||
| Diabetes | 1 (3.8) | 3 (1.8) | |
| Hypertension | 10 (38.5) | 56 (33.5) | |
| Diabetes + Hypertension | 4 (15.4) | 12 (7.2) | |
| Lynch Syndromes | 1 (3.8) | 6 (3.6) | 0.948 |
| Previous breast cancer | 3 (11.5) | 16 (9.6) | 0.755 |
Disclaimer/Publisher’s Note: The statements, opinions and data contained in all publications are solely those of the individual author(s) and contributor(s) and not of MDPI and/or the editor(s). MDPI and/or the editor(s) disclaim responsibility for any injury to people or property resulting from any ideas, methods, instructions or products referred to in the content. |
© 2023 by the authors. Licensee MDPI, Basel, Switzerland. This article is an open access article distributed under the terms and conditions of the Creative Commons Attribution (CC BY) license (https://creativecommons.org/licenses/by/4.0/).
Share and Cite
Giannella, L.; Piva, F.; Delli Carpini, G.; Di Giuseppe, J.; Grelloni, C.; Giulietti, M.; Sopracordevole, F.; Giorda, G.; Del Fabro, A.; Clemente, N.; et al. Concurrent Endometrial Cancer in Women with Atypical Endometrial Hyperplasia: What Is the Predictive Value of Patient Characteristics? Cancers 2024, 16, 172. https://doi.org/10.3390/cancers16010172
Giannella L, Piva F, Delli Carpini G, Di Giuseppe J, Grelloni C, Giulietti M, Sopracordevole F, Giorda G, Del Fabro A, Clemente N, et al. Concurrent Endometrial Cancer in Women with Atypical Endometrial Hyperplasia: What Is the Predictive Value of Patient Characteristics? Cancers. 2024; 16(1):172. https://doi.org/10.3390/cancers16010172
Chicago/Turabian StyleGiannella, Luca, Francesco Piva, Giovanni Delli Carpini, Jacopo Di Giuseppe, Camilla Grelloni, Matteo Giulietti, Francesco Sopracordevole, Giorgio Giorda, Anna Del Fabro, Nicolò Clemente, and et al. 2024. "Concurrent Endometrial Cancer in Women with Atypical Endometrial Hyperplasia: What Is the Predictive Value of Patient Characteristics?" Cancers 16, no. 1: 172. https://doi.org/10.3390/cancers16010172
APA StyleGiannella, L., Piva, F., Delli Carpini, G., Di Giuseppe, J., Grelloni, C., Giulietti, M., Sopracordevole, F., Giorda, G., Del Fabro, A., Clemente, N., Gardella, B., Bogani, G., Brasile, O., Martinello, R., Caretto, M., Ghelardi, A., Albanesi, G., Stevenazzi, G., Venturini, P., ... Ciavattini, A. (2024). Concurrent Endometrial Cancer in Women with Atypical Endometrial Hyperplasia: What Is the Predictive Value of Patient Characteristics? Cancers, 16(1), 172. https://doi.org/10.3390/cancers16010172