The Impact of Acute Systemic Inflammation Secondary to Oesophagectomy and Anastomotic Leak on Computed Tomography Body Composition Analyses
Abstract
Simple Summary
Abstract
1. Introduction
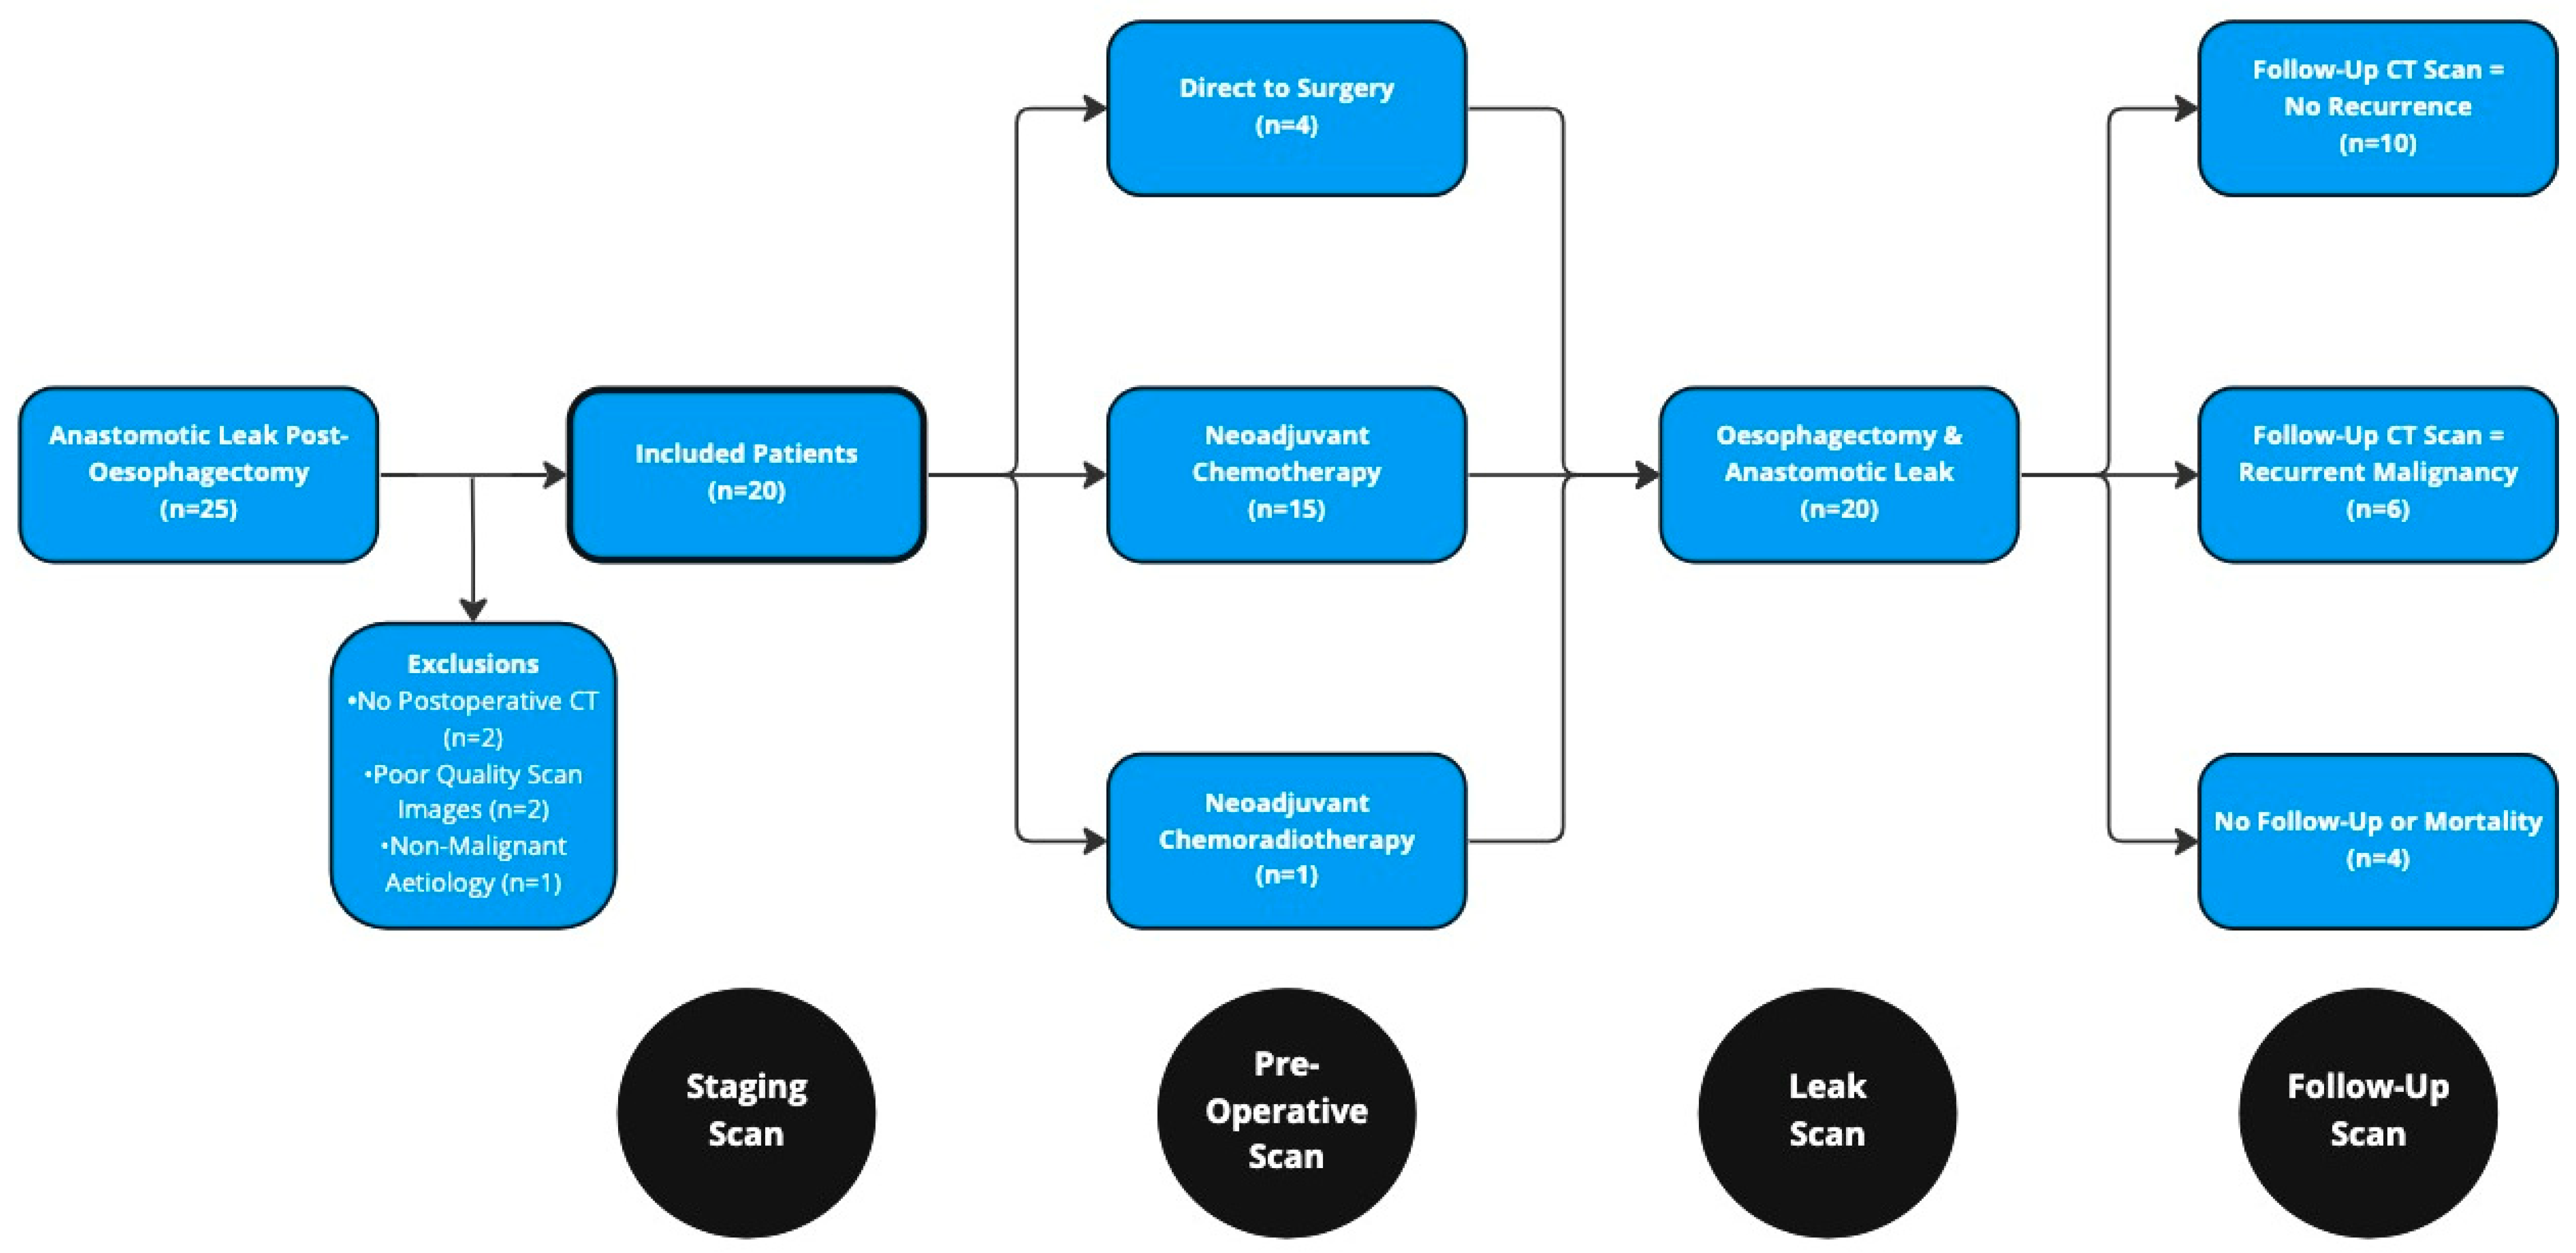
2. Materials and Methods
2.1. Staging and Treatment Protocols
2.2. Anastomotic Leak Definition
- Type I: Localised defect requiring no altered therapy/treated medically or with dietary modification only.
- Type II: Localised defect requiring interventional but not surgical therapy, for example, interventional radiology drain, stent or bedside opening, and packing of incision.
- Type III: Localised defect requiring surgical therapy.
2.3. Other Definitions
2.4. Systemic Inflammation
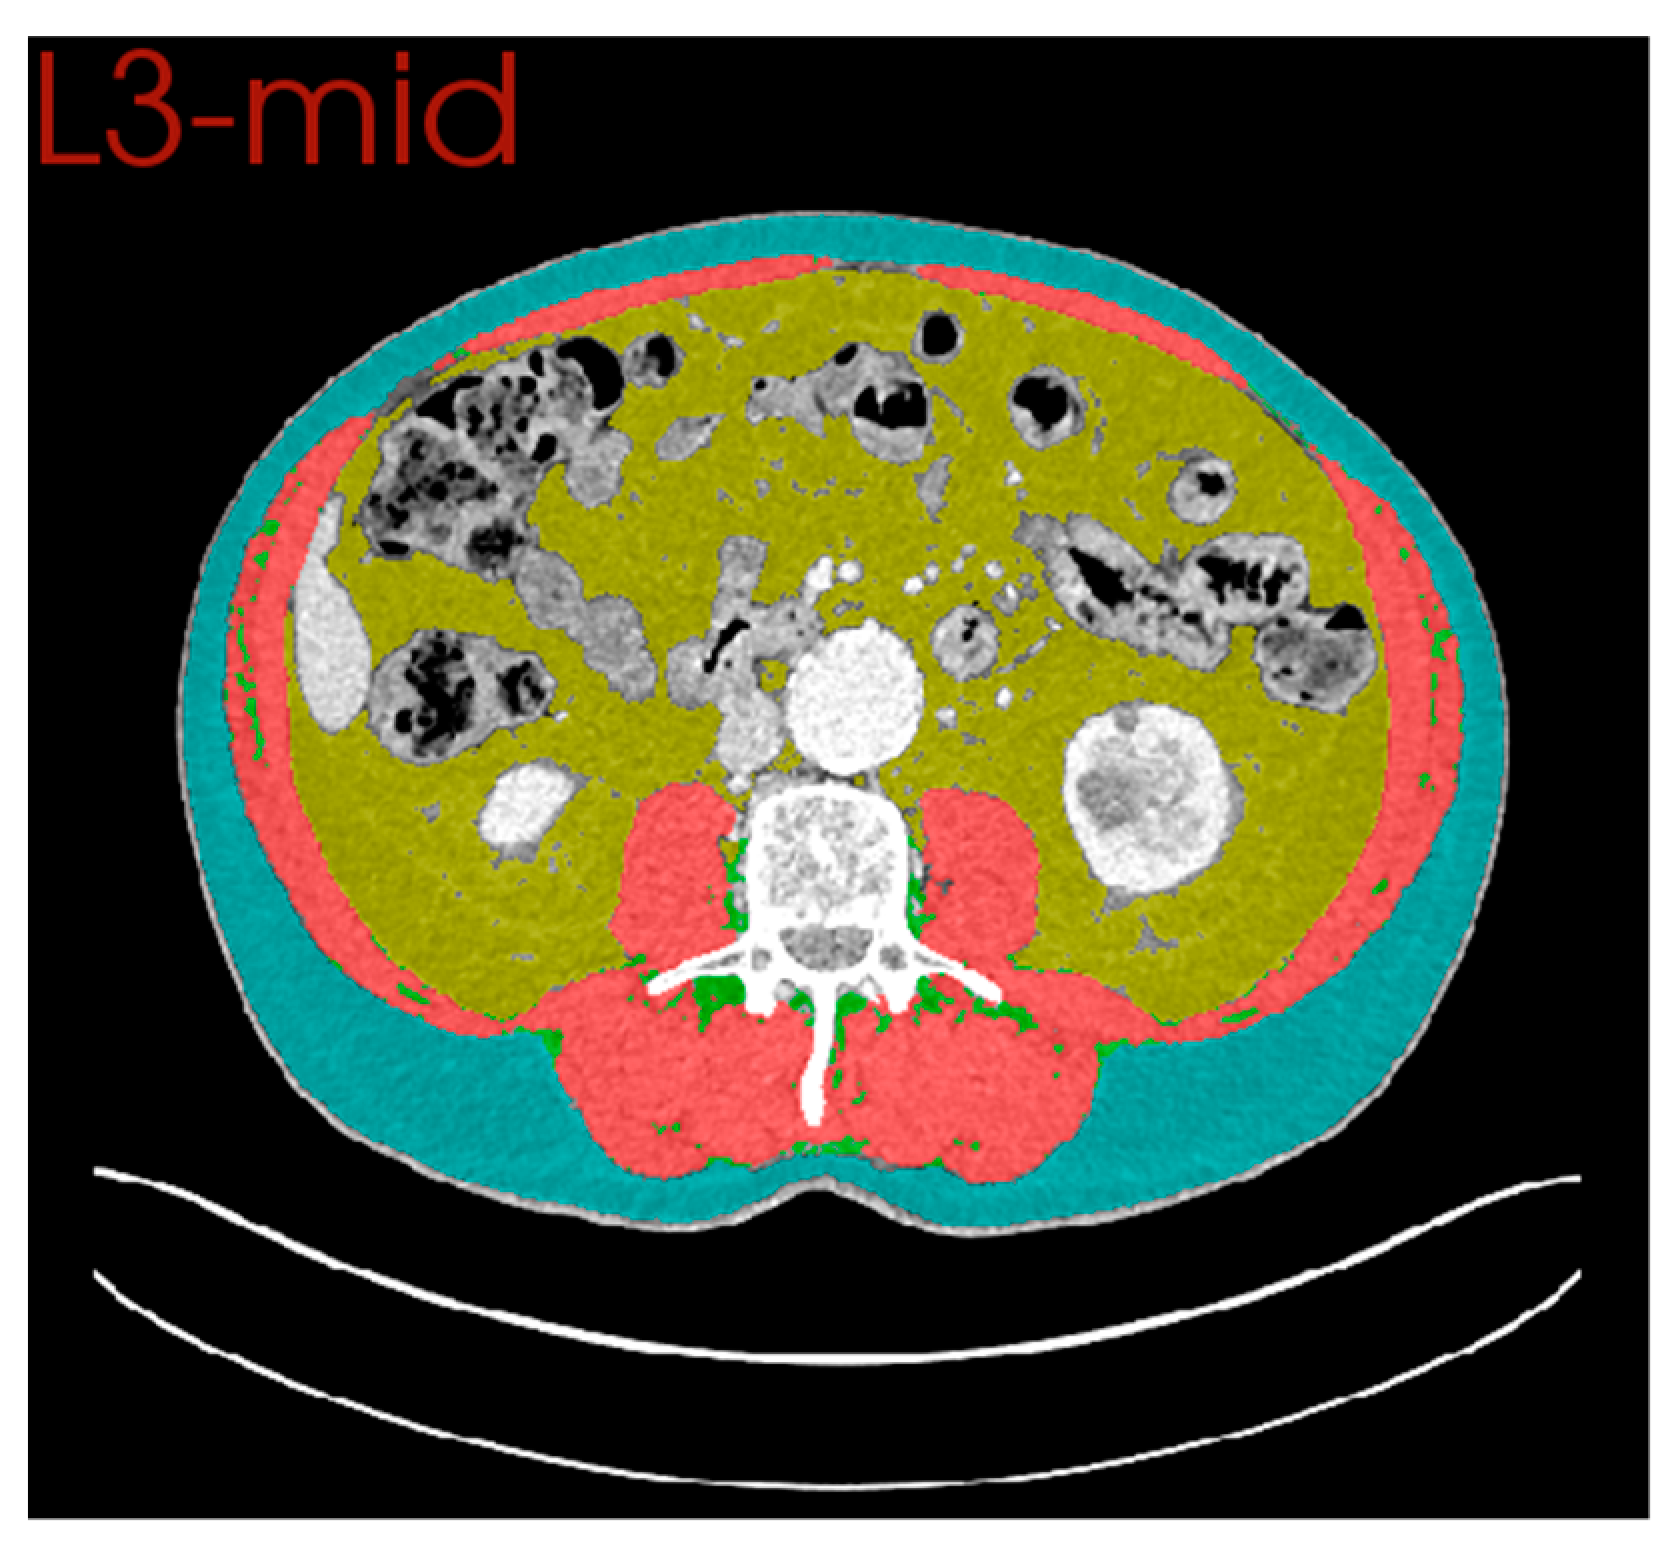
2.5. Computed Tomography (CT) Body Composition
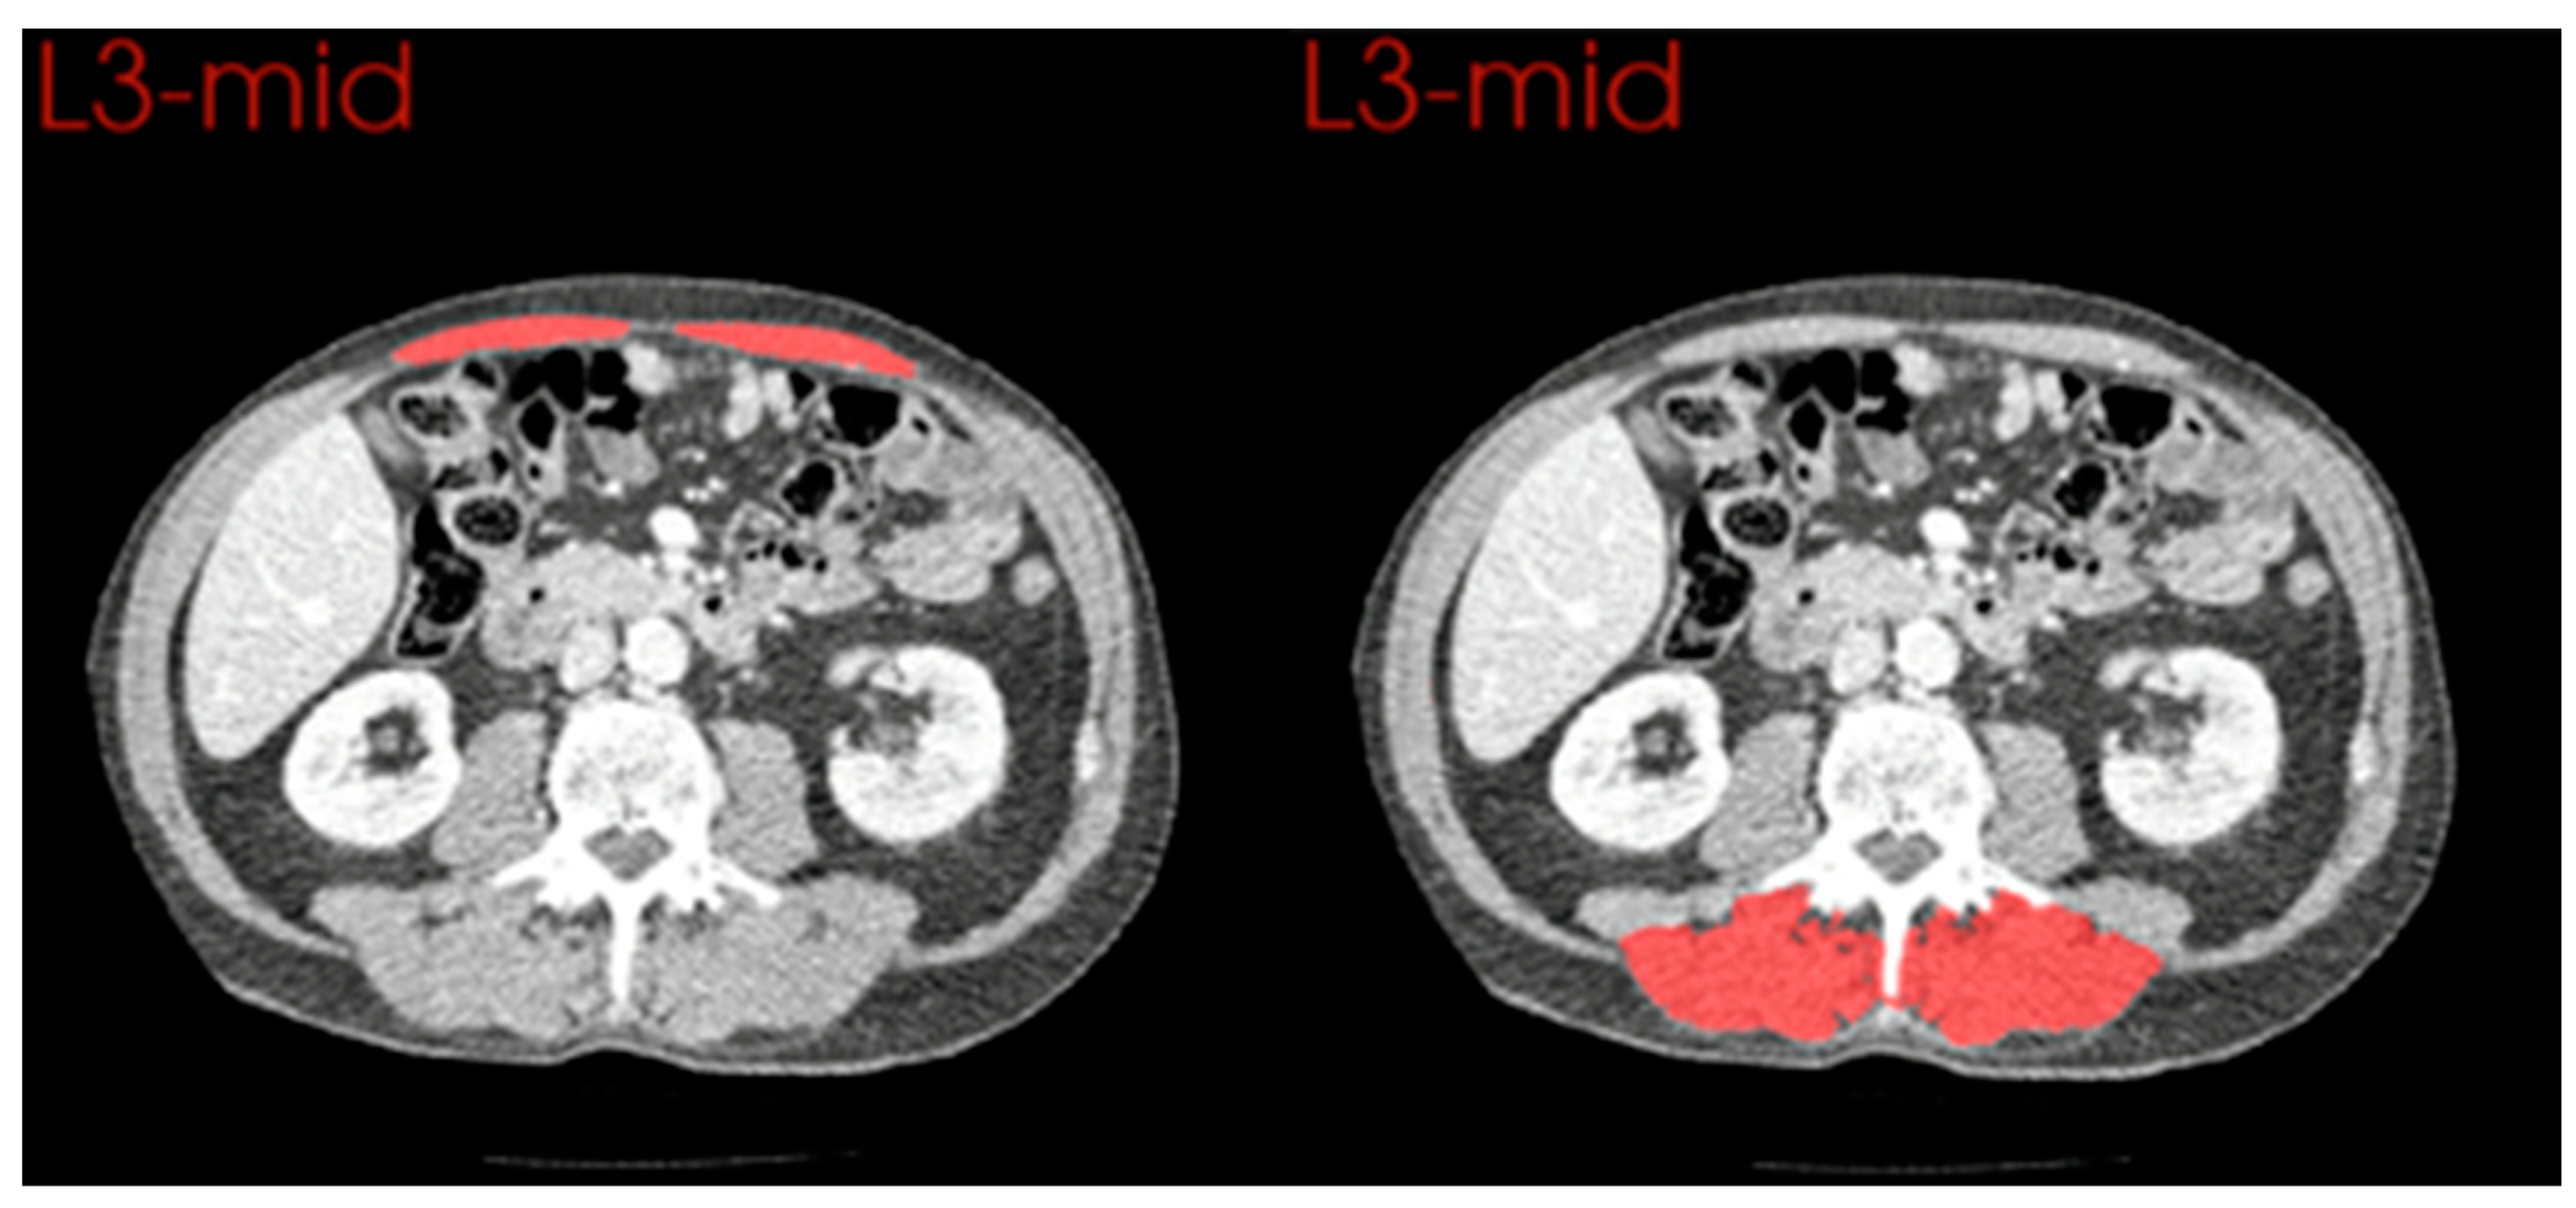
2.6. Comparison of Anterior and Posterior Muscle Groups
2.7. Statistical Analysis
3. Results
3.1. Neoadjuvant Chemotherapy
3.2. Surgical Resection and Anastomotic Leak
3.3. Recovery of CT Body Composition following Anastomotic Leak
3.4. Comparison of Changes in Anterior and Posterior Muscle Groups
4. Discussion
5. Conclusions
Author Contributions
Funding
Institutional Review Board Statement
Informed Consent Statement
Data Availability Statement
Conflicts of Interest
Appendix A
| Treatment Regimen | Surgery Alone | 4 (20%) |
|---|---|---|
| NA Chemotherapy | 15 (75%) | |
| NA Chemoradiotherapy | 1 (5%) | |
| Pathological Tumour Stage | pT1 | 5 (25%) |
| pT2 | 2 (10%) | |
| pT3 | 10 (50%) | |
| pT4 | 3 (15%) | |
| Pathological Nodal Stage | pN0 | 9 (45%) |
| pN1 | 3 (15%) | |
| pN2 | 3 (15%) | |
| pN3 | 5 (25%) | |
| Positive Lymph Nodes | Median [IQR] | 1 [0–5.5] |
| Lymph Nodes Sampled | Median [IQR] | 23 [19.5–32] |
| Tumour Grade | Moderately Differentiated | 3 (15%) |
| Poorly Differentiated | 17 (85%) | |
| Resection Margin | R0 | 13 (65%) |
| R1 | 7 (35%) |
Appendix B
| CT Measurement | Staging Scan Mean (SD) | Pre-Op Scan Mean (SD) | Mean Difference (95% CI) | Percentage Difference | p Value |
|---|---|---|---|---|---|
| Skeletal Muscle Area (cm2) | 155.05 (32.70) | 144.44 (34.32) | −10.61 (−6.69, −14.53) | 6.84% | <0.001 |
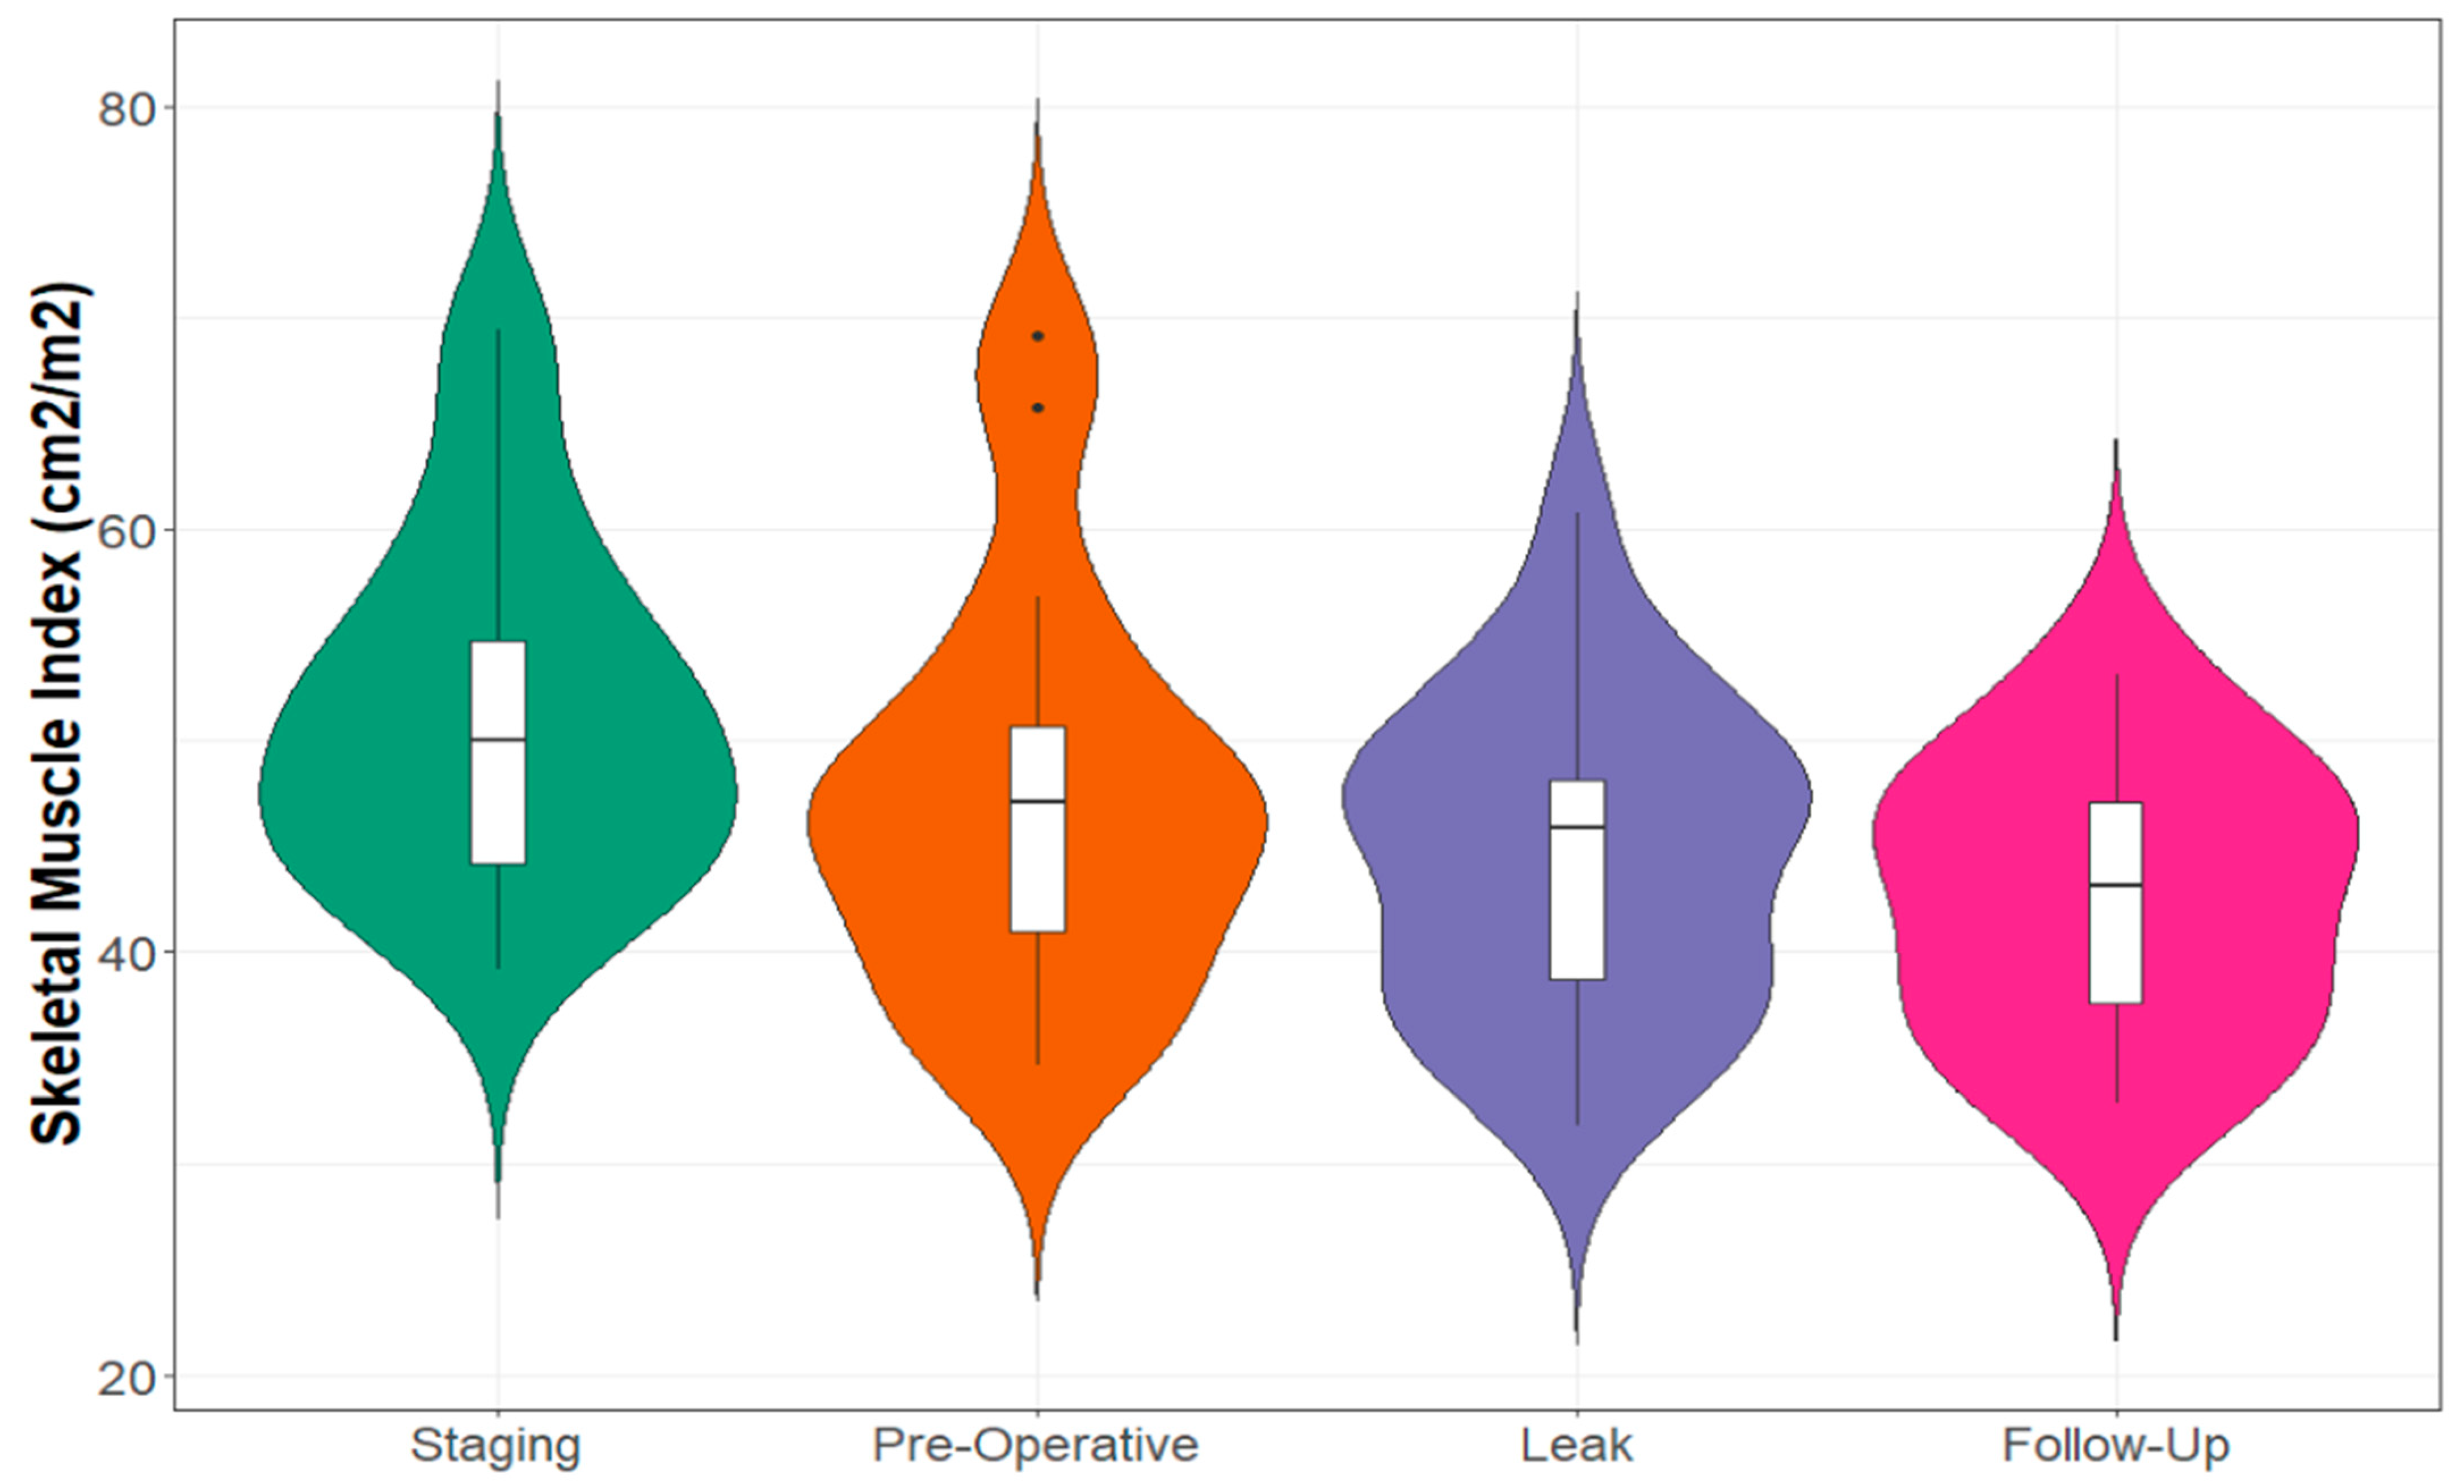
| Skeletal Muscle Index (cm2/m2) | 51.51 (9.09) | 47.93 (9.76) | −3.58 (−2.26, −4.91) | 6.95% | <0.001 |
| Skeletal Muscle Density (HU) | 39.60 (9.50) | 37.10 (10.08) | −2.49 (−7.27, 2.28) | 6.29% | 0.283 |
| Visceral Fat Area (cm2) | 176.91 (122.62) | 189.05 (132.83) | 12.14 (−7.06, 31.34) | 6.89% | 0.198 |
| Visceral Fat Density (HU) | −96.69 (10.59) | −99.32 (8.32) | −2.63 (−5.89, 0.63) | 2.72% | 0.106 |
| Subcutaneous Fat Area (cm2) | 172.49 (84.82) | 178.36 (87.10) | 5.87 (−4.92, 16.67) | 3.40% | 0.265 |
| Subcutaneous Fat Density (HU) | −100.92 (8.34) | −102.50 (8.11) | −1.58 (−4.54, 1.38) | 1.57% | 0.273 |
| Intramuscular Fat Area (cm2) | 16.09 (8.36) | 16.88 (7.90) | 0.79 (−0.41, 1.99) | 4.91% | 0.180 |
| Intramuscular Fat Density (HU) | −51.37 (6.70) | −53.76 (6.98) | −2.38 (−5.41, 0.65) | 4.63% | 0.115 |
Appendix C
| Blood Marker | Staging Mean (SD) | Pre-Operative Mean (SD) | Leak Mean (SD) | p Value |
|---|---|---|---|---|
| Neutrophil Count (×109/L) | 5.18 (1.65) | 4.64 (3.45) | 19.21 (5.15) | <0.001 |
| Lymphocyte Count (×109/L) | 1.71 (0.59) | 1.88 (0.94) | 1.22 (0.53) | 0.013 |
| NLR | 3.26 (1.38) | 3.24 (2.82) | 17.59 (5.60) | <0.001 |
| Albumin (g/L) | 36.45 (6.02) | 35.94 (3.99) | 14.4 (4.13) | <0.001 |
| CRP (mg/L) | NA | NA | 226.8 (100) | NA |
Appendix D
| CT Measurement | Leak Scan Mean (SD) | Follow-Up Scan Mean (SD) | Mean Difference (95% CI) | Percentage Difference | p Value |
|---|---|---|---|---|---|
| Skeletal Muscle Area (cm2) | 138.61 (22.75) | 126.51 (19.82) | −12.09 (−25.12, 0.92) | 8.72% | 0.065 |
| Skeletal Muscle Index (cm2/m2) | 46.45 (6.27) | 42.55 (6.55) | −3.90 (−8.19, 0.38) | 8.40% | 0.069 |
| Skeletal Muscle Density (HU) | 30.03 (8.00) | 40.89 (6.26) | 10.86 (2.00, 18.72) | 36.16% | 0.022 |
| Visceral Fat Area (cm2) | 172.37 (93.31) | 117.81 (66.47) | −54.57 (−104.27, −4.86) | 31.66% | 0.035 |
| Visceral Fat Density (HU) | −88.73 (11.21) | −89.57 (8.73) | −0.84 (−10,79, 9.11) | 0.95% | 0.853 |
| Subcutaneous Fat Area (cm2) | 289.19 (146.57) | 170.73 (96.30) | −118.46 (−177.04, −59.88) | 40.96% | 0.001 |
| Subcutaneous Fat Density (HU) | −78.01 (15.85) | −96.63 (13.62) | −18.62 (−35.06, −2.17) | 23.87% | 0.031 |
| Intramuscular Fat Area (cm2) | 20.92 (9.00) | 18.12 (7.29) | −2.80 (−7.89, 2.29) | 13.38% | 0.245 |
| Intramuscular Fat Density (HU) | −50.38 (6.21) | −50.70 (5.39) | −0.31 (−5.23, 4.60) | 0.62% | 0.889 |
References
- Griffin, S.M.; Jones, R.; Kamarajah, S.K.; Navidi, M.; Wahed, S.; Immanuel, A.; Hayes, N.; Phillips, A.W. Evolution of Esophagectomy for cancer over 30 years: Changes in presentation, management and outcomes. Ann. Surg. Oncol. 2021, 28, 3011–3022. [Google Scholar] [CrossRef]
- Oesophago-Gastric Anastomosis Study Group; Fergusson, J.; Beenen, E.; Mosse, C.; Salim, J.; Cheah, S.; Wright, T.; Cerdeira, M.; McQuillan, P.; Richardson, M.; et al. Comparison of short-term outcomes from the International Oesophago-Gastric Anastomosis Audit (OGAA), the Esophagectomy Complications Consensus Group (ECCG), and the Dutch Upper Gastrointestinal Cancer Audit (DUCA). BJS Open 2021, 5, zrab010. [Google Scholar]
- Kamarajah, S.K.; Navidi, M.; Wahed, S.; Immanuel, A.; Hayes, N.; Griffin, S.M.; Phillips, A.W. Anastomotic leak does not impact on long-term outcomes in esophageal cancer patients. Ann. Surg. Oncol. 2020, 27, 2414–2424. [Google Scholar] [CrossRef] [PubMed]
- Markar, S.; Gronnier, C.; Duhamel, A.; Mabrut, J.-Y.; Bail, J.-P.; Carrere, N.; Lefevre, J.H.; Brigand, C.; Vaillant, J.-C.; Adham, M.; et al. The impact of severe anastomotic leak on long-term survival and cancer recurrence after surgical resection for esophageal malignancy. Ann. Surg. 2015, 262, 972–980. [Google Scholar] [CrossRef] [PubMed]
- Jogiat, U.M.; Bédard, E.L.R.; Sasewich, H.; Turner, S.R.; Eurich, D.T.; Filafilo, H.; Baracos, V. Sarcopenia reduces overall survival in unresectable oesophageal cancer: A systematic review and meta-analysis. J. Cachexia Sarcopenia Muscle 2022, 13, 2630–2636. [Google Scholar] [CrossRef]
- Jogiat, U.M.; Sasewich, H.; Turner, S.R.; Baracos, V.; Eurich, D.T.; Filafilo, H.; Bédard, E.L. Sarcopenia determined by skeletal muscle index predicts overall survival, disease-free survival, and postoperative complications in resectable esophageal cancer: A systematic review and meta-analysis. Ann. Surg. 2022, 276, e311–e318. [Google Scholar] [CrossRef]
- Body, S.; Ligthart, M.A.P.; Rahman, S.; Ward, J.; May-Miller, P.; Pucher, P.H.; Curtis, N.J.; West, M.A. Sarcopenia and myosteatosis predict adverse outcomes after emergency laparotomy: A multi-center observational cohort study. Ann. Surg. 2022, 275, 1103–1111. [Google Scholar] [CrossRef]
- Park, B.; Bhat, S.; Wells, C.I.; Barazanchi, A.W.H.; Hill, A.G.; MacCormick, A.D. Short- and long-term impact of sarcopenia on outcomes after emergency laparotomy: A systematic review and meta-analysis. Surgery 2022, 172, 436–445. [Google Scholar] [CrossRef]
- Aleixo, G.F.P.; Shachar, S.S.; Nyrop, K.A.; Muss, H.B.; Malpica, L.; Williams, G.R. Myosteatosis and prognosis in cancer: Systematic review and meta-analysis. Crit. Rev. Oncol./Hematol. 2020, 145, 102839. [Google Scholar] [CrossRef]
- McGovern, J.; Delaney, J.; Forshaw, M.J.; McCabe, G.; Crumley, A.B.; McIntosh, D.; Laird, B.J.; Horgan, P.G.; McMillan, D.C.; McSorley, S.T.; et al. The relationship between computed tomography-derived sarcopenia, cardiopulmonary exercise testing performance, systemic inflammation, and survival in good performance status patients with oesophago-gastric cancer undergoing neoadjuvant treatment. JCSM Clin. Rep. 2023, 8, 3–11. [Google Scholar] [CrossRef]
- Yuan, D.; Jin, H.; Liu, Q.; Zhang, J.; Ma, B.; Xiao, W.; Li, Y. Publication trends for sarcopenia in the world: A 20-year bibliometric analysis. Front. Med. 2022, 9, 802651. [Google Scholar] [CrossRef] [PubMed]
- Dolan, R.D.; Almasaudi, A.S.; Dieu, L.B.; Horgan, P.G.; McSorley, S.T.; McMillan, D.C. The relationship between computed tomography-derived body composition, systemic inflammatory response, and survival in patients undergoing surgery for colorectal cancer. J. Cachexia Sarcopenia Muscle 2019, 10, 111–122. [Google Scholar] [CrossRef] [PubMed]
- Okholm, C.; Goetze, J.P.; Svendsen, L.B.; Achiam, M.P. Inflammatory response in laparoscopic vs. open surgery for gastric cancer. Scand. J. Gastroenterol. 2014, 49, 1027–1034. [Google Scholar] [CrossRef] [PubMed]
- Fretland, A.A.; Sokolov, A.; Postriganova, N.; Kazaryan, A.M.; Pischke, S.E.; Nilsson, P.H.; Rognes, I.N.; Bjornbeth, B.A.; Fagerland, M.W.; Mollnes, T.E. Inflammatory response after laparoscopic versus open resection of colorectal liver metastases: Data from the Oslo-CoMet trial. Medicine 2015, 94, e1786. [Google Scholar] [CrossRef]
- Aiolfi, A.; Asti, E.; Rausa, E.; Bonavina, G.; Bonitta, G.; Bonavina, L. Use of C-reactive protein for the early prediction of anastomotic leak after esophagectomy: Systematic review and Bayesian meta-analysis. PLoS ONE 2018, 13, e0209272. [Google Scholar] [CrossRef]
- Low, D.E.; Alderson, D.; Cecconello, I.; Chang, A.C.; Darling, G.E.; D’Journo, X.B.; Griffin, S.M.; Hölscher, A.H.; Hofstetter, W.L.; Jobe, B.A.; et al. International Consensus on standardization of data collection for complications associated with esophagectomy: Esophagectomy Complications Consensus Group (ECCG). Ann. Surg. 2015, 262, 286–294. [Google Scholar] [CrossRef]
- Fearon, K.; Strasser, F.; Anker, S.D.; Bosaeus, I.; Bruera, E.; Fainsinger, R.L.; Jatoi, A.; Loprinzi, C.; MacDonald, N.; Mantovani, G.; et al. Definition and classification of cancer cachexia: An international consensus. Lancet Oncol. 2011, 12, 489–495. [Google Scholar] [CrossRef]
- NHLBI Obesity Education Initiative Expert Panel on the Identification, Evaluation, and Treatment of Obesity in Adults (US). Clinical guidelines on the identification, evaluation, and treatment of overweight and obesity in adults: Executive summary. Am. J. Clin. Nutr. 1998, 68, 899–917. [Google Scholar] [CrossRef]
- BAPEN. The ‘MUST’ Explanatory Booklet: A Guide to the ‘Malnutrition Universal Screening Tool’ (‘MUST’) for Adults. Available online: http://www.bapen.org.uk/pdfs/must/must_explan.pdf (accessed on 28 March 2023).
- Charlson, M.E.; Pompei, P.; Ales, K.L.; MacKenzie, C.R. A new method of classifying prognostic comorbidity in longitudinal studies: Development and validation. J. Chronic Dis. 1987, 40, 373–383. [Google Scholar] [CrossRef]
- Saklad, M. Grading of patients for surgical procedures. Anesthesiology 1941, 2, 281–284. [Google Scholar] [CrossRef]
- Royal College of Pathologists. Dataset for the Histopathological Reporting of Oesophageal Carcinoma, 2nd ed.; Royal College of Pathologists: London, UK, 2006. [Google Scholar]
- Ma, D.; Chow, V.; Popuri, K.; Beg, M.F. Comprehensive validation of automated whole body skeletal muscle, adipose tissue, and bone segmentation from 3D CT images for body composition analysis: Towards extended body composition. arXiv 2021, arXiv:2106.00652. [Google Scholar]
- Mourtzakis, M.; Prado, C.M.M.; Lieffers, J.R.; Reiman, T.; McCargar, L.J.; Baracos, V.E. A practical and precise approach to quantification of body composition in cancer patients using computed tomography images acquired during routine care. Appl. Physiol. Nutr. Metab. 2008, 33, 997–1006. [Google Scholar] [CrossRef] [PubMed]
- Rahman, S.A.; Walker, R.C.; Maynard, N.; Trudgill, N.; Crosby, T.; Cromwell, D.A.; Underwood, T.J.; on behalf of the NOGCA project team AUGIS. The AUGIS survival predictor: Prediction of long-term and conditional survival after esophagectomy using random survival forests. Ann. Surg. 2021; ahead of print. Available online: https://journals.lww.com/10.1097/SLA.0000000000004794 (accessed on 16 September 2021).
- Van der Schaaf, M.K.; Tilanus, H.W.; van Lanschot, J.J.B.; Johar, A.M.; Lagergren, P.; Lagergren, J.; Wijnhoven, B.P. The influence of preoperative weight loss on the postoperative course after esophageal cancer resection. J. Thorac. Cardiovasc. Surg. 2014, 147, 490–495. [Google Scholar] [CrossRef] [PubMed]
- Skipworth, J.; Foster, J.; Raptis, D.; Hughes, F. The effect of preoperative weight loss and body mass index on postoperative outcome in patients with esophagogastric carcinoma. Dis. Esophagus 2009, 22, 559–563. [Google Scholar] [CrossRef]
- Kamarajah, S.K.; Lin, A.; Tharmaraja, T.; Bharwada, Y.; Bundred, J.R.; Nepogodiev, D.; Evans, R.P.T.; Singh, P.; Griffiths, E.A. Risk factors and outcomes associated with anastomotic leaks following esophagectomy: A systematic review and meta-analysis. Dis. Esophagus 2020, 33, doz089. [Google Scholar] [CrossRef]
- Xu, X.-Y.; Jiang, X.-M.; Xu, Q.; Xu, H.; Luo, J.-H.; Yao, C.; Ding, L.-Y.; Zhu, S.-Q. Skeletal muscle change during neoadjuvant therapy and its impact on prognosis in patients with gastrointestinal cancers: A systematic review and meta-analysis. Front. Oncol. 2022, 12, 892935. [Google Scholar] [CrossRef]
- Puthucheary, Z.A.; Rawal, J.; McPhail, M.; Connolly, B.; Ratnayake, G.; Chan, P.; Hopkinson, N.S.; Padhke, R.; Dew, T.; Sidhu, P.S.; et al. Acute skeletal muscle wasting in critical illness. JAMA 2013, 310, 1591. [Google Scholar] [CrossRef]
- Hill, A.G.; Hill, G.L. Metabolic response to severe injury. Br. J. Surg. 2003, 85, 884–890. [Google Scholar] [CrossRef]
- Minamiya, Y.; Kitamura, M.; Saito, R.; Saito, H.; Matsumoto, H.; Abo, S. Peripheral edema after esophagectomy. Surg. Today 1998, 28, 6–9. [Google Scholar] [CrossRef]
- Hellenthal, K.E.M.; Brabenec, L.; Wagner, N.-M. Regulation and dysregulation of endothelial permeability during systemic inflammation. Cells 2022, 11, 1935. [Google Scholar] [CrossRef]
- Desborough, J.P. The stress response to trauma and surgery. Br. J. Anaesth. 2000, 85, 109–117. [Google Scholar] [CrossRef] [PubMed]
- Baker, M.; Halliday, V.; Williams, R.N.; Bowrey, D.J. A systematic review of the nutritional consequences of esophagectomy. Clin. Nutr. 2016, 35, 987–994. [Google Scholar] [CrossRef] [PubMed]


| Age (Years) | Median [IQR] | 65 [56–71] |
|---|---|---|
| Sex | Male | 18 (90%) |
| Female | 2 (10%) | |
| ASA Grade | 1 | 4 (20%) |
| 2 | 8 (40%) | |
| 3 | 8 (40%) | |
| Charlson Comorbidity Index | 0–1 | 2 (10%) |
| 2–4 | 9 (45%) | |
| >5 | 9 (45%) | |
| Weight at Diagnosis (kg) | Median [IQR] | 84.5 [73–97] |
| Body Mass Index (kg/m2) | Median [IQR] | 27.3 [24.5–31.8] |
| MUST Score | Low Risk | 5 (25%) |
| Medium Risk | 5 (25%) | |
| High Risk | 10 (50%) | |
| Pre-Treatment Weight Loss (kg) * | Median [IQR] | 1 [0–4.5] |
| Pre-Treatment Cachexia | Yes | 8 (40%) |
| No | 12 (60%) | |
| Tumour Site | Middle Oesophagus | 2 (10%) |
| Lower Oesophagus | 13 (65%) | |
| Gastro-Oesophageal Junction | 5 (25%) | |
| Histology | Adenocarcinoma | 16 (80%) |
| Squamous Cell Carcinoma | 4 (20%) | |
| Clinical Tumour Stage | cT1 | 1 (5%) |
| cT2 | 2 (10%) | |
| cT3 | 17 (85%) | |
| Clinical Nodal Stage | cN0 | 3 (15%) |
| cN1 | 8 (40%) | |
| cN2 | 7 (35%) | |
| cN3 | 2 (10%) |
| CT Measurement | Pre-Op Scan Mean (SD) | Leak Scan Mean (SD) | Mean Difference (95% CI) | Percentage Difference | p Value |
|---|---|---|---|---|---|
| Skeletal Muscle Area (cm2) | 147.17 (31.38) | 133.89 (24.99) | −13.28 (−20.53, −6.02) | 9.03% | 0.001 |
| Skeletal Muscle Index (cm2/m2) | 48.56 (8.98) | 44.33 (7.62) | −4.23 (−6.49, −1.97) | 8.71% | <0.001 |
| Skeletal Muscle Density (HU) | 35.63 (9.84) | 30.21 (8.29) | −5.42 (0.01, 10.83) | 15.21% | 0.049 |
| Visceral Fat Area (cm2) | 201.29 (125.48) | 163.13 (92.08) | −38.16 (−60.55, −15.77) | 18.96% | 0.002 |
| Visceral Fat Density (HU) | −100.04 (7.69) | −86.85 (10.41) | 13.19 (8.56, 17.82) | 13.18% | <0.001 |
| Subcutaneous Fat Area (cm2) | 193.61 (91.85) | 257.12 (109.82) | 63.51 (46.22, 80.80) | 32.80% | <0.001 |
| Subcutaneous Fat Density (HU) | −103.45 (7.50) | −71.78 (16.08) | 29.66 (20.90, 38.43) | 28.67% | <0.001 |
| Intramuscular Fat Area (cm2) | 17.23 (7.15) | 20.48 (7.33) | 3.24 (1.60, 4.88) | 18.80% | <0.001 |
| Intramuscular Fat Density (HU) | −54.22 (6.44) | −49.36 (5.79) | 4.85 (0.97, 8.74) | 8.95% | 0.017 |
| Pre-Op Scan Mean (SD) | Leak Scan Mean (SD) | Mean Difference (95% CI) | Percentage Difference | p Value | |
|---|---|---|---|---|---|
| Anterior Muscle | |||||
| Skeletal Muscle Area (cm2) | 12.19 (4.12) | 11.13 (4.33) | −1.06 (−2.67, 0.55) | 8.70% | 0.185 |
| Skeletal Muscle Density (HU) | 38.98 (9.59) | 32.35 (9.02) | −6.64 (−1.17, −12.10) | 16.64% | 0.020 |
| Posterior Muscle | |||||
| Skeletal Muscle Area (cm2) | 48.49 (8.26) | 44.78 (5.82) | −3.71 (−5.39, −2.03) | 7.65% | <0.001 |
| Skeletal Muscle Density (HU) | 26.44 (15.63) | 15.63 (10.84) | −12.27 (−17.73, −6.81) | 46.41% | <0.001 |
Disclaimer/Publisher’s Note: The statements, opinions and data contained in all publications are solely those of the individual author(s) and contributor(s) and not of MDPI and/or the editor(s). MDPI and/or the editor(s) disclaim responsibility for any injury to people or property resulting from any ideas, methods, instructions or products referred to in the content. |
© 2023 by the authors. Licensee MDPI, Basel, Switzerland. This article is an open access article distributed under the terms and conditions of the Creative Commons Attribution (CC BY) license (https://creativecommons.org/licenses/by/4.0/).
Share and Cite
Brown, L.R.; Ramage, M.I.; Dolan, R.D.; Sayers, J.; Bruce, N.; Dick, L.; Sami, S.; McMillan, D.C.; Laird, B.J.A.; Wigmore, S.J.; et al. The Impact of Acute Systemic Inflammation Secondary to Oesophagectomy and Anastomotic Leak on Computed Tomography Body Composition Analyses. Cancers 2023, 15, 2577. https://doi.org/10.3390/cancers15092577
Brown LR, Ramage MI, Dolan RD, Sayers J, Bruce N, Dick L, Sami S, McMillan DC, Laird BJA, Wigmore SJ, et al. The Impact of Acute Systemic Inflammation Secondary to Oesophagectomy and Anastomotic Leak on Computed Tomography Body Composition Analyses. Cancers. 2023; 15(9):2577. https://doi.org/10.3390/cancers15092577
Chicago/Turabian StyleBrown, Leo R., Michael I. Ramage, Ross D. Dolan, Judith Sayers, Nikki Bruce, Lachlan Dick, Sharukh Sami, Donald C. McMillan, Barry J. A. Laird, Stephen J. Wigmore, and et al. 2023. "The Impact of Acute Systemic Inflammation Secondary to Oesophagectomy and Anastomotic Leak on Computed Tomography Body Composition Analyses" Cancers 15, no. 9: 2577. https://doi.org/10.3390/cancers15092577
APA StyleBrown, L. R., Ramage, M. I., Dolan, R. D., Sayers, J., Bruce, N., Dick, L., Sami, S., McMillan, D. C., Laird, B. J. A., Wigmore, S. J., & Skipworth, R. J. E. (2023). The Impact of Acute Systemic Inflammation Secondary to Oesophagectomy and Anastomotic Leak on Computed Tomography Body Composition Analyses. Cancers, 15(9), 2577. https://doi.org/10.3390/cancers15092577


