Simple Summary
The lipid phosphate phosphatases (LPPs) are a family of three enzymes that act at the cell surface and within the cell to modulate signaling. In many tumors, including breast cancers, LPP1 and LPP3 expression levels are decreased and LPP2 expression levels are increased relative to normal tissue, which stimulates a pro-cancerous phenotype by decreasing the turnover of bioactive lipids and promoting cell cycle progression. While most research has been conducted in the laboratory, validation in human tumors is lacking. We used three large independent patient cohorts and single-cell RNA-sequencing data to show that decreased LPP1/3 and increased LPP2 expression in cancers correlated to worse tumor biology, immune system evasion, and decreased survival. Most tumor LPP1/3 is produced by the stroma and LPP2 by cancer cells. Overall, our findings support pre-clinical evidence that restoring tumor LPP expression balance, particularly through LPP2 inhibition, could provide adjunct therapies for breast cancer patients.
Abstract
The LPP family is comprised of three enzymes that dephosphorylate bioactive lipid phosphates both intracellularly and extracellularly. Pre-clinical breast cancer models have demonstrated that decreased LPP1/3 with increased LPP2 expression correlates to tumorigenesis. This though has not been well verified in human specimens. In this study, we correlate LPP expression data to clinical outcomes in over 5000 breast cancers from three independent cohorts (TCGA, METABRIC, and GSE96058), investigate biological function using gene set enrichment analysis (GSEA) and the xCell cell-type enrichment analysis, and confirm sources of LPP production in the tumor microenvironment (TME) using single-cell RNA-sequencing (scRNAseq) data. Decreased LPP1/3 and increased LPP2 expression correlated to increased tumor grade, proliferation, and tumor mutational burden (all p < 0.001), as well as worse overall survival (hazard ratios 1.3–1.5). Further, cytolytic activity was decreased, consistent with immune system invasion. GSEA data demonstrated multiple increased inflammatory signaling, survival, stemness, and cell signaling pathways with this phenotype across all three cohorts. scRNAseq and the xCell algorithm demonstrated that most tumor LPP1/3 was expressed by endothelial cells and tumor-associated fibroblasts and LPP2 by cancer cells (all p < 0.01). Restoring the balance in LPP expression levels, particularly through LPP2 inhibition, could represent novel adjuvant therapeutic options in breast cancer treatment.
1. Introduction
Despite excellent prognosis if detected and treated as a local disease, between 3 and 15% of breast cancers will relapse within 10 years, and up to 36% of patients will initially present with either nodal or metastatic disease [1,2]. In the United States alone, treatment resistance and disease progression account for over 40,000 breast cancer deaths annually [3,4]. This ultimate bastion of treatment disease relapse and treatment failure is a fundamental target of ongoing breast cancer research [5].
The lipid phosphate phosphatases (LPPs) are an increasingly attractive and novel target for adjuvant therapy development [6,7]. The LPPs are a family of three enzymes (LPP1–3) that function at the plasma membrane and internal membranes of organoids such as the endoplasmic reticulum and the Golgi apparatus [8,9,10]. At the plasma membrane, the catalytic sites of the LPPs face the extracellular side (ecto-activity) and function to dephosphorylate multiple bioactive lipids, including extracellular sphingosine 1-phosphate (S1P) and particularly lysophosphatidate (LPA) (Figure 1) [11]. LPA is produced from lysophosphatidylcholine (LPC), primarily by the lysophospholipase D activity of the secreted enzyme autotaxin (ATX) [12,13]. LPA signals through six membrane-bound G-protein coupled receptors to facilitate tumor proliferation, metastasis, and therapy resistance in cancer cells [6,14]. To favor tumorigenesis, we have shown in murine models that tumors increase LPA concentrations by overexpressing ATX themselves, or by cytokine stimulation in the tumor microenvironment (TME) stroma, and decrease the expression of LPP1 and LPP3 [4]. In breast and ovarian murine allograft and xenograft cancer models, increasing these low levels of either LPP1 or LPP3 in implanted cancer cells slows subsequent tumor growth and metastasis [15,16]. We previously showed that low LPP1 expression in human MDA-MB-231 and murine Balb/c 4T1 breast cancer cells increases levels of cyclin D1 and D3 and matrix metalloproteinases via transcription of multiple factors, which ultimately leads to cell division [17]. Conversely, LPP2 expression is upregulated in many cancers, including breast, with its catalytic activity inside the cells (endo-LPP functions) (Figure 1) [7,8]. These functions increase S-phase entry in the cell cycle via upregulation of the c-Myc transcription factor [18,19,20]. We have additionally shown that LPP2 knockout in MDA-MB-231 breast cancer cells slows tumor growth and lung micro-metastasis in a xenograft mouse model [20]. The cell biology of the LPPs is further reviewed elsewhere [8,15,17,20,21,22,23,24,25,26].
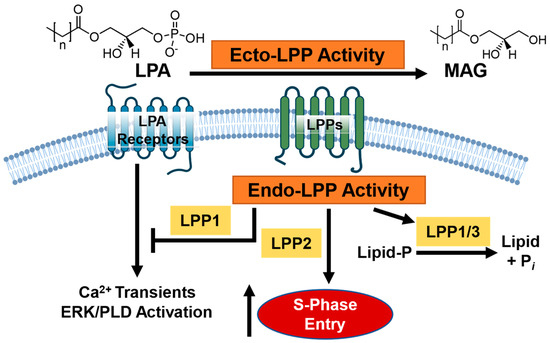
Figure 1.
Overview of the current model of lipid phosphate phosphatase (LPP) signaling in breast cancer. The LPPs comprise a family of three enzymes, capable of dephosphorylating extracellular lipid phosphates at the cell membrane surface (ecto-LPP activity) such as lysophosphatidate (LPA) into monoacylglycerol (MAG). LPPs can regulate substrates inside the cell through either enzymatic or catalytic activities (endo-LPP activity), such as via lipid dephosphorylation; promotion of S-phase cell entry (LPP2 specifically); or modulation of downstream calcium transient, ERK, and phospholipase D (PLD) activation. Broadly speaking, decreased LPP1/3 activity and increased LPP2 activity is associated with a pro-cancer phenotype.
Pre-clinical investigations in both cell cultures and murine tumor models have provided considerable support for inhibitors against the ATX-LPAR-LPP pathway, some of which, especially against ATX and the LPARs, are currently in clinical trials [4,27,28,29,30,31]. However, there are no therapies under clinical investigation to restore LPP1/3 levels or suppress LPP2 levels in cancers. There are limited studies to validate LPP investigative findings in human tumors and, particularly, the role of LPPs in the cancer TME is largely unknown. In this study, we explore the role of LPP mRNA expression (LPP1 gene name PLPP1 and historically PAPP2A; LPP2 gene name PLPP2, PAPP2C; LPP3 gene name PLPP3, PAPP2B) [8] within the human breast cancer TME via in silico research approaches using three large independent cohorts. These results should assist in making meaningful comparative analyses to extensive pre-clinical investigations that support the potential of future pharmacological development to mitigate the pathological balance of LPP expression in tumors.
2. Materials and Methods
2.1. Data Acquisition
Clinical and mRNA expression breast cancer data were obtained from the Cancer Genome Atlas Program (TCGA) (whole database, n = 1090; estrogen receptor positive and human epidermal growth factor receptor negative tumors (ER+ HER2−), n = 593; human epidermal growth factor receptor positive tumors (HER2+), n = 184; and triple negative breast cancer (TNBC), n = 160), the Molecular Taxonomy of Breast Cancer International Consortium (METABRIC) (whole database, n = 1094; ER+ HER2−, n = 1355; HER2+, n = 236; and TNBC, n = 313), and GSE96058 (whole database, n = 3069; ER+ HER2−, n = 2277; HER2+, n = 392; and TNBC, n = 155). These three databases were obtained via the cBioPortal (https://www.cbioportal.org (accessed on 9 October 2022)) and the Gene Expression Omnibus (GEO) repository of the United States National Institutes of Health (https://www.ncbi.nlm.nih.gov/geo (accessed on 9 October 2022)), as previously described [32,33]. Gene expression data from 114 samples of normal breast tissue were obtained from the Genotype-Tissue Expression (GTex) Portal (https://gtexportal.org (accessed on 9 October 2022)) [34]. Single-cell RNA sequencing breast cancer atlas data were also acquired for LPP expression from two large published studies [35,36] via the Broad Institute Single Cell Portal (https://singlecell.broadinstitute.org/single_cell (accessed on 9 October 2022)). As all data were obtained from deidentified public resources, ethics approval requirements were waived by the Roswell Park Institutional Review Board.
2.2. Gene Set Enrichment Analysis
Functional enrichment analysis of the LPP genes (PLPP1–3) was performed by gene set enrichment analysis (GSEA) [33] on the Molecular Signatures Database Hallmark collection (http://www.gsea-msigdb.org (accessed on 9 October 2022)) [37]. A false discovery rate (FDR) of <0.25 indicated enriched signaling gene sets [38]. The cohorts were dichotomized into high and low LPP expression groups by median gene expression. A positive NES score signifies enriched signaling in the LPP-high expression group and a negative NES score signifies enriched signaling in the LPP-low expression group.
2.3. Other Scores
The xCell algorithm (https://xcell.ucsf.edu (accessed on 9 October 2022)) [39] was used to correlate LPP gene expression to the infiltrating fraction of TME stromal cells (adipocytes, preadipocytes, fibroblasts, endothelial cells, and pericytes) and immune cells (CD8+, T helper cell (Th)1 and Th2 cells, T-regulator cells, M1 and M2 macrophages, and dendritic cells), as previously described [40,41,42,43]. The breast cancer mutational landscape (intratumor heterogeneity, homologous recombination defects, fraction genome altered, silent mutation rate, non-silent mutation rate, single-nucleotide neoantigens, and indel mutations), proliferation score, stromal fraction, TGF-β score, and immune scores (leukocyte fraction, lymphocyte infiltration, tumor infiltration lymphocyte fraction, macrophage regulation, and wound healing) were derived from Thorsson et al. [44]. TME immune cytolytic activity (CYT) was calculated with the xCell algorithm as the geometric mean of the expression of perforin (PRF1) and granzyme A (GZMA) mRNA expression, which are measures of cytotoxic T cell anti-cancer abilities [45].
2.4. Statistical Anlayses
Statistical analyses were conducted with R 4.2.1 (https://www.R-project.org (accessed on 9 October 2022)). Graphics were produced with the R software package and Origin Pro 2022 (OriginLab Corporation, Northampton, MA, USA). LPP mRNA levels were dichotomized into low and high groups based on the median expression level. All results are plotted as box plots, with the lower and upper bounds representing the maximum and minimum values; the upper and lower ends of the box representing the 25th and 75th percentile values, respectively; and the bolded bar within the box representing the median value. Multiple group comparisons were performed using the Kruskal–Wallis test and two-group comparisons were performed using the Wilcoxon signed-rank test. The R survival software package was used to analyze disease-free survival (DFS), disease-specific survival (DSS), and overall survival (OS) based on high or low LPP expression via Cox proportional hazards regression. p < 0.05 was set for statistical significance.
3. Results
3.1. High LPP1 and LPP3 Gene Expression and Low LPP2 Gene Expression Correlate to a Less Aggressive Breast Cancer Phenotype
We correlated the expression of LPP1–3 to characteristics of the breast tumors in each of the three cohorts. In all three cohorts, LPP1 (PLPP1) gene expression is lowest for TNBC tumors and highest for ER+ HER2− tumors (all p < 0.001, Figure 2A). This trend is essentially reversed for LPP2 (PLPP2) gene expression (all p < 0.001), whereas there is no difference across the three subtypes based on LPP3 (PLPP3) gene expression (Figure 2A). Data for disease stage are available from TCGA and METABRIC cohorts, and the only consistent result between the two cohorts is that median LPP1 gene expression is lowest for stage II tumors compared with stage I and III tumors (p < 0.001, Figure 2B). When analyzed by tumor grade, both LPP1 and LPP3 gene expression decreased monotonically with increasing grade in all three cohorts (all p < 0.001, Figure 2C). Median LPP2 expression was slightly lower for grade II tumors than for grade I tumors, but the highest expression occurred in grade III tumors in all cohorts (all p < 0.001, Figure 2C). Ki67 expression, a marker of cell proliferation, was negatively correlated with increasing LPP1/3 expression (Figure 2D) and, likewise, proliferation scores by Thorsson, et al. [44] were significantly decreased for high LPP1- and LPP3-expressing tumors compared with low expressing tumors (p < 0.001, Figure 2E). The reverse trend, however, occurred for LPP2 when comparing high and low expressing tumors and Ki67 correlation (p = 0.005, Figure 2D,E).
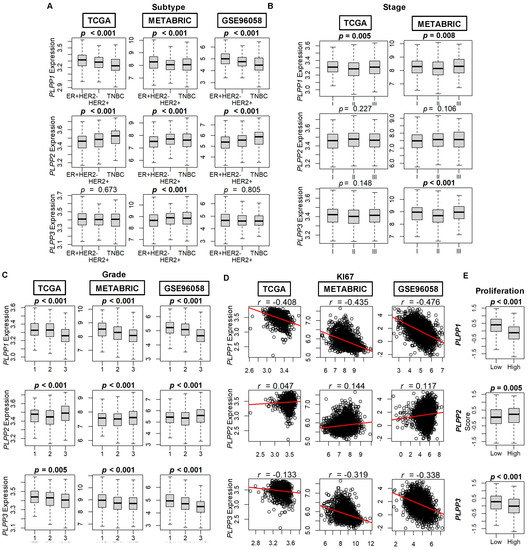
Figure 2.
LPP gene expression by breast cancer tumor subtype, stage, grade, and proliferation. (A) Breast cancer subtype. ER+ HER2− (estrogen receptor positive, human epidermal growth factor receptor negative tumors), HER2+, and TNBC (triple negative breast cancer). Counts by cohort: TCGA (ER+ HER2− n = 593, HER2+ n = 184, TNBC n = 160), METABRIC (ER+ HER2− n = 1355, HER2+ n = 236, TNBC n = 313), and GSE96058 (ER+ HER2− n = 2277, HER2+ n = 392, TNBC n = 155). (B) Staging according to the American Joint Committee on Cancer (AJCC). Stage is not available for the GSE96058 cohort. Counts by cohort: TCGA (stage I n = 181, stage II n = 617, stage III n = 248) and METABRIC (stage I n = 475, stage II n = 800, stage III n = 115). (C) Breast cancer grade. Counts by cohort: TCGA (grade 1 n = 77, grade 2 n = 269, grade 3 n = 235), METABRIC (grade 1 n = 165, grade 2 n = 740, grade 3 n = 927), and GSE96058 (grade 1 n = 454, grade 2 n = 1439, grade 3 n = 1115). (D) Ki67 correlation plots to LPP expression. (E) Proliferation score. Database on the scores by Thorsson, et al. [44]. Multiple group comparisons were performed using the Kruskal–Wallis test, and two-group comparisons were performed using the Wilcoxon signed-rank test. The bolded center bar within the box plots represents the median; the lower and upper box bounds represent the 25th and 75th percentiles, respectively; and the lower and upper tails represent the minimum and maximum values, respectively.
When dichotomized by nodal status (negative or positive), there was no correlation to high or low LPP gene expression (Figure S1A). There are only 20 samples from metastatic tumors in TCGA and 9 samples in METABRIC. Therefore, reliable conclusions cannot be made between LPP gene expression and the presence of metastasis (Figure S1B).
We next studied survival trends based on the median dichotomization of LPP gene expression. The results are expressed as disease-free survival (DFS), disease-specific survival (DSS), and overall survival (OS). Upon examination of the whole cohort, DFS and DSS favored high LPP1 gene expression but did not reach significance (Figure 3). However, OS was significantly better in both the METABRIC and GSE96058 cohorts, and trended towards significance for the high LPP1 gene expression patients (hazard ratio (HR) estimates about 0.63–0.85, Figure 3). A near identical pattern occurred in LPP3 gene expression, but overall survival was significantly better across all three cohorts for high LPP3-expressing tumors compared with low expression tumors (HR 0.68–0.85, all p < 0.02, Figure 3). In the TCGA cohort, high LPP2 expression correlated significantly with reduced DFS, DSS, and OS (HRs 1.4–1.7, all p < 0.02, Figure 3A). This same trend occurred in the METABRIC cohort, but it was only statistically significant for DSS (HR 1.19 (1.02–1.41), p = 0.03, Figure 3B). OS was significantly decreased for high LPP2-expressing tumors compared with low LPP2-expressing tumors in the GSE96058 cohort (HR 1.32 (1.05–1.64), p = 0.01, Figure 3C). The results were then sub-analyzed by hormone status in Figures S2–S4.
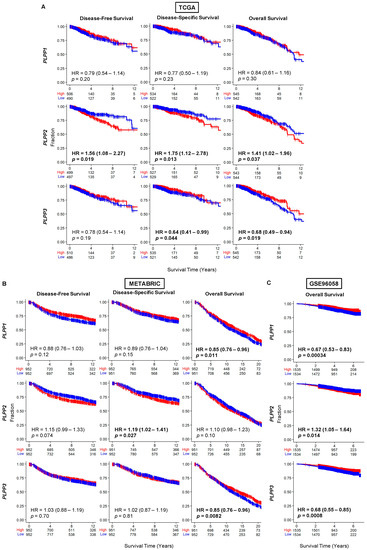
Figure 3.
Survival plots for low and high LPP gene expression in breast cancer tumors for the whole cohort for each dataset. (A) TCGA cohort results. (B) METABRIC cohort results. (C) GSE96058 cohort results. Patients at risk for each time point are listed along the x-axis. LPP gene expression is dichotomized into low and high groups by the median. The hazard ratio (HR) compares the high group against the low group.
Because tumor mutational burden can often be a marker of cancer aggressiveness in many tumors [42], we next examined its correlation with LPP gene expression. Intratumor heterogeneity was significantly decreased for high LPP1-expressing tumors (p < 0.001), but though not significant, trended lower for high LPP3-expressing tumors, and trended higher for high LPP2-expressing tumors (Figure 4). This decreased pattern for high LPP1- and LPP3-expressing tumors, and increased level for high LPP2-expressing tumors, was statistically significant for homologous recombination defects (all p ≤ 0.002, Figure 4). Fraction genome altered, silent mutation rate, non-silent mutation rate, and single-nucleotide variant neoantigens were all significantly decreased with high LPP1 and LPP3 expression (all p < 0.001), but they were not different for LPP2 (Figure 4). There were no significant differences in indel mutations for any of the LPPs (Figure 4).
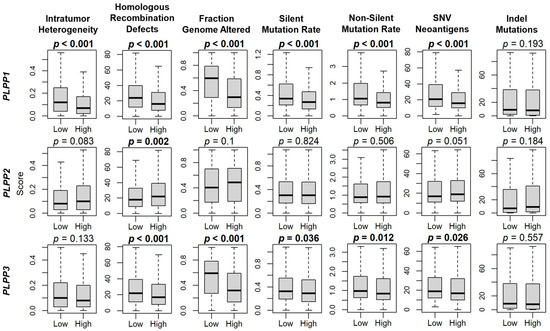
Figure 4.
LPP gene expression correlation with breast cancer mutations. Box plots of intratumor heterogeneity, homologous recombination defects, fraction genome altered, silent mutation rate, non-silent mutation rate, single-nucleotide variant (SNV) neoantigens, and indel mutations. Data are based on the scores by Thorsson, et al. [44]. LPP gene expression is dichotomized into low and high groups by the median. The bolded center bar represents the median; the lower and upper box bounds represent the 25th and 75th percentiles, respectively; and the lower and upper tails represent the minimum and maximum values, respectively.
3.2. LPP1- and LPP3-Mediated Gene Set Enrichment Patterns Favor a Mixed Pro- and Anti-Cancer Phenotype, whereas LPP2 Patterns Favor Cell Cycling Progression Pathways
We used gene set enrichment analysis (GSEA) on Hallmark pathways to study correlations to LPP gene expression [37]. Gene sets were selected if they had significance in at least two cohorts. The complete GSEA output is presented in Table S1. LPP1 and LPP3 shared similar patterns. Specifically, the most consistently upregulated gene sets in high LPP1- and LPP3-expressing tumors were related to inflammatory signaling and survival pathways (Figure 5). Additionally, the adipogenesis gene set was significantly upregulated in all three cohorts, suggesting that high LPP1 and LPP3 expression correlated to stromal cell populations. The most upregulated gene sets in high LPP2-expressing tumors were cell cycling gene sets, particularly the E2F and MYC targets (Figure 5).
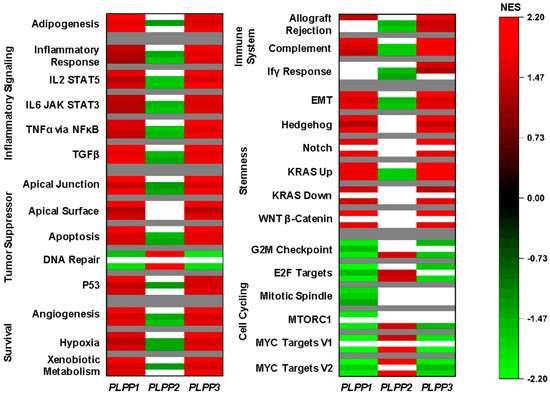
Figure 5.
Gene set enrichment analysis (GSEA) for the LPPs in breast cancer. For all Hallmark gene sets listed, the top bar indicates the normalized enrichment score (NES) from the TCGA cohort, the middle bar from the METABRIC cohort, and the lower bar from the GSE96508 cohort. A false discovery rate (FDR) of less than 0.25 was considered statistically significant. White bars indicate no significance.
3.3. LPP1 and LPP3 Are Predominantly Expressed in Tumor Stroma, While LPP2 Is Expressed in Cancer Cells, and a Low Tumor LPP1/3 and High LPP2 Expression Pattern Correlates to Immune System Evasion
We next examined LPP expression within the tumor microenvironment. When comparing whole breast tumors to normal breast tissues, tumors expressed significantly less LPP1 and LPP3 than normal tissue, while tumors expressed more LPP2 than normal tissues (Figure 6A). We then examined LPP gene expression in two cohorts of single-cell RNA sequencing to determine the cell origins of predominant expression. Tumor LPP1 was primarily expressed in endothelial cells, followed by cancer-associated fibroblasts (CAFs), whereas most LPP3 was associated with CAFs, followed by endothelial cells (Figure 6B,C). For epithelial cells, LPP1/3 expression was decreased in cancer epithelial cells compared with normal epithelial cells (Figure 6B,C). Virtually all LPP2 expression was epithelial-cell-based (cancer and normal), followed by myoepithelial cells (Figure 6B,C).
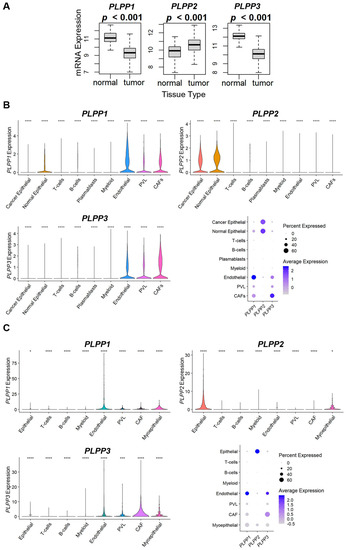
Figure 6.
LPP gene expression in normal tissues and tumors and violin and dot plot analysis of LPP expression for single cell RNA sequencing of breast cancer tumors. (A) LPP gene expression from 114 normal breast tissues is compared to 1090 breast cancer tumors from the TCGA database. The results are plotted as box plots. The bolded center bar represents the median; the lower and upper box bounds represent the 25th and 75th percentiles, respectively; and the lower and upper tails represent the minimum and maximum values, respectively. (B) Single-cell RNA sequencing results from the cohort described in [35], comprised of 26 tumors (11 ER+ HER2−, 5 HER2+, and 10 TNBC), with a total of 130,246 single cells. (C) Single-cell RNA sequencing results from the cohort described in [36], comprised of 5 TNBC tumors, with a total of 24,271 single cells. For results in (B,C), violin plot results for the individual LPP genes are shown following t-test for each type compared with the base mean (* p ≤ 0.05, *** p ≤ 0.001, **** p ≤ 0.0001). The summary chart shows the overall percentage of the total LPP expression by cell type and the average expression within each cell type for each cohort.
We then used the xCell algorithm to examine tumor cell populations based on dichotomized LPP expression. Epithelial cell (primarily cancer cells) composition was significantly enriched in high LPP2 tumors across all three cohorts (p < 0.001, Figure 7). For LPP1 and LPP3, there was no significant trend or correlation to epithelial cell composition (Figure 7).
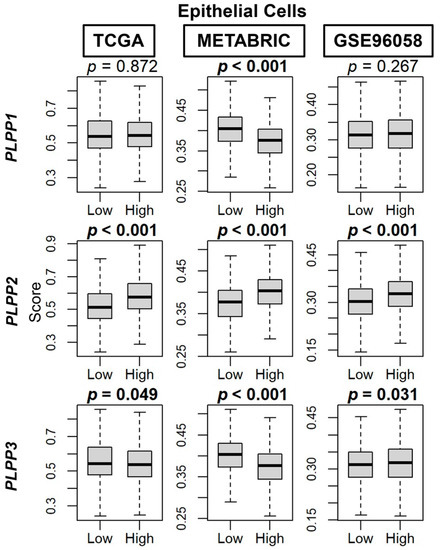
Figure 7.
Epithelial cell composition correlation with LPP expression in breast cancer tumors. Box plots are based on the xCell algorithm for the TCGA, METABRIC, and GSE96058 cohorts. LPP gene expression is dichotomized into low and high groups by the median. The bolded center bar represents the median; the lower and upper box bounds represent the 25th and 75th percentiles, respectively; and the lower and upper tails represent the minimum and maximum values, respectively.
Scores by Thorsson et al. [44] demonstrated an enriched TGF-β response, a marker of stromal fibrosis, in high LPP1- and LPP3-expressing tumors, as well as decreased scores in high LPP2-expressing tumors (all p < 0.001, Figure 8A). These patterns of high cell type composition in high LPP1- and LPP3-expressing tumors and low cell type composition in high LPP2-expressing tumors were subsequently significantly reflected in the xCell algorithm scores of TME fibroblasts, adipocytes, and preadipocytes in all three cohorts (all p < 0.001, Figure 8B–D). Similarly, overall endothelial cell composition was significantly enriched for both high LPP1- and LPP3-expressing tumors, and additionally for both microvascular and lymphatic endothelial cells (all p < 0.001, Figure 9A–C). The results for LPP2 were more variable. Endothelial cell composition was significantly reduced in high LPP2-expressing tumors in TCGA and GSE96058 (p < 0.001), but not in METABRIC (Figure 9A). Microvascular endothelial cell composition was slightly increased in TCGA cohort in high LPP2-expressing tumors, but decreased in the other two cohorts (all p < 0.005, Figure 9B). In all three cohorts, lymphatic endothelial cell composition was significantly decreased in high LPP2-expressing tumors (Figure 9C). In high LPP1-expressing tumors, pericyte composition was significantly increased in all three cohorts (all p ≤ 0.001, Figure 9D), but there were no consistently significant results for the other two LPPs (Figure 9D).
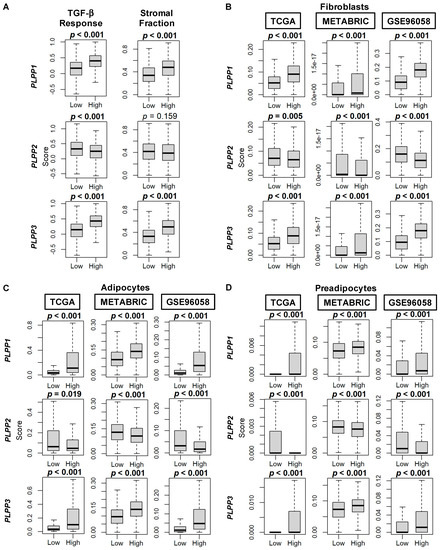
Figure 8.
TGF-β and stromal fraction scores, and fibroblast, adipocyte, and preadipocyte composition correlation with LPP gene expression in breast cancer tumors. (A) Box plots of TGF-β and stromal fraction scores. Data are based on the scores by Thorsson, et al. [44]. (B) Box plots of fibroblast cell composition. (C) Box plots of adipocyte cell composition. (D) Box plots of preadipocyte cell composition. Data in B–D based on the xCell algorithm for the TCGA, METABRIC, and GSE96058 cohorts. LPP gene expression is dichotomized into low and high groups by the median. The bolded center bar represents the median; the lower and upper box bounds represent the 25th and 75th percentiles, respectively; and the lower and upper tails represent the minimum and maximum values, respectively.
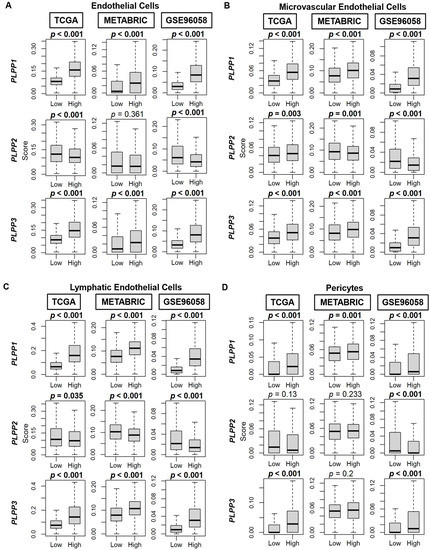
Figure 9.
Endothelial cell, microvascular endothelial cell, lymphatic endothelial cell, and pericyte composition correlation with LPP gene expression in breast cancer tumors. (A) Box plots of endothelial cell composition. (B) Box plots of microvascular endothelial cell composition. (C) Box plots of lymphatic endothelial cell composition. (D) Box plots of pericyte composition. All data are based on the xCell algorithm for the TCGA, METABRIC, and GSE96058 cohorts. LPP gene expression is dichotomized into low and high groups by the median. The bolded center bar represents the median; the lower and upper box bounds represent the 25th and 75th percentiles, respectively; and the lower and upper tails represent the minimum and maximum values, respectively.
Immune cell populations were then correlated to LPP gene expression. For anti-cancer CD8+ T cells, LPP1 and LPP2 did not demonstrate significance or a consistent trend across the three cohorts, but for the high LPP3-expressing tumors, CD8+ T cells were slightly elevated compared with the low LPP3-expressing tumors (all p < 0.001, Figure S5A). Th1 cells were decreased in the high LPP1- and LPP3-expressing tumors, but increased for high LPP2-expressing tumors (all p < 0.001, Figure S5B). M1 macrophages were decreased in the high LPP1-expressing tumors (all p < 0.001), but there was no effect across the cohorts for LPP2 and LPP3 (Figure S5C). Dendritic cells were significantly increased in both high LPP1- and LPP3-expressing tumors across all three cohorts (all p < 0.02), and decreased for high LPP2-expressing tumors in the METABRIC and GSE96058 cohorts (p < 0.001, Figure S5D). Among the pro-cancer immune cell populations, Tregs were significantly reduced in high LPP1-expressing tumors across all three cohorts (p < 0.001), but no consistent trends were seen for LPP2 or LPP3 (Figure S6A). For Th2 cells, there was no concordance in results across the three cohorts for any of the LPPs (Figure S6B). High LPP2-expressing tumors had lower levels of M2 macrophages (all p < 0.02), but there were no consistent differences for LPP1/3 tumors (Figure S6C).
Taken together, upon examination of immune-related scores by Thorsson, et al. [44], high LPP1- and LPP3-expressing tumors had higher scores for leukocyte fraction, lymphocyte infiltration, and macrophage regulation than their low expressing counterparts (all p < 0.001, Figure 10A). For LPP2 tumors, among these three scores, macrophage regulation scores were decreased in high LPP2-expessing tumors (p < 0.001, Figure 10A). The tumor-infiltrating lymphocyte (TIL) fraction was decreased in high LPP1-expressing tumors (p < 0.001), but there was no difference by LPP2 or LPP3 expression (Figure 10A). The wound healing score was decreased in both high LPP1- and LPP3-expressing tumors and increased in high LPP2-expressing tumors (all p < 0.001, Figure 10B). Finally, upon analysis of cytolytic activity (CYT), both high LPP1- and LPP3-expressing tumors had significantly higher CYT scores compared with low expressing tumors in all three cohorts (all p < 0.001), while high LPP2-expressing tumors had lower CYT scores only in the METABRIC and GSE96058 cohorts (both p < 0.001, Figure 10B).
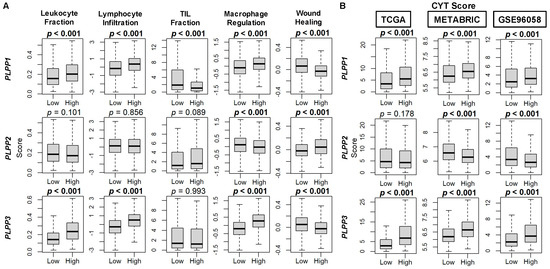
Figure 10.
Immune scores for markers of tumor immune cell populations and cytolytic (CYT) score correlation with LPP gene expression in breast cancer tumors. (A) Box plots of immune score results are based on score by Thorsson, et al. [44]. (B) Box plots of CYT scores based on the xCell algorithm for TCGA, METABRIC, and GSE96058 cohorts. LPP gene expression is dichotomized into low and high groups by the median. The bolded center bar represents the median; the lower and upper box bounds represent the 25th and 75th percentiles, respectively; and the lower and upper tails represent the minimum and maximum values, respectively.
4. Discussion
Pathological expression of LPPs in cancers, including breast cancer, is canonically characterized by decreased LPP1/3 and increased LPP2 expression. This finding has been well documented in multiple lines of investigation using cancer cell cultures and extended to murine allograft and xenograft orthotopic breast cancer models [8,9,15,17,19,20]. As a result, particularly attributable to decreased LPP1/3, turnover of extracellular LPA and other bioactive lipids is decreased in breast cancer cell cultures and tumors relative to normal breast tissue. When coupled to increased LPA production through increased tumor microenvironment ATX expression and activity, the net effect is an increase in LPA concentrations for signaling through LPARs to amplify disease progression [4,6]. We previously showed that breast cancer cells transduced with catalytically active LPP1 form smaller tumors with decreased metastasis in orthotopic mouse models [15]. Mechanistically, low LPP1 expression is associated with increased levels of cyclin D1/D3 and matrix metalloproteinases secondary to increased transcription by cFOS and cJUN [17]. Similar work in SKOV3 ovarian cancer cells also demonstrated decreased tumor growth in nude mice with LPP3 overexpression [46]. While LPP1 and LPP3 may function in a seemingly complementary manner, there are important physiological differences between the two enzymes: LPP3 knockout mice are not viable [47], whereas both LPP1- and LPP2-knockout mice are viable [26,48]. The effects of LPP2 on tumor growth are significantly different from LPP1/3, in that its overexpression in cancer cells leads to premature S-phase cell entry via upregulation of c-Myc nuclear expression [19,20].
The findings of this study agree with the LPP cancer cell biology of pre-clinical investigations [8,9,15,17,19,20] and represent the most comprehensive analysis to date in human breast tumors, with over 5000 specimens examined in three independent databases. We confirmed on whole tumor analysis that breast tumors had lower LPP1/3 and higher LPP2 expression compared with normal tissue. On single-cell RNA-seq analysis, most tumor LPP1/3 was expressed in tumor stromal cell populations, such as endothelial cells and fibroblasts, and LPP2 was predominantly found in cancer epithelial cells. The most upregulated gene sets in high LPP2-expressing tumors related to cell cycle progression via E2F and c-Myc pathways. Cytolytic activity scores were decreased in low LPP1-/3-expressing tumors and increased in high LPP2-expressing tumors, suggesting that this expression pattern aided in tumor immune cell evasion. This same LPP expression pattern correlated with bworsened tumor grade, increased proliferation rates, and decreased overall survival. Hence, developing therapies to either increase LPP1/3 expression in cancer cells within the tumor, or the use of LPP2 inhibitors to block endo-LPP catalytic activity, is warranted. To date, there are no specific LPP2 inhibitors with adequate bioavailability. We previously reported that tetracycline can increase LPP1/3 protein stability in breast cancer cells [24] and LPP1 expression can be induced by suppression of inflammatory signaling with dexamethasone [49]. While these drugs are most likely exerting these effects on LPP1s in a non-specific fashion, the results do provide proof-of-principle that LPP1/3 can be pharmacologically manipulated.
This study has several limitations. Although we use three independent large cohorts to validate our results, this analysis is retrospective in nature with heterogenous patient populations and treatments. Additionally, though clinical, survival, and tumor microenvironment data were derived from three independent cohorts, the various scores from Thorsson et al. [44] used to further support our findings are only available from TCGA data. While the results from bioinformatic real world data can provide useful comparators to findings from pre-clinical investigations, causative mechanisms cannot necessarily be extracted from correlative data. However, our results using human tumor genomic and clinical data are concordant with long-standing models of LPP signaling obtained from preclinical cell culture and murine model studies [8,9,15,17,19,20]. These studies demonstrate that changes in LPP mRNA expression translate directly into changes in LPP activity levels, and the mechanisms of LPP function within the cancer cell have been well demonstrated in these investigations [8,9,15,17,19,20]. Unfortunately, there are no assays available to measure specific LPP subtype enzymatic activity. Any measurement of LPP activity represents the total LPP enzyme contribution from all three enzymes, explaining why mRNA measurements have been the backbone of LPP research. Further validation of the effect of individual LPP subtype activity on cancer biology and the tumor microenvironment will require the design of selective compounds that target the individual members of the LPP family. Nevertheless, because the results in human breast cancer tumors presented in this paper are well reflected in previous translational studies on LPP biology, this work supports the therapeutic potential of decreasing the expressions of LPP2 relative to LPP1/3 in breast and possibly other cancers, and encourages the future development of novel adjunct therapies.
5. Conclusions
Decreased LPP1/3 and increased LPP2 expression correlate with the characteristics of an overall worse survival in breast cancer patients. Tumors with these expression profiles have higher grades, higher proliferation rates, higher rates of mutational burden, increased ability to evade the immune system, and decreased overall survival. These findings are concordant with the biology of pre-clinical models in vitro and in vivo. Therefore, we predict that this evolving understanding of LPP tumor biology should be readily translatable to the development of therapeutic interventions against aberrant expression of these enzymes, particularly inhibitors against LPP2 overexpression.
Supplementary Materials
The following supporting information can be downloaded at https://www.mdpi.com/article/10.3390/cancers15082299/s1. Figure S1: LPP gene expression by breast cancer tumor nodal status and metastasis; Figure S2: Survival plots for low and high LPP gene expression in breast tumors for the estrogen receptor (ER) positive, human epidermal growth factor receptor (HER2) negative cohort for each dataset; Figure S3: Survival plots for low and high LPP gene expression in breast tumors for the human epidermal growth factor receptor (HER2) positive cohort for each dataset; Figure S4: Survival plots for low and high LPP gene expression in breast tumors for the triple negative breast cancer (TNBC) cohort for each dataset; Figure S5: Anti-cancerous immune cell correlation with LPP gene expression in breast cancer tumors; Figure S6: Pro-cancerous immune cell correlation with LPP gene expression in breast cancer tumors; Table S1: Raw GSEA output for LPP1–3.
Author Contributions
Conceptualization, M.G.K.B. and K.T.; Methodology, M.G.K.B., R.W., and K.T.; Formal Analysis, M.G.K.B., R.W., X.T., and D.N.B., Writing—Original Draft Preparation, M.G.K.B., Writing—Review and Editing, R.W., X.T., D.N.B., and K.T.; Supervision, D.N.B., T.I., and K.T.; Project Administration, K.T. All authors have read and agreed to the published version of the manuscript.
Funding
This research was supported by the National Institutes of Health, USA grant number R37CA248018, R01CA250412, R01CA251545, and R01EB029596; the U.S. Department of Defense BCRP grant numbers W81XWH-19-1-0674 and W81XWH-19-1-0111 to K.T.; and the National Cancer Institute Cancer Center Support Grant P30CA016056 to Roswell Park Comprehensive Cancer Center.
Institutional Review Board Statement
This study uses publicly available data and is therefore exempt from ethics approval.
Informed Consent Statement
This study uses publicly available data and is therefore exempt from informed consent.
Data Availability Statement
All datasets are publicly available via cBioPortal (https://www.cbioportal.org (accessed on 9 October 2022)) or the Gene Expression Omnibus (GEO) repository of the United States National Institutes of Health (https://www.ncbi.nlm.nih.gov/geo (accessed on 9 October 2022)), and single-cell cohort data via the Broad Institute Single Cell Portal (https://singlecell.broadinstitute.org/single_cell (accessed on 9 October 2022)).
Conflicts of Interest
The authors report no proprietary or commercial interest in any product mentioned or concept discussed in this article. D.N.B. is a member of the Scientific and Clinical Advisory Boards of iOnctura and receives funding for a postdoctoral fellow from iOnctura to work on an ATX inhibitor, but he has no commercial interests in the company. The funders had no role in the design of the study; in the collection, analyses, or interpretation of data; in the writing of the manuscript; or in the decision to publish the results.
References
- Braunstein, L.Z.; Taghian, A.G.; Niemierko, A.; Salama, L.; Capuco, A.; Bellon, J.R.; Wong, J.S.; Punglia, R.S.; MacDonald, S.M.; Harris, J.R. Breast-cancer subtype, age, and lymph node status as predictors of local recurrence following breast-conserving therapy. Breast Cancer Res. Treat. 2017, 161, 173–179. [Google Scholar] [CrossRef] [PubMed]
- Wang, R.; Zhu, Y.; Liu, X.; Liao, X.; He, J.; Niu, L. The clinicopathological features and survival outcomes of patients with different metastatic sites in stage iv breast cancer. BMC Cancer 2019, 19, 1091. [Google Scholar] [CrossRef] [PubMed]
- Centers for Disease Control and Prevention. U.S. Cancer Statistics Female Breast Cancer Stat Bite; US Department of Health and Human Services: Washington, DC, USA, 2022.
- Benesch, M.G.K.; Tang, X.; Brindley, D.N. Autotaxin and breast cancer: Towards overcoming treatment barriers and sequelae. Cancers 2020, 12, 374. [Google Scholar] [CrossRef] [PubMed]
- Lainetti, P.F.; Leis-Filho, A.F.; Laufer-Amorim, R.; Battazza, A.; Fonseca-Alves, C.E. Mechanisms of resistance to chemotherapy in breast cancer and possible targets in drug delivery systems. Pharmaceutics 2020, 12, 1193. [Google Scholar] [CrossRef]
- Benesch, M.G.K.; Yang, Z.; Tang, X.; Meng, G.; Brindley, D.N. Lysophosphatidate signaling: The tumor microenvironment’s new nemesis. Trends Cancer 2017, 3, 748–752. [Google Scholar] [CrossRef]
- Brindley, D.N.; Tang, X.; Meng, G.; Benesch, M.G.K. Role of adipose tissue-derived autotaxin, lysophosphatidate signaling, and inflammation in the progression and treatment of breast cancer. Int. J. Mol. Sci. 2020, 21, 5938. [Google Scholar] [CrossRef]
- Tang, X.; Benesch, M.G.; Brindley, D.N. Lipid phosphate phosphatases and their roles in mammalian physiology and pathology. J. Lipid Res. 2015, 56, 2048–2060. [Google Scholar] [CrossRef]
- Morris, A.J.; Smyth, S.S. Lipid phosphate phosphatases: More than one way to put the brakes on lpa signaling? J. Lipid Res. 2014, 55, 2195–2197. [Google Scholar] [CrossRef]
- Kok, B.P.; Venkatraman, G.; Capatos, D.; Brindley, D.N. Unlike two peas in a pod: Lipid phosphate phosphatases and phosphatidate phosphatases. Chem. Rev. 2012, 112, 5121–5146. [Google Scholar] [CrossRef]
- Jasinska, R.; Zhang, Q.X.; Pilquil, C.; Singh, I.; Xu, J.; Dewald, J.; Dillon, D.A.; Berthiaume, L.G.; Carman, G.M.; Waggoner, D.W.; et al. Lipid phosphate phosphohydrolase-1 degrades exogenous glycerolipid and sphingolipid phosphate esters. Biochem. J. 1999, 340 Pt 3, 677–686. [Google Scholar] [CrossRef]
- Benesch, M.G.K.; Ko, Y.M.; McMullen, T.P.W.; Brindley, D.N. Autotaxin in the crosshairs: Taking aim at cancer and other inflammatory conditions. FEBS Lett. 2014, 588, 2712–2727. [Google Scholar] [CrossRef] [PubMed]
- Benesch, M.G.; Tang, X.; Venkatraman, G.; Bekele, R.T.; Brindley, D.N. Recent advances in targeting the autotaxin-lysophosphatidate-lipid phosphate phosphatase axis in vivo. J. Biomed. Res. 2016, 30, 272–284. [Google Scholar] [PubMed]
- Lee, S.C.; Fujiwara, Y.; Tigyi, G.J. Uncovering unique roles of lpa receptors in the tumor microenvironment. Recept. Clin. Investig. 2015, 2, e440. [Google Scholar]
- Tang, X.; Benesch, M.G.; Dewald, J.; Zhao, Y.Y.; Patwardhan, N.; Santos, W.L.; Curtis, J.M.; McMullen, T.P.; Brindley, D.N. Lipid phosphate phosphatase-1 expression in cancer cells attenuates tumor growth and metastasis in mice. J. Lipid Res. 2014, 55, 2389–2400. [Google Scholar] [CrossRef]
- Nakayama, J.; Raines, T.A.; Lynch, K.R.; Slack-Davis, J.K. Decreased peritoneal ovarian cancer growth in mice lacking expression of lipid phosphate phosphohydrolase 1. PLoS ONE 2015, 10, e0120071. [Google Scholar] [CrossRef] [PubMed]
- Tang, X.; McMullen, T.P.W.; Brindley, D.N. Increasing the low lipid phosphate phosphatase 1 activity in breast cancer cells decreases transcription by ap-1 and expressions of matrix metalloproteinases and cyclin d1/d3. Theranostics 2019, 9, 6129–6142. [Google Scholar] [CrossRef] [PubMed]
- Flanagan, J.M.; Funes, J.M.; Henderson, S.; Wild, L.; Carey, N.; Boshoff, C. Genomics screen in transformed stem cells reveals rnaseh2a, ppap2c, and adarb1 as putative anticancer drug targets. Mol. Cancer Ther. 2009, 8, 249–260. [Google Scholar] [CrossRef]
- Morris, K.E.; Schang, L.M.; Brindley, D.N. Lipid phosphate phosphatase-2 activity regulates s-phase entry of the cell cycle in rat2 fibroblasts. J. Biol. Chem. 2006, 281, 9297–9306. [Google Scholar] [CrossRef]
- Tang, X.; Cromwell, C.R.; Liu, R.; Godbout, R.; Hubbard, B.P.; McMullen, T.P.W.; Brindley, D.N. Lipid phosphate phosphatase-2 promotes tumor growth through increased c-myc expression. Theranostics 2022, 12, 5675–5690. [Google Scholar] [CrossRef]
- Pilquil, C.; Dewald, J.; Cherney, A.; Gorshkova, I.; Tigyi, G.; English, D.; Natarajan, V.; Brindley, D.N. Lipid phosphate phosphatase-1 regulates lysophosphatidate-induced fibroblast migration by controlling phospholipase d2-dependent phosphatidate generation. J. Biol. Chem. 2006, 281, 38418–38429. [Google Scholar] [CrossRef]
- Pyne, S.; Kong, K.C.; Darroch, P.I. Lysophosphatidic acid and sphingosine 1-phosphate biology: The role of lipid phosphate phosphatases. Semin. Cell Dev. Biol. 2004, 15, 491–501. [Google Scholar] [CrossRef] [PubMed]
- Samadi, N.; Bekele, R.; Capatos, D.; Venkatraman, G.; Sariahmetoglu, M.; Brindley, D.N. Regulation of lysophosphatidate signaling by autotaxin and lipid phosphate phosphatases with respect to tumor progression, angiogenesis, metastasis and chemo-resistance. Biochimie 2011, 93, 61–70. [Google Scholar] [CrossRef] [PubMed]
- Tang, X.; Zhao, Y.Y.; Dewald, J.; Curtis, J.M.; Brindley, D.N. Tetracyclines increase lipid phosphate phosphatase expression on plasma membranes and turnover of plasma lysophosphatidate. J. Lipid Res. 2016, 57, 597–606. [Google Scholar] [CrossRef] [PubMed]
- Tanyi, J.L.; Hasegawa, Y.; Lapushin, R.; Morris, A.J.; Wolf, J.K.; Berchuck, A.; Lu, K.; Smith, D.I.; Kalli, K.; Hartmann, L.C.; et al. ;Role of decreased levels of lipid phosphate phosphatase-1 in accumulation of lysophosphatidic acid in ovarian cancer. Clin. Cancer Res. 2003, 9, 3534–3545. [Google Scholar] [PubMed]
- Tomsig, J.L.; Snyder, A.H.; Berdyshev, E.V.; Skobeleva, A.; Mataya, C.; Natarajan, V.; Brindley, D.N.; Lynch, K.R. Lipid phosphate phosphohydrolase type 1 (lpp1) degrades extracellular lysophosphatidic acid in vivo. Biochem. J. 2009, 419, 611–618. [Google Scholar] [CrossRef]
- Palmer, S.M.; Snyder, L.; Todd, J.L.; Soule, B.; Christian, R.; Anstrom, K.; Luo, Y.; Gagnon, R.; Rosen, G. Randomized, double-blind, placebo-controlled, phase 2 trial of bms-986020, a lysophosphatidic acid receptor antagonist for the treatment of idiopathic pulmonary fibrosis. Chest 2018, 154, 1061–1069. [Google Scholar] [CrossRef]
- ClinicalTrials.gov. A Study to Assess an Atx Inhibitor (ioa-289) in Patients with Metastatic Pancreatic Cancer. National Institute of Health. 2022. Available online: https://clinicaltrials.gov/ct2/show/ (accessed on 1 February 2023).
- Helmer, E.; Willson, A.; Brearley, C.; Westerhof, M.; Delage, S.; Shaw, I.; Cooke, R.; Sidhu, S. Pharmacokinetics and metabolism of ziritaxestat (glpg1690) in healthy male volunteers following intravenous and oral administration. Clin. Pharmacol. Drug Dev. 2022, 11, 246–256. [Google Scholar] [CrossRef]
- Banerjee, S.; Lee, S.; Norman, D.D.; Tigyi, G.J. Designing dual inhibitors of autotaxin-lpar gpcr axis. Molecules 2022, 27, 5487. [Google Scholar] [CrossRef]
- Meduri, B.; Pujar, G.V.; Durai Ananda Kumar, T.; Akshatha, H.S.; Sethu, A.K.; Singh, M.; Kanagarla, A.; Mathew, B. Lysophosphatidic acid (lpa) receptor modulators: Structural features and recent development. Eur. J. Med. Chem. 2021, 222, 113574. [Google Scholar] [CrossRef]
- Wu, R.; Yu, I.; Tokumaru, Y.; Asaoka, M.; Oshi, M.; Yan, L.; Okuda, S.; Ishikawa, T.; Takabe, K. Elevated bile acid metabolism and microbiome are associated with suppressed cell proliferation and better survival in breast cancer. Am. J. Cancer Res. 2022, 12, 5271–5285. [Google Scholar]
- Oshi, M.; Tokumaru, Y.; Benesch, M.G.; Sugito, N.; Wu, R.; Yan, L.; Yamada, A.; Chishima, T.; Ishikawa, T.; Endo, I.; et al. High mir-99b expression is associated with cell proliferation and worse patient outcomes in breast cancer. Am. J. Cancer Res. 2022, 12, 4840–4852. [Google Scholar] [PubMed]
- Lonsdale, J.; Thomas, J.; Salvatore, M.; Phillips, R.; Lo, E.; Shad, S.; Hasz, R.; Walters, G.; Garcia, F.; Young, N.; et al. The genotype-tissue expression (gtex) project. Nat. Genet. 2013, 45, 580–585. [Google Scholar] [CrossRef] [PubMed]
- Wu, S.Z.; Al-Eryani, G.; Roden, D.L.; Junankar, S.; Harvey, K.; Andersson, A.; Thennavan, A.; Wang, C.; Torpy, J.R.; Bartonicek, N.; et al. A single-cell and spatially resolved atlas of human breast cancers. Nat. Genet. 2021, 53, 1334–1347. [Google Scholar] [CrossRef] [PubMed]
- Wu, S.Z.; Roden, D.L.; Wang, C.; Holliday, H.; Harvey, K.; Cazet, A.S.; Murphy, K.J.; Pereira, B.; Al-Eryani, G.; Bartonicek, N.; et al. Stromal cell diversity associated with immune evasion in human triple-negative breast cancer. EMBO J. 2020, 39, e104063. [Google Scholar] [CrossRef]
- Liberzon, A.; Birger, C.; Thorvaldsdóttir, H.; Ghandi, M.; Mesirov, J.P.; Tamayo, P. The molecular signatures database (msigdb) hallmark gene set collection. Cell Syst. 2015, 1, 417–425. [Google Scholar] [CrossRef]
- Subramanian, A.; Tamayo, P.; Mootha, V.K.; Mukherjee, S.; Ebert, B.L.; Gillette, M.A.; Paulovich, A.; Pomeroy, S.L.; Golub, T.R.; Lander, E.S.; et al. Gene set enrichment analysis: A knowledge-based approach for interpreting genome-wide expression profiles. Proc. Natl. Acad. Sci. USA 2005, 102, 15545–15550. [Google Scholar] [CrossRef]
- Aran, D.; Hu, Z.; Butte, A.J. Xcell: Digitally portraying the tissue cellular heterogeneity landscape. Genome. Biol. 2017, 18, 220. [Google Scholar] [CrossRef] [PubMed]
- Tokumaru, Y.; Oshi, M.; Murthy, V.; Tian, W.; Yan, L.; Angarita, F.A.; Nagahashi, M.; Matsuhashi, N.; Futamura, M.; Yoshida, K.; et al. Low intratumoral genetic neutrophil-to-lymphocyte ratio (nlr) is associated with favorable tumor immune microenvironment and with survival in triple negative breast cancer (tnbc). Am. J. Cancer Res. 2021, 11, 5743–5755. [Google Scholar] [PubMed]
- Chouliaras, K.; Oshi, M.; Asaoka, M.; Tokumaru, Y.; Khoury, T.; Endo, I.; Ishikawa, T.; Takabe, K. Increased intratumor heterogeneity, angiogenesis and epithelial to mesenchymal transition pathways in metaplastic breast cancer. Am. J. Cancer Res. 2021, 11, 4408–4420. [Google Scholar]
- Le, L.; Tokumaru, Y.; Oshi, M.; Asaoka, M.; Yan, L.; Endo, I.; Ishikawa, T.; Futamura, M.; Yoshida, K.; Takabe, K. Th2 cell infiltrations predict neoadjuvant chemotherapy response of estrogen receptor-positive breast cancer. Gland Surg. 2021, 10, 154–165. [Google Scholar] [CrossRef]
- Oshi, M.; Asaoka, M.; Tokumaru, Y.; Angarita, F.A.; Yan, L.; Matsuyama, R.; Zsiros, E.; Ishikawa, T.; Endo, I.; Takabe, K. Abundance of regulatory t cell (treg) as a predictive biomarker for neoadjuvant chemotherapy in triple-negative breast cancer. Cancers 2020, 12, 3038. [Google Scholar] [CrossRef] [PubMed]
- Thorsson, V.; Gibbs, D.L.; Brown, S.D.; Wolf, D.; Bortone, D.S.; Ou Yang, T.H.; Porta-Pardo, E.; Gao, G.F.; Plaisier, C.L.; Eddy, J.A.; et al. The immune landscape of cancer. Immunity 2018, 48, 812–830. [Google Scholar] [CrossRef] [PubMed]
- Wakiyama, H.; Masuda, T.; Motomura, Y.; Hu, Q.; Tobo, T.; Eguchi, H.; Sakamoto, K.; Hirakawa, M.; Honda, H.; Mimori, K. Cytolytic activity (cyt) score is a prognostic biomarker reflecting host immune status in hepatocellular carcinoma (hcc). Anticancer Res. 2018, 38, 6631–6638. [Google Scholar] [CrossRef]
- Tanyi, J.L.; Morris, A.J.; Wolf, J.K.; Fang, X.; Hasegawa, Y.; Lapushin, R.; Auersperg, N.; Sigal, Y.J.; Newman, R.A.; Felix, E.A.; et al. The human lipid phosphate phosphatase-3 decreases the growth, survival, and tumorigenesis of ovarian cancer cells: Validation of the lysophosphatidic acid signaling cascade as a target for therapy in ovarian cancer. Cancer Res. 2003, 63, 1073–1082. [Google Scholar] [PubMed]
- Escalante-Alcalde, D.; Hernandez, L.; Le Stunff, H.; Maeda, R.; Lee, H.S.; Jr Gang, C.; Sciorra, V.A.; Daar, I.; Spiegel, S.; Morris, A.J.; et al. The lipid phosphatase lpp3 regulates extra-embryonic vasculogenesis and axis patterning. Development 2003, 130, 4623–4637. [Google Scholar] [CrossRef]
- Zhang, N.; Sundberg, J.P.; Gridley, T. Mice mutant for ppap2c, a homolog of the germ cell migration regulator wunen, are viable and fertile. Genesis 2000, 27, 137–140. [Google Scholar] [CrossRef]
- Meng, G.; Tang, X.; Yang, Z.; Zhao, Y.; Curtis, J.M.; McMullen, T.P.W.; Brindley, D.N. Dexamethasone decreases the autotaxin-lysophosphatidate-inflammatory axis in adipose tissue: Implications for the metabolic syndrome and breast cancer. FASEB J. 2019, 33, 1899–1910. [Google Scholar] [CrossRef]
Disclaimer/Publisher’s Note: The statements, opinions and data contained in all publications are solely those of the individual author(s) and contributor(s) and not of MDPI and/or the editor(s). MDPI and/or the editor(s) disclaim responsibility for any injury to people or property resulting from any ideas, methods, instructions or products referred to in the content. |
© 2023 by the authors. Licensee MDPI, Basel, Switzerland. This article is an open access article distributed under the terms and conditions of the Creative Commons Attribution (CC BY) license (https://creativecommons.org/licenses/by/4.0/).