Article

Lipidomic Profiling Reveals Biological Differences between Tumors of Self-Identified African Americans and Non-Hispanic Whites with Cancer

by
April E. Boyd
1,
Pamela J. Grizzard
2,
Katherine Hylton Rorie
1 and
Santiago Lima
1,3,*
1
Department of Biology, Virginia Commonwealth University, Richmond, VA 23284, USA
2
Tissue and Data Acquisition and Analysis Core, Virginia Commonwealth University, Richmond, VA 23298, USA
3
Massey Cancer Center, Richmond, VA 23298, USA
*
Author to whom correspondence should be addressed.
Cancers 2023, 15(8), 2238; https://doi.org/10.3390/cancers15082238
Submission received: 7 February 2023 / Revised: 27 March 2023 / Accepted: 5 April 2023 / Published: 11 April 2023
(This article belongs to the Special Issue Advancing Health Equity to Reduce Cancer Health Disparities)

Abstract

:

Simple Summary

In human cancers, there are molecular changes associated with their development and responses to therapy. These include changes in molecules in their membranes called sphingolipids. Understanding why and how these lipids are altered may lead to new therapies targeting these changes. Unfortunately, as in other areas of modern cancer research, we lack an understanding of how these molecules are altered in tumors of Black Americans, or whether these changes have different impacts than in White Americans. As an important first step, we used mass spectrometry to profile the sphingolipids in tumors of the colon, liver, lung, head and neck, and endometrial cancers of Black and White Americans. We found that sphingolipids with known roles in how tumors grow and respond to therapy are differentially altered in Black and White Americans. These results strongly support further research designed to determine if Black Americans may benefit from therapies that target these alterations.

Abstract

In the US, the incidence and mortality of many cancers are disproportionately higher in African Americans (AA). Yet, AA remain poorly represented in molecular studies investigating the roles that biological factors might play in the development, progression, and outcomes of many cancers. Given that sphingolipids, key components of mammalian cellular membranes, have well-established roles in the etiology of cancer progression, malignancy, and responses to therapy, we conducted a robust mass spectrometry analysis of sphingolipids in normal adjacent uninvolved tissues and tumors of self-identified AA and non-Hispanic White (NHW) males with cancers of the lung, colon, liver, and head and neck and of self-identified AA and NHW females with endometrial cancer. In these cancers, AA have worse outcomes than NHW. The goal of our study was to identify biological candidates to be evaluated in future preclinical studies targeting race-specific alterations in the cancers of AA. We have identified that various sphingolipids are altered in race-specific patterns, but more importantly, the ratios of 24- to 16-carbon fatty acyl chain-length ceramides and glucosylceramides are higher in the tumors of AA. As there is evidence that ceramides with 24-carbon fatty acid chain length promote cellular survival and proliferation, whereas 16-carbon chain length promote apoptosis, these results provide important support for future studies tailored to evaluate the potential roles these differences may play in the outcomes of AA with cancer.

1. Introduction

Sphingolipids are one of the major classes of lipids within mammalian membranes [1,2]. In cells, this broad family of metabolites has structural and functional roles and is known to be involved in the regulation of complex biological processes, such as endocytosis, autophagy, cell fate, motility, proliferation, metastasis, angiogenesis, and invasion, among others [3,4,5,6,7,8]. They may influence these by binding to and activating sphingolipid-specific cell surface receptors that trigger intracellular signaling cascades. Glycosylated sphingolipids also form microdomains in membranes that regulate and stabilize cell surface receptors and proteins and can modulate their activity and downstream signaling [9]. Therefore, dysregulation of cellular processes that control sphingolipid levels can significantly impact normal cell function and contribute to the etiology of many diseases, including cancer [8]. In cancers, it is well established that dysregulation of sphingolipid metabolism and of their signaling pathways contributes to disease development, progression, and responses to therapy. Tumors of human patients with various types of cancer have significant alterations of sphingolipid levels as compared to normal adjacent tissues [10,11,12,13,14,15,16,17,18,19,20]. There is also broad consensus that key sphingolipid-metabolism-regulating enzymes impact malignancy, responses to therapy, and prognosis, and regulators of sphingolipid levels are considered important therapeutic targets in cancer, with several being tested in clinical trials [8,21,22,23].
In the US, cancer burden and mortality are disproportionately shouldered by ethnic and racial minorities and individuals from low socioeconomic status. African American (AA) males have historically, and contemporaneously, had significantly higher cancer incidence rates and worse outcomes than non-Hispanic White (NHW) Americans [24]. In the 2022 cancer report to the nation, reporting for the period between 2014 and 2018, for all cancer sites combined, AA males had a 6% higher incidence and 19% higher mortality than NHW males [24]. Compared to NHW, AA males had a higher incidence (per 100k population) for cancers of the prostate (73% higher in AA males), lung (12% higher in AA males), liver (63% higher in AA males), colon (20% higher in AA males), and larynx (41% higher in AA males) [24]. For these cancers, mortality rates were 15% (lung), 130% (prostate), 44% (colon), 56% (liver), and 81% (larynx) higher in AA males compared to NHW males [24]. Even in cancers where AA males had lower incidence, such as those of the oral cavity (46% higher incidence in NHW males), they had higher mortality (7.3% higher in AA males) [24]. There are also disparities between NHW and AA women. For instance, although AA women had a 9% lower incidence for all sites combined, they had a 12% higher mortality rate than NHW women [24]. In breast cancer, AA women had a 3.8% lower incidence, but a 41% higher mortality rate [24]. For cancers of the corpus and uterus, AA and NHW women had similar incidence rates, but AA women had a 96% higher mortality [24]. For cervical cancers, AA women had a 22% higher incidence but 70% higher mortality [24]. AA women have also had higher incidence rates of endometrial cancers since 2002 [25], were more likely to be diagnosed with advanced-stage and aggressive uterine cancers [25], and were less likely to receive guideline-concordant care [26].
It is now understood that the principal underlying causes of health disparities relate to the perpetuation of structural inequalities and systemic discrimination in societal institutions, which significantly decrease social determinants of health among individuals from ethnic and racial minorities, and individuals of low socioeconomic status [27,28]. However, research has also identified geographical-ancestry-related biological differences in cancers that may drive aggressive disease in individuals from admixed populations, impacting outcomes independently of social determinants of health [27]. Therefore, it has been noted that a deeper understanding of all factors, including those impacting social determinants of health and biological variables, which contribute to cancer health disparities, is needed to eradicate these systemic inequalities [29]. Unfortunately, AA and individuals from other ethnic and racial minorities continue to be grossly underrepresented in modern molecular cancer studies and in clinical trials [27,30,31]. Similarly, very little is known about lipidome alterations in the tumors of AA, or whether they play a role in disease outcomes. In addition, given the recognized importance of sphingolipid alterations in the etiology of cancer and their therapeutic potential, precisely establishing how sphingolipid metabolism is altered may lead to the development of targeted therapies. Therefore, to decrease the gap in our understanding of the reprogramming of lipid metabolism in the tumors of individuals self-identifying as AA, we used methodology we previously developed [15,16] to conduct a modern sphingolipidomic analysis of the normal adjacent uninvolved (abbreviated “unin.” henceforth) tissues and tumors of self-identified AA and NHW males with lung adenocarcinoma (LUAD), colorectal adenocarcinoma (COAD), liver adenocarcinoma (HCC), and head and neck squamous cell carcinoma (HNSCC) and of AA and NHW females with endometroid endometrial carcinoma (EEC).
Given that race is a social construct and not a biological variable, geographical genetic ancestry has recently been broadly used to study associations with clinical, epidemiological, or molecular studies. However, as it has been noted, because health disparities are not only the products of genetics and depend on social and environmental factors, reporting findings based on self-identified race remains useful as these may capture associations unlinked from genetic ancestry and influenced by structural inequalities [32]. Therefore, lipidomics data obtained from individuals self-identifying as AA or NHW were analyzed in various ways to gain insight into the reprogramming of sphingolipid metabolism in these individuals, including secondary analyses of self-identified race-dependent and self-identified race-independent changes between unin. tissues and tumors by cancer type, comparisons of the unin. tissues of self-identified AA and NHW by cancer type, and comparison of the tumor tissues of self-identified AA and NHW by cancer type. In addition, to better understand the global reprogramming of sphingolipid metabolism in cancer, a pan-cancer analysis was performed where data for lung, colon, head and neck, and endometrial cancers were combined. Race-dependent and race-independent alterations were evaluated using pan-cancer data. Our study revealed that there are significant differences in the sphingolipid levels and acyl chain-length distribution of unin. tissues and tumors of self-identified AA and NHW.

2. Materials and Methods

2.1. Specimen Procurement

De-identified human lung tissues cryopreserved in optimal cutting temperature compound (OCT), obtained during standard-of-care procedures and banked when judged to be in excess of that required for patient diagnosis and treatment, were procured from the Virginia Commonwealth University (VCU) Tissue and Data Acquisition and Analysis Core (TDAAC) under a VCU IRB-approved protocol (#HM2471) as described in [15,16]. Samples were provided under an honest broker system, and biorepository participants who signed the TDAAC informed consent documentation agreed to have their residual tissues utilized for any research question, including lipidomic analysis and health information for translational research. Samples were selected based on primary histopathologic confirmed diagnoses and self-identified race. Utilizing institutionally available medical records, age at the time of diagnosis was determined using patient’s date of birth and date of biopsy or definitive surgery. After careful evaluation by a pathologist for histological type, only tumor sections with greater than 35% tumor enrichment and tissues determined to be disease-free (i.e., unin.) were selected for lipidomics studies. There were no significant differences in the tumor enrichment profiles in specimens from AA and NHW for each disease. All associated anonymized sample annotation was generated by the TDAAC SQL2000 secure biorepository database and the Cancer Informatics Core (CIC) VCU-IRB approved protocol (#HM20004765) by way of a dynamic inventory dashboard.

2.2. Patient Characteristics

Age, race, and sex characteristics of the patients whose tissues were used in this study are given in Table 1.

2.3. Specimen Processing

Prior to mass spectrometry analysis, human specimens were processed with three rounds of the “sOCTrP” method to remove OCT cryoprotectant as described with few modifications [15,16]. Briefly, tissues were resuspended in 10 mL of ice-cold (4 °C) ultrapure Milli-Q water, vortexed for 20 s, centrifuged (5000× g, 4 °C) in a swinging bucket centrifuge equipped with ClickSeal biocontainment lids (Thermo Fisher, Whaltam, MA, USA, #75007309), and the supernatant aspirated without disturbing the pellets containing the tissues. After the third round of washing/vortexing/centrifugation, tissues were resuspended in ice-cold phosphate-buffered saline (PBS; Gibco, New York, NY, USA, #20012027), transferred to a preweighed 1.5 mL tube (USA Scientific, Ocala, FL, USA, #1615-5500), centrifuged (7500× g, 4 °C), the supernatant removed, and excess liquid removed using a wick made out of laboratory grade tissue paper (Kimtech, Roswell, GA, USA, #34120) (for detailed instructions on wicking please see [15,16]). The tube and tissues were then weighed using an analytical balance and then placed on ice. For accurate data normalization, it was essential to remove as much excess liquid from tissues as possible. Tissue weights were determined as the weight of tubes + tissue minus the weight of the tube alone and used to normalize mass spectrometry data to units of lipid per mg of tissue. Samples that weighed less than 2 mg were excluded from the analysis.

2.4. Lipid Extraction

Lipids were extracted as described with minor modifications [15,16]. Briefly, washed and weighed tissues were resuspended in 300 μL of ice-cold (4 °C) PBS, and the tissues transferred to a screw cap 13 × 100 mm screw-top glass tube (VWR, #53283-800) containing 1 mL of LC-MS grade ice-cold methanol and capped (Kimble, Millville, NJ, USA, #45066C-13). Tissues in methanol could be stored at −80 °C until extraction, at which point they were removed from the freezer and allowed to equilibrate to room temperature (23 °C). Then 10 μL of internal standard solution (see below) was added to each tube with a mechanical repeating pipette (Eppendorf, Hauppauge, NY, USA) [15,16]. Tissues were then triturated for 10–20 s in a homogenizer (Homogenizer 150, Fisher Scientific, Waltham, MA, USA), followed by sonication in a Branson 2800 series ultrasonic bath (Branson Ultrasonics, Danbury, CT, USA) for 1–2 min to confirm no tissue clumps remained. If tissue clumps were observed during sonication, the tissues were further processed by repeated cycles of homogenization and sonication. Methanol and chloroform were then added to achieve a 2:1:0.1 ratio of methanol:chloroform:water, and for tissue specimens weighing 50 mg or less, an extraction volume of 3–4 mL was used (volume was adjusted accordingly for larger specimens). Tubes were then tightly capped and incubated overnight at 48 °C. The tubes were then centrifuged (5000× g, 10 min, 4 °C), the supernatant decanted into clean 13 × 100 mm borosilicate glass tubes, and the solvent evaporated under vacuum in a Speed-Vac (45 °C). The dried lipids were then resuspended in 600 μL of LC-MS grade methanol by vortexing for 10 s, followed by immersing tubes in a sonicator water bath for 20–30 s. Insoluble debris was then removed by centrifugation at 5000× g for 10 min at 4 °C, and the supernatant was carefully decanted into an autoinjector vial (VWR, #46610-724), capped (VWR, #89239-020), and stored at −80 °C until mass spectrometry analysis.

2.5. Internal Standards

Internal standards were prepared as described in [15,16]. Briefly, all standards from Avanti Polar Lipids (Alabaster, AL, USA) were added to samples as a cocktail containing 250 pmol each in 10 µL ethanol:methanol:water (7:2:1). Sphingoid base and sphingoid base 1-phosphate standards were 17-carbon chain-length analogs: C17-sphingosine, (2S,3R,4E)-2-aminoheptadec-4-ene-1,3-diol (d17:1-So); C17-sphingosine 1-phosphate, heptadecasphing-4-enine-1-phosphate (d17:1-So1P). Standards for N-acyl sphingolipids were C12-fatty acid analogs: C12-Cer, N-(dodecanoyl)-sphing-4-enine (d18:1/C12:0); C12-Cer 1-phosphate, N-(dodecanoyl)-sphing-4-enine-1-phosphate (d18:1/C12:0-Cer1P); C12-SM, N-(dodecanoyl)-sphing-4-enine-1-phosphocholine (d18:1/C12:0-SM); and C12-glucosylceramide, N-(dodecanoyl)-1-β-glucosyl-sphing-4-eine.

2.6. Retention-Time Standards

To assist integration of the correct liquid chromatography electrospray ionization tandem mass spectrometry (LC-ESI-MS/MS) multiple reaction monitoring (MRM) pairs of lipids in tissue samples, a “retention-time standard” sample was prepared by adding 10 µL containing 250 pmol of the following lipids dissolved in ethanol:methanol:water (7:2:1) to 1 mL of LC-MS grade methanol: C16:0-ceramide, N-palmitoyl-D-erythro-sphingosine (d18:1/16:0); C24:1-ceramide, N-nervonoyl-D-erythro-sphingosine (d18:1/24:1(15Z)); C16:0-glucosyl(ß) ceramide, D-glucosyl-ß-1,1′-N-palmitoyl-D-erythro-sphingosine (d18:1/16:0); C24:1-glucosyl(ß) ceramide, D-glucosyl-ß-1,1′-N-nervonoyl-D-erythro-sphingosine (d18:1/24:1(15Z)); 16:0-sphingomyelin (SM), N-palmitoyl-D-erythro-sphingosyl-phosphorylcholine (d18:1/16:0); 24:1-SM, N-nervonoyl-D-erythro-sphingosylphosphorylcholine (d18:1/24:1); C16:0-lactosyl(ß) ceramide, D-lactosyl-ß-1,1′ N-palmitoyl-D-erythro-sphingosine (d18:1/16:0); C24:1-lactosyl(ß) ceramide, D-lactosyl-ß1-1′-N-nervonoyl-D-erythro-sphingosine (d18:1/24:1). All lipids were purchased from Avanti Polar Lipids. Retention-time standards were run separately from samples containing tissue lipid extracts. For example, if 10 tissue samples were analyzed, sample 0 and sample 11 would be retention-time standards. The retention time for each of the lipids in the retention-time standard was noted and used to assist the identification and integration of the correct MRM pairs for their corresponding unknowns in the tissue samples. Because MRM pair retention times shift in a predictable manner that depends on fatty acid carbon chain length and saturation, MRM pair retention times for complex sphingolipids of fatty acid chain lengths 14:0, 18:1, 18:0, 22:0, 24:0, 26:0, and 26:1 could be easily estimated from 16:0 and 24:1 fatty acid chain-length lipids in the retention time standard as previously described [16].

2.7. Mass Spectrometry Analysis

Analysis was performed as described in [15,16,33]. For LC-ESI-MS/MS analyses, a Shimadzu Nexera LC-30 AD binary pump system coupled to a SIL-30AC autoinjector and DGU20A5R degasser coupled to an AB Sciex 5500 quadrupole/linear ion trap (QTrap) (SCIEX, Framingham, MA, USA) operating in a triple quadrupole mode were used. Q1 and Q3 were set to pass molecularly distinctive precursor and product ions (or a scan across multiple m/z in Q1 or Q3), using N2 to collisionally induce dissociations in Q2 (which was offset from Q1 by 30–120 eV); the ion source temperature set to 500 °C. For Q1 and Q3 precursor and product ion transitions, please see refs. [14] and [15], respectively. Sphingolipids were separated by reverse-phase LC on a Supelco 2.1 × 50 mm Ascentis Express C18 column (Sigma, St. Louis, MO, USA) at 35 °C using a binary solvent system (flow rate of 0.5 mL/min). Prior to injection, the column was equilibrated for 0.5 min with a solvent mixture of 95% mobile phase A1 (CH3OH:water:HCOOH, 58:41:1, v:v:v, with 5 mM ammonium formate) and 5% mobile phase B1 (CH3OH:HCOOH, 99:1, v:v, with 5 mM ammonium formate), and after sample injection (typically 5 μL), the A1/B1 ratio was maintained at 95/5 for 2.25 min, followed by a linear gradient to 100% B1 over 1.5 min, which was held at 100% B1 for 5.5 min, followed by a 0.5 min gradient return to 95/5 A1/B1. The column was re-equilibrated with 95/5 A1/B1 for 0.5 min before the next run.

2.8. Statistical Analysis

All statistical analyses were performed using Prism 8 (GraphPad, Boston, MA, USA). Mass spectrometry MRM-pair-integrated peak areas normalized per mg of tissue for analyzed lipids were examined for normality and lognormality using Anderson–Darling and D’Agostino–Pearson tests. Normalized mass spectrometry data were grouped by primary histopathologic confirmed diagnoses and self-identified race. Descriptive statistics and differences in patient age at the time of surgery were performed using unpaired two-tailed t-tests and α = 0.05. For self-identified race-independent analysis of changes between unin. tissues and tumors, and self-identified race-dependent differences between unin. tissues and tumors, data were examined by ANOVA followed by Fisher’s least significant difference (LSD) test with a 95% confidence interval for family-wise significance and confidence level. Given our intent to find all potential statistically significant alterations, uncorrected p-values were used to determine significance (α = 0.05) and are shown for all figures. However, because of this approach, for analysis that evaluates differences between unin. and tumor tissues of AA and NHW, the 95% family-wise significance and confidence intervals for each comparison were plotted and shown in Section 3.3, Section 3.4 and Section 3.5. In addition, p-adjusted values were also calculated after corrections for multiple comparisons following ANOVA by controlling for the false discovery rate (Q = 0.05) and the two-stage step-up method of Benjamini, Krieger, and Yekutieli (Prism). Multiple comparison-adjusted p-values (q) are given in Supplementary Tables alongside calculated uncorrected LSD p-values.

3. Results

3.1. Self-Identified Race-Independent and Disease-Specific Analysis of Sphingolipid Metabolism Alterations

Tissues cryopreserved in optimal cutting temperature compound were procured from a biorepository, processed, and LC-ESI-MS/MS as described in [15,16]. When data from NHW and AA were combined, relative to unin. tissues, the tumors of male subjects diagnosed with LUAD had significantly higher levels of ceramides of 16:0, 24:0, and 24:1 acyl chain lengths (Figure 1A); 16:0, 24:0, and 24:1 monohexosylceramide (monoHexCer; Figure 1B); and 16:0 lactosylceramide (lacCer; Figure 1D). In LUAD, there were no significant changes in any acyl chain length of SM (Figure 1C), nor in any of the sphingoid bases (Figure 1U). In EEC tumors from AA and NHW females combined, compared to unin. tissues, there were significantly higher levels of 16:0, 22:0, 24:1, and 24:0 ceramide (Figure 1E); 16:0, 22:0, 24:1, and 24:0 monoHexCer (Figure 1F); 14:0, 16:0, 22:0, 24:1, and 24:0 SM (Figure 1G); and 16:0, 24:1, and 24:0 lacCer (Figure 1H). There were also significantly higher levels of 18:1 sphingosine (So) and 18:0 dihydrosphingosine (Sa; Figure 1V), but not of So-1-phosphate (So-1-P) or Sa-1-phosphate (Sa-1-P; Figure 1V). COAD tumors from AA and NHW males combined had significantly higher levels of 16:0, 24:1, and 24:0 ceramide (Figure 1I); 16:0, 22:0, 24:1, and 24:0 monoHexCer (Figure 1J); 14:0 and 16:0 SM (Figure 1K); 16:0, 24:1, and 24:0 lacCer (Figure 1L), So and Sa (Figure 1W). COAD tissues also had significantly lower levels of 18:0 and 20:0 SM (Figure 1K) and no changes in So-1-P or no Sa-1-P (Figure 1W). HCC tumors from AA and NHW males combined had no significant changes in any species of ceramide (Figure 1M) or SM (Figure 1O), but significantly lower 22:0 and 24:0 monoHexCer (Figure 1N), and lower 16:0 and 22:0 lacCer (Figure 1P). HCC tumors also had significantly lower So, Sa, and So-1-P, but no changes in Sa-1-P (Figure 1X). In HNSCC tumors from male AA and NHW combined, there were significantly higher levels of 16:0, 22:0, 24:1, 24:0, and 26:0 ceramides (Figure 1Q); 16:0 and 24:0 monoHexCer (Figure 1R); 26:1 SM (Figure 1S); and 16:0, 24:1, and 24:0 lacCer (Figure 1T), but no significant differences in the levels of So, Sa, So-1-P, and Sa-1-P (Figure 1Y). In Figure 1, only unadjusted p-values are shown. For FDR/BKY-adjusted p-values (Q = 5%) and means differences (means diff.), please see Supplementary Tables S1–S5.

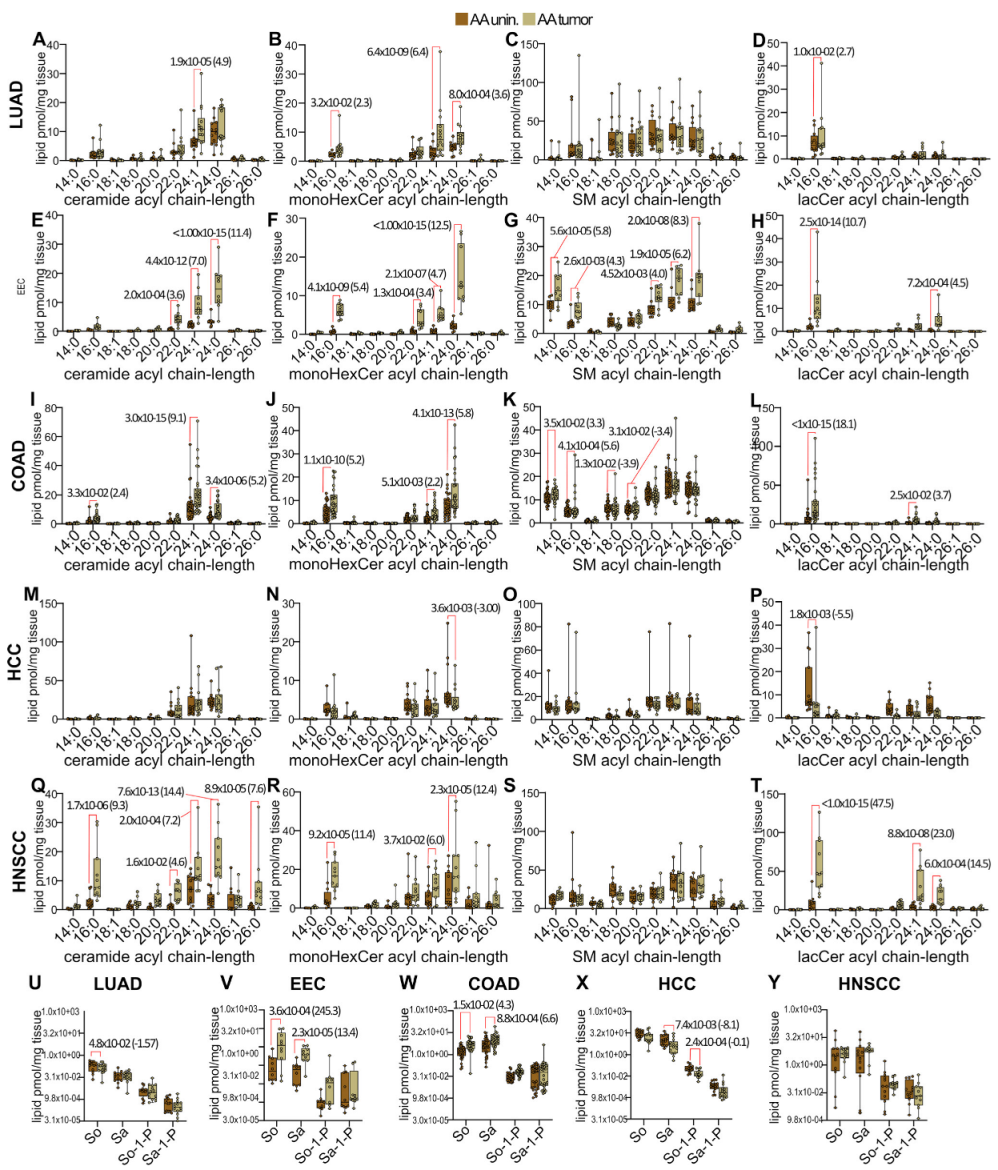
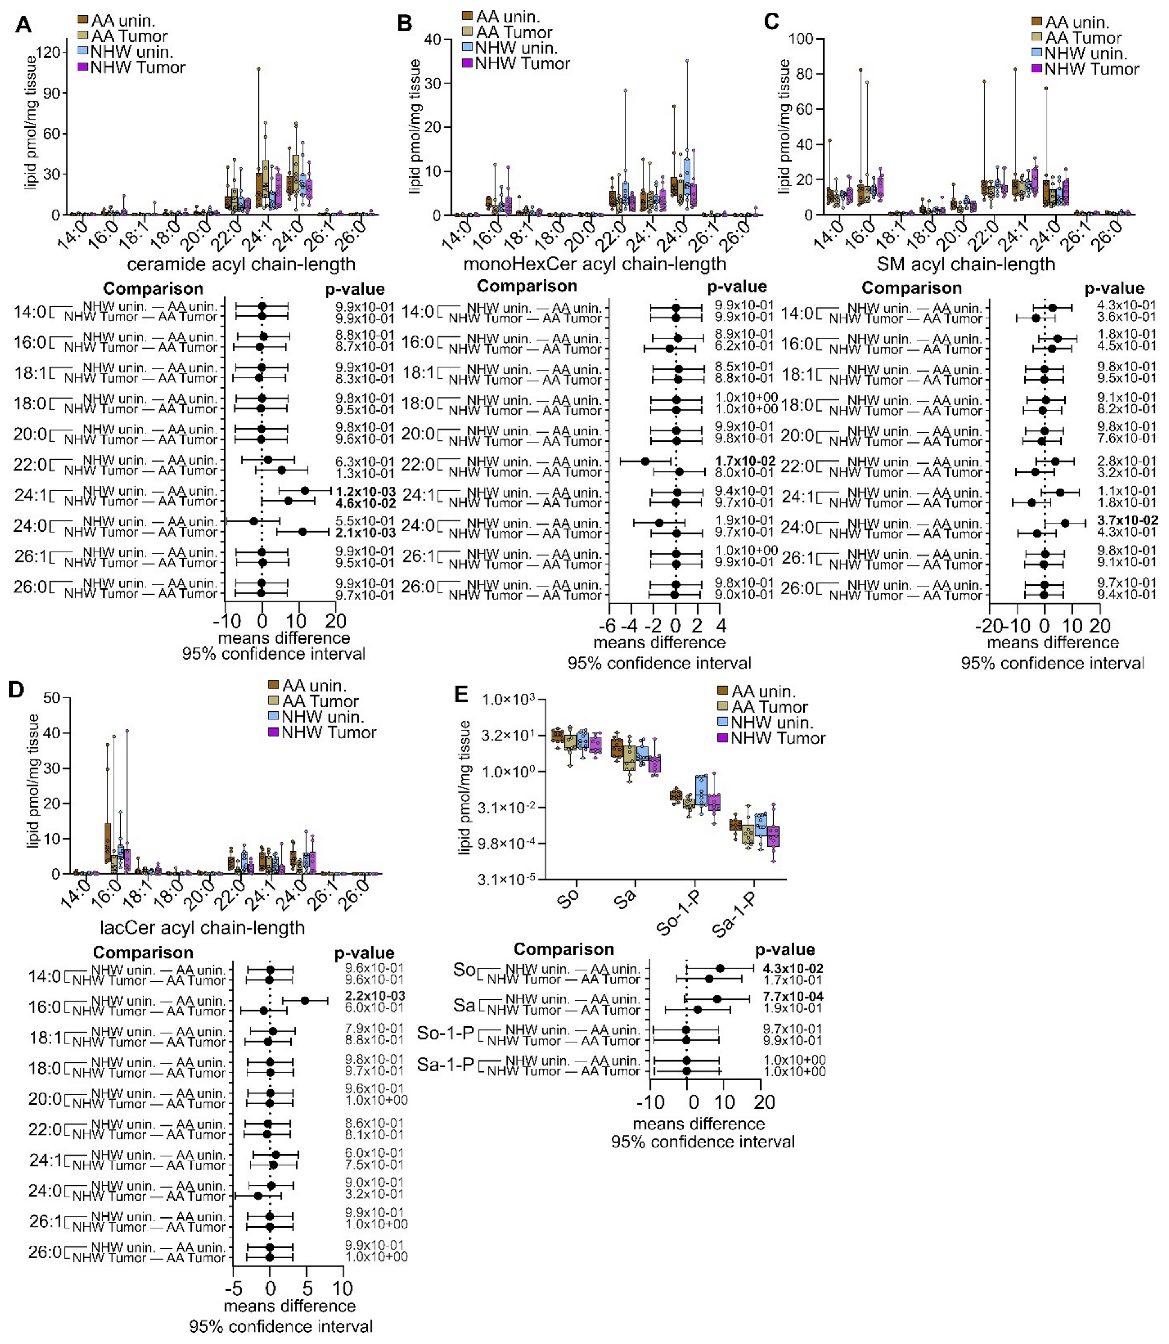
3.2. Disease-Specific Analysis of Sphingolipid Metabolism Alterations in Self-Identified AA Males and Females

In AA males diagnosed with LUAD, relative to unin. tissues, tumors had significantly higher 24:1 ceramide (Figure 2A); 16:0, 24:1, and 24:0 monoHexCer (Figure 2B); 16:0 lacCer (Figure 2D); and So (Figure 2U), but no significant changes in SM of any acyl chain length (Figure 2C) or of Sa or the phosphorylated sphingoid bases (Figure 2U). In AA females diagnosed with EEC, tumors had significantly higher levels of 22:0, 24:1, and 24:0 ceramide (Figure 2E); 16:0, 22:0, 24:1, and 24:0 monoHexCer (Figure 2F); 14:0, 16:0, 22:0, 24:1, and 24:0 SM (Figure 2G); 16:0 and 24:0 lacCer (Figure 2H); and So and Sa (Figure 2V), but not of So-1-P or Sa-1-P (Figure 2V). In AA males with COAD, tumors had significantly higher levels of 16:0, 24:1, and 24:0 ceramide (Figure 2I); 16:0, 24:1, and 24:0 monoHexCer (Figure 2J); 14:0 and 16:0 SM (Figure 2K); 16:0 and 24:1 lacCer (Figure 2L); and So and Sa, but not So-1-P or Sa-1-P (Figure 2W). Tumor tissues of AA males with COAD also had significantly lower levels of 18:0 and 20:0 SM (Figure 2K). In AA males diagnosed with HCC, tumors had significantly lower 24:0 monoHexCer (Figure 2N) and 16:0 lacCer (Figure 2P) and Sa and So-1-P (Figure 2X). There were no significant changes in the tumors of AA males with HCC in any chain length of ceramide (Figure 2M) or SM (Figure 2O), or of So or Sa-1-P (Figure 2X). The tumors of AA males diagnosed with HNSCC had significantly higher 16:0, 22:0, 24:1, 24:0, and 26:0 ceramide (Figure 2Q); 16:0, 24:1, and 24:0 monoHexCer (Figure 2R); and 16:0, 24:1, and 24:0 lacCer (Figure 2T), but no changes in SM (Figure 2S) or any of the sphingoid bases (Figure 2Y). In Figure 2, unadjusted p-values are shown. For FDR/BKY-adjusted p-values (Q = 5%) and means differences (means diff.), please see Supplementary Tables S6–S10.

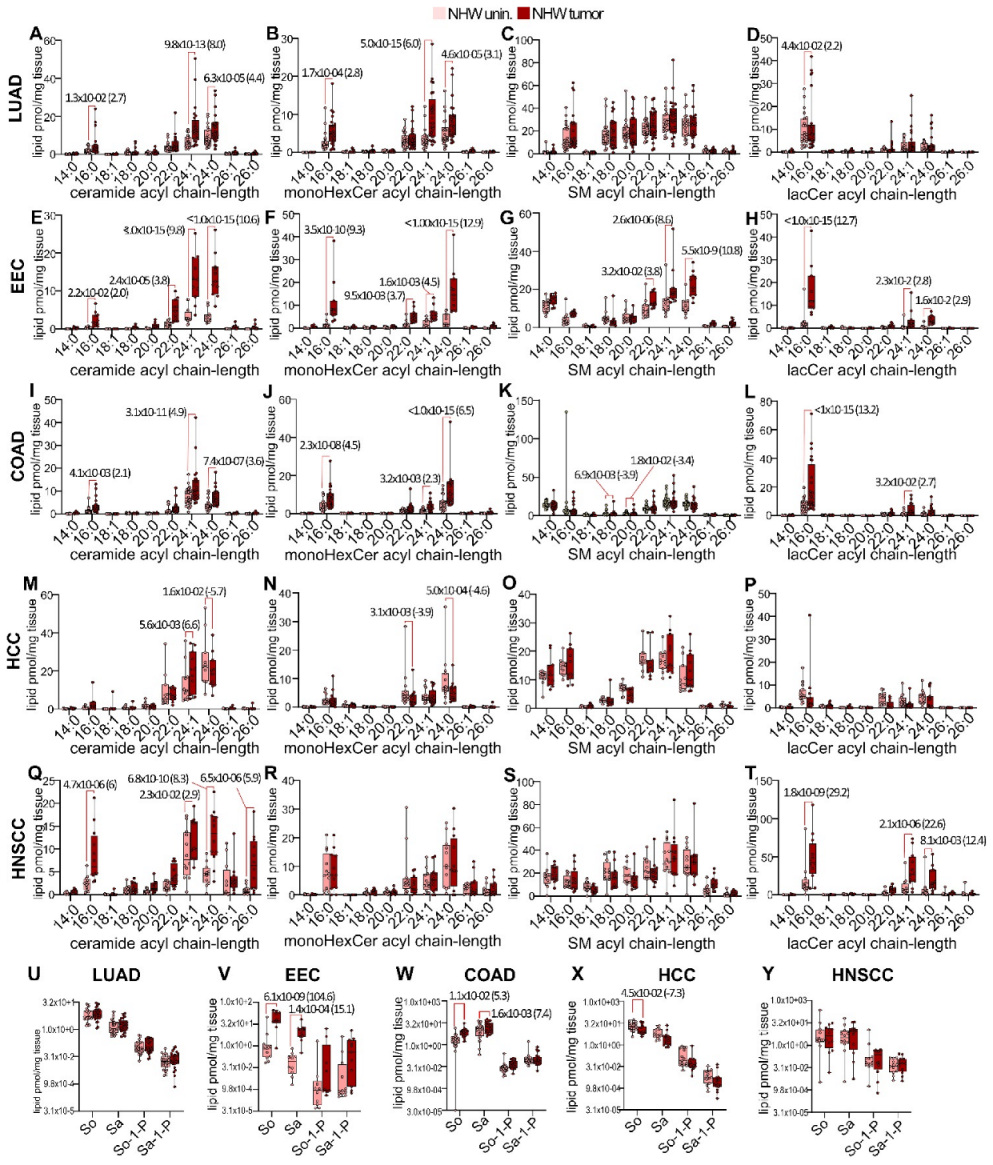
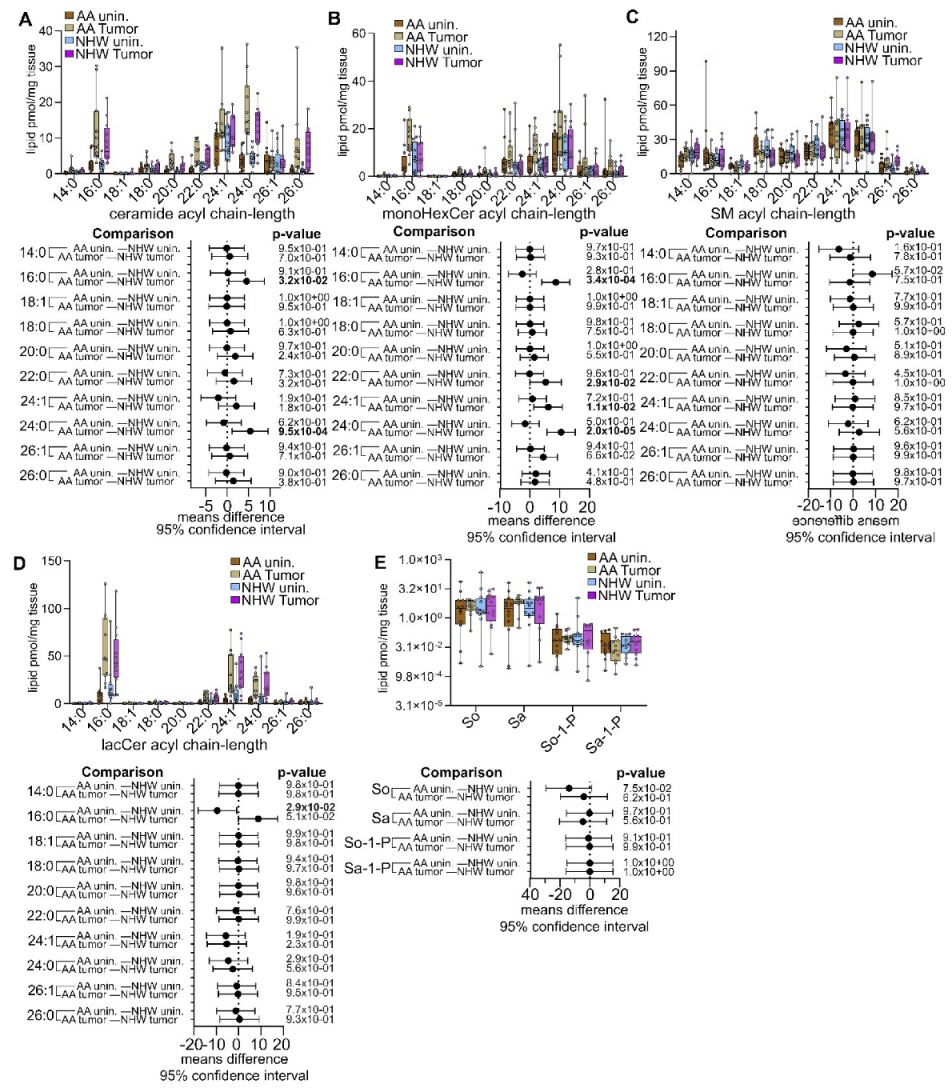
3.3. Disease-Specific Analysis of Sphingolipid Metabolism Alterations in Self-Identified NHW Males and Females

In NHW males diagnosed with LUAD, tumors had significantly higher 16:0, 24:1, and 24:0 ceramide (Figure 3A); 16:0, 24:1, and 24:0 monoHexCer (Figure 3B); and 16:0 lacCer (Figure 3D), but no significant changes in SM of any acyl chain length (Figure 3C) or any of the sphingoid bases (Figure 3U). In NHW females diagnosed with EEC, tumors had significantly higher levels of 16:0, 22:0, 24:1, and 24:0 ceramide (Figure 3E); 16:0, 22:0, 24:1, and 24:0 monoHexCer (Figure 3F); 22:0, 24:1, and 24:0 SM (Figure 3G); 16:0, 24:1, and 24:0 lacCer (Figure 3H); and So and Sa (Figure 3V), but not of So-1-P or Sa-1-P (Figure 3V). In NHW males diagnosed with COAD, tumors had significantly higher levels of 16:0, 24:1 and 24:0 ceramide (Figure 3I); 16:0, 24:1, and 24:0 monoHexCer (Figure 3J); 16:0 and 24:1 lacCer (Figure 3L); and So and Sa (Figure 3W). COAD NHW tumor tissues had significantly lower 18:0 and 20:0 SM (Figure 3K), but no changes in So-1-P and Sa-1-P (Figure 3W). Tumors of NHW males diagnosed with HCC had significantly higher 24:1 ceramide (Figure 3M), but no significant differences in SM (Figure 3O), lacCer (Figure 3P), or Sa, So-1-P, and Sa-1-P (Figure 3X). However, HCC tumors from NHW had significantly lower 22:0 and 24:0 monoHexCer (Figure 3N) and So (Figure 3X). In NHW males diagnosed with HNSCC, tumors had significantly higher 16:0, 24:1, 24:0, and 26:0 ceramide (Figure 3Q) and 16:0, 24:1, and 24:0 lacCer (Figure 3T), but no significant changes were observed in any acyl chain length of monoHexCer (Figure 2R), SM (Figure 3S) or any of the sphingoid bases (Figure 3Y).

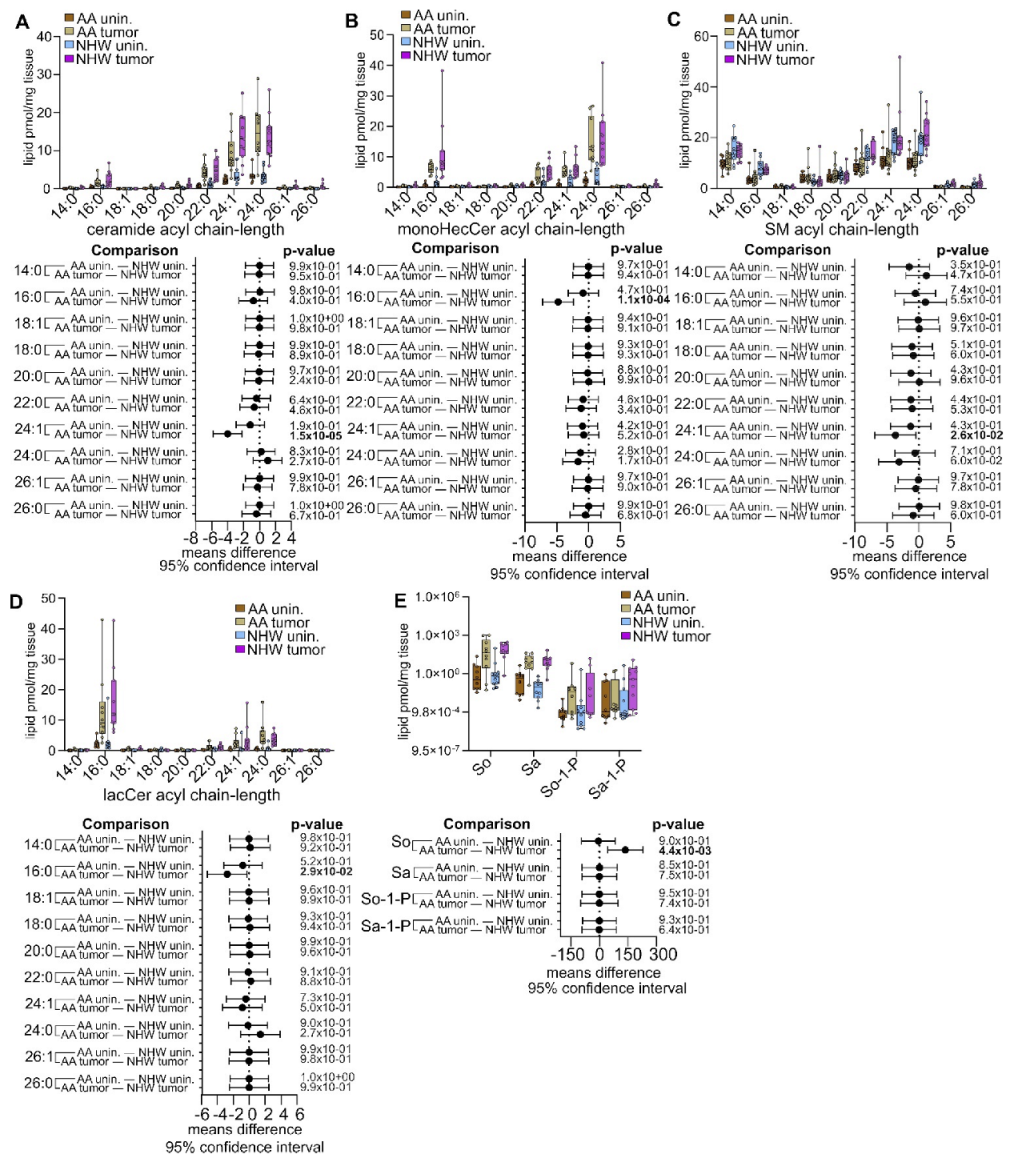
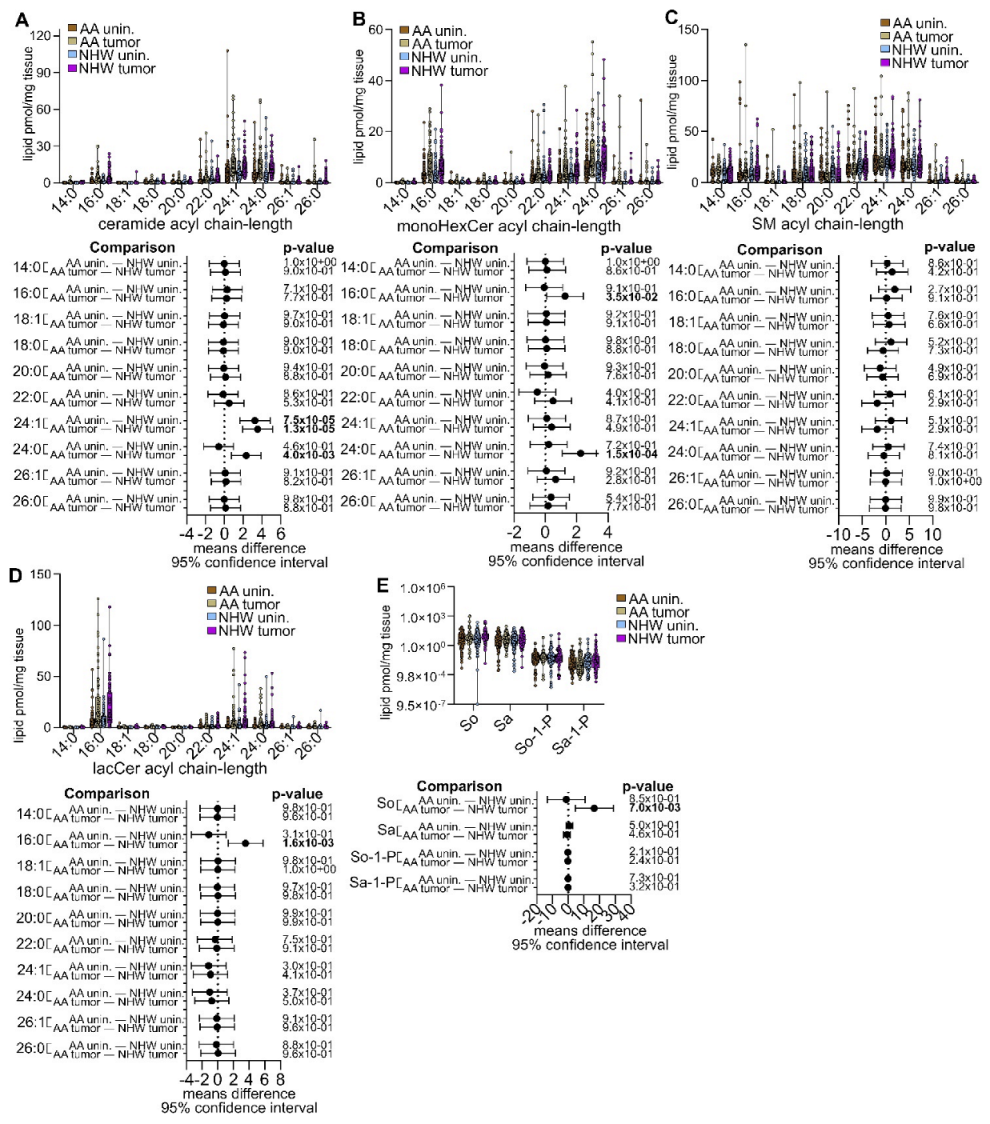
3.4. Disease-Specific Comparisons between Self-Identified AA and NHW with Cancer

Sphingolipid alterations have been associated with the etiology of cancer progression, malignant phenotypes, and responses to therapy. Therefore, a critical objective of this study was to explore differences in the sphingolipid tumor biology of self-identified AA who may be promising actionable targets to evaluate in preclinical cancer research models. To reveal potential differences, the following comparisons were made for each cancer analyzed: AA unin. • NHW unin. and AA tumor • NHW tumor. The tumors of self-identified AA males with LUAD, compared to self-identified NHW males, had significantly lower levels of 24:1 ceramide (Figure 4A), 16:0 and 24:1 lacCer (Figure 4D), and So and Sa (Figure 4E). However, the unin. tissues of AA males with LUAD had higher levels of 18:0 and 22:0 SM (Figure 4C). When comparing the tissues of AA females with EEC to NHW females with EEC, we observed that the tumors of AA females had significantly lower levels of 24:1 ceramide (Figure 5A), 16:0 monoHexCer (Figure 5B), 24:1 SM (Figure 5C), and 16:0 lacCer (Figure 5D), but significantly higher levels of So (Figure 5E). No differences were observed in AA unin. and NHW unin. comparisons between AA and NHW females with EEC (Figure 5A–E). Between AA and NHW male subjects with COAD, the tumors of AA males with COAD had significantly higher levels of 24:1 ceramide (Figure 6A), 16:0 SM (Figure 6C), and 16:0 lacCer (Figure 6D), but lower levels of Sa (Figure 6E). The unin. tissues of AA males with COAD had higher levels of 24:1 ceramide (Figure 6A) and 24:0 monoHexCer (Figure 6B). In males with HCC, the tumor tissues of AA males, compared to NHW males, had significantly higher 24:1 and 24:0 ceramide (Figure 7A), and the unin. tissues of AA males had significantly higher levels of 24:1 ceramide (Figure 7A), 24:0 SM (Figure 7C), 16:0 lacCer (Figure 7D), and So and Sa (Figure 7E), but lower levels of 22:0 monoHexCer (Figure 7B). In HNSCC, the tumors of AA males had significantly higher 16:0 and 24:0 ceramide (Figure 8A) and 16:0, 22:0, 24:1, and 24:0 monoHexCer (Figure 8B). The unin. tissues of AA males with HNSCC had significantly lower 16:0 lacCer (Figure 8D).

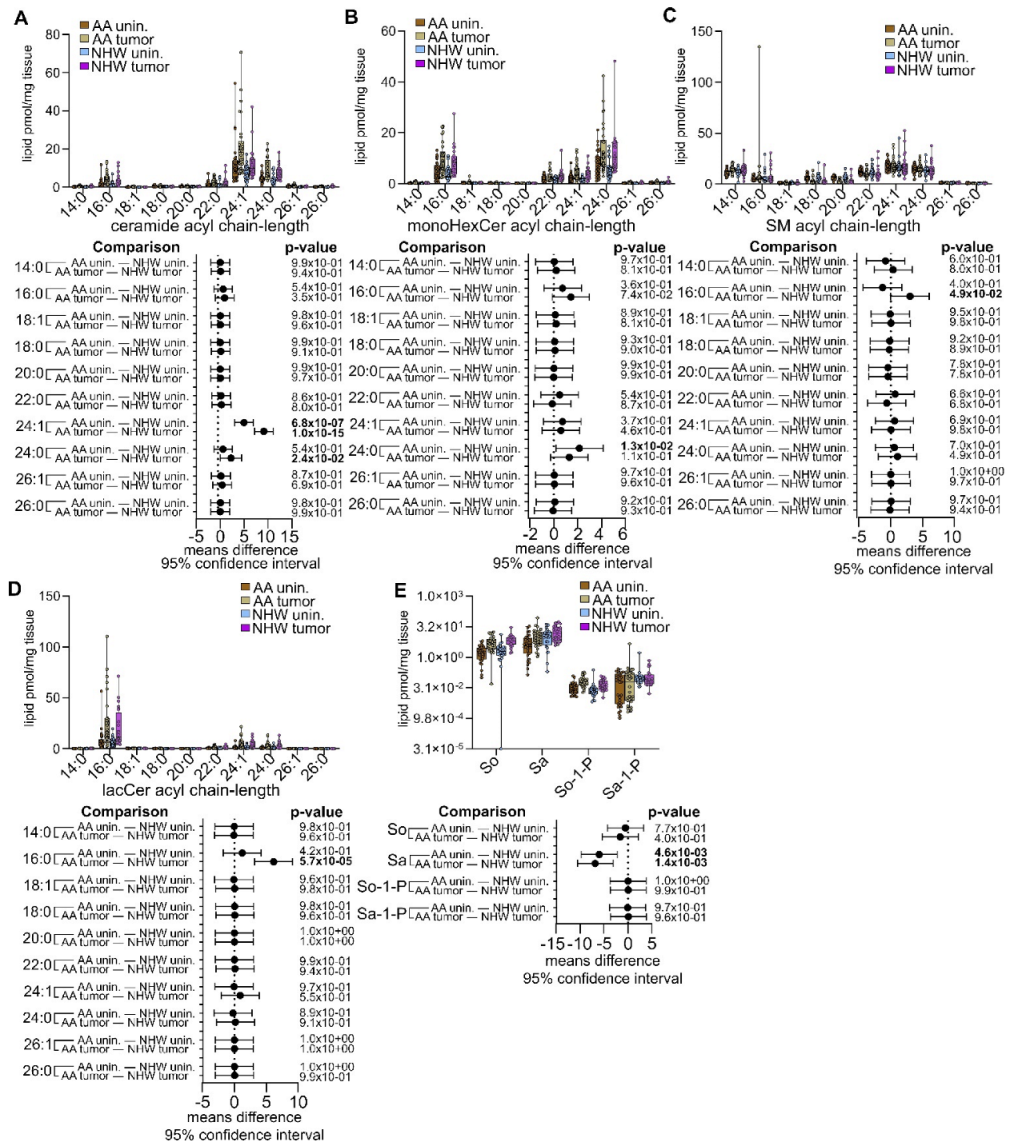
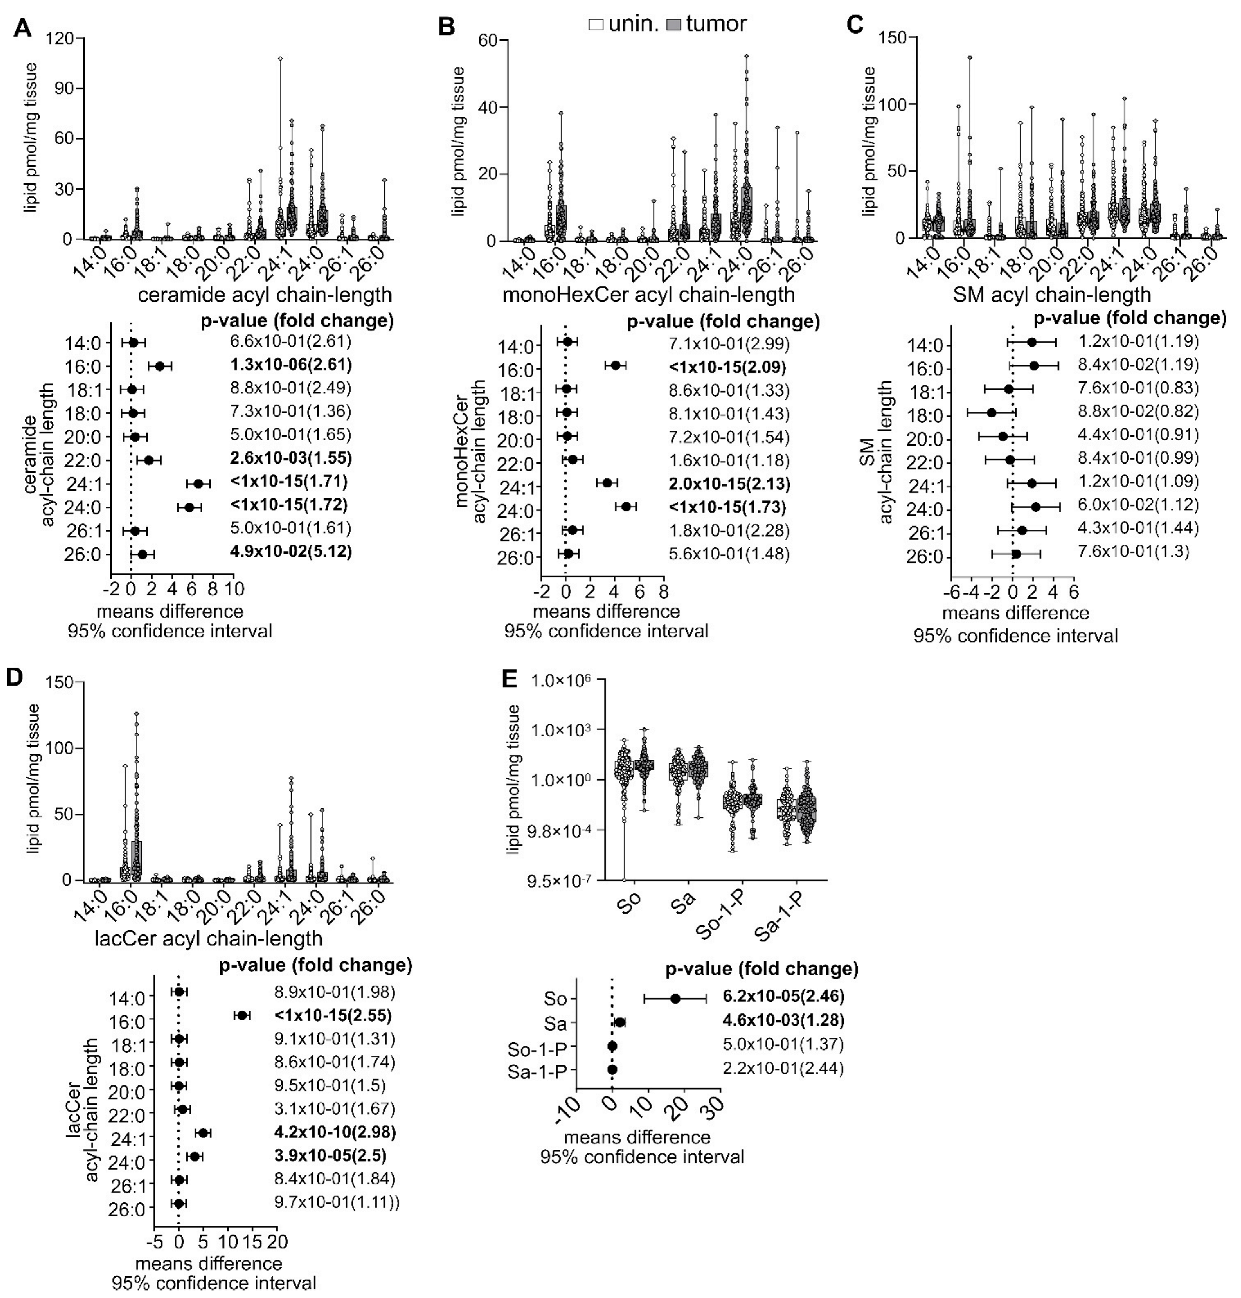
3.5. Pan-Cancer Analysis of Sphingolipid Metabolism Reprogramming

The term cancer describes a large group of related diseases broadly encompassing molecularly and histopathologically diverse forms now understood to originate from distinct somatic driver mutations and clonal selection pathways. Advances in our understanding of driver-specific origins of each disease, along with molecular histopathological typing, have revolutionized disease-specific therapy and improved outcomes. Yet, cancers of different histopathological and genetic origins still share many phenotypic, genotypic, and metabolic properties. Hence, our molecular understanding of cancer includes well-accepted hallmarks that describe traits positively selected during carcinogenesis and transformation that are common to all disease forms, for instance, reprogramming of energy-producing pathways in transformed cells, known as the Warburg effect, and changes in the balance of lipid anabolism and catabolism in non-lipid-producing cells, better known as lipogenesis. Therefore, a comprehensive understanding of the commonalities and shared molecular patterns across many different types of cancer can lead to a better understanding of their etiology and to the development of actionable therapeutic targets broadly applicable to several diseases. This “pan-cancer” approach with pooled datasets from cancers of many different histologies has been used to better understand the overarching themes in genomic and driver-led architectures [34,35,36]. Thus, to gain a better understanding of the global patterns of sphingolipid metabolism reprogramming in human cancers, we conducted two secondary “pan-cancer” analyses: (a) by combining data from AA and NHW with LUAD, EEC, COAD, HCC, and HNSCC and (b) by combining data from all cancers, but grouping the data by race.
In the race-independent pan-cancer analysis where data from AA and NHW were combined, pan-cancer tumors had significantly increased ceramides of 16:0, 22:0, 24:1, 24:0, and 26:0 chain length (Figure 9A); monoHexCer of 16:0, 24:1, and 24:0 chain length (Figure 9B); and lacCer of 16:0, 24:1, and 24:0 chain length (Figure 9D). So and Sa were also significantly higher in pan-cancer tumors (Figure 9E). There were no significant changes observed in any chain length of SM (Figure 9C), So-1-P or Sa-1-P (Figure 9E). In the self-identified race-dependent pan-cancer analysis that combined all cancer histology data but kept data from AA and NHW separated, the following comparisons were made: AA unin. • NHW unin., AA tumor • NHW tumor, which are shown in Figure 10. The race-dependent pan-cancer analyses revealed that the tumors of AA, relative to those of NHW, were significantly enriched in 24:1 and 24:0 acyl chain-length ceramides (Figure 10A). Tumors of AA also had significantly higher 16:0 and 24:0 monoHexCer (Figure 10B), 16:0 lacCer (Figure 10D), and So (Figure 10E). No changes in any acyl chain length of SM were noted in either unin. or tumor tissues (Figure 10C). However, the unin. tissues of AA were observed to be significantly enriched with 24:1 ceramide (Figure 10A).

4. Discussion

In the US, cancer health disparities are rooted in systemic racism and institutional inequalities that limit access to health care, early detection services, health insurance, health literacy, nutritious food, and education and are influenced by socioeconomic status and a lack of diversity among healthcare providers [27,28]. Significant inequalities are also prevalent in the delivery of standard-of-care therapy to individuals with cancer from racial and ethnic minorities and of those from low socioeconomic status, along with a poor representation of minorities in clinical trials and modern molecular cancer studies [27,28]. These structural and social inequalities detrimentally impact social determinants of health and decrease the quality of life of individuals from racial and ethnic minorities and of those of low socioeconomic status.
Increased social awareness and accountability within the basic sciences and healthcare industry, along with a concomitant expansion in cancer health disparities funding by the National Institutes of Health, has led to an increase in research geared to better understand the complex roots of cancer disparities, including those of biological origin. In particular, the past decade has seen the discovery of differences in the genomic and transcriptomic signatures of tumors from AA and NHW. These include genome-wide variances in recombination repair deficiency [37,38], chromothripsis [37], genomic instability [37], RNA splicing [39], DNA “repairome” genes [40], and race-specific driver mutations associated with poor outcomes [41,42,43,44,45]. As recognition of the importance of understanding cancer metabolism reprogramming has grown [46,47], research into race-specific metabolism changes in cancer has also grown with it. This has led to the identification of differences in how nicotine and cigarette smoking carcinogens are metabolized in AA [48,49,50,51,52,53,54] (for review see [55]), metabolomic biomarkers of aggressive disease [56,57,58,59,60], lipidomic signatures in the plasma and serum of AA and NHW with cancer [57,58,59,61,62], fatty acid analysis in prostate cancer [63], and lipidomic analysis of tumors of AA women with breast cancer [64]. Yet, as in many other areas of modern molecular cancer research and clinical trials, AA remain largely underrepresented in modern tumor lipidomic analysis studies. In this study, LC-ESI-MS/MS was used to analyze the normal adjacent uninvolved tissues and tumor tissues of AA and NHW diagnosed with LUAD, EEC, COAD, HCC, and HNSCC. Secondary analyses were conducted with these data separated by disease (Figure 1) and by self-identified race and disease (Figure 2, Figure 3, Figure 4, Figure 5, Figure 6, Figure 7 and Figure 8). In addition, data were combined by disease and analyzed in a self-identified race-dependent (Figure 9) and -independent manner (Figure 10).
Significant increases in ceramides, monoHexCer, and lacCer of various fatty acid chain lengths were observed in the tumors of AA and NHW with LUAD, EEC, COAD, and HNSCC. Interestingly, the sphingolipid alterations observed in HCC were dramatically different from the other cancers analyzed. Although in the other cancers most sphingolipids were increased, in HCC most significant alterations between unin. tissues and tumors were decreased. SM alterations were only observed in the tumors of individuals from both races with COAD and EEC. Interestingly, however, significant COAD SM alterations were both positive and negative. However, in both race-dependent and race-independent pan-cancer analyses, no SM of any chain length was significantly altered. Pan-cancer analyses also revealed a significant increase in ceramides, monoHexCer, and lacCer of 16:0, 24:1, and 24:0 chain lengths, So and Sa, as well as ceramides of 22:0 and 26:1 fatty acyl chain length.
Ceramides of 24- or 16-carbon fatty acyl chain length are known to differentially impact cell fate (for reviews see [65]). Evidence suggests that ceramides with 24-carbon fatty acid acyl chain lengths are pro-survival lipids as they have cytoprotective effects, promote cellular growth, and have anti-apoptotic properties [66,67,68]. However, ceramides with 16-carbon fatty acid acyl chain length can induce cellular stress [66,69], have pro-apoptotic properties that decrease cell growth [67,68,70,71,72], can induce mitochondrial outer membrane permeabilization [73], and induce apoptosis by specifically binding to and activating the tumor-suppressor p53 to induce its downstream pro-apoptotic targets and modulating cell growth [74]. For mitochondrial outer membrane permeabilization, the ratio of 24-carbon to 16-carbon fatty acid chain-length ceramides (referred to as “24•16 ceramide ratio” henceforth) influences the capacity of ceramide to induce apoptosis, with higher ratios (i.e., higher levels of 24-carbon ceramide) inhibiting the 16-carbon length ceramide to induce mitochondrial outer membrane permeabilization [72,75]. Furthermore, the 24•16 ceramide ratio influences cell fate in cancer cells treated with ionizing radiation, with higher ratios (higher 24-carbon ceramide) protecting cells and lower ratios (higher 16-carbon length ceramides) promoting apoptosis [68]. In colon cancer cells, the 24•16 ceramide ratio can also significantly impact cell fate by promoting cellular proliferation (with higher 24-carbon ceramide) or inducing apoptosis (with higher 16-carbon ceramide) [67].
Except for tumors from AA males with HCC, 24:1 ceramide was significantly increased in tumors of all cancers analyzed, and 16:0 ceramides were also significantly elevated in most tumors, including those of NHW with LUAD, EEC, COAD, and HNSCC, and in the tumors of AA with COAD and HNSCC. However, we found that 16:0 ceramides were not significantly elevated in the tumors of AA males with LUAD or AA females with EEC (Figure 2A,E). This led us to consider the possibility that tumors from AA may have higher 24•16 ceramide ratios than NHW and suggest potentially important tumor biology differences. The 24•16 tumor ceramide ratios were examined as follows: Using mean normalized tumor values, three different ratios were estimated for each race: (a) a “24:1/24:0 • 16” ratio, where the mean tumor 24:1 and 24:0 ceramides values were added together and then divided by the mean tumor 16:0 ceramide value; (b) a “24:1•16:0” ratio, where the mean tumor 24:1 ceramide value was divided by the mean tumor 16:0 ceramide value; and (c) a “24:0•16:0” ratio, where the mean tumor 24:0 ceramide value was divided by the mean tumor 16:0 ceramide value. Larger ratios suggest that the relative levels of 24-carbon ceramide are higher than 16-carbon ceramide. In LUAD tumors, the 24:1/24:0 • 16 ratio was 26% higher in AA, the 24:1•16:0 was 20% higher in AA, and the 24:0•16:0 was 32% higher in AA. In EEC tumors, the 24:1/24:0 • 16 ratio was 29% higher in AA, the 24:1•16:0 was 1.2% higher in AA, and the 24:0•16:0 was 56% higher in AA. In COAD tumors, the 24:1/24:0 • 16 was 25% higher in AA, the 24:1•16:0 was 38% higher in AA, and the 24:0•16:0 was 3.1% higher in AA. In HCC tumors, the 24:1/24:0 • 16 ratio was 89% higher in AA, the 24:1•16:0 was 75% higher in AA, and the 24:0•16:0 was 102% higher in AA. In HNSCC tumors, the 24:1/24:0 • 16 ratio was 7% lower in AA, the 24:1•16:0 was 16% lower in AA, and the 24:0•16:0 was 1% higher in AA. For pan-cancers, the 24:1/24:0 • 16 ratio was 16% higher in AA, the 24:1•16:0 was 19% higher in AA, and the 24:0•16:0 was 13% higher in AA. Importantly, calculations based on a geometric mean or median 24:1, 24:0, and 16:0 tumor ceramide values produced similar results, with AA having higher ratios in LUAD, EEC, COAD, and HCC, but not in HNSCC.
There are two important caveats to these observations: (1) In LUAD and EEC, when the tissues of AA and NHW were compared (Figure 4 and Figure 5), although mean levels of 16:0 ceramide in unin. and tumor tissues were lower in AA, these differences did not reach significance. (2) The tumor levels of 24:1 ceramide (but not 24:0 ceramide) were significantly lower in AA males with LUAD and AA females with EEC (Figure 4A and Figure 5A). However, these concerns may be diminished by the observation that the magnitude of the change in 16:0 ceramides between unin. tissues and tumors was 54% larger in NHW males with LUAD and 52% larger in NHW females with EEC. These changes are reflected in observations discussed above, as the levels of 16:0 ceramide were significantly increased in the LUAD and EEC tumors of NHW, but they did not change in tumors of AA with the same disease. These caveats are less of a concern in COAD and HCC, as differences in 24•16 ceramide ratios can be more easily explained by the significantly higher tumor levels of 24:1 and 24:0 ceramides (Figure 6A and Figure 7A). Consistent with this logic, in HNSCC, where the 24•16 ceramides ratios were similar between AA and NHW, the tumors of AA had significantly higher 16:0 and 24:0 ceramide than NHW (Figure 8A).
In combination, we speculate these results suggest that differences in 24•16 ceramide ratios may be due to higher overall relative levels of the 24:1 and 24:0 fatty acid chain-length ceramides in the tumors of AA. Indeed, in the pan-cancer analysis, globally, the tumors of AA had significantly higher levels of 24:1 and 24:0 ceramide (Figure 10A), but the levels of 16:0 ceramide in unin. tissues or tumors were not significantly different (Figure 10A). As discussed above, given that the 24•16 ceramide ratio can tilt the cellular pro-apoptotic/pro-survival balance, one interpretation of these results is that tumors of AA have ceramide profiles indicative of a more pro-survival phenotype. However, it is important to note that given the modest number of samples used for each disease, further studies with larger cohorts will be needed to confirm these observations. Moreover, it will be critical to assess if there are associations between self-identified race, geographical ancestry, and 24•16 ceramide ratios with poor outcomes, responses to therapy, and malignancy in these or other cancers.
Aside from critically important functions in the plasma membrane, monoHexCers, like the glycosphingolipid glucosylceramide, are strongly tied to the pathophysiology of acquired multi-drug chemoresistance in tumor-derived cell lines and in the tumors of patients who have failed chemotherapy (for reviews see [76,77]). In cancer cells, elevated levels of glucosylceramide are intimately associated with the increased expression of multi-drug resistance transporter proteins that act as drug efflux pumps that decrease their cytotoxic efficacy. Therefore, cataloging monoHexCer alterations in human tumors may lead to a better understanding of molecular mechanisms driving chemoresistance in patients. In our race-dependent analysis, with the exception of tumors from AA and NHW with HCC and NHW males with HNSCC, monoHexCer of 16:0, 24:1, and 24:0 acyl chain length was significantly increased in the tumors of AA and NHW with LUAD, EEC, and COAD and in AA males with HNSCC. Intriguingly, although the tumors of AA males with HNSCC had significantly elevated 16:0, 24:1, and 24:0 monoHexCer (Figure 2R), the tumors of NHW males had no significant changes in monoHexCer of any chain length (Figure 3R). As there are well-documented disparities in the outcomes of laryngeal and oral squamous cell carcinomas among AA and NHW males, it is interesting to consider if outcomes in this disease are influenced by changes in monoHexCer (as they are higher in AA males) rather than the 24•16 ceramide ratio as discussed above (which was lower in AA males with HNSCC). Interestingly, in clinical trials, where AA participants were study-arm-matched with NHW controls, thereby minimizing socioeconomic and access to healthcare confounders, AA still had a 51% significantly higher risk of locoregional failure [78]. Therefore, it may be important to investigate if there is an association between AA males with HNSCC who have failed chemotherapy and remodeling of their 24•16 ceramide ratios relative to changes in monoHexCer profiles. Importantly, the pan-cancer race-dependent analysis also revealed that globally the tumors of AA had significantly higher levels of 16:0 and 24:0 monoHexCer (Figure 10B).
Little is known about the role of lacCer alterations in human cancers. However, it has been shown that overexpression of the enzyme that synthesizes it increases the proliferation of cancer cells [79], and its levels are significantly elevated in colorectal cancer [20]. In addition, the enzyme of the B3GNT5 gene product, which converts lacCer to lactotriaosylceramide, has been found to be significantly elevated in the tumors of patients with glioblastoma multiforme and was associated with decreased overall survival [80]. Moreover, a long noncoding RNA that increases the expression of B3GNT5 was shown to be positively associated with poor prognosis and metastasis in patients with liver cancer [81]. In this report, lacCer of various chain lengths was significantly elevated in the tumors of AA and NHW patients with LUAD, EEC, COAD, and HNSCC (Figure 1). LacCer of various chain lengths was also significantly lower in tumors of AA males with LUAD (Figure 4D) and females with EEC (Figure 5D), but higher in the tumors of AA males with COAD (Figure 6D), HCC (Figure 7D), and HNSCC (q = 9.0 × 10⁻³, Supplementary Table S20). However, it is noted that in the pan-cancer analysis, lacCer of 16:0 chain length was significantly higher in the tumors of AA (Figure 10D). Unfortunately, given how little is known about the role of lacCer in the etiology of cancer progression and malignancy, and the mixed effects we see in reprogramming of this lipid by disease type and race, it is difficult to speculate on the potential implications of these differences without conducting further detailed molecular studies.
Our study is a vital first characterization of sphingolipidome alterations in the tumors of AA with these cancers. However, given our results, further confirmation using a larger cohort of AA and NHW for each disease is warranted. Importantly, we should point out that procuring specimens adequate for mass spectrometry can be challenging as formalin-fixed tissues are not suitable for this type of analysis [16]. Moreover, procuring tissues amenable for mass spectrometry from AA males is extremely challenging, as the lack of representation of these individuals in modern studies and clinical trials is reflected by their poor representation in biorepositories [29]. Therefore, even with modest subjects per group and disease, our study significantly advances our understanding of the tumor biology of AA and reveals some potential actionable differences to explore using preclinical models and studies exploring associations and correlations between clinicopathological variables and lipidomics data.
We previously described methods for the preparation of human tissues cryopreserved in OCT for mass spectrometry analysis [16]. In rigorously controlled experiments, results indicated that three tissue washes (as performed here) were sufficient to remove OCT and accurately and without any significant losses determine the levels of ceramides, monoHexCer, SM, lacCer, So, and Sa [16]. However, these experiments also revealed potential losses of tissue-associated So-1-P and Sa-1-P, and it was suggested that the interpretation of their levels using this method should be carried out with caution [16]. Therefore, in this study, findings showing minor changes in So-1-P and Sa-1-P should be carefully evaluated within the context of this technical limitation, especially in light of the many roles that have been ascribed to So-1-P and associated signaling pathways in cancer [8]. To overcome this limitation, we suggest that further characterization of tissues not cryopreserved in OCT may be required to accurately assess whether there are differences in the levels of So-1-P and Sa-1-P in the tissues of AA and NHW with cancer.
In this study, self-identified race was used to partition subjects in race-dependent analyses. Therefore, we recognize that our findings are not generalizable to studies evaluating associations between sphingolipidome alterations in tumors and geographical admixture genetic ancestry. However, even in the context of these caveats and limitations, there are several findings of potentially significant biological impact, and follow-up studies may lead to insights into mechanisms contributing to aggressive disease in AA when socioeconomic variables are carefully controlled for.

5. Conclusions

In this report, we have expanded the molecular characterization of tumors from self-identified AA with various types of cancer and made comparisons with similar tissues from NHW. Significant variations in the sphingolipid profiles of tumors and unin. tissues were observed, which suggest some potentially significant molecular differences in the biology of AA and NHW tumors. Therefore, we suggest that these results warrant further analysis with larger patient cohorts and in vitro studies that evaluate the impact that heterogeneity in sphingolipid metabolism has on the phenotypic properties of transformed cells from each race. Future studies could establish potential actionable molecular targets that specifically decrease tumor malignancy and improve outcomes in AA with cancer.

Supplementary Materials

The following supporting information can be downloaded at https://www.mdpi.com/article/10.3390/cancers15082238/s1, Supplementary Tables containing mean differences, unadjusted (p), and multiple comparison-adjusted (q) statistical analysis values are included in Supplementary Tables S1–S22.

Author Contributions

S.L.: conceptualization, methodology, formal analysis, resources, writing of original draft, and supervision. A.E.B.: processed tissues and analyzed mass spectrometry data for lung, colon, endometrium, and liver, assisted in manuscript preparation, reviewing, and editing. P.J.G.: sectioned all tissue specimens for research, conducted all database searches for clinicopathological variables, including histopathology, sex, and age, and reviewed and edited the manuscript. K.H.R.: processed tissues and analyzed mass spectrometry data for head and neck cancer and reviewed and edited the manuscript. All authors have read and agreed to the published version of the manuscript.

Funding

This work was supported by National Institutes of Health Grants R21CA232234 (S.L.), VCU Massey Cancer Center Catalyst Award (S.L.), and a VCU Massey Cancer Center P20 TRACER Pilot Award (S.L.) supported by the National Cancer Institute of the National Institutes of Health under awards P30CA016059 and 1P20CA252717, respectively.

Institutional Review Board Statement

De-identified human lung tissues cryopreserved in optimal cutting temperature compound (OCT), obtained during standard-of-care procedures and banked when judged to be in excess of that required for patient diagnosis and treatment, were procured from the Virginia Commonwealth University (VCU) Tissue and Data Acquisition and Analysis Core (TDAAC) under a VCU IRB-approved protocol (#HM2471) as described in [15,16]. Samples were provided under an honest broker system, and biorepository participants who signed the TDAAC informed consent documentation agreed to have their residual tissues utilized for any research question, including lipidomic analysis and health information for translational research. Samples were selected based on primary histopathologic confirmed diagnoses and self-identified race. Utilizing institutionally available medical records, age at the time of diagnosis was determined using the patient’s date of birth and date of biopsy or definitive surgery. After careful evaluation by a pathologist for histological type, only tumor sections with greater than 35% tumor enrichment and tissues determined to be disease-free (i.e., unin.) were selected for lipidomics studies. All associated anonymized sample annotation was generated by the TDAAC SQL2000 secure biorepository database and the Cancer Informatics Core (CIC) VCU-IRB approved protocol (#HM20004765) by way of a dynamic inventory dashboard.

Informed Consent Statement

Informed consent was obtained from all subjects involved in the study. All patient data were anonymized and no patient-identifying data are included in this report.

Data Availability Statement

Primary data are not publicly available.

Acknowledgments

We would like to thank Jason Newton for his valuable intellectual contributions to this project and in the preparation of this manuscript. Services and support of this research project were provided by the Virginia Commonwealth University (VCU) Massey Cancer Center Tissue and Data Acquisition and Analysis Core and the VCU Lipidomics Core, which are supported in part with funding from the National Institutes of Health—National Cancer Institute Cancer Center Support Grant P30CA016059. The content in this manuscript is solely the responsibility of the authors and does not necessarily represent the official views of the National Institutes of Health.

Conflicts of Interest

The authors declare that they have no known competing financial interests or personal relationships that could have appeared to influence the work reported in this paper.

References

  1. Kraft, M.L. Sphingolipid Organization in the Plasma Membrane and the Mechanisms That Influence It. Front. Cell Dev. Biol. 2016, 4, 154. [Google Scholar] [CrossRef] [PubMed] [Green Version]
  2. Breslow, D.K.; Weissman, J.S. Membranes in Balance: Mechanisms of Sphingolipid Homeostasis. Mol. Cell 2010, 40, 267–279. [Google Scholar] [CrossRef] [PubMed] [Green Version]
  3. Lima, S.; Milstien, S.; Spiegel, S. Sphingosine and Sphingosine Kinase 1 Involvement in Endocytic Membrane Trafficking. J. Biol. Chem. 2017, 292, 3074–3088. [Google Scholar] [CrossRef] [PubMed] [Green Version]
  4. Lima, S.; Takabe, K.; Newton, J.; Saurabh, K.; Young, M.M.; Leopoldino, A.M.; Hait, N.C.; Roberts, J.L.; Wang, H.-G.; Dent, P.; et al. TP53 is required for BECN1- and ATG5-dependent cell death induced by sphingosine kinase 1 inhibition. Autophagy 2018, 14, 942–957. [Google Scholar] [CrossRef] [PubMed] [Green Version]
  5. Young, M.M.; Takahashi, Y.; Fox, T.E.; Yun, J.K.; Kester, M.; Wang, H.-G. Sphingosine Kinase 1 Cooperates with Autophagy to Maintain Endocytic Membrane Trafficking. Cell Rep. 2016, 17, 1532–1545. [Google Scholar] [CrossRef] [Green Version]
  6. Young, M.M.; Wang, H.-G. Sphingolipids as Regulators of Autophagy and Endocytic Trafficking. Adv. Cancer Res. 2018, 140, 27–60. [Google Scholar] [CrossRef]
  7. Shen, H.; Giordano, F.; Wu, Y.; Chan, J.; Zhu, C.; Milosevic, I.; Wu, X.; Yao, K.; Chen, B.; Baumgart, T.; et al. Coupling between endocytosis and sphingosine kinase 1 recruitment. Nature 2014, 16, 652–662. [Google Scholar] [CrossRef] [Green Version]
  8. Hannun, Y.A.; Obeid, L.M. Sphingolipids and their metabolism in physiology and disease. Nat. Rev. Mol. Cell Biol. 2018, 19, 175–191. [Google Scholar] [CrossRef]
  9. Russo, D.; Parashuraman, S.; D’Angelo, G. Glycosphingolipid–Protein Interaction in Signal Transduction. Int. J. Mol. Sci. 2016, 17, 1732. [Google Scholar] [CrossRef] [Green Version]
  10. Schiffmann, S.; Sandner, J.; Birod, K.; Wobst, I.; Angioni, C.; Ruckhäberle, E.; Kaufmann, M.; Ackermann, H.; Lötsch, J.; Schmidt, H.; et al. Ceramide Synthases and Ceramide Levels Are Increased in Breast Cancer Tissue. Carcinogenesis 2009, 30, 745–752. [Google Scholar] [CrossRef] [Green Version]
  11. Moro, K.; Kawaguchi, T.; Tsuchida, J.; Gabriel, E.; Qi, Q.; Yan, L.; Wakai, T.; Takabe, K.; Nagahashi, M. Ceramide species are elevated in human breast cancer and are associated with less aggressiveness. Oncotarget 2018, 9, 19874–19890. [Google Scholar] [CrossRef] [PubMed] [Green Version]
  12. Nagahashi, M.; Tsuchida, J.; Moro, K.; Hasegawa, M.; Tatsuda, K.; Woelfel, I.A.; Takabe, K.; Wakai, T. High levels of sphingolipids in human breast cancer. J. Surg. Res. 2016, 204, 435–444. [Google Scholar] [CrossRef] [PubMed] [Green Version]
  13. Bhadwal, P.; Dahiya, D.; Shinde, D.; Vaiphei, K.; Math, R.G.H.; Randhawa, V.; Agnihotri, N. LC-HRMS based approach to identify novel sphingolipid biomarkers in breast cancer patients. Sci. Rep. 2020, 10, 4668. [Google Scholar] [CrossRef] [PubMed] [Green Version]
  14. Pakiet, A.; Sikora, K.; Kobiela, J.; Rostkowska, O.; Mika, A.; Sledzinski, T. Alterations in complex lipids in tumor tissue of patients with colorectal cancer. Lipids Health Dis. 2021, 20, 85. [Google Scholar] [CrossRef]
  15. Rohrbach, T.D.; Boyd, A.E.; Grizzard, P.J.; Spiegel, S.; Allegood, J.; Lima, S. A simple method for sphingolipid analysis of tissues embedded in optimal cutting temperature compound. J. Lipid Res. 2020, 61, 953–967. [Google Scholar] [CrossRef]
  16. Boyd, A.E.; Allegood, J.; Lima, S. Preparation of Human Tissues Embedded in Optimal Cutting Temperature Compound for Mass Spectrometry Analysis. J. Vis. Exp. 2021, 170, e62552. [Google Scholar]
  17. Karahatay, S.; Thomas, K.; Koybasi, S.; Senkal, C.E.; ElOjeimy, S.; Liu, X.; Bielawski, J.; Day, T.A.; Gillespie, M.B.; Sinha, D.; et al. Clinical relevance of ceramide metabolism in the pathogenesis of human head and neck squamous cell carcinoma (HNSCC): Attenuation of C18-ceramide in HNSCC tumors correlates with lymphovascular invasion and nodal metastasis. Cancer Lett. 2007, 256, 101–111. [Google Scholar] [CrossRef] [Green Version]
  18. Knapp, P.; Baranowski, M.; Knapp, M.; Zabielski, P.; Błachnio-Zabielska, A.U.; Górski, J. Altered sphingolipid metabolism in human endometrial cancer. Prostaglandins Other Lipid Mediat. 2010, 92, 62–66. [Google Scholar] [CrossRef]
  19. Li, Z.; Guan, M.; Lin, Y.; Cui, X.; Zhang, Y.; Zhao, Z.; Zhu, J. Aberrant Lipid Metabolism in Hepatocellular Carcinoma Revealed by Liver Lipidomics. Int. J. Mol. Sci. 2017, 18, 2550. [Google Scholar] [CrossRef] [Green Version]
  20. Chatterjee, S.B.; Hou, J.; Bandaru, V.V.R.; Pezhouh, M.K.; Mannan, A.A.S.R.; Sharma, R. Lactosylceramide Synthase Β-1,4-Galt-V: A Novel Target for the Diagnosis and Therapy of Human Colorectal Cancer. Biochem. Biophys. Res. Commun. 2019, 508, 380–386. [Google Scholar] [CrossRef]
  21. Janneh, A.H.; Ogretmen, B. Targeting Sphingolipid Metabolism as a Therapeutic Strategy in Cancer Treatment. Cancers 2022, 14, 2183. [Google Scholar] [CrossRef] [PubMed]
  22. Ogretmen, B. Sphingolipid metabolism in cancer signalling and therapy. Nat. Rev. Cancer 2017, 18, 33–50. [Google Scholar] [CrossRef] [PubMed] [Green Version]
  23. Li, R.Z.; Wang, X.R.; Wang, J.; Xie, C.; Wang, X.X.; Pan, H.D.; Meng, W.Y.; Liang, T.L.; Li, J.X.; Yan, P.Y.; et al. The Key Role of Sphingolipid Metabolism in Cancer: New Therapeutic Targets, Diagnostic and Prognostic Values, and Anti-Tumor Immunotherapy Resistance. Front. Oncol. 2022, 12, 941643. [Google Scholar] [CrossRef]
  24. Cronin, K.A.; Scott, S.; Firth, A.U.; Sung, H.; Henley, S.J.; Sherman, R.L.; Siegel, R.L.; Anderson, R.N.; Kohler, B.A.; Benard, V.B.; et al. Annual Report to the Nation on the Status of Cancer, Part 1: National Cancer Statistics. Cancer 2022, 128, 4251–4284. [Google Scholar] [CrossRef] [PubMed]
  25. Whetstone, S.; Burke, W.; Sheth, S.S.; Brooks, R.; Cavens, A.; Huber-Keener, K.; Scott, D.M.; Worly, B.; Chelmow, D. Health Disparities in Uterine Cancer: Report from the Uterine Cancer Evidence Review Conference. Obstet. Gynecol. 2022, 139, 645–659. [Google Scholar] [CrossRef] [PubMed]
  26. Doll, K.M.; Khor, S.; Odem-Davis, K.; He, H.; Wolff, E.M.; Flum, D.R.; Ramsey, S.D.; Goff, B.A. Role of bleeding recognition and evaluation in Black-White disparities in endometrial cancer. Am. J. Obstet. Gynecol. 2018, 219, 593.e1–593.e14. [Google Scholar] [CrossRef]
  27. Williams, P.A.; Zaidi, S.K.; Sengupta, R. AACR Cancer Disparities Progress Report 2022. Cancer Epidemiol. Biomark. Prev. 2022, 31, 1249–1250. [Google Scholar] [CrossRef]
  28. Cancer Facts & Figures for African American/Black People 2022–2024; American Cancer Society: Atlanta, GA, USA, 2022.
  29. Zavala, V.A.; Bracci, P.M.; Carethers, J.M.; Carvajal-Carmona, L.; Coggins, N.B.; Cruz-Correa, M.R.; Davis, M.; de Smith, A.J.; Dutil, J.; Figueiredo, J.C.; et al. Cancer health disparities in racial/ethnic minorities in the United States. Br. J. Cancer 2021, 124, 315–332. [Google Scholar] [CrossRef]
  30. Fatumo, S.; Chikowore, T.; Choudhury, A.; Ayub, M.; Martin, A.R.; Kuchenbaecker, K. A roadmap to increase diversity in genomic studies. Nat. Med. 2022, 28, 243–250. [Google Scholar] [CrossRef]
  31. Nazha, B.; Mishra, M.; Pentz, R.; Owonikoko, T.K. Enrollment of Racial Minorities in Clinical Trials: Old Problem Assumes New Urgency in the Age of Immunotherapy. Am. Soc. Clin. Oncol. Educ. Book 2019, 39, 3–10. [Google Scholar] [CrossRef]
  32. Borrell, L.N.; Elhawary, J.R.; Fuentes-Afflick, E.; Witonsky, J.; Bhakta, N.; Wu, A.H.B.; Bibbins-Domingo, K.; Rodríguez-Santana, J.R.; Lenoir, M.A.; Gavin, J.R., 3rd; et al. Race and Genetic Ancestry in Medicine—A Time for Reckoning with Racism. N. Engl. J. Med. 2021, 384, 474–480. [Google Scholar] [CrossRef]
  33. Shaner, R.L.; Allegood, J.C.; Park, H.; Wang, E.; Kelly, S.; Haynes, C.A.; Sullards, M.C.; Merrill, A.H., Jr. Quantitative analysis of sphingolipids for lipidomics using triple quadrupole and quadrupole linear ion trap mass spectrometers. J. Lipid Res. 2009, 50, 1692–1707. [Google Scholar] [CrossRef] [Green Version]
  34. Weinstein, J.N.; Collisson, E.A.; Mills, G.B.; Shaw, K.R.M.; Ozenberger, B.A.; Ellrott, K.; Shmulevich, I.; Sander, C.; Stuart, J.M. The Cancer Genome Atlas Pan-Cancer analysis project. Nat. Genet. 2013, 45, 1113–1120. [Google Scholar] [CrossRef]
  35. Liu, H.; Zhang, B.; Sun, Z. Spectrum of EGFR aberrations and potential clinical implications: Insights from integrative pan-cancer analysis. Cancer Commun. 2020, 40, 43–59. [Google Scholar] [CrossRef] [Green Version]
  36. Chen, F.; Zhang, Y.; Gibbons, D.L.; Deneen, B.; Kwiatkowski, D.J.; Ittmann, M.; Creighton, C.J. Pan-Cancer Molecular Classes Transcending Tumor Lineage across 32 Cancer Types, Multiple Data Platforms, and over 10,000 Cases. Clin. Cancer Res. 2018, 24, 2182–2193. [Google Scholar] [CrossRef] [PubMed] [Green Version]
  37. Sinha, S.; Mitchell, K.A.; Zingone, A.; Bowman, E.; Sinha, N.; Schäffer, A.A.; Lee, J.S.; Ruppin, E.; Ryan, B.M. Higher prevalence of homologous recombination deficiency in tumors from African Americans versus European Americans. Nat. Cancer 2020, 1, 112–121. [Google Scholar] [CrossRef] [Green Version]
  38. Ding, Y.C.; Adamson, A.W.; Steele, L.; Bailis, A.M.; John, E.M.; Tomlinson, G.; Neuhausen, S.L. Discovery of mutations in homologous recombination genes in African-American women with breast cancer. Fam. Cancer 2018, 17, 187–195. [Google Scholar] [CrossRef]
  39. Deveaux, A.E.; Allen, T.A.; Al Abo, M.; Qin, X.; Zhang, D.; Patierno, B.M.; Gu, L.; Gray, J.E.; Pecot, C.V.; Dressman, H.K.; et al. RNA splicing and aggregate gene expression differences in lung squamous cell carcinoma between patients of West African and European ancestry. Lung Cancer 2021, 153, 90–98. [Google Scholar] [CrossRef] [PubMed]
  40. Yadav, S.; Anbalagan, M.; Baddoo, M.; Chellamuthu, V.K.; Mukhopadhyay, S.; Woods, C.; Jiang, W.; Moroz, K.; Flemington, E.K.; Makridakis, N. Somatic mutations in the DNA repairome in prostate cancers in African Americans and Caucasians. Oncogene 2020, 39, 4299–4311. [Google Scholar] [CrossRef] [PubMed] [Green Version]
  41. Mitchell, K.A.; Nichols, N.; Tang, W.; Walling, J.; Stevenson, H.; Pineda, M.; Stefanescu, R.; Edelman, D.C.; Girvin, A.T.; Zingone, A.; et al. Recurrent PTPRT/JAK2 mutations in lung adenocarcinoma among African Americans. Nat. Commun. 2019, 10, 5735. [Google Scholar] [CrossRef] [Green Version]
  42. Bauml, J.; Mick, R.; Zhang, Y.; Watt, C.D.; Vachani, A.; Aggarwal, C.; Evans, T.; Langer, C. Frequency of EGFR and KRAS mutations in patients with non small cell lung cancer by racial background: Do disparities exist? Lung Cancer 2013, 81, 347–353. [Google Scholar] [CrossRef] [Green Version]
  43. Steuer, C.E.; Behera, M.; Berry, L.; Kim, S.; Rossi, M.; Sica, G.; Owonikoko, T.K.; Johnson, B.E.; Kris, M.G.; Bunn, P.A.; et al. Role of race in oncogenic driver prevalence and outcomes in lung adenocarcinoma: Results from the Lung Cancer Mutation Consortium. Cancer 2016, 122, 766–772. [Google Scholar] [CrossRef] [PubMed] [Green Version]
  44. Krishnaswamy, S.; Kanteti, R.; Duke-Cohan, J.S.; Loganathan, S.; Liu, W.; Ma, P.C.; Sattler, M.; Singleton, P.A.; Ramnath, N.; Innocenti, F.; et al. Ethnic Differences and Functional Analysis of MET Mutations in Lung Cancer. Clin. Cancer Res. 2009, 15, 5714–5723. [Google Scholar] [CrossRef] [Green Version]
  45. Kang, M.; Shen, X.J.; Kim, S.; Araujo-Perez, F.; Galanko, J.A.; Martin, C.F.; Sandler, R.S.; Keku, T.O. Somatic gene mutations in African Americans may predict worse outcomes in colorectal cancer. Cancer Biomark. 2013, 13, 359–366. [Google Scholar] [CrossRef] [Green Version]
  46. Bergers, G.; Fendt, S.-M. The metabolism of cancer cells during metastasis. Nat. Rev. Cancer 2021, 21, 162–180. [Google Scholar] [CrossRef] [PubMed]
  47. Martínez-Reyes, I.; Chandel, N.S. Cancer metabolism: Looking forward. Nat. Rev. Cancer 2021, 21, 669–680. [Google Scholar] [CrossRef]
  48. Patel, Y.M.; Park, S.L.; Carmella, S.G.; Paiano, V.; Olvera, N.; Stram, D.O.; Haiman, C.A.; Le Marchand, L.; Hecht, S.S. Metabolites of the Polycyclic Aromatic Hydrocarbon Phenanthrene in the Urine of Cigarette Smokers from Five Ethnic Groups with Differing Risks for Lung Cancer. PLoS ONE 2016, 11, e0156203. [Google Scholar] [CrossRef] [PubMed] [Green Version]
  49. Murphy, S.E.; Park, S.-S.L.; Thompson, E.F.; Wilkens, L.R.; Patel, Y.; Stram, D.O.; Le Marchand, L. Nicotine N-glucuronidation relative to N-oxidation and C-oxidation and UGT2B10 genotype in five ethnic/racial groups. Carcinogenesis 2014, 35, 2526–2533. [Google Scholar] [CrossRef] [PubMed] [Green Version]
  50. Dator, R.; Villalta, P.W.; Thomson, N.; Jensen, J.; Hatsukami, D.K.; Stepanov, I.; Warth, B.; Balbo, S. Metabolomics Profiles of Smokers from Two Ethnic Groups with Differing Lung Cancer Risk. Chem. Res. Toxicol. 2020, 33, 2087–2098. [Google Scholar] [CrossRef]
  51. Ross, K.C.; Gubner, N.R.; Tyndale, R.F.; Hawk, L.W.; Lerman, C.; George, T.P.; Cinciripini, P.; Schnoll, R.A.; Benowitz, N.L. Racial differences in the relationship between rate of nicotine metabolism and nicotine intake from cigarette smoking. Pharmacol. Biochem. Behav. 2016, 148, 1–7. [Google Scholar] [CrossRef] [PubMed] [Green Version]
  52. Chenoweth, M.J.; Ware, J.J.; Zhu, A.Z.X.; Cole, C.B.; Cox, L.S.; Nollen, N.; Ahluwalia, J.S.; Benowitz, N.L.; Schnoll, R.A.; Hawk, L.W.; et al. Genome-wide association study of a nicotine metabolism biomarker in African American smokers: Impact of chromosome 19 genetic influences. Addiction 2017, 113, 509–523. [Google Scholar] [CrossRef] [PubMed] [Green Version]
  53. Park, S.L.; Tiirikainen, M.I.; Patel, Y.M.; Wilkens, L.R.; Stram, D.O.; Le Marchand, L.; Murphy, S.E. Genetic determinants of CYP2A6 activity across racial/ethnic groups with different risks of lung cancer and effect on their smoking intensity. Carcinogenesis 2016, 37, 269–279. [Google Scholar] [CrossRef] [Green Version]
  54. Sun, Y.V.; Smith, A.K.; Conneely, K.N.; Chang, Q.; Li, W.; Lazarus, A.; Smith, J.; Almli, L.; Binder, E.B.; Klengel, T.; et al. Epigenomic association analysis identifies smoking-related DNA methylation sites in African Americans. Hum. Genet. 2013, 132, 1027–1037. [Google Scholar] [CrossRef] [PubMed] [Green Version]
  55. Murphy, S.E.; Park, S.L.; Balbo, S.; Haiman, C.A.; Hatsukami, D.K.; Patel, Y.; Peterson, L.A.; Stepanov, I.; Stram, D.O.; Tretyakova, N.; et al. Tobacco biomarkers and genetic/epigenetic analysis to investigate ethnic/racial differences in lung cancer risk among smokers. npj Precis. Oncol. 2018, 2, 17. [Google Scholar] [CrossRef] [Green Version]
  56. Kanaan, Y.M.; Sampey, B.P.; Beyene, D.; Esnakula, A.K.; Naab, T.J.; Ricks-Santi, L.J.; Dasi, S.; Day, A.; Blackman, K.W.; Frederick, W.; et al. Metabolic profile of triple-negative breast cancer in African-American women reveals potential biomarkers of aggressive disease. Cancer Genom.-Proteom. 2014, 11, 29–294. [Google Scholar]
  57. Vantaku, V.; Donepudi, S.R.; Piyarathna, D.W.B.; Amara, C.S.; Ambati, C.S.R.; Tang, W.; Putluri, V.; Chandrashekar, D.S.; Varambally, S.; Terris, M.K.; et al. Large-scale profiling of serum metabolites in African American and European American patients with bladder cancer reveals metabolic pathways associated with patient survival. Cancer 2019, 125, 921–932. [Google Scholar] [CrossRef] [Green Version]
  58. Zhao, H.; Shen, J.; Moore, S.C.; Ye, Y.; Wu, X.; Esteva, F.J.; Tripathy, D.; Chow, W.H. Breast Cancer Risk in Relation to Plasma Metabolites among Hispanic and African American Women. Breast Cancer Res. Treat. 2019, 176, 687–696. [Google Scholar] [CrossRef]
  59. Shen, J.; Yan, L.; Liu, S.; Ambrosone, C.B.; Zhao, H. Plasma Metabolomic Profiles in Breast Cancer Patients and Healthy Controls: By Race and Tumor Receptor Subtypes. Transl. Oncol. 2013, 6, 757–765. [Google Scholar] [CrossRef] [Green Version]
  60. Gohlke, J.H.; Lloyd, S.M.; Basu, S.; Putluri, V.; Vareed, S.K.; Rasaily, U.; Piyarathna, D.W.B.; Fuentes, H.; Rajendiran, T.M.; Dorsey, T.H.; et al. Methionine-Homocysteine Pathway in African-American Prostate Cancer. JNCI Cancer Spectr. 2019, 3, pkz019. [Google Scholar] [CrossRef] [Green Version]
  61. Rose, D.P.; Haffner, S.M.; Baillargeon, J. Adiposity, the Metabolic Syndrome, and Breast Cancer in African-American and White American Women. Endocr. Rev. 2007, 28, 763–777. [Google Scholar] [CrossRef]
  62. Aminov, Z.; Haase, R.; Olson, J.R.; Pavuk, M.; Carpenter, D.O. Racial differences in levels of serum lipids and effects of exposure to persistent organic pollutants on lipid levels in residents of Anniston, Alabama. Environ. Int. 2014, 73, 216–223. [Google Scholar] [CrossRef]
  63. Zhou, X.; Mei, H.; Agee, J.; Brown, T.; Mao, J. Racial differences in distribution of fatty acids in prostate cancer and benign prostatic tissues. Lipids Health Dis. 2019, 18, 189. [Google Scholar] [CrossRef] [Green Version]
  64. Purwaha, P.; Gu, F.; Piyarathna, D.W.B.; Rajendiran, T.; Ravindran, A.; Omilian, A.R.; Jiralerspong, S.; Das, G.; Morrison, C.; Ambrosone, C.; et al. Unbiased Lipidomic Profiling of Triple-Negative Breast Cancer Tissues Reveals the Association of Sphingomyelin Levels with Patient Disease-Free Survival. Metabolites 2018, 8, 41. [Google Scholar] [CrossRef] [PubMed] [Green Version]
  65. Ho, Q.W.C.; Zheng, X.; Ali, Y. Ceramide Acyl Chain Length and Its Relevance to Intracellular Lipid Regulation. Int. J. Mol. Sci. 2022, 23, 9697. [Google Scholar] [CrossRef] [PubMed]
  66. Kim, Y.-R.; Lee, E.-J.; Shin, K.-O.; Kim, M.H.; Pewzner-Jung, Y.; Lee, Y.-M.; Park, J.-W.; Futerman, A.H.; Park, W.-J. Hepatic triglyceride accumulation via endoplasmic reticulum stress-induced SREBP-1 activation is regulated by ceramide synthases. Exp. Mol. Med. 2019, 51, 1–16. [Google Scholar] [CrossRef]
  67. Hartmann, D.; Wegner, M.-S.; Wanger, R.A.; Ferreirós, N.; Schreiber, Y.; Lucks, J.; Schiffmann, S.; Geisslinger, G.; Grösch, S. The equilibrium between long and very long chain ceramides is important for the fate of the cell and can be influenced by co-expression of CerS. Int. J. Biochem. Cell Biol. 2013, 45, 1195–1203. [Google Scholar] [CrossRef] [PubMed]
  68. Mesicek, J.; Lee, H.; Feldman, T.; Jiang, X.; Skobeleva, A.; Berdyshev, E.V.; Haimovitz-Friedman, A.; Fuks, Z.; Kolesnick, R. Ceramide synthases 2, 5, and 6 confer distinct roles in radiation-induced apoptosis in HeLa cells. Cell. Signal. 2010, 22, 1300–1307. [Google Scholar] [CrossRef] [Green Version]
  69. Zheng, X.; Ho, Q.W.C.; Chua, M.; Stelmashenko, O.; Yeo, X.Y.; Muralidharan, S.; Torta, F.; Chew, E.G.Y.; Lian, M.M.; Foo, J.N.; et al. Destabilization of β Cell FIT2 by saturated fatty acids alter lipid droplet numbers and contribute to ER stress and diabetes. Proc. Natl. Acad. Sci. USA 2022, 119, e2113074119. [Google Scholar] [CrossRef] [PubMed]
  70. Manukyan, L.; Ubhayasekera, S.J.K.A.; Bergquist, J.; Sargsyan, E.; Bergsten, P. Palmitate-Induced Impairments of β-Cell Function Are Linked with Generation of Specific Ceramide Species via Acylation of Sphingosine. Endocrinology 2015, 156, 802–812. [Google Scholar] [CrossRef] [Green Version]
  71. Aflaki, E.; Doddapattar, P.; Radović, B.; Povoden, S.; Kolb, D.; Vujić, N.; Wegscheider, M.; Koefeler, H.; Hornemann, T.; Graier, W.F.; et al. C16 Ceramide Is Crucial for Triacylglycerol-Induced Apoptosis in Macrophages. Cell Death Dis. 2012, 3, e280. [Google Scholar] [CrossRef] [Green Version]
  72. Rudd, A.K.; Devaraj, N.K. Traceless synthesis of ceramides in living cells reveals saturation-dependent apoptotic effects. Proc. Natl. Acad. Sci. USA 2018, 115, 7485–7490. [Google Scholar] [CrossRef] [PubMed] [Green Version]
  73. Ganesan, V.; Perera, M.N.; Colombini, D.; Datskovskiy, D.; Chadha, K.; Colombini, M. Ceramide and activated Bax act synergistically to permeabilize the mitochondrial outer membrane. Apoptosis 2010, 15, 553–562. [Google Scholar] [CrossRef] [PubMed]
  74. Fekry, B.; Jeffries, K.A.; Esmaeilniakooshkghazi, A.; Szulc, Z.M.; Knagge, K.J.; Kirchner, D.R.; Horita, D.A.; Krupenko, S.A.; Krupenko, N.I. C16-ceramide is a natural regulatory ligand of p53 in cellular stress response. Nat. Commun. 2018, 9, 4149. [Google Scholar] [CrossRef] [PubMed] [Green Version]
  75. Stiban, J.; Perera, M. Very long chain ceramides interfere with C16-ceramide-induced channel formation: A plausible mechanism for regulating the initiation of intrinsic apoptosis. Biochim. Biophys. Acta 2015, 1848, 561–567. [Google Scholar] [CrossRef] [Green Version]
  76. Reza, S.; Ugorski, M.; Suchański, J. Glucosylceramide and galactosylceramide, small glycosphingolipids with significant impact on health and disease. Glycobiology 2021, 31, 1416–1434. [Google Scholar] [CrossRef]
  77. Morad, S.A.F.; Cabot, M.C. Chapter Nine—The Onus of Sphingolipid Enzymes in Cancer Drug Resistance. In Advances in Cancer Research; Chalfant, C.E., Fisher, P.B., Eds.; Academic Press: Cambridge, MA, USA, 2018; pp. 235–263. [Google Scholar]
  78. Liu, J.C.; Egleston, B.L.; Blackman, E.; Ragin, C. Racial Survival Disparities in Head and Neck Cancer Clinical Trials. J. Natl. Cancer Inst. 2023, 115, 288–294. [Google Scholar] [CrossRef]
  79. Xu, S.; Zhang, S.; Chen, C.; Yan, J.; Cai, M.; Zhu, X.; Gu, J. Over-expression of beta-1,4-galactosyltransferase V increases the growth of astrocytoma cell line. J. Exp. Clin. Cancer Res. 2002, 21, 409–414. [Google Scholar]
  80. Jeong, H.Y.; Park, S.; Kim, H.; Moon, S.; Lee, S.; Lee, S.H.; Kim, S. B3GNT5 is a novel marker correlated with stem-like phenotype and poor clinical outcome in human gliomas. CNS Neurosci. Ther. 2020, 26, 1147–1154. [Google Scholar] [CrossRef]
  81. Zhu, Y.; Li, B.; Xu, G.; Han, C.; Xing, G. Lncrna Mir4435-2hg Promotes the Progression of Liver Cancer by Upregulating B3gnt5 Expression. Mol. Med. Rep. 2022, 25, 38. [Google Scholar] [CrossRef]
Figure 1. Sphingolipid profiles of normal adjacent uninvolved tissues and tumors of male patients diagnosed with LUAD, COAD, HCC, and HNSCC and of female patients with EEC. The indicated chain-length sphingolipids were quantified by LC-ESI-MS/MS in normal adjacent uninvolved tissues (unin.) and tumors of self-identified AA and NHW subjects (data combined in plots) with primary histopathologic confirmed diagnoses of lung adenocarcinoma (LUAD; panels (AD,U)), endometrial endometroid carcinoma (EEC; panels (EH,V)), colorectal adenocarcinoma (COAD; panels (IL,W)), hepatocellular adenocarcinoma (HCC; panels (MP,X)), and head and neck squamous cell carcinoma (HNSCC; panels (QT,Y)). Lipid levels are shown as the amount of picomoles of indicated chain length and lipid species per mg of tissue. For LUAD, unin. n = 34, tumor n = 40; EEC, n = 22; COAD, n = 54; HCC, n = 21; HNSCC, unin. n = 24, tumor n = 23. Graphs are box plots showing medians (black line) and whiskers of min to max. Uncorrected p-values for associations considered significant (α ≤ 0.05) are shown, with values of the predicted mean difference (ANOVA) between unin. and tumor tissue lipid levels shown in parenthesis. The lower limit of p- and q-value calculations was set to 1.0 × 10⁻¹⁵ (Prism), so no values are reported lower than this limit. For p-adjusted (q) values corrected for multiple comparisons using the false discovery rate (FDR; Q = 0.05) and the two-step controlling procedure of Benjamini, Krieger, and Yekutieli (BKY), see Supplementary Tables S1 (LUAD), S2 (EEC), S3 (COAD), S4 (HCC), and S5 (HNSCC). For panels (UY), the y-axis is in log2 scale.
Cancers 15 02238 g001
Figure 2. Sphingolipid profiles of normal adjacent uninvolved tissues and tumors of self-identified AA males diagnosed with LUAD, COAD, HCC, and HNSCC and of self-identified AA females with EEC. The indicated chain-length sphingolipids were quantified by LC-ESI-MS/MS in normal adjacent uninvolved tissues (unin.) and tumors of self-identified AA subjects with primary histopathologic confirmed diagnoses of lung adenocarcinoma (LUAD; panels (AD,U)), endometrial endometroid carcinoma (EEC; panels (EH,V), colorectal adenocarcinoma (COAD; panels (IL,W)), hepatocellular adenocarcinoma (HCC; panels (MP,X)), and head and neck squamous cell carcinoma (HNSCC; panels (QT,Y)). Lipid levels are shown as the amount of picomoles of indicated chain length and lipid species per mg of tissue. For LUAD, unin. n = 12, tumor n = 14; EEC, n = 10; COAD, n = 30; HCC, n = 10; HNSCC, unin. n = 12, tumor n = 11. Graphs are box plots showing medians (black line) and whiskers of min to max. Uncorrected p-values for associations considered significant (α ≤ 0.05) are shown, with values of the predicted mean difference (ANOVA) between unin. and tumor tissue lipid levels shown in parenthesis. The lower limit of p- and q-value calculations was set to 1.0 × 10⁻¹⁵ (Prism), so no values are reported lower than this limit. For p-adjusted (q) values corrected for multiple comparisons using the FDR (Q = 0.05) and the two-step controlling procedure of BKY, see Supplementary Tables S6 (LUAD), S7 (EEC), S8 (COAD), S9 (HCC), and S10 (HNSCC). For panels (UY), the y-axis is in log2 scale.
Cancers 15 02238 g002
Figure 3. Sphingolipid profiles of normal adjacent uninvolved tissues and tumors of self-identified NHW males diagnosed with LUAD, COAD, HCC, and HNSCC and of self-identified NHW females with EEC. The indicated chain-length sphingolipids were quantified by LC-ESI-MS/MS in normal adjacent uninvolved tissues (unin.) and tumors of self-identified NHW subjects with primary histopathologic confirmed diagnoses of lung adenocarcinoma (LUAD; panels (AD,U)), endometrial endometroid carcinoma (EEC; panels (EH,V)), colorectal adenocarcinoma (COAD; panels (IL,W)), hepatocellular adenocarcinoma (HCC; panels (MP,X)), and head and neck squamous cell carcinoma (HNSCC; panels (QT,Y)). Lipid levels are shown as the amount of picomoles of indicated chain length and lipid species per mg of tissue. For LUAD, unin. n = 22, tumor n = 26; EEC, n = 12; COAD, n = 24; HCC, n = 11; HNSCC, n = 12. Graphs are box plots showing medians (black line) and whiskers of min to max. Uncorrected p-values for associations considered significant (α ≤ 0.05) are shown, with values of the predicted mean difference (ANOVA) between unin. and tumor tissue lipid levels shown in parenthesis. The lower limit of p- and q-value calculations was set to 1.0 E-15 (Prism), so no values are reported lower than this limit. For p-adjusted (q) values corrected for multiple comparisons using the FDR (Q = 0.05) and the two-step controlling procedure of BKY, see Supplementary Tables S11 (LUAD), S12 (EEC), S13 (COAD), S14 (HCC), and S15 (HNSCC). For panels (UY), the y-axis is in log2 scale. Alterations considered significant (α ≤ 0.05) are in bold text.
Cancers 15 02238 g003
Figure 4. Secondary analysis comparisons of unin. vs. unin. and tumor vs. tumor sphingolipid profiles of self-identified AA and NHW males with LUAD. Data presented in Figure 2A–D,U and Figure 3A–D,U were analyzed to examine differences in the indicated lipids between unin. and tumor tissues of AA and NHW with LUAD. In each panel (AE), the upper graphs are box plots showing medians (black line) and whiskers of min to max (top), and the bottom graphs are plots of the 95% family-wise significance and confidence intervals for predicted means difference calculated following ANOVA. Corresponding unadjusted p-values (Fisher’s LSD; Prism) for the indicated comparisons are shown to the right of the 95% confidence interval plots. The lower limit of p- and q-value calculations was set to 1.0 × 10⁻¹⁵ (Prism), so no values are reported lower than this limit. For p-adjusted (q) values corrected for multiple comparisons using the FDR (Q = 0.05) and the two-step controlling procedure of BKY, see Supplementary Table S16. For panel (E), the y-axis is in log2 scale. Alterations considered significant (α ≤ 0.05) are in bold text.
Cancers 15 02238 g004
Figure 5. Secondary analysis comparisons of unin. vs. unin. and tumor vs. tumor sphingolipid profiles of self-identified AA and NHW females with EEC. Data presented in Figure 2E–H,V and Figure 3E–H,V were analyzed to examine differences in the indicated lipids between unin. and tumor tissues of self-identified AA and NHW females with EEC. In each panel (AE), the upper graphs are box plots showing medians (black line) and whiskers of min to max (top), and the bottom graphs are plots of the 95% family-wise significance and confidence intervals for predicted means difference calculated following ANOVA. Corresponding unadjusted p-values (Fisher’s LSD; Prism) for the indicated comparisons are shown to the right of the 95% confidence interval plots. The lower limit of p- and q-value calculations was set to 1.0 × 10⁻¹⁵ (Prism), so no values are reported lower than this limit. For p-adjusted (q) values corrected for multiple comparisons using the FDR (Q = 0.05) and the two-step controlling procedure of BKY, see Supplementary Table S17. For panel (E), the y-axis is in log2 scale. Alterations considered significant (α ≤ 0.05) are in bold text.
Cancers 15 02238 g005
Figure 6. Secondary analysis comparisons of unin. vs. unin. and tumor vs. tumor sphingolipid profiles of self-identified AA and NHW males with COAD. Data presented in Figure 2I–L,W and Figure 3I–L,W were analyzed to examine differences in the indicated lipids between unin. and tumor tissues of self-identified AA and NHW males with COAD. In each panel (AE), the upper graphs are box plots showing medians (black line) and whiskers of min to max (top), and the bottom graphs are plots of the 95% family-wise significance and confidence intervals for predicted means difference calculated following ANOVA. Corresponding unadjusted p-values (Fisher’s LSD; Prism) for the indicated comparisons are shown to the right of the 95% confidence interval plots. The lower limit of p- and q-value calculations was set to 1.0 × 10⁻¹⁵ (Prism), so no values are reported lower than this limit. For p-adjusted (q) values corrected for multiple comparisons using the FDR (Q = 0.05) and the two-step controlling procedure of BKY, see Supplementary Table S18. For panel (E), the y-axis is in log2 scale. Alterations considered significant (α ≤ 0.05) are in bold text.
Cancers 15 02238 g006
Figure 7. Secondary analysis comparisons of unin. vs. unin. and tumor vs. tumor sphingolipid profiles of self-identified AA and NHW males with HCC. Data presented in Figure 2M–P,X and Figure 3M–P,X were analyzed to examine differences in the indicated lipids between unin. and tumor tissues of self-identified AA and NHW males with HCC. In each panel (AE), the upper graphs are box plots showing medians (black line) and whiskers of min to max (top), and the bottom graphs are plots of the 95% family-wise significance and confidence intervals for predicted means difference (means diff.) calculated following ANOVA. Corresponding unadjusted p-values (Fisher’s LSD; Prism) for the indicated comparisons are shown to the right of the 95% confidence interval plots. The lower limit of p- and q-value calculations was set to 1.0 × 10⁻¹⁵ (Prism), so no values are reported lower than this limit. For p-adjusted (q) values corrected for multiple comparisons using the FDR (Q = 0.05) and the two-step controlling procedure of BKY, see Supplementary Table S19. For panel (E), the y-axis is in log2 scale. Alterations considered significant (α ≤ 0.05) are in bold text.
Cancers 15 02238 g007
Figure 8. Secondary analysis comparisons of unin. vs. unin. and tumor vs. tumor sphingolipid profiles of self-identified AA and NHW males with HNSCC. Data presented in Figure 2Q–T,Y and Figure 3Q–T,Y were analyzed to examine differences in the indicated lipids between unin. and tumor tissues of self-identified AA and NHW males with HNSCC. In each panel (AE), the upper graphs are box plots showing medians (black line) and whiskers of min to max (top), and the bottom graphs are plots of the 95% family-wise significance and confidence intervals for predicted means difference calculated following ANOVA. Corresponding unadjusted p-values (Fisher’s LSD; Prism) for the indicated comparisons are shown to the right of the 95% confidence interval plots. The lower limit of p- and q-value calculations was set to 1.0 × 10⁻¹⁵ (Prism), so no values are reported lower than this limit. For p-adjusted (q) values corrected for multiple comparisons using the FDR (Q = 0.05) and the two-step controlling procedure of BKY, see Supplementary Table S20. For panel (E), the y-axis is in log2 scale. Alterations considered significant (α ≤ 0.05) are in bold text.
Cancers 15 02238 g008
Figure 9. Race-independent pan-cancer analysis of alterations in tumors of subjects with LUAD, COAD, HCC, EEC, and HNSCC. Data from AA and NHW presented in Figure 2 and Figure 3 were pooled by sphingolipid class and acyl chain length and analyzed to examine pan-cancer alterations in human cancers. In each panel (AE), the upper graphs are box plots showing medians (black line) and whiskers of min to max (top), and the bottom graphs are plots of the 95% family-wise significance and confidence intervals for predicted means difference calculated following ANOVA. The mean fold-change between unin. tissue and tumor was calculated by dividing the mean lipid level in tumors by the mean lipid level in unin. tissues and shown between parenthesis next to the corresponding unadjusted p-values (Fisher’s LSD; Prism). The lower limit of p- and q-value calculations was set to 1.0 × 10⁻¹⁵ (Prism), so no values are reported lower than this limit. For p-adjusted (q) values corrected for multiple comparisons using the FDR (Q = 0.05) and the two-step controlling procedure of BKY, see Supplementary Table S21. For panel (E), the y-axis is in log2 scale. Alterations considered significant (α ≤ 0.05) are in bold text.
Cancers 15 02238 g009
Figure 10. Race-dependent pan-cancer analysis of differences in the unin. and tumor tissues of AA and NHW subjects with LUAD, COAD, HCC, EEC, and HNSCC. Data from AA and NHW presented in Figure 2 and Figure 3 were pooled by race, sphingolipid class, and acyl chain length and analyzed to examine differences between the unin. and tumor tissues of AA and NHW with pan-cancer. In each panel (AE), the upper graphs are box plots showing medians (black line) and whiskers of min to max (top), and the bottom graphs are plots of the 95% family-wise significance and confidence intervals for predicted means difference (means diff.) calculated following ANOVA. The mean fold-change between unin. tissue and tumor was calculated by dividing the calculated mean lipid level in tumors by the mean lipid level in unin. tissues and shown between parenthesis next to the corresponding unadjusted p-values (Fisher’s LSD; Prism). The lower limit of p- and q-value calculations was set to 1.0 × 10⁻¹⁵ (Prism), so no values are reported lower than this limit. For p-adjusted (q) values corrected for multiple comparisons using the FDR (Q = 0.05) and the two-step controlling procedure of BKY, see Supplementary Table S22. For panel (E), the y-axis is in log2 scale. Alterations considered significant (α ≤ 0.05) are in bold text.
Cancers 15 02238 g010
Table 1. The characteristics of subjects in lipidomic analysis cohort by disease, race, and sex. p-values are for comparisons between the ages of subjects in each group and were analyzed using a two-tailed student’s t-test with α = 0.05.
EECLUADHCC HNSCCCOAD
AA (n = 10)NHW (n = 12)AA (Unin., n = 12; Tumor, n = 14)NHW (Unin., n = 22; Tumor, n = 26)AA (n = 10)NHW (n = 11)AA (Unin., n = 12; Tumor, n = 11)NHW (n = 12)AA (n = 30)NHW (n = 24)
SexFemaleMaleMaleMaleMale
Mean age (SD)60.7 (9.1)61.3 (14.4)60.8 (6.7)69.6 (9.1)62.2 (5.5)64.5 (16.8)62 (9.5)58.6 (11.6)63.5 (13.6)65.7 (10.5)
Minimum–maximum49–7930–8252–7547–8353–7319–7839–7544–7846–9441–86
p-value0.91760.00180.69010.43450.5214
Disclaimer/Publisher’s Note: The statements, opinions and data contained in all publications are solely those of the individual author(s) and contributor(s) and not of MDPI and/or the editor(s). MDPI and/or the editor(s) disclaim responsibility for any injury to people or property resulting from any ideas, methods, instructions or products referred to in the content.

