

SOX1 Functions as a Tumor Suppressor by Repressing HES1 in Lung Cancer
 , , , and
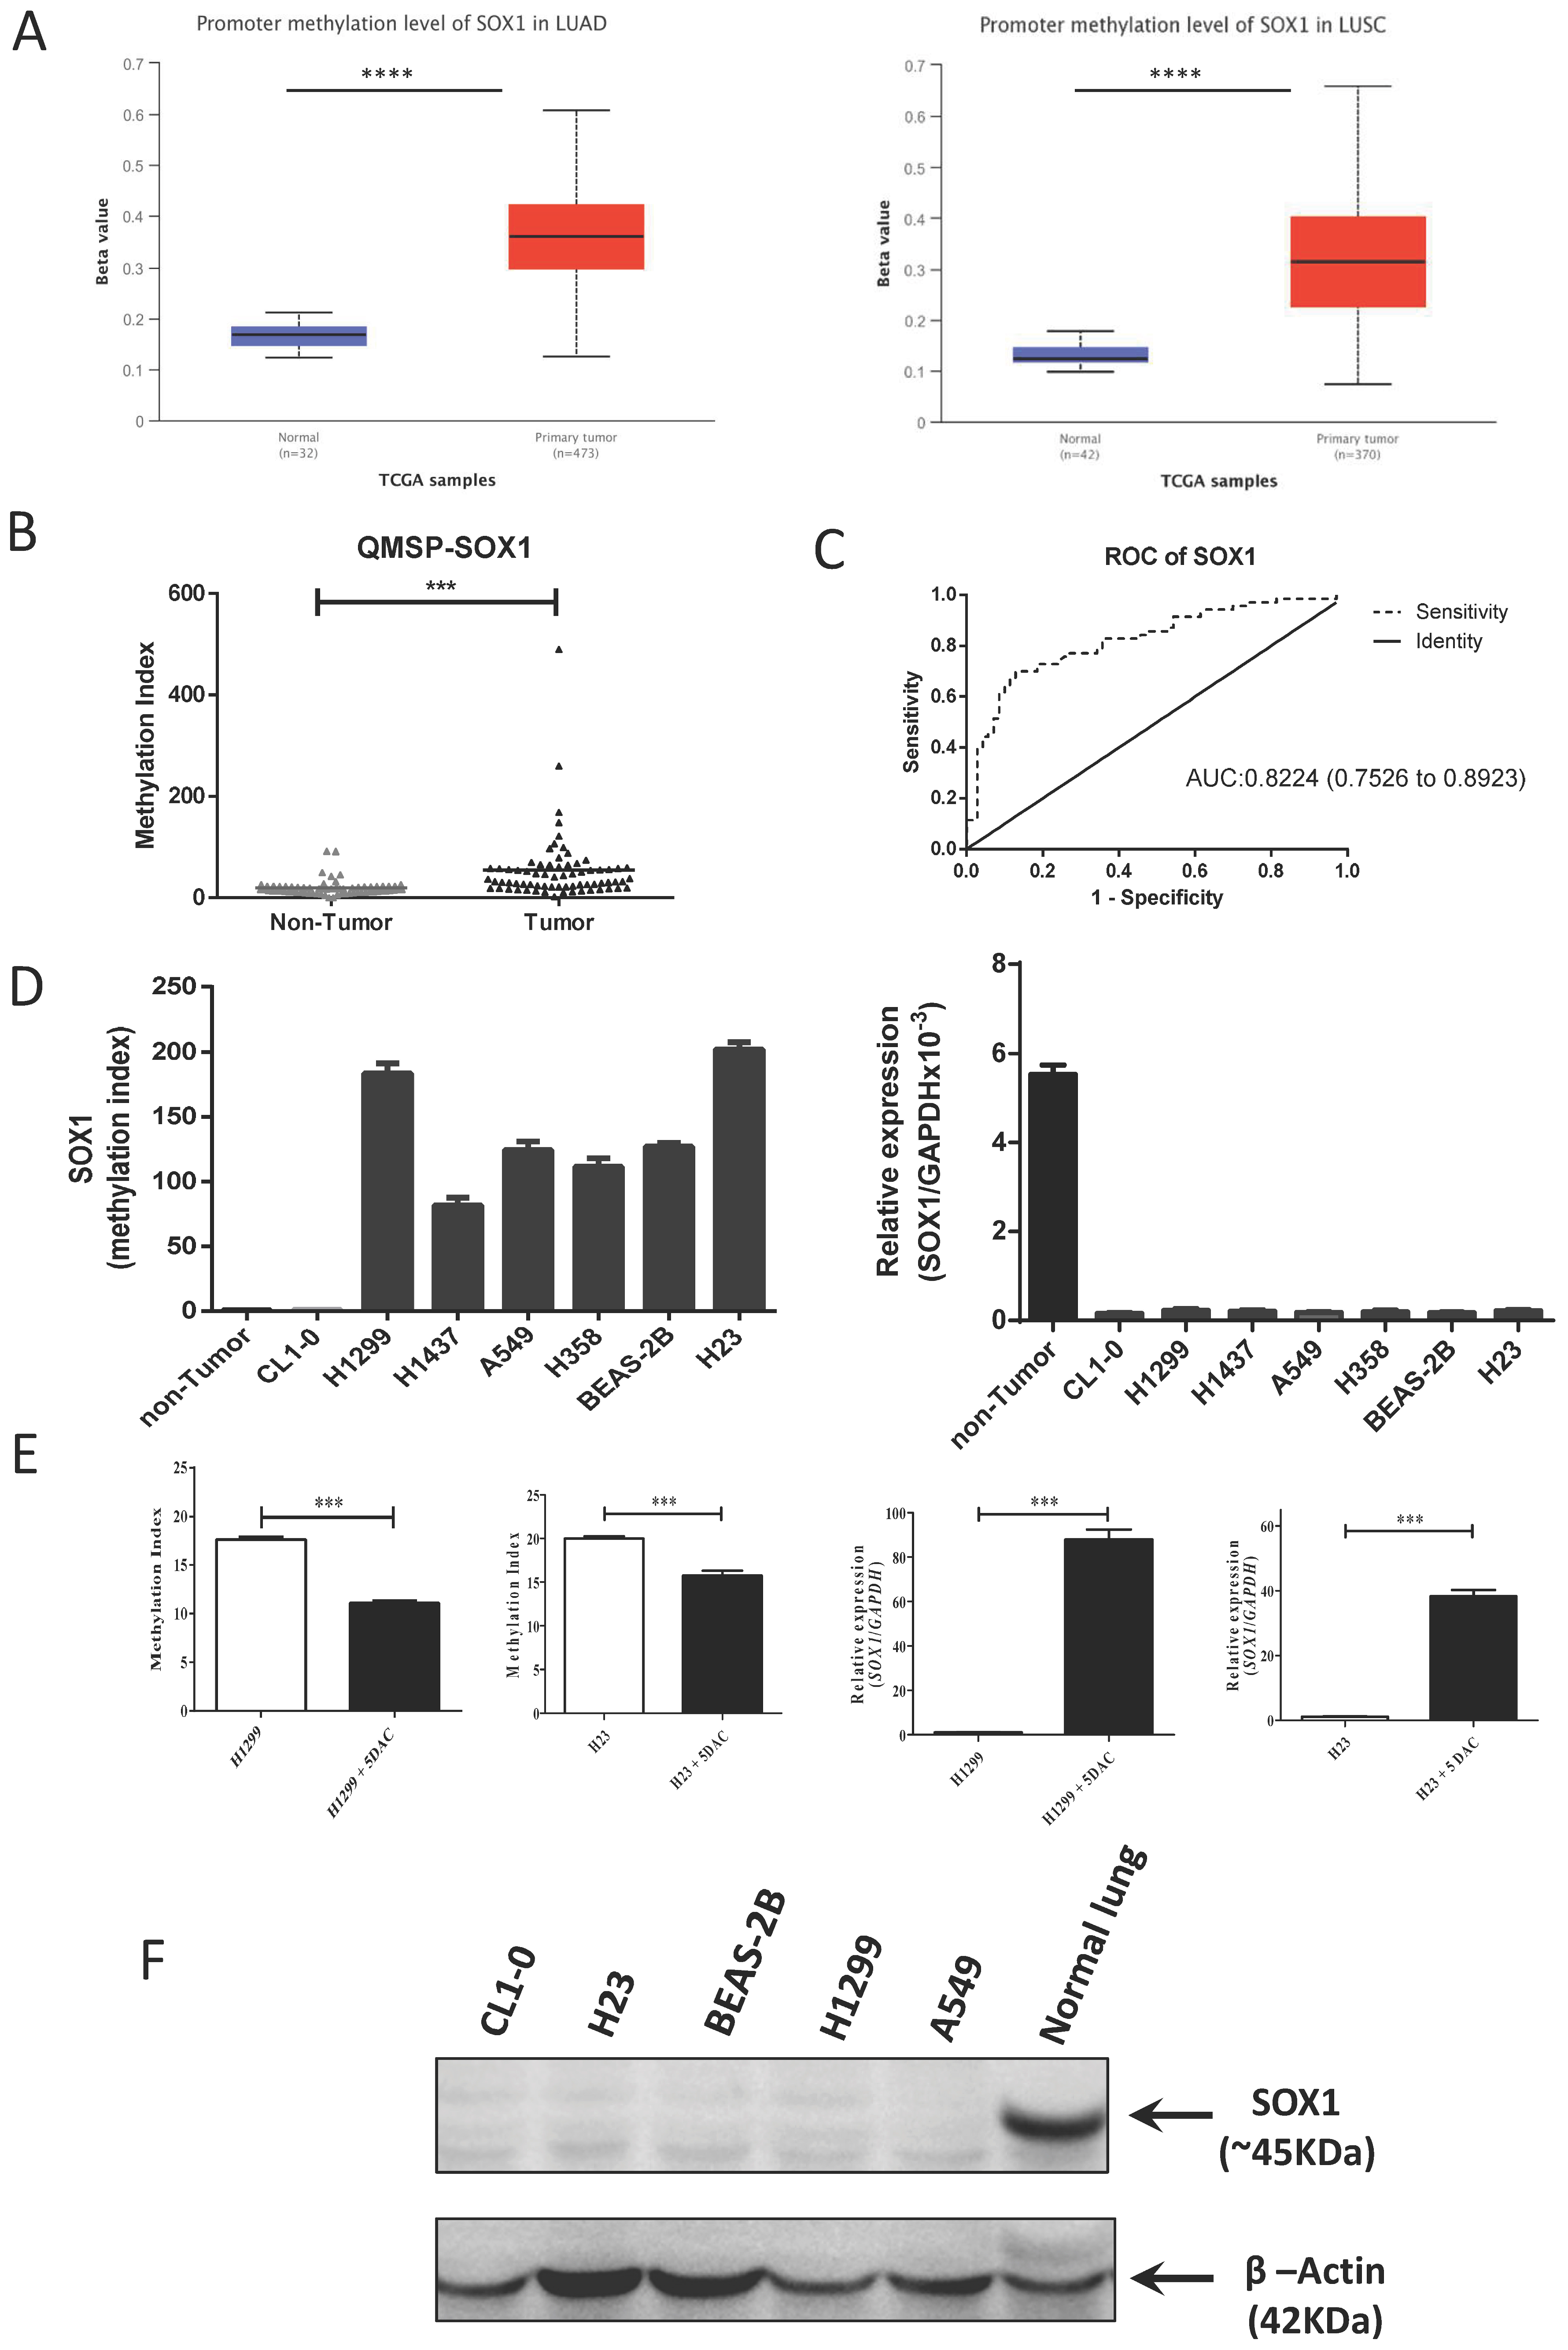
Abstract
Simple Summary
Abstract
1. Introduction
2. Materials and Methods
2.1. Clinical Tissue Samples
2.2. Bioinformatics Analysis
2.3. Cell Lines
2.4. DNA Methylation and Gene Expression Analysis
2.5. Plasmids and shRNA Clones
2.6. Assays for Western Blot, Cell Viability, Anchorage-Independent Growth, and Invasion
2.7. Immunofluorescence Staining
2.8. In Vivo Tumor Xenograft and Metastasis Model
2.9. RNA Sequencing Data Analysis
2.10. Chromatin Immunoprecipitation Assay (ChIP Assay)
2.11. Statistical Analysis
3. Results
3.1. Promoter Hypermethylation of SOX1 in Lung Cancer Contributes to SOX1 Silencing/Downregulation
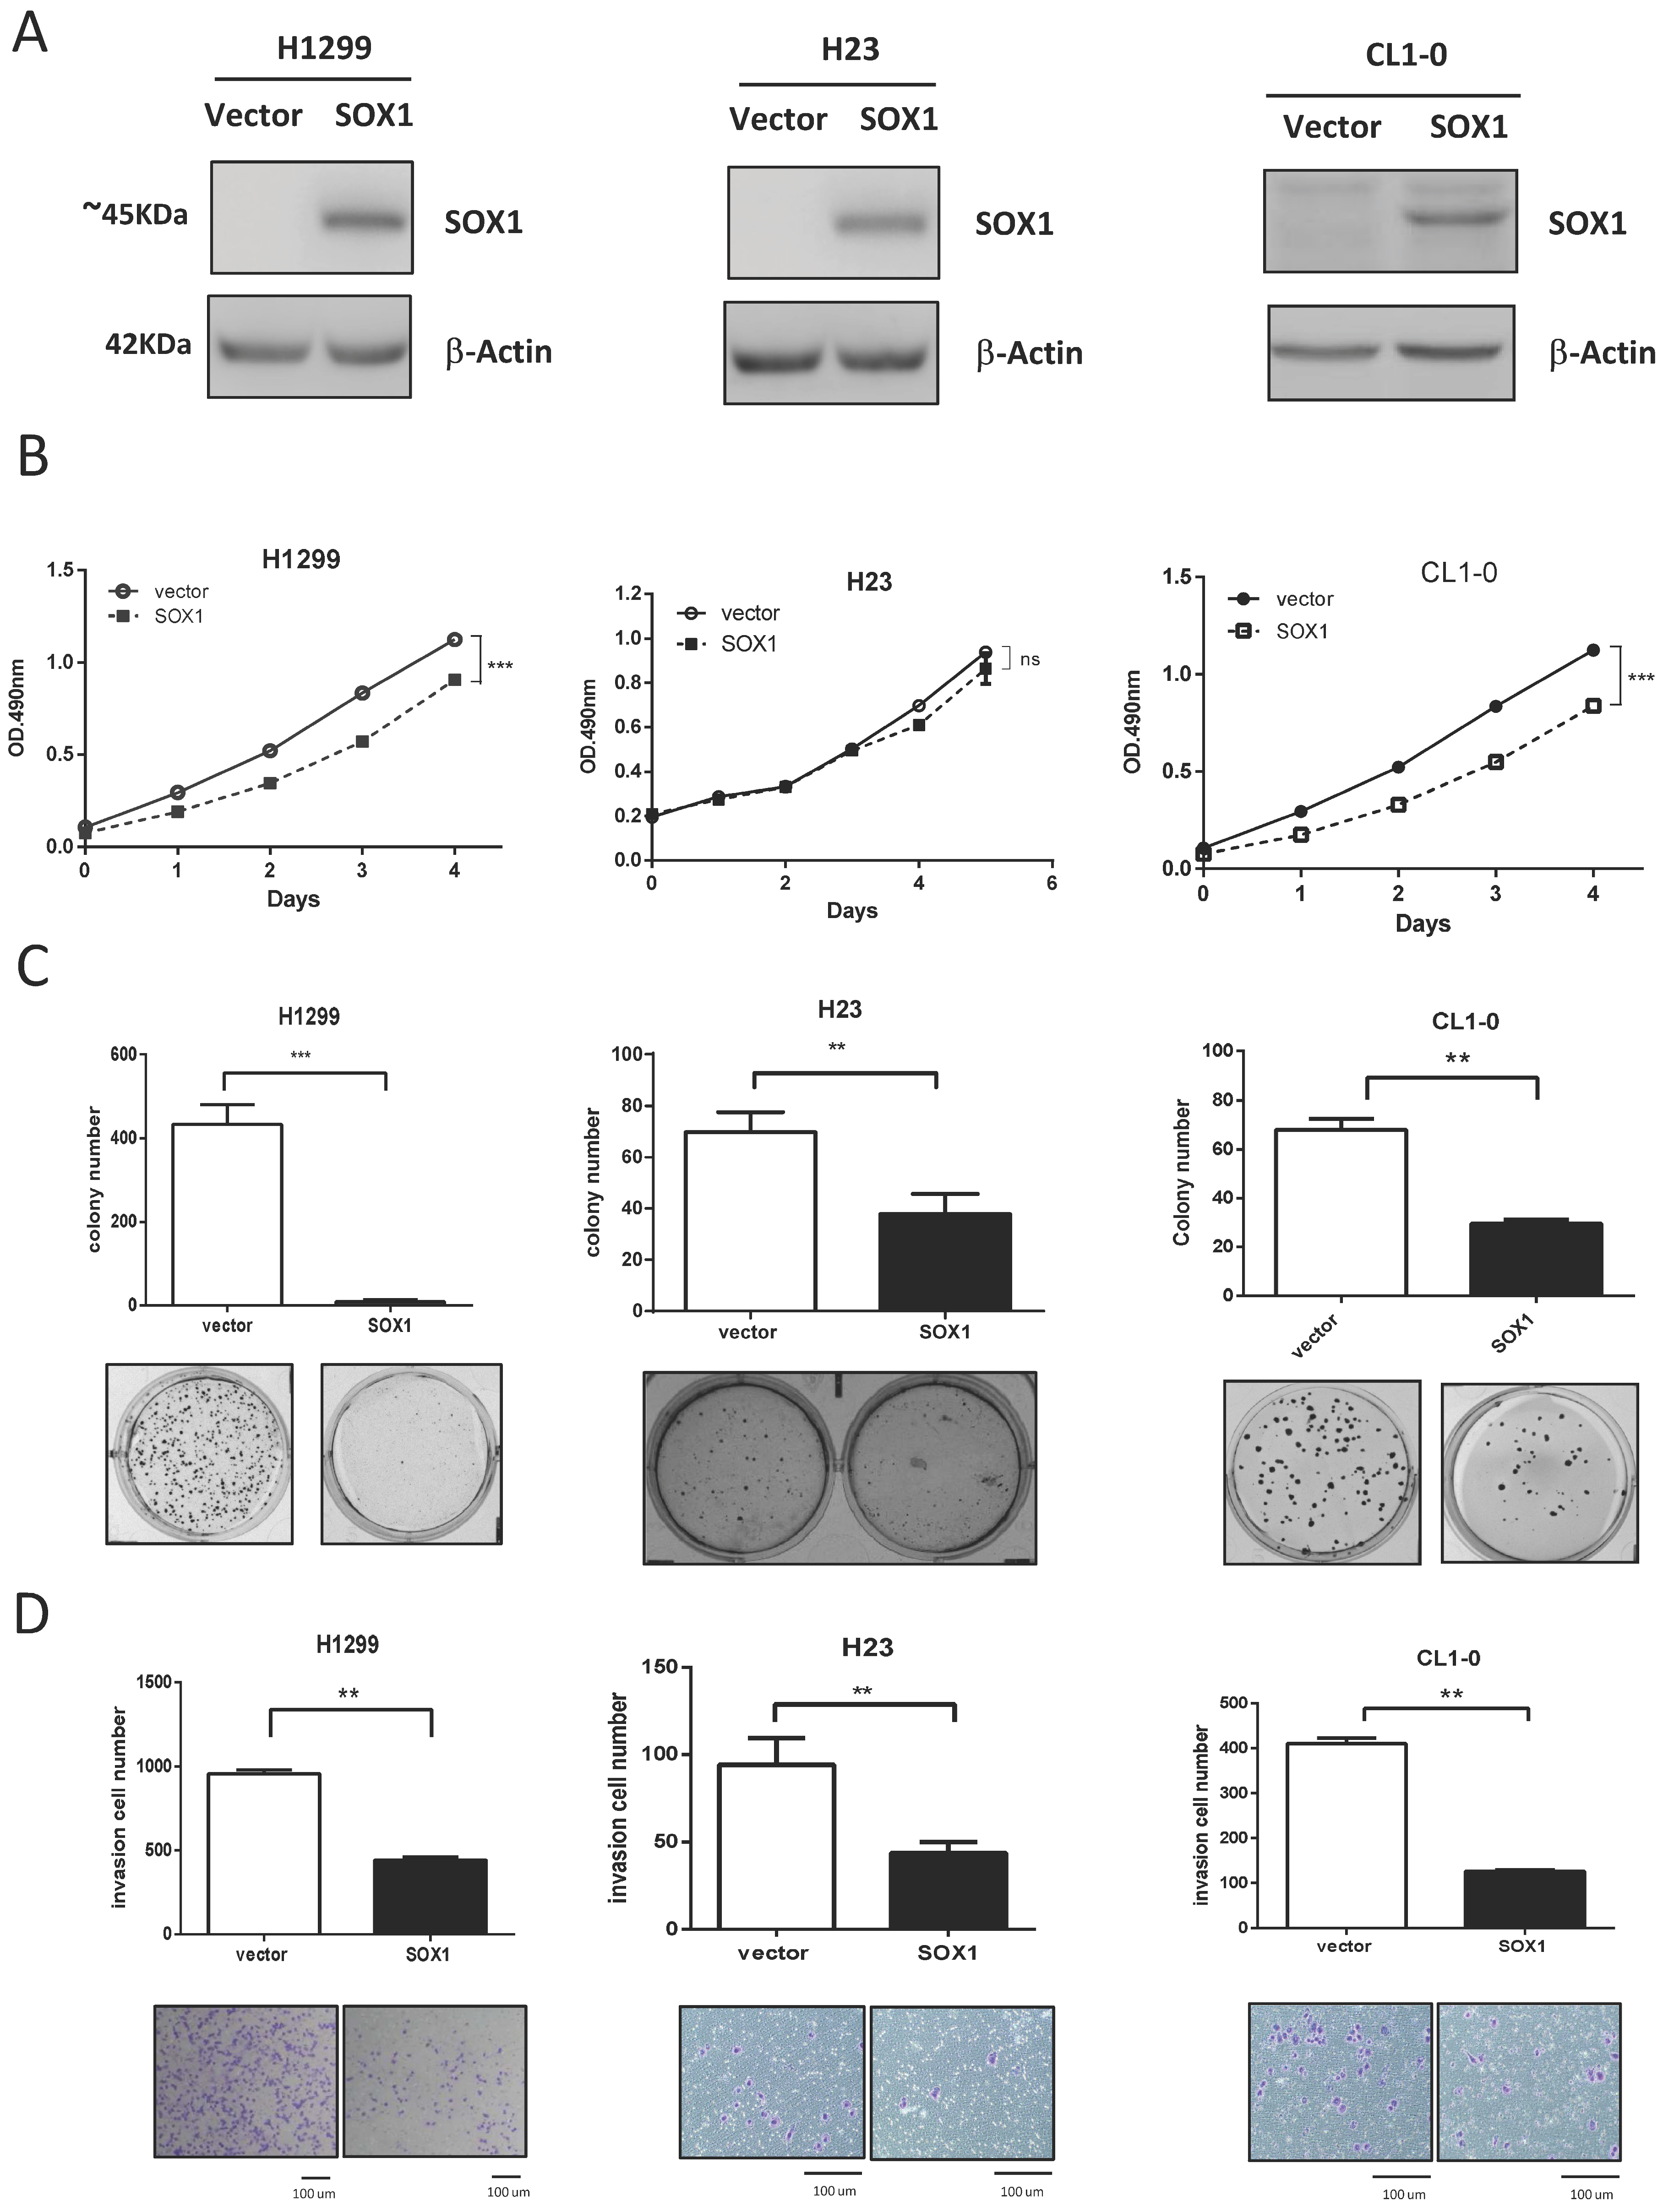
3.2. Ectopic Expression of SOX1 Suppresses Lung Cancer Growth and Invasion
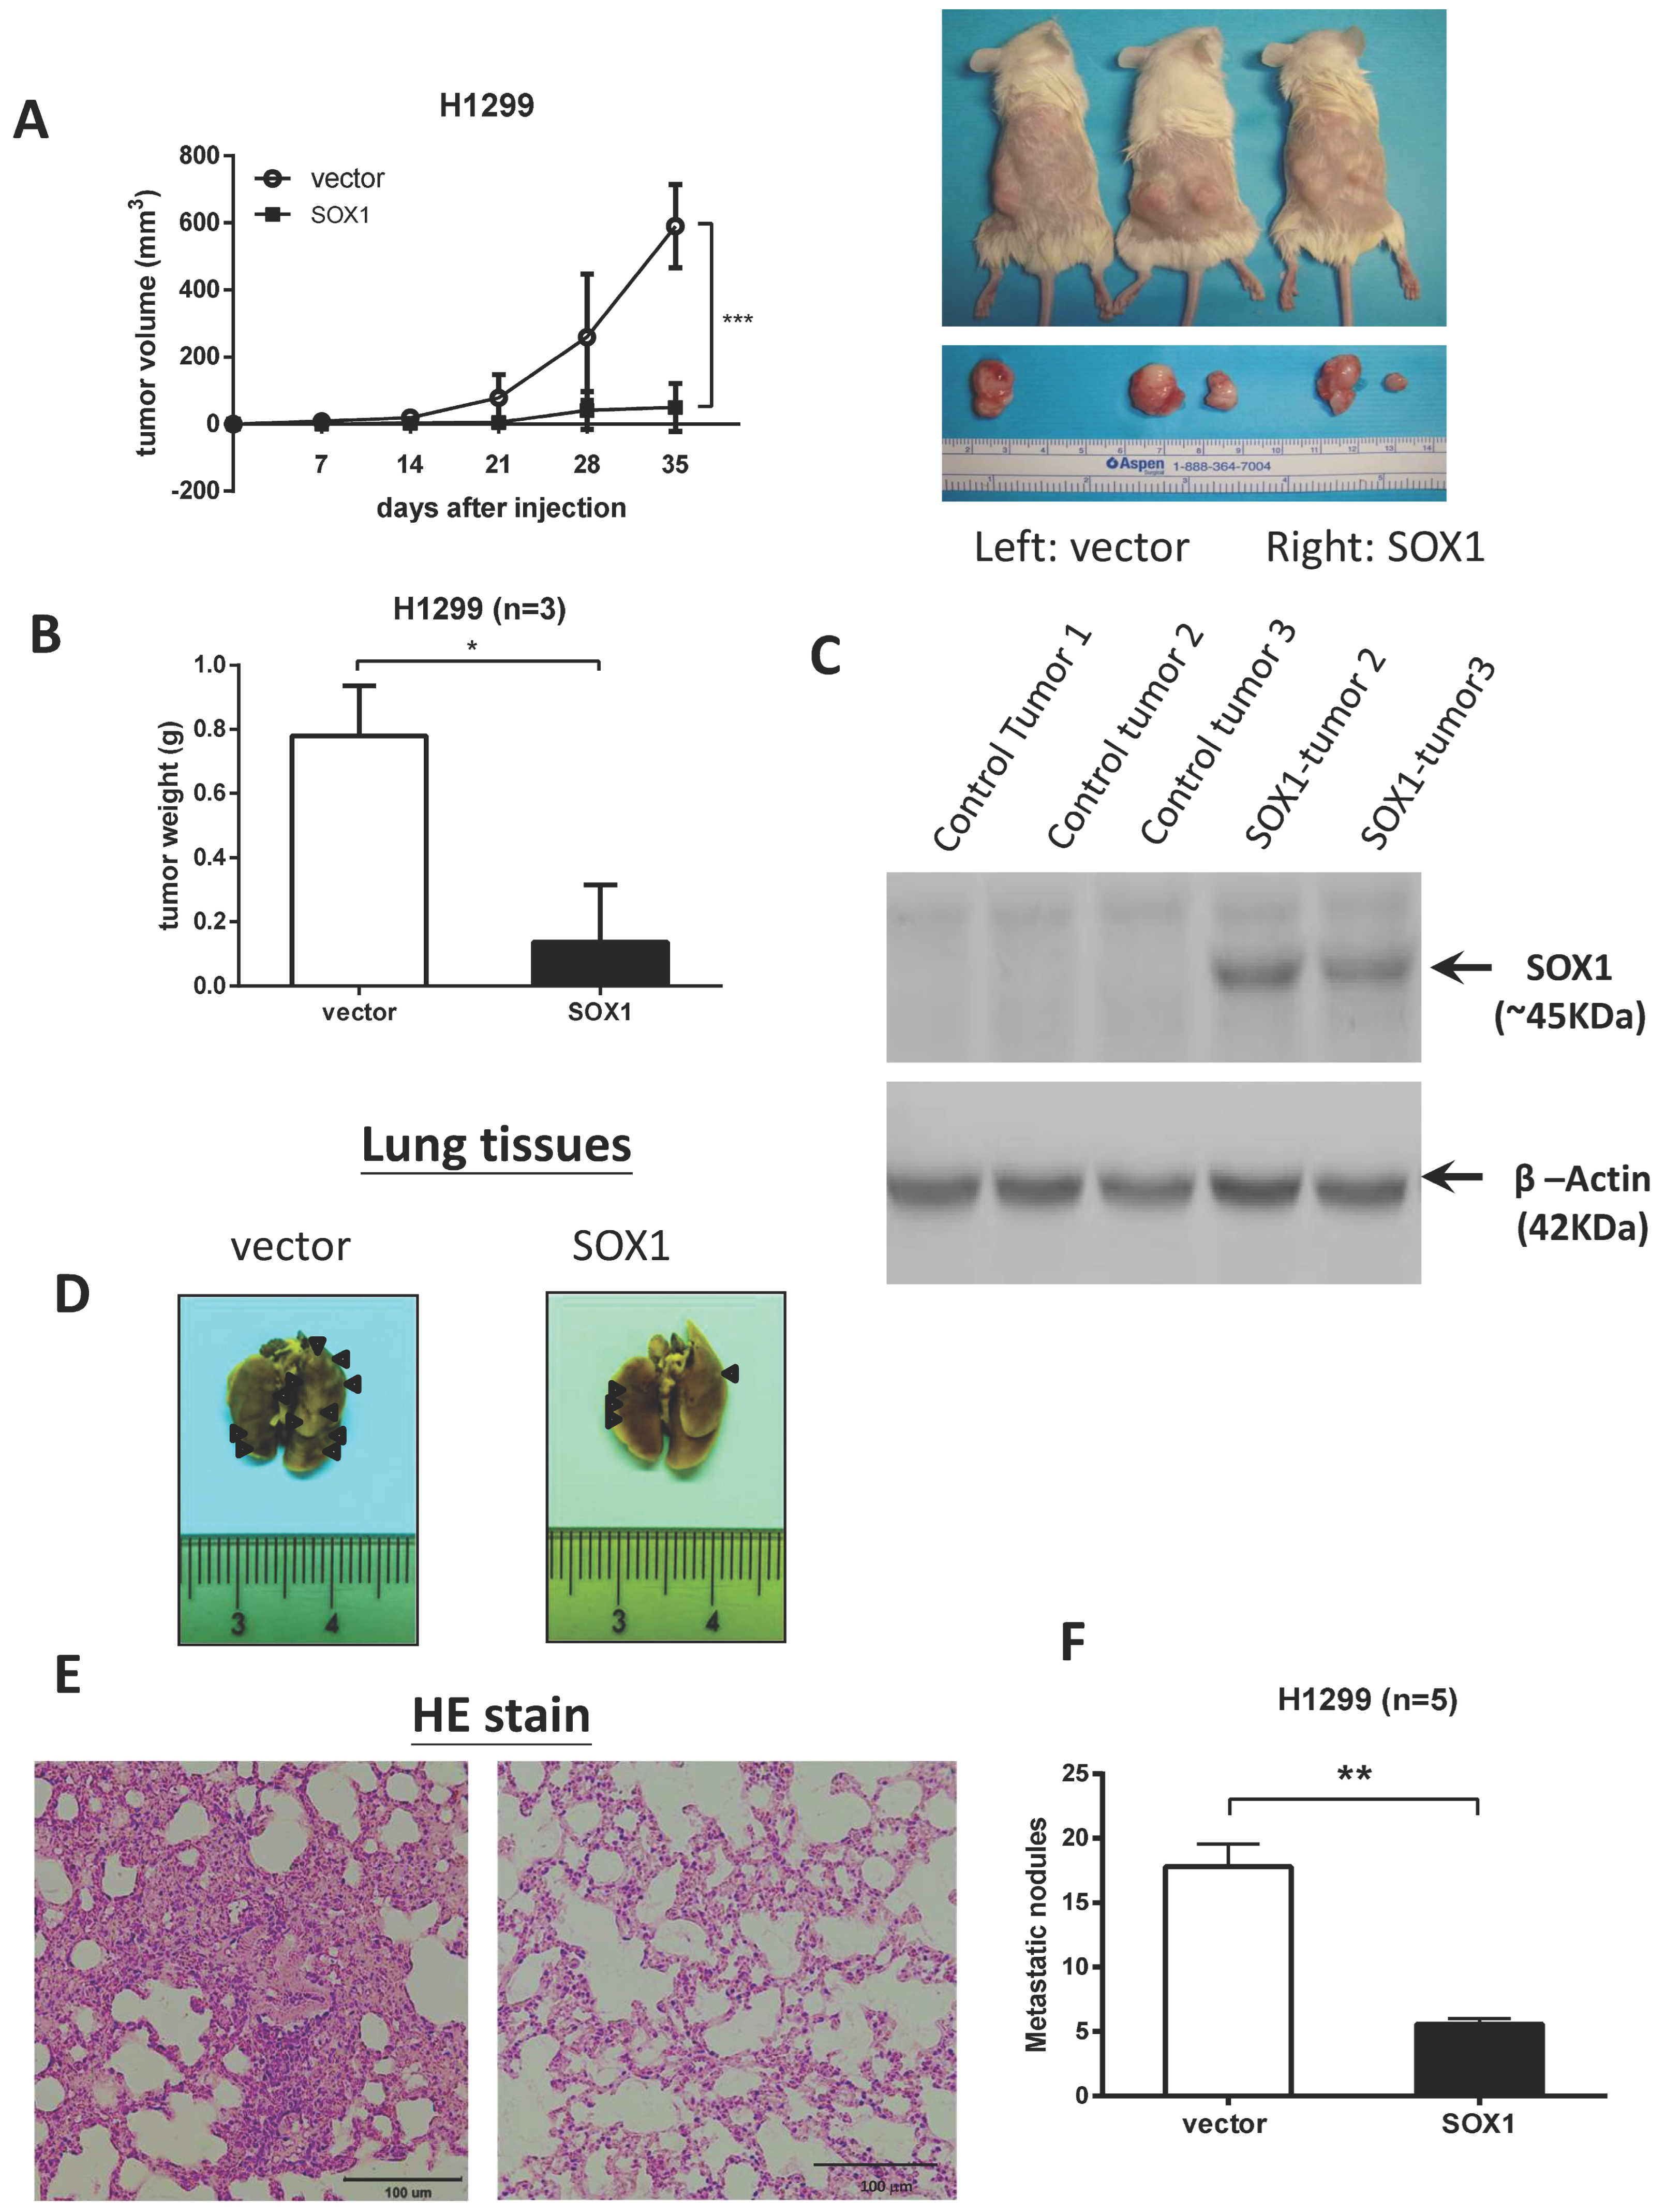
3.3. Restoration of SOX1 Expression Inhibits Tumor Growth and Metastasis in NOD/SCID Mice
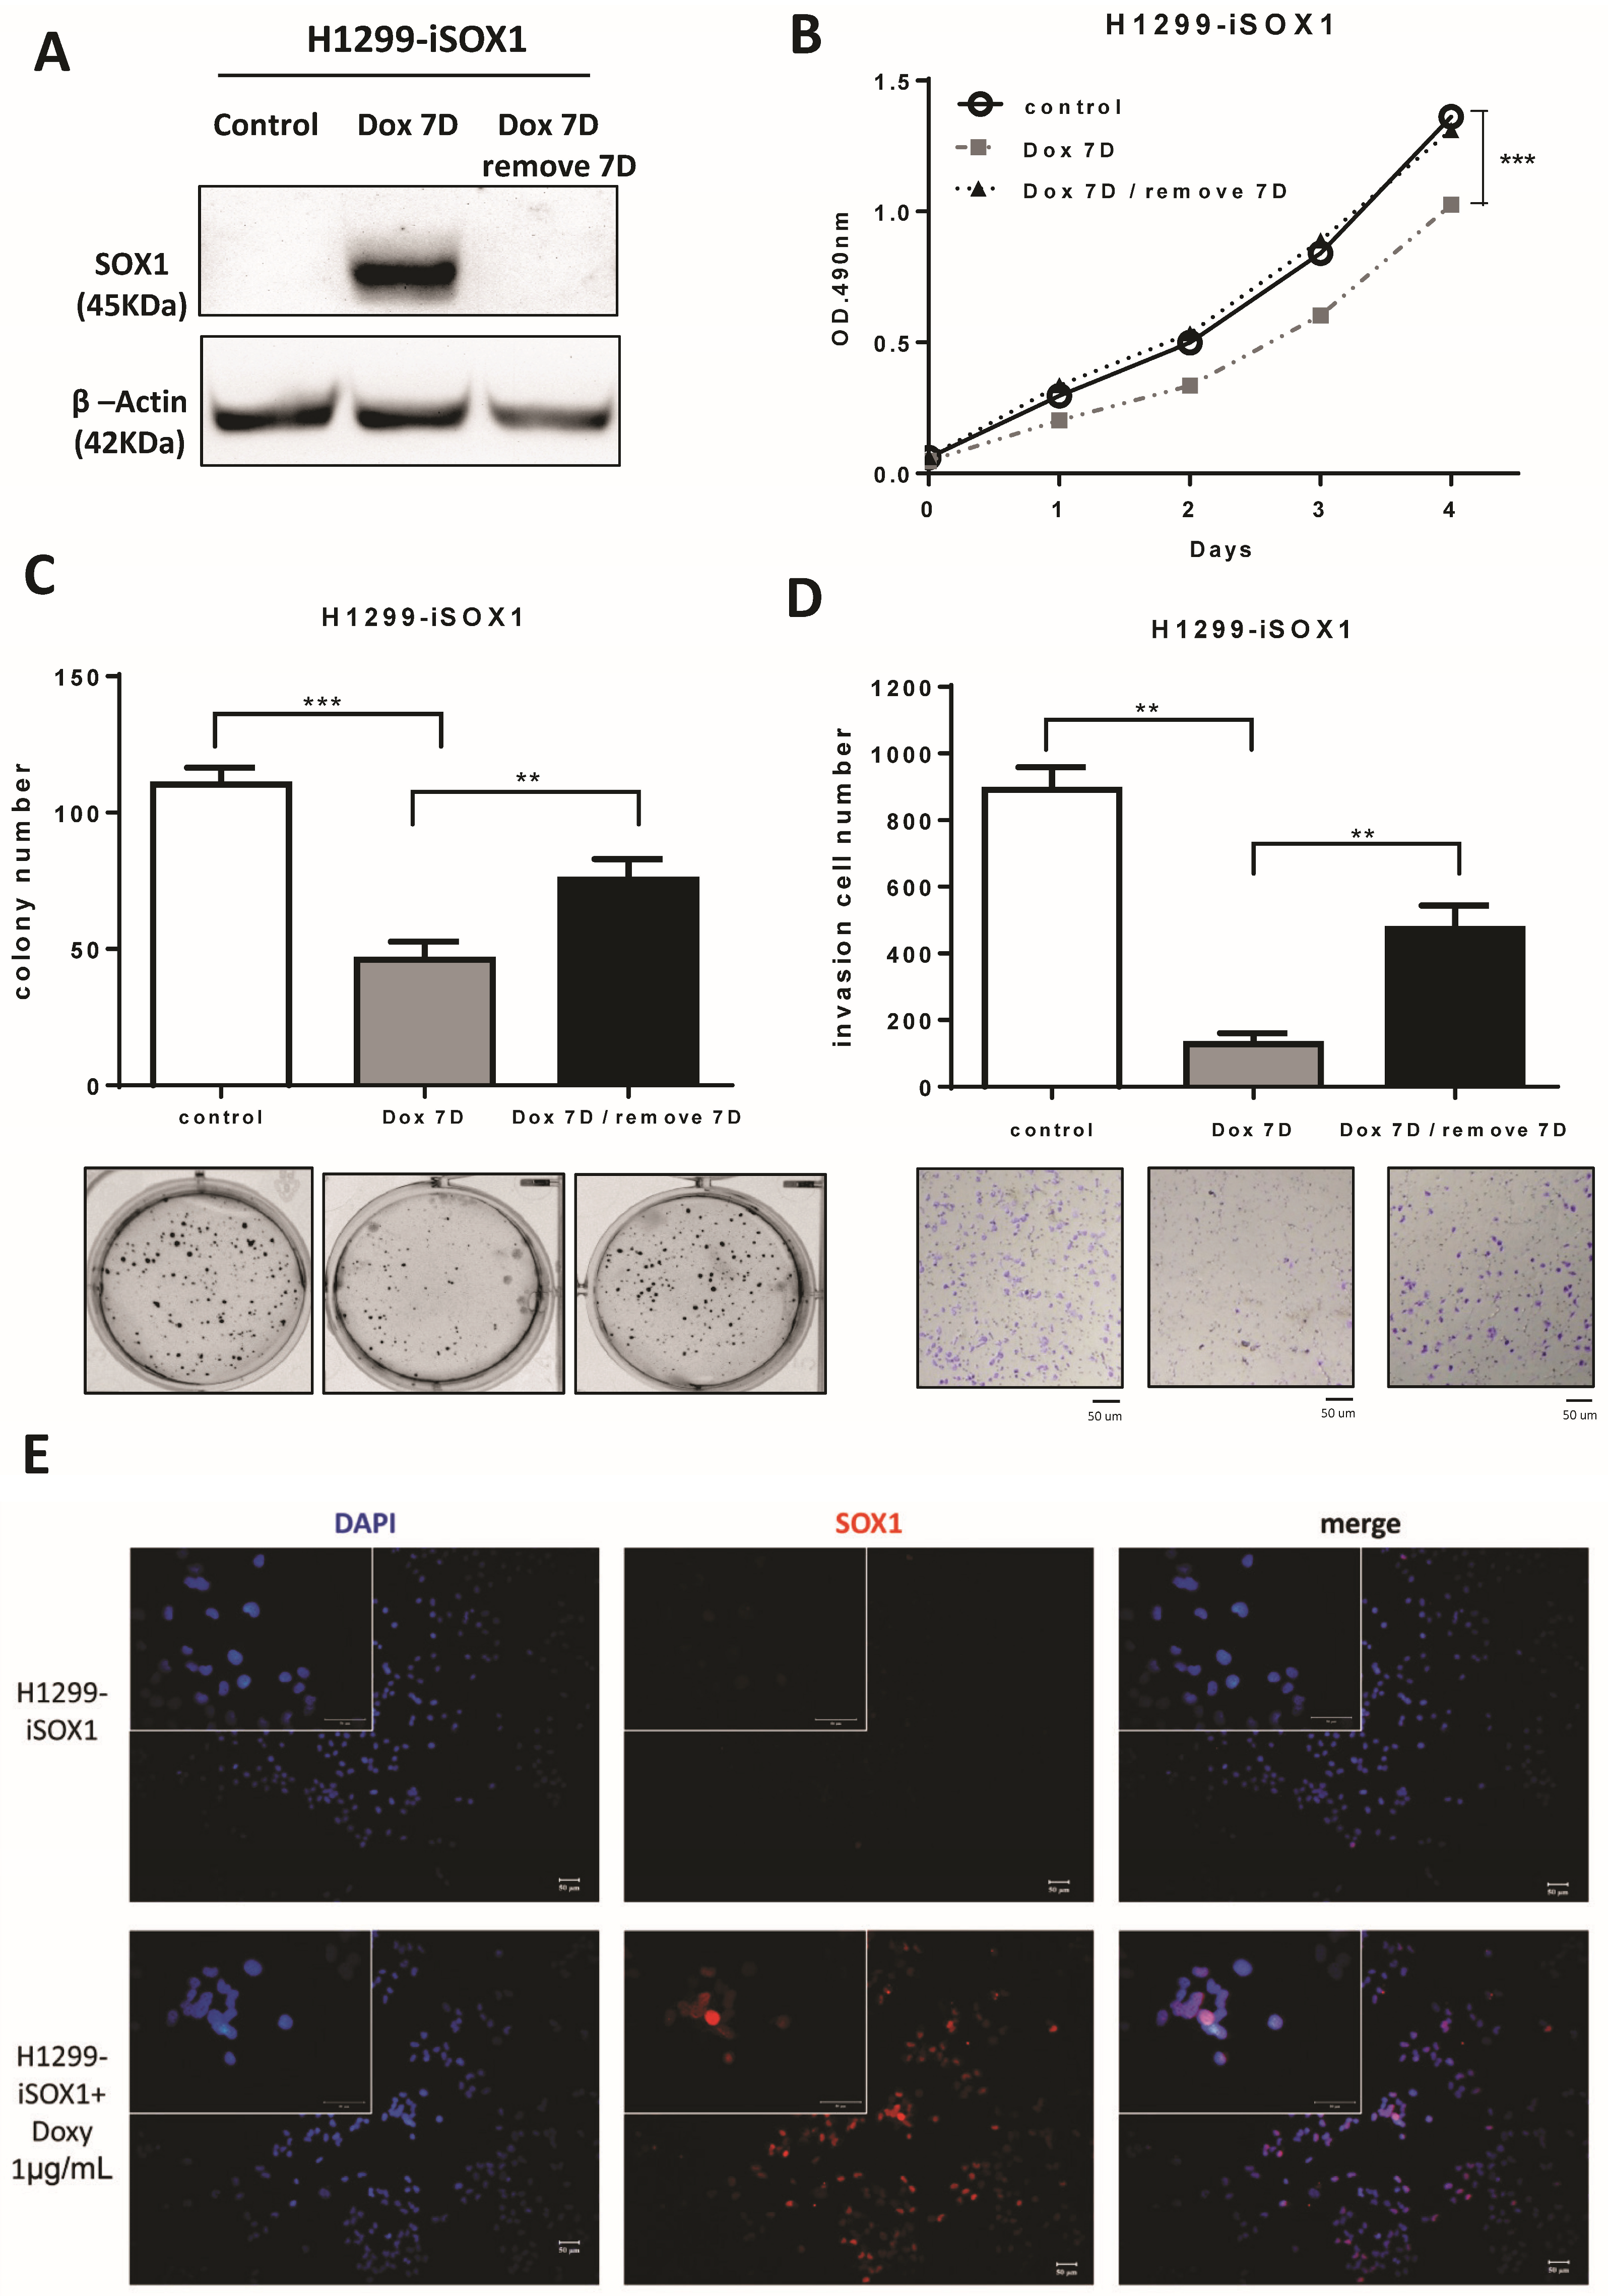
3.4. SOX1 Suppresses Lung Cancer Cell Growth and Invasion in an Inducible Expression System
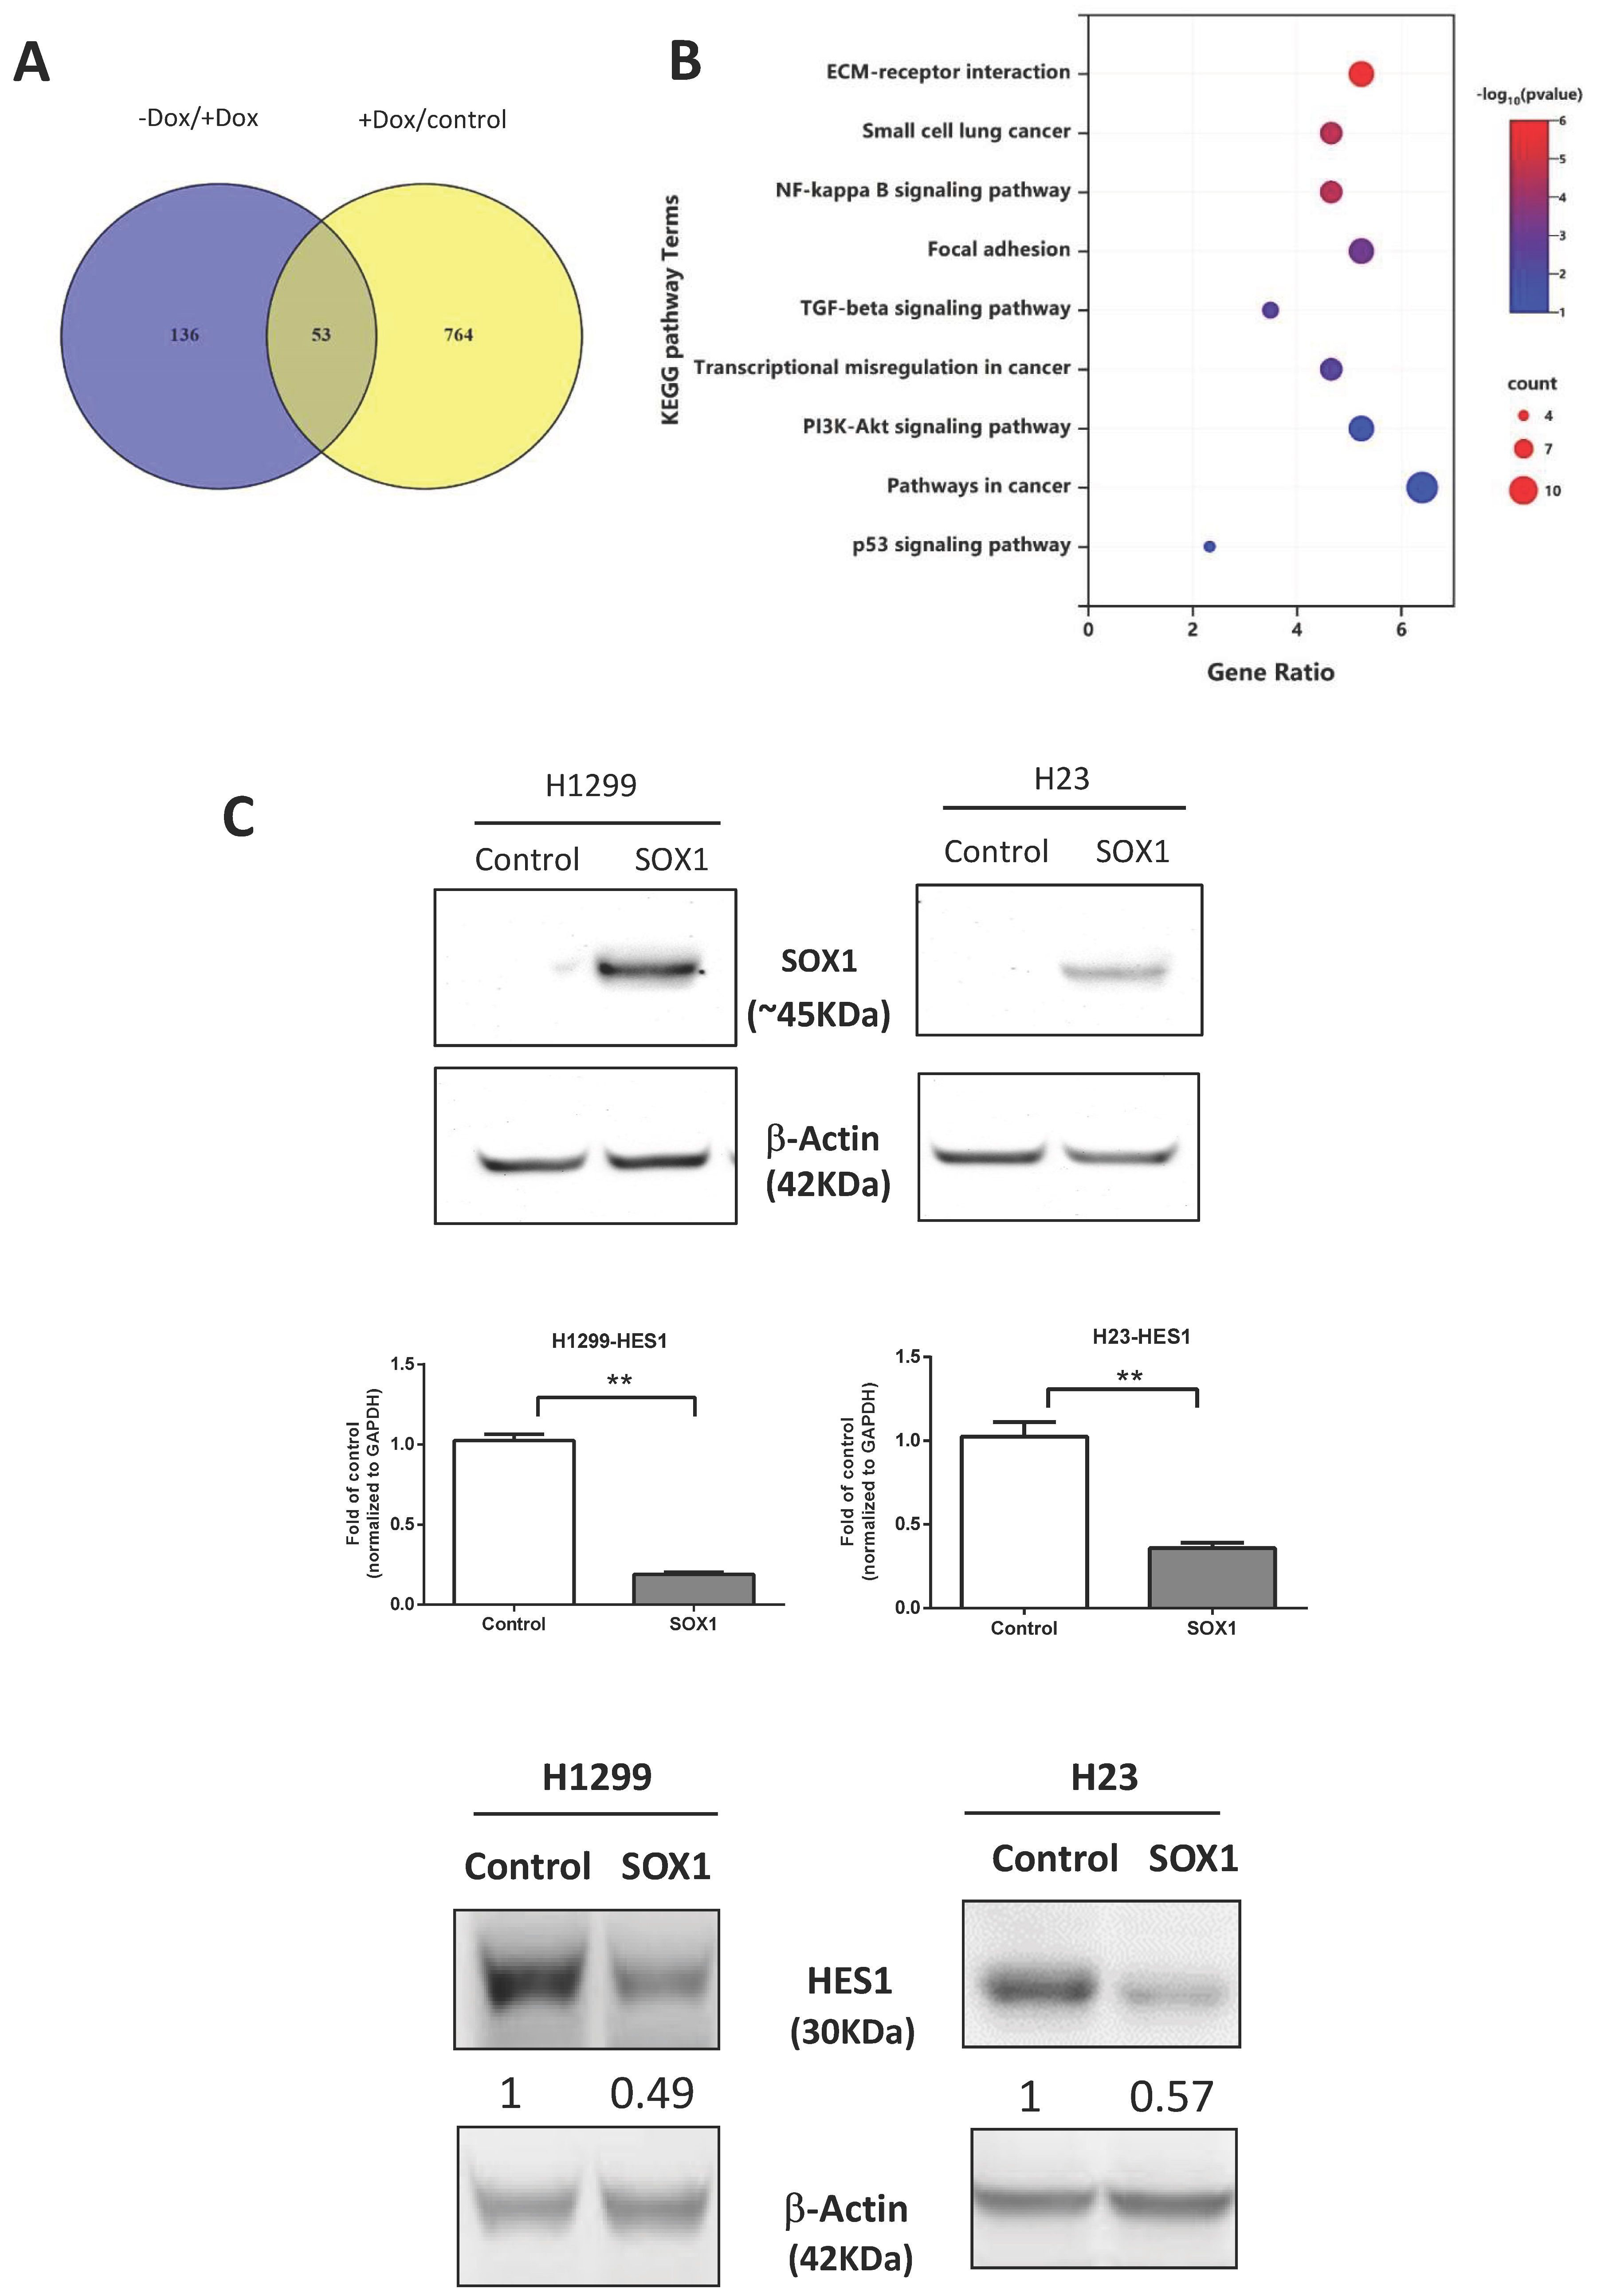
3.5. Signaling Pathways Affected by Inducible Expression of SOX1
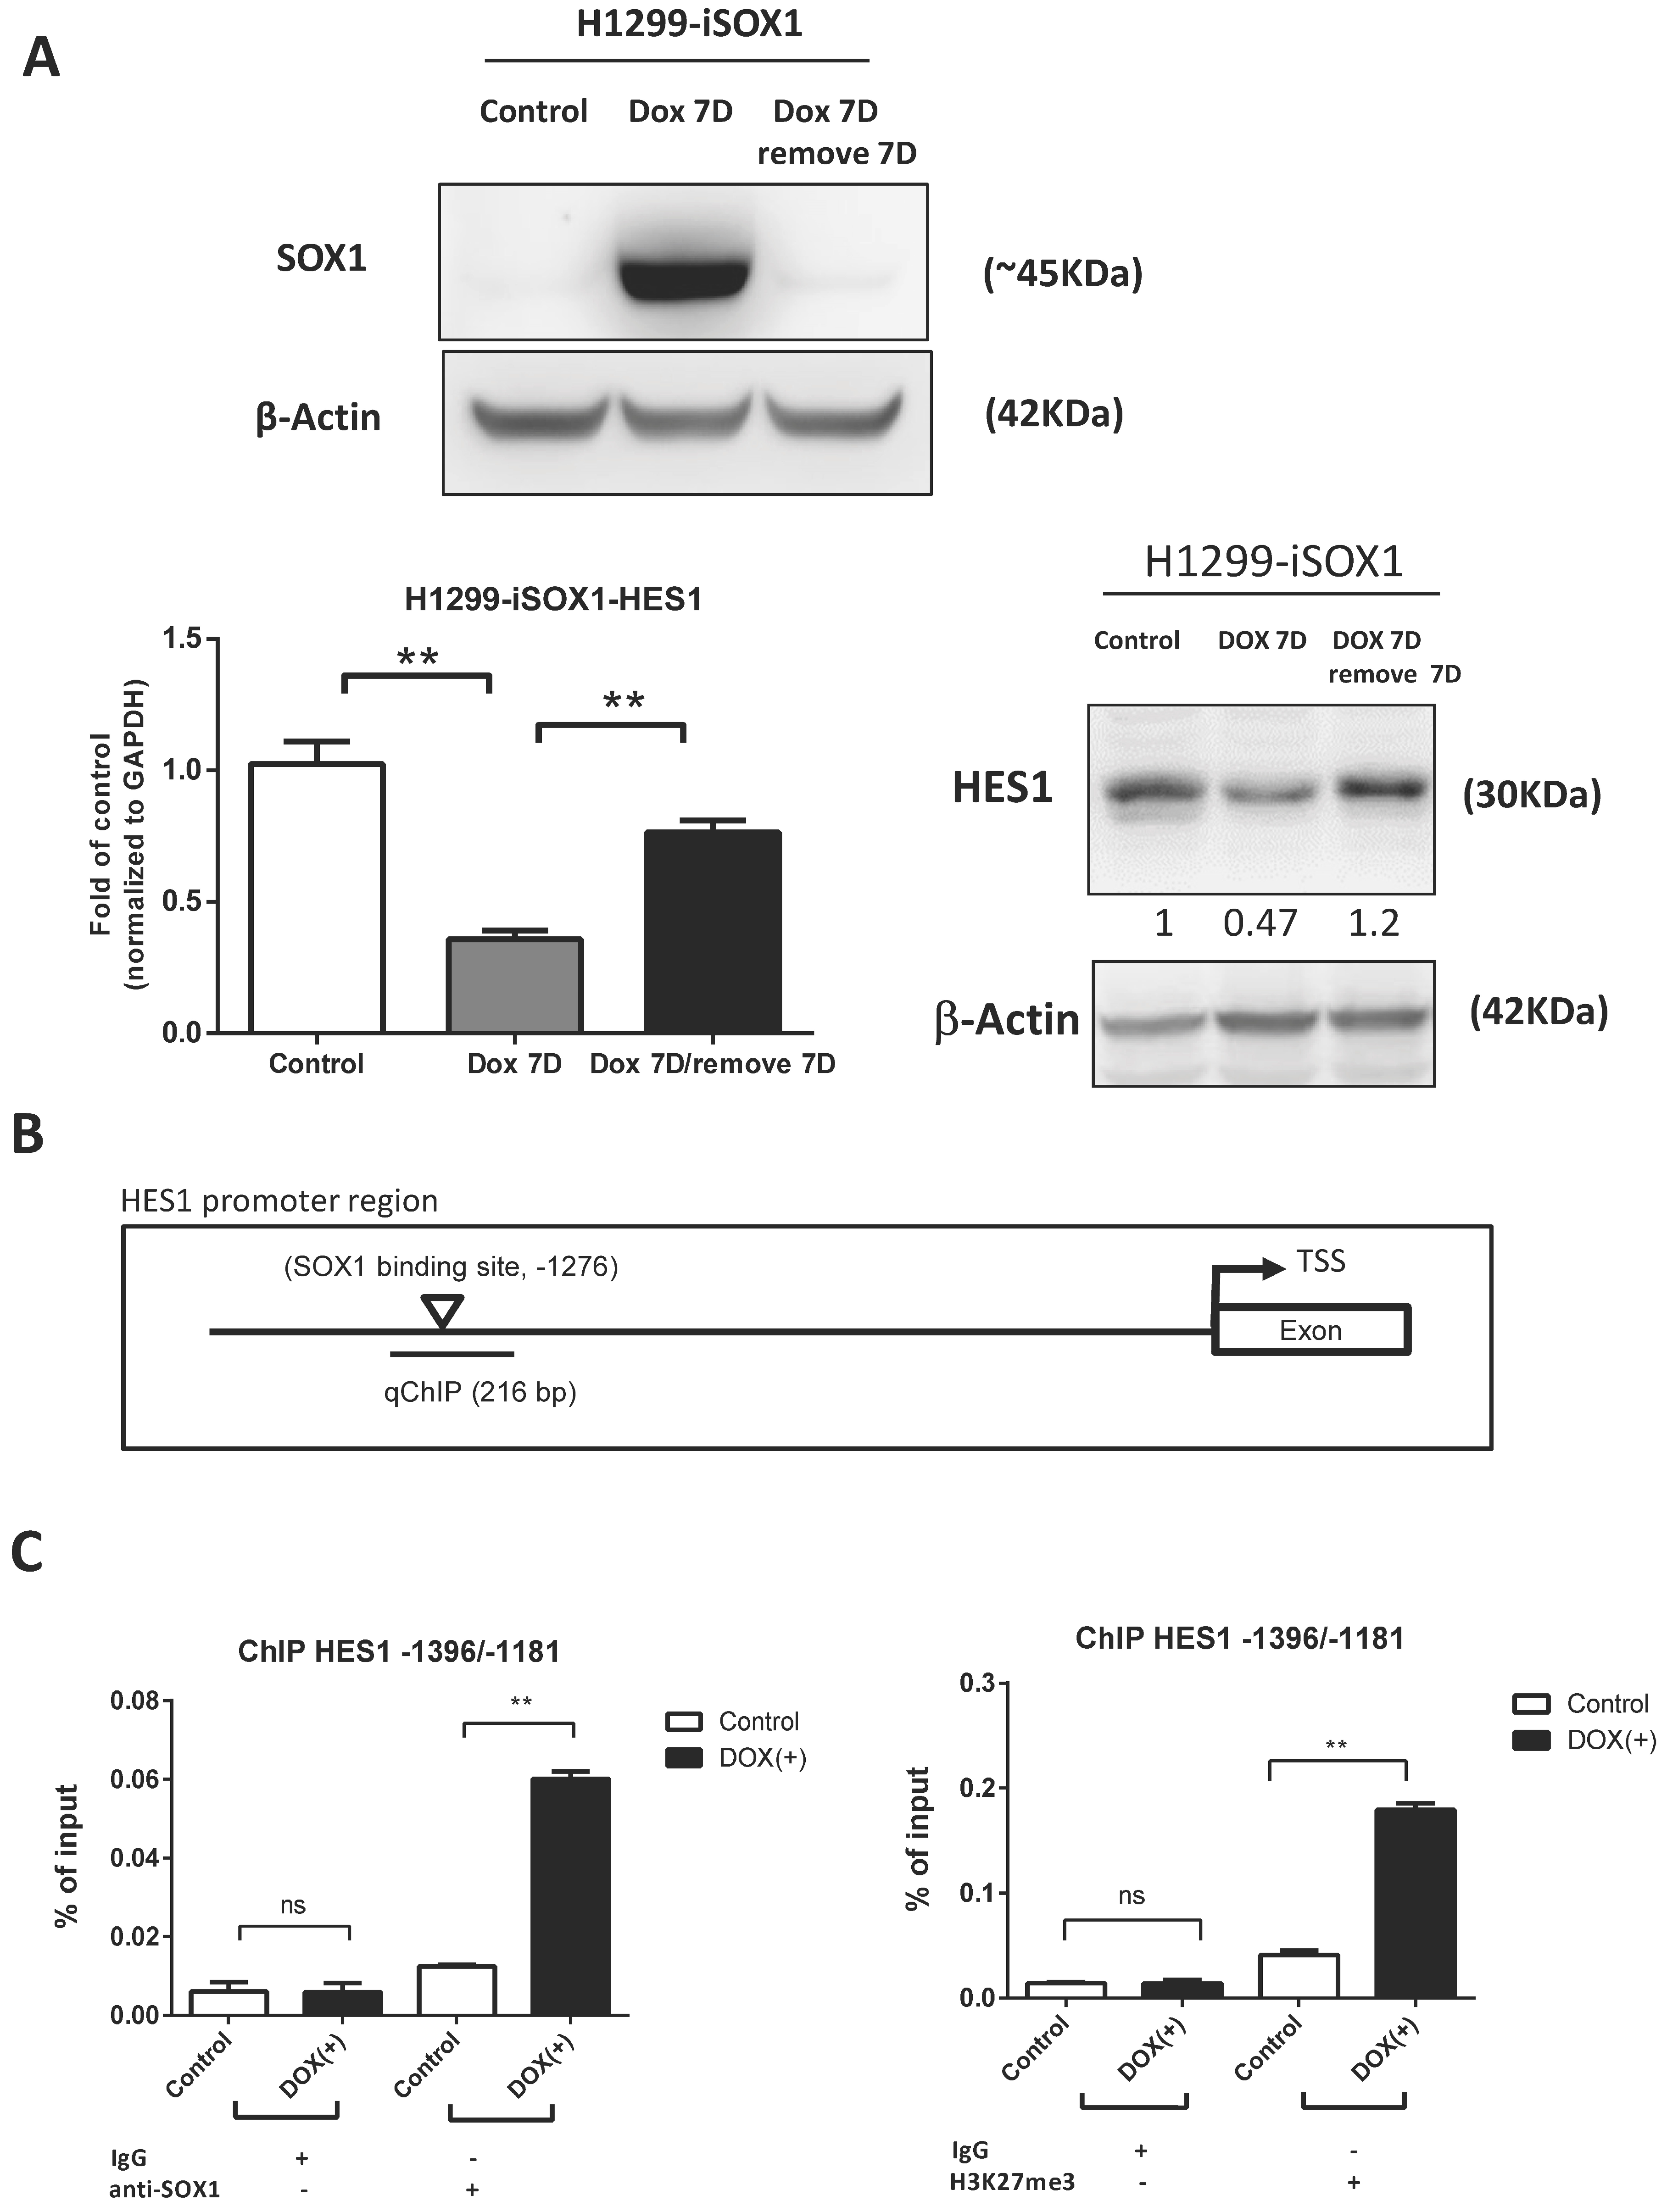
3.6. HES1 Is a Direct Target of SOX1
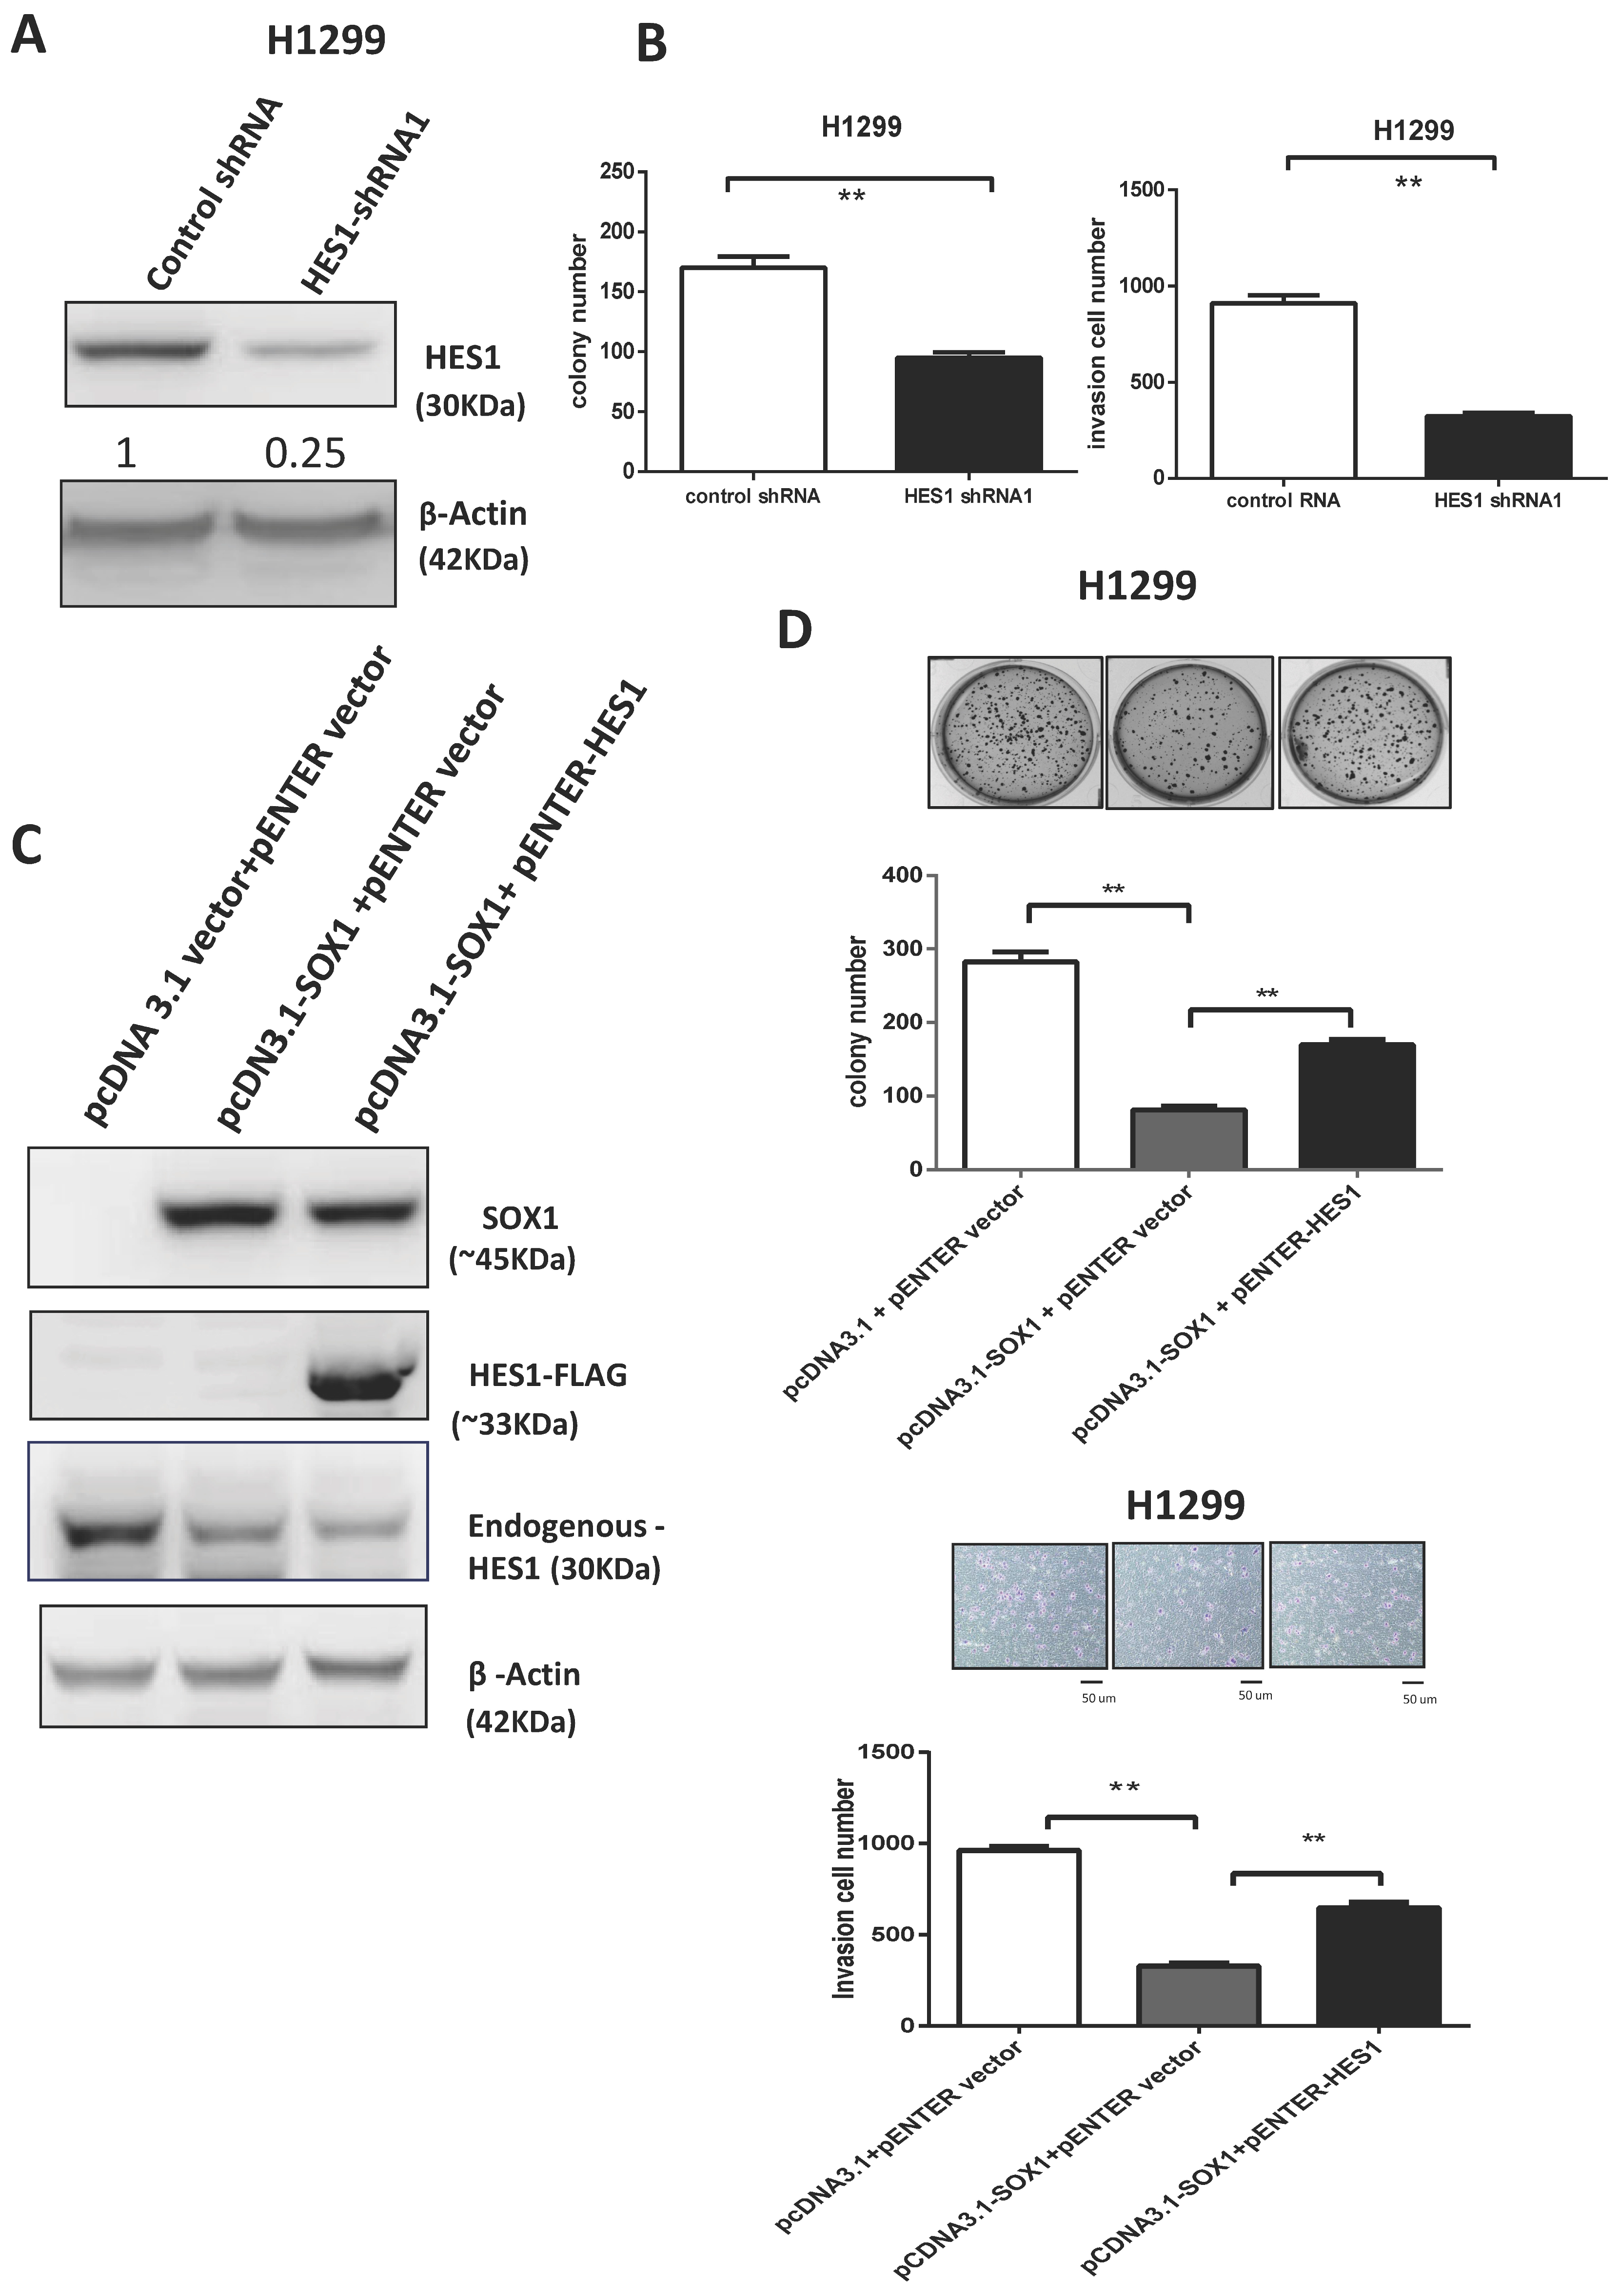
3.7. SOX1 Acts as a Tumor Suppressor by Repressing HES1 in Lung Cancer
4. Discussion
5. Conclusions
Supplementary Materials
Author Contributions
Funding
Institutional Review Board Statement
Informed Consent Statement
Data Availability Statement
Acknowledgments
Conflicts of Interest
Abbreviations
| SOX1 | sex-determining region Y (SRY)-box 1 |
| HES1 | hairy and enhancer of split 1 |
| NSCLC | non-small-cell lung cancer |
| LUAD | lung adenocarcinoma |
| LUSC | lung squamous cell carcinoma |
| EGFR | epidermal growth factor receptor |
| ALK | anaplastic lymphoma kinase |
| PD1 | programmed-death 1 |
| PDL1 | programmed-death ligand 1 |
| RT-PCR | reverse transcription polymerase chain reaction |
| MSP | methylation-specific PCR |
| CDH1 | E-cadherin |
| FN1 | fibronectin |
| CDH2 | N-cadherin |
| EMT | epithelial–mesenchymal transition |
| qRT-PCR | quantitative reverse transcription polymerase chain reaction |
| q-MSP | quantitative methylation-specific PCR |
| DAC | 5-aza-2′-deoxycytidine |
| TSA | trichostatin A |
| ChIP | chromatin immunoprecipitation |
References
- Sung, H.; Ferlay, J.; Siegel, R.L.; Laversanne, M.; Soerjomataram, I.; Jemal, A.; Bray, F. Global Cancer Statistics 2020: GLOBOCAN Estimates of Incidence and Mortality Worldwide for 36 Cancers in 185 Countries. CA Cancer J. Clin. 2021, 71, 209–249. [Google Scholar] [CrossRef] [PubMed]
- Wang, M.; Herbst, R.S.; Boshoff, C. Toward personalized treatment approaches for non-small-cell lung cancer. Nat. Med. 2021, 27, 1345–1356. [Google Scholar] [CrossRef] [PubMed]
- Ramalingam, S.S.; Vansteenkiste, J.; Planchard, D.; Cho, B.C.; Gray, J.E.; Ohe, Y.; Zhou, C.; Reungwetwattana, T.; Cheng, Y.; Chewaskulyong, B.; et al. Overall Survival with Osimertinib in Untreated, EGFR-Mutated Advanced NSCLC. N. Engl. J. Med. 2020, 382, 41–50. [Google Scholar] [CrossRef]
- Mok, T.; Camidge, D.R.; Gadgeel, S.M.; Rosell, R.; Dziadziuszko, R.; Kim, D.W.; Perol, M.; Ou, S.I.; Ahn, J.S.; Shaw, A.T.; et al. Updated overall survival and final progression-free survival data for patients with treatment-naive advanced ALK-positive non-small-cell lung cancer in the ALEX study. Ann. Oncol. 2020, 31, 1056–1064. [Google Scholar] [CrossRef]
- Gandhi, L.; Rodriguez-Abreu, D.; Gadgeel, S.; Esteban, E.; Felip, E.; De Angelis, F.; Domine, M.; Clingan, P.; Hochmair, M.J.; Powell, S.F.; et al. Pembrolizumab plus Chemotherapy in Metastatic Non-Small-Cell Lung Cancer. N. Engl. J. Med. 2018, 378, 2078–2092. [Google Scholar] [CrossRef] [PubMed]
- Paz-Ares, L.; Luft, A.; Vicente, D.; Tafreshi, A.; Gumus, M.; Mazieres, J.; Hermes, B.; Senler, F.C.; Csoszi, T.; Fulop, A.; et al. Pembrolizumab plus Chemotherapy for Squamous Non-Small-Cell Lung Cancer. N. Engl. J. Med. 2018, 379, 2040–2051. [Google Scholar] [CrossRef]
- West, H.; McCleod, M.; Hussein, M.; Morabito, A.; Rittmeyer, A.; Conter, H.J.; Kopp, H.G.; Daniel, D.; McCune, S.; Mekhail, T.; et al. Atezolizumab in combination with carboplatin plus nab-paclitaxel chemotherapy compared with chemotherapy alone as first-line treatment for metastatic non-squamous non-small-cell lung cancer (IMpower130): A multicentre, randomised, open-label, phase 3 trial. Lancet Oncol. 2019, 20, 924–937. [Google Scholar] [CrossRef]
- Nishio, M.; Barlesi, F.; West, H.; Ball, S.; Bordoni, R.; Cobo, M.; Longeras, P.D.; Goldschmidt, J., Jr.; Novello, S.; Orlandi, F.; et al. Atezolizumab Plus Chemotherapy for First-Line Treatment of Nonsquamous NSCLC: Results from the Randomized Phase 3 IMpower132 Trial. J. Thorac. Oncol. 2021, 16, 653–664. [Google Scholar] [CrossRef]
- Garon, E.B.; Hellmann, M.D.; Rizvi, N.A.; Carcereny, E.; Leighl, N.B.; Ahn, M.J.; Eder, J.P.; Balmanoukian, A.S.; Aggarwal, C.; Horn, L.; et al. Five-Year Overall Survival for Patients With Advanced Non–Small-Cell Lung Cancer Treated with Pembrolizumab: Results from the Phase I KEYNOTE-001 Study. J. Clin. Oncol. 2019, 37, 2518–2527. [Google Scholar] [CrossRef]
- Akiri, G.; Cherian, M.M.; Vijayakumar, S.; Liu, G.; Bafico, A.; Aaronson, S.A. Wnt pathway aberrations including autocrine Wnt activation occur at high frequency in human non-small-cell lung carcinoma. Oncogene 2009, 28, 2163–2172. [Google Scholar] [CrossRef]
- Chen, X.; Song, X.; Yue, W.; Chen, D.; Yu, J.; Yao, Z.; Zhang, L. Fibulin-5 inhibits Wnt/beta-catenin signaling in lung cancer. Oncotarget 2015, 6, 15022–15034. [Google Scholar] [CrossRef] [PubMed]
- Fang, L.; Cai, J.; Chen, B.; Wu, S.; Li, R.; Xu, X.; Yang, Y.; Guan, H.; Zhu, X.; Zhang, L.; et al. Aberrantly expressed miR-582-3p maintains lung cancer stem cell-like traits by activating Wnt/beta-catenin signalling. Nat. Commun. 2015, 6, 8640. [Google Scholar] [CrossRef] [PubMed]
- Krishnamurthy, N.; Kurzrock, R. Targeting the Wnt/beta-catenin pathway in cancer: Update on effectors and inhibitors. Cancer Treat. Rev. 2018, 62, 50–60. [Google Scholar] [CrossRef]
- Peng, Y.Y.; He, Y.H.; Chen, C.; Xu, T.; Li, L.; Ni, M.M.; Meng, X.M.; Huang, C.; Li, J. NLRC5 regulates cell proliferation, migration and invasion in hepatocellular carcinoma by targeting the Wnt/beta-catenin signaling pathway. Cancer Lett. 2016, 376, 10–21. [Google Scholar] [CrossRef]
- Zhu, J.; Jiang, Y.; Yang, X.; Wang, S.; Xie, C.; Li, X.; Li, Y.; Chen, Y.; Wang, X.; Meng, Y.; et al. Wnt/beta-catenin pathway mediates (-)-Epigallocatechin-3-gallate (EGCG) inhibition of lung cancer stem cells. Biochem. Biophys. Res. Commun. 2017, 482, 15–21. [Google Scholar] [CrossRef] [PubMed]
- Stewart, D.J. Wnt signaling pathway in non-small cell lung cancer. J. Natl. Cancer Inst. 2014, 106, djt356. [Google Scholar] [CrossRef]
- Stewart, D.J.; Chang, D.W.; Ye, Y.; Spitz, M.; Lu, C.; Shu, X.; Wampfler, J.A.; Marks, R.S.; Garces, Y.I.; Yang, P.; et al. Wnt signaling pathway pharmacogenetics in non-small cell lung cancer. Pharm. J. 2014, 14, 509–522. [Google Scholar] [CrossRef]
- Zhu, W.; Wang, H.; Zhu, D. Wnt/β-catenin signaling pathway in lung cancer. Med. Drug Discov. 2022, 13, 100113. [Google Scholar] [CrossRef]
- Gubbay, J.; Collignon, J.; Koopman, P.; Capel, B.; Economou, A.; Münsterberg, A.; Vivian, N.; Goodfellow, P.; Lovell-Badge, R. A gene mapping to the sex-determining region of the mouse Y chromosome is a member of a novel family of embryonically expressed genes. Nature 1990, 346, 245–250. [Google Scholar] [CrossRef]
- Chew, L.J.; Gallo, V. The Yin and Yang of Sox proteins: Activation and repression in development and disease. J. Neurosci. Res. 2009, 87, 3277–3287. [Google Scholar] [CrossRef]
- Aleman, A.; Adrien, L.; Lopez-Serra, L.; Cordon-Cardo, C.; Esteller, M.; Belbin, T.J.; Sanchez-Carbayo, M. Identification of DNA hypermethylation of SOX9 in association with bladder cancer progression using CpG microarrays. Br. J. Cancer 2008, 98, 466–473. [Google Scholar] [CrossRef]
- Guo, L.; Zhong, D.; Lau, S.; Liu, X.; Dong, X.Y.; Sun, X.; Yang, V.W.; Vertino, P.M.; Moreno, C.S.; Varma, V.; et al. Sox7 Is an independent checkpoint for beta-catenin function in prostate and colon epithelial cells. Mol. Cancer Res. MCR 2008, 6, 1421–1430. [Google Scholar] [CrossRef]
- Jia, Y.; Yang, Y.; Liu, S.; Herman, J.G.; Lu, F.; Guo, M. SOX17 antagonizes WNT/β-catenin signaling pathway in hepatocellular carcinoma. Epigenetics 2010, 5, 743–749. [Google Scholar] [CrossRef] [PubMed]
- Otsubo, T.; Akiyama, Y.; Yanagihara, K.; Yuasa, Y. SOX2 is frequently downregulated in gastric cancers and inhibits cell growth through cell-cycle arrest and apoptosis. Br. J. Cancer 2008, 98, 824–831. [Google Scholar] [CrossRef] [PubMed]
- Grimm, D.; Bauer, J.; Wise, P.; Krüger, M.; Simonsen, U.; Wehland, M.; Infanger, M.; Corydon, T.J. The role of SOX family members in solid tumours and metastasis. Semin. Cancer Biol. 2020, 67, 122–153. [Google Scholar] [CrossRef]
- Mathews, L.A.; Hurt, E.M.; Zhang, X.; Farrar, W.L. Epigenetic regulation of CpG promoter methylation in invasive prostate cancer cells. Mol. Cancer 2010, 9, 267. [Google Scholar] [CrossRef]
- Matheu, A.; Collado, M.; Wise, C.; Manterola, L.; Cekaite, L.; Tye, A.J.; Canamero, M.; Bujanda, L.; Schedl, A.; Cheah, K.S.; et al. Oncogenicity of the developmental transcription factor Sox9. Cancer Res. 2012, 72, 1301–1315. [Google Scholar] [CrossRef]
- Schepers, G.E.; Teasdale, R.D.; Koopman, P. Twenty pairs of sox: Extent, homology, and nomenclature of the mouse and human sox transcription factor gene families. Dev. Cell 2002, 3, 167–170. [Google Scholar] [CrossRef] [PubMed]
- Lin, Y.W.; Tsao, C.M.; Yu, P.N.; Shih, Y.L.; Lin, C.H.; Yan, M.D. SOX1 suppresses cell growth and invasion in cervical cancer. Gynecol. Oncol. 2013, 131, 174–181. [Google Scholar] [CrossRef]
- Buescher, M.; Hing, F.S.; Chia, W. Formation of neuroblasts in the embryonic central nervous system of Drosophila melanogaster is controlled by SoxNeuro. Development 2002, 129, 4193–4203. [Google Scholar] [CrossRef] [PubMed]
- Akiyama, H.; Lyons, J.P.; Mori-Akiyama, Y.; Yang, X.; Zhang, R.; Zhang, Z.; Deng, J.M.; Taketo, M.M.; Nakamura, T.; Behringer, R.R.; et al. Interactions between Sox9 and beta-catenin control chondrocyte differentiation. Genes Dev. 2004, 18, 1072–1087. [Google Scholar] [CrossRef] [PubMed]
- Sinner, D.; Kordich, J.J.; Spence, J.R.; Opoka, R.; Rankin, S.; Lin, S.C.; Jonatan, D.; Zorn, A.M.; Wells, J.M. Sox17 and Sox4 differentially regulate beta-catenin/T-cell factor activity and proliferation of colon carcinoma cells. Mol. Cell. Biol. 2007, 27, 7802–7815. [Google Scholar] [CrossRef] [PubMed]
- Lai, H.C.; Lin, Y.W.; Huang, T.H.; Yan, P.; Huang, R.L.; Wang, H.C.; Liu, J.; Chan, M.W.; Chu, T.Y.; Sun, C.A.; et al. Identification of novel DNA methylation markers in cervical cancer. Int. J. Cancer 2008, 123, 161–167. [Google Scholar] [CrossRef]
- Su, H.Y.; Lai, H.C.; Lin, Y.W.; Chou, Y.C.; Liu, C.Y.; Yu, M.H. An epigenetic marker panel for screening and prognostic prediction of ovarian cancer. Int. J. Cancer 2009, 124, 387–393. [Google Scholar] [CrossRef]
- Tsao, C.M.; Yan, M.D.; Shih, Y.L.; Yu, P.N.; Kuo, C.C.; Lin, W.C.; Li, H.J.; Lin, Y.W. SOX1 functions as a tumor suppressor by antagonizing the WNT/beta-catenin signaling pathway in hepatocellular carcinoma. Hepatology 2012, 56, 2277–2287. [Google Scholar] [CrossRef] [PubMed]
- Kontic, M.; Jovanovic, D.; Kern, I.; Nelson, H.H.; Bojic, S.; Ognjanovic, M.; Ognjanovic, S. Is hypermethylation of SOX1 gene an independent prognostic marker in surgically resected non-small cell lung cancer? J. Cancer Res. Ther. 2022, 18, 1692–1696. [Google Scholar] [CrossRef]
- Li, N.; Li, S. Epigenetic inactivation of SOX1 promotes cell migration in lung cancer. Tumor Biol. 2015, 36, 4603–4610. [Google Scholar] [CrossRef]
- Gao, F.; Zhang, Y.; Wang, S.; Liu, Y.; Zheng, L.; Yang, J.; Huang, W.; Ye, Y.; Luo, W.; Xiao, D. Hes1 is involved in the self-renewal and tumourigenicity of stem-like cancer cells in colon cancer. Sci. Rep. 2014, 4, 3963. [Google Scholar] [CrossRef]
- Li, C.; Wang, H.; Fang, H.; He, C.; Pei, Y.; Gai, X. FOXP3 facilitates the invasion and metastasis of non-small cell lung cancer cells through regulating VEGF, EMT and the Notch1/Hes1 pathway. Exp. Ther. Med. 2021, 22, 958. [Google Scholar] [CrossRef]
- Li, X.; Cao, Y.; Li, M.; Jin, F. Upregulation of HES1 Promotes Cell Proliferation and Invasion in Breast Cancer as a Prognosis Marker and Therapy Target via the AKT Pathway and EMT Process. J. Cancer 2018, 9, 757–766. [Google Scholar] [CrossRef]
- Liu, Z.H.; Dai, X.M.; Du, B. Hes1: A key role in stemness, metastasis and multidrug resistance. Cancer Biol. Ther. 2015, 16, 353–359. [Google Scholar] [CrossRef] [PubMed]
- Takahashi, H.; Sakakibara-Konishi, J.; Furuta, M.; Shoji, T.; Tsuji, K.; Morinaga, D.; Kikuchi, E.; Kikuchi, J.; Noguchi, T.; Hatanaka, K.C.; et al. Notch pathway regulates osimertinib drug-tolerant persistence in EGFR-mutated non-small-cell lung cancer. Cancer Sci. 2023, 114, 1635–1650. [Google Scholar] [CrossRef]
- Chandrashekar, D.S.; Bashel, B.; Balasubramanya, S.A.H.; Creighton, C.J.; Ponce-Rodriguez, I.; Chakravarthi, B.; Varambally, S. UALCAN: A Portal for Facilitating Tumor Subgroup Gene Expression and Survival Analyses. Neoplasia 2017, 19, 649–658. [Google Scholar] [CrossRef] [PubMed]
- Li, Y.; Ge, D.; Lu, C. The SMART App: An interactive web application for comprehensive DNA methylation analysis and visualization. Epigenet. Chromatin 2019, 12, 71. [Google Scholar] [CrossRef]
- Wu, T.H.; Chang, S.Y.; Shih, Y.L.; Huang, T.W.; Chang, H.; Lin, Y.W. Emetine Synergizes with Cisplatin to Enhance Anti-Cancer Efficacy against Lung Cancer Cells. Int. J. Mol. Sci. 2019, 20, 5914. [Google Scholar] [CrossRef] [PubMed]
- Chang, S.Y.; Kuo, C.C.; Wu, C.C.; Hsiao, C.W.; Hu, J.M.; Hsu, C.H.; Chou, Y.C.; Shih, Y.L.; Lin, Y.W. NKX6.1 hypermethylation predicts the outcome of stage II colorectal cancer patients undergoing chemotherapy. Genes Chromosom. Cancer 2018, 57, 268–277. [Google Scholar] [CrossRef]
- Liu, C.Y.; Chao, T.K.; Su, P.H.; Lee, H.Y.; Shih, Y.L.; Su, H.Y.; Chu, T.Y.; Yu, M.H.; Lin, Y.W.; Lai, H.C. Characterization of LMX-1A as a metastasis suppressor in cervical cancer. J. Pathol. 2009, 219, 222–231. [Google Scholar] [CrossRef]
- Li, H.J.; Yu, P.N.; Huang, K.Y.; Su, H.Y.; Hsiao, T.H.; Chang, C.P.; Yu, M.H.; Lin, Y.W. NKX6.1 functions as a metastatic suppressor through epigenetic regulation of the epithelial-mesenchymal transition. Oncogene 2016, 35, 2266–2278. [Google Scholar] [CrossRef]
- Chung, H.H.; Lee, C.T.; Hu, J.M.; Chou, Y.C.; Lin, Y.W.; Shih, Y.L. NKX6.1 Represses Tumorigenesis, Metastasis, and Chemoresistance in Colorectal Cancer. Int. J. Mol. Sci. 2020, 21, 5106. [Google Scholar] [CrossRef] [PubMed]
- Sherman, B.T.; Hao, M.; Qiu, J.; Jiao, X.; Baseler, M.W.; Lane, H.C.; Imamichi, T.; Chang, W. DAVID: A web server for functional enrichment analysis and functional annotation of gene lists (2021 update). Nucleic Acids Res. 2022, 50, W216–W221. [Google Scholar] [CrossRef] [PubMed]
- Ye, X.; Weinberg, R.A. Epithelial-Mesenchymal Plasticity: A Central Regulator of Cancer Progression. Trends Cell Biol. 2015, 25, 675–686. [Google Scholar] [CrossRef] [PubMed]
- Guan, Z.; Zhang, J.; Wang, J.; Wang, H.; Zheng, F.; Peng, J.; Xu, Y.; Yan, M.; Liu, B.; Cui, B.; et al. SOX1 down-regulates beta-catenin and reverses malignant phenotype in nasopharyngeal carcinoma. Mol. Cancer 2014, 13, 257. [Google Scholar] [CrossRef] [PubMed]
- Kan, L.; Israsena, N.; Zhang, Z.; Hu, M.; Zhao, L.R.; Jalali, A.; Sahni, V.; Kessler, J.A. Sox1 acts through multiple independent pathways to promote neurogenesis. Dev. Biol. 2004, 269, 580–594. [Google Scholar] [CrossRef] [PubMed]
- Yuan, X.; Wu, H.; Xu, H.; Han, N.; Chu, Q.; Yu, S.; Chen, Y.; Wu, K. Meta-analysis reveals the correlation of Notch signaling with non-small cell lung cancer progression and prognosis. Sci. Rep. 2015, 5, 10338. [Google Scholar] [CrossRef] [PubMed]


Disclaimer/Publisher’s Note: The statements, opinions and data contained in all publications are solely those of the individual author(s) and contributor(s) and not of MDPI and/or the editor(s). MDPI and/or the editor(s) disclaim responsibility for any injury to people or property resulting from any ideas, methods, instructions or products referred to in the content. |
© 2023 by the authors. Licensee MDPI, Basel, Switzerland. This article is an open access article distributed under the terms and conditions of the Creative Commons Attribution (CC BY) license (https://creativecommons.org/licenses/by/4.0/).
Share and Cite
Chang, S.-Y.; Wu, T.-H.; Shih, Y.-L.; Chen, Y.-C.; Su, H.-Y.; Chian, C.-F.; Lin, Y.-W. SOX1 Functions as a Tumor Suppressor by Repressing HES1 in Lung Cancer. Cancers 2023, 15, 2207. https://doi.org/10.3390/cancers15082207
Chang S-Y, Wu T-H, Shih Y-L, Chen Y-C, Su H-Y, Chian C-F, Lin Y-W. SOX1 Functions as a Tumor Suppressor by Repressing HES1 in Lung Cancer. Cancers. 2023; 15(8):2207. https://doi.org/10.3390/cancers15082207
Chicago/Turabian StyleChang, Shan-Yueh, Ti-Hui Wu, Yu-Lueng Shih, Ying-Chieh Chen, Her-Young Su, Chih-Feng Chian, and Ya-Wen Lin. 2023. "SOX1 Functions as a Tumor Suppressor by Repressing HES1 in Lung Cancer" Cancers 15, no. 8: 2207. https://doi.org/10.3390/cancers15082207
APA StyleChang, S.-Y., Wu, T.-H., Shih, Y.-L., Chen, Y.-C., Su, H.-Y., Chian, C.-F., & Lin, Y.-W. (2023). SOX1 Functions as a Tumor Suppressor by Repressing HES1 in Lung Cancer. Cancers, 15(8), 2207. https://doi.org/10.3390/cancers15082207